 Open Access Article
Creative Commons Attribution 3.0 Unported Licence
Characterization of hydrated magnesium carbonate materials with synchrotron radiation-based scanning transmission X-ray spectromicroscopy†
Md
Thasfiquzzaman
*a,
Hoang
Nguyen
 b,
Tuomas
Mansikkala
 ac,
Marko
Huttula
 a,
Igor
Beinik
d,
Jörg
Schwenke
 d,
Karina
Thånell
d,
Adam P.
Hitchcock
d,
Karina
Thånell
d,
Adam P.
Hitchcock
 e,
Paivo
Kinnunen
 b and
Minna
Patanen
 *ac
*ac
aNano and Molecular Systems Research Unit, Faculty of Science, University of Oulu, P O Box 3000, 90014, Oulu, Finland. E-mail: md.thasfiquzzaman@oulu.fi; minna.patanen@oulu.fi
bFibre and Particle Engineering Research unit, Faculty of Technology, University of Oulu, P O Box 4300, 90014, Oulu, Finland
cBiocenter Oulu, University of Oulu, P O Box 5000, 90014, Oulu, Finland
dMAX IV Laboratory, Lund University, P O Box 118, 22100 Lund, Sweden
eChemistry and Chemical Biology, McMaster University, 1280 Main St W, Hamilton, Canada
First published on 8th May 2024
Abstract
Formation of hydrated magnesium carbonate (HMC) cement phases from the carbonation of brucite has been investigated using synchrotron radiation (SR) based scanning transmission X-ray microscopy (STXM) at Mg and O K-edges. HMC is formed from the reaction of brucite and sodium bicarbonate in water. The introduction of magnesium acetate as a ligand influences the characteristics of the resulting precipitates in an aqueous setting. Particularly, significant morphological development of HMC phases and the complete carbonation of brucite with the longest reaction time are observed. The analysis successfully distinguishes various HMC phases, including nesquehonite, dypingite, giorgiosite, and an undefined phase, shedding light on the structural and chemical differences of formed HMCs. Notably, there is a transformation in HMC formation when magnesium acetate is introduced, leading to the creation of agglomerates that weave together into an interconnected network with a dense microstructure, a key factor in enhancing cohesive performance for HMC cement. We demonstrate here that, owing to simultaneous microscopic and X-ray absorption near edge structure (XANES) spectroscopic observations with STXM-XANES, different HMC phases can be resolved and a comprehensive investigation of their interconnections studied, proving STXM-XANES to be a powerful tool for studies of cementitious materials. We observed a strong orientation effect, where the relative angle between the crystal axis and polarization vector of X-rays affects the observed XANES spectrum. The report also discusses the challenges and future prospects of synchrotron radiation-based STXM-XANES in studying HMC materials and their pivotal role in the carbonation process of Mg-based cements, paving the way for innovative and sustainable construction materials.
1 Introduction
Global construction materials industry heavily relies on Portland cement (PC) for infrastructures. The low production costs, availability of raw materials and the durability across a wide range of applications makes PC a dominant choice in construction industry.1 However, PC contributes approximately 5–8%2 of global CO2 emissions. The search for an alternative low carbon cement material to replace PC is ongoing with the consensus that no single solution can address this critical issue.3 A promising alternative to PC identified to reach negative carbon footprint is carbonated cement based on MgO. Mineral carbonation is one of the promising ways of reducing CO2.Portland cement is a calcium based binder4 that requires high calcination temperatures5 during its production, and releases high amounts of unavoidable CO2 due to the calcite feedstock which is calcined releasing carbon dioxide gas through the chemical reaction [CaCO3 → CaO (solid) + CO2 (gas)]. In contrast, MgO cement can be sourced from CO2-free magnesium silicate minerals or from desalination brines without raw-material-related CO2 emissions. Besides, the enhanced durability due to high resistance to aggressive environments of some magnesia-based cements6 and the ability of permanently storing CO25 in magnesite motivates the development of MgO-based cements and concretes.
Brucite [Mg(OH)2] is a hydration product of MgO and known as a significant intermediate material phase prior to its carbonation.4 Hydrated magnesium carbonates (HMCs, approximate linear formula xMgCO3·yMg(OH)2·zH2O) can be formed from the reaction of brucite with a carbonate source in aqueous solution. The carbonate source can be for example sodium bicarbonate. The brucite is present as micron-sized particles, and the yield of reaction is significantly lowered by a surface passivating nesquehonite (MgCO3·3H2O) layer that precipitates on the surface of Mg(OH)2 and thus blocks further reaction of the raw materials.4,7 One way to make the reaction more efficient is to add magnesium acetate into the suspension, as it prevents the formation of the surface passivating layer due to a synergistic effect between Mg-acetate and carbonates. Several studies show that Mg-acetate can contribute significantly to enhanced carbonation of brucite and the structural development of HMCs. Dung et al.6 discovered an improved structure of 10 μm nesquehonite crystals in presence of Mg-acetate ligand, alongside an increased carbonation degrees of brucite, as evidenced by employment of lab-based X-Ray Diffraction (XRD), Thermogravimetric Analysis (TGA) and Scanning Electron Microscopy (SEM). Mg-acetate can also enhance the hydration of MgO leading to the formation of low-crystalline Mg(OH)2.8,9 A recent study on HMC materials carried out by Nguyen et al.4 revealed that Mg-acetate can increase the kinetics of brucite carbonation and alter the formation of HMC phases. The HMC precipitates agglomerate leading to the formation of an interconnected network which improves the binding properties and strength of HMC cement.5 However, the mechanism of these phenomena and the interaction of Mg-acetate ligand with HMCs needs to be understood better in order to optimise conditions for durable and strong products.
A number of studies4,6,10 investigated the crystallization and transformation behavior of HMC materials in various aqueous environments, mostly performed with lab-based methods. It is possible to differentiate the chemical species with traditional methods such as infrared spectroscopy and nuclear magnetic resonance but their spatial resolution is constrained to the scale of millimeter.11 Synchrotron radiation (SR) based methods, to that end, are more rarely used. Availability of SR facilities and highly competitive measurement time is certainly one of the most important limiting factors. However, new and upgraded facilities with suitable experimental end-stations for cement research have been coming up in recent years, and it is expected that use of SR facilities will become more and more common in cement and concrete research. A recent review by Quku et al. summarises the current status of cementitious systems research using lab and SR-based techniques.12 In our study of HMCs, we implemented SR-based Scanning Transmission X-ray microscopy (STXM) which is valuable due to its high spatial resolution, chemical sensitivity, and elemental specificity. Its ability to operate in the soft X-ray region enables non-destructive analysis of particles with micrometer thicknesses, providing crucial insights into the formation processes and structural characteristics of these compounds. Use of SR-based STXM offers the advantage of continuous tunability over a very wide energy range (in this case 500–1500 eV). In STXM measurements, an X-ray absorption near edge structure (XANES) spectra can be recorded at each pixel of the image. Depending on the chemical environment of an element, the X-ray absorption cross-section varies rapidly as a function of photon energy close to the core level absorption edge of that element. Thus, the chemistry of heterogeneous samples can be mapped with high spatial resolution (down to <10 nm).13,14
STXM-XANES has been used to study various cementitious materials earlier, in majority Ca-based systems for example calcium silicates,15–20 ancient concrete specimens21 and Limestone Calcined Clay Cement (LC3).12 One of the advantages of STXM is the possibility to study wet samples. Monteiro et al. have conducted a comprehensive work on green cements, and they have for example carried out soft X-ray imaging of aqueous cementitious solutions, following in situ formation of different phases.16 They also utilized Ca L-edge and C and Si K-edge STXM-XANES to study the properties of calcium silicate hydrate (C–S–H) particles when exposed to ambient air. Magnesium K-edge XANES has been extensively reported in various Mg-based minerals and carbonates.22–25 Although Mg K-edge XANES is very sensitive to the chemical environment and coordination of the absorbing Mg atom, the current available literature is limited when it comes to STXM-XANES studies. As for MgO-based binders, the formation of MgO from the dehydration of Mg(OH)2 was studied by Yoshida et al.22 using Mg K-edge XANES at the UVSOR synchrotron in Japan. Their analysis based on the simulation of XANES spectra was able to evaluate the composition of both MgO and Mg(OH)2 which revealed that MgO crystallites start to form at the surface and then propagate to the inside.
In our study we demonstrate how HMC materials can be studied with STXM combined with recording of soft X-ray XANES spectra. We provide a brief account on this powerful combination of STXM and XANES, STXM-XANES or soft X-ray spectromicroscopy, and how it can be utilized to explore the formation of multiple HMC phases and tracking their transformations across different time intervals. A comparative analysis in terms of the presence and absence of Mg-acetate ligand in the reaction is presented.
2 Materials and methods
2.1 Synthesis of hydrated magnesium carbonates
The synthesis of hydrated magnesium carbonates is described in detail by Nguyen et al.4 and only a short description is given here. The raw materials and their quantities used during reaction are summarized in Table 1. Brucite (VWR Finland, purity 99.9%, CAS number: 1309-42-8) and NaHCO3 (Sigma-Aldrich, purity ≥99.5%, CAS number: 144-55-8) were mixed in dry condition at a fixed molar ratio of 1 and subsequently dissolved in deionized water. Magnesium acetate solution of 1 M was prepared by dissolving Mg-acetate tetrahydrate [(CH3COO)2Mg·4H2O; Sigma-Aldrich, purity ≥99%, CAS number: 16674-78-5] in deionized water. The solution was equilibrated at ambient condition for 24 hours prior to its use. The ratio of liquid to solid was set at 7![[thin space (1/6-em)]](https://www.rsc.org/images/entities/char_2009.gif) :
:![[thin space (1/6-em)]](https://www.rsc.org/images/entities/char_2009.gif) 1 to ensure adequate dissolution and carbonation of brucite. The suspension was then sealed within plastic containers and a magnetic capsule was used for stirring the solution at a speed of 150–200 rpm for half an hour. The samples were collected after 1, 7, and 28 days of reaction through a vacuum filtration process using a 10-μm filter while hydration was stopped using isopropanol. Diethyl ether was used to wash isopropanol from the samples. Solid samples were then dried at 40 °C for 2 hours and then ca. 24 hours at room temperature to remove any leftover solvent and then preserved in plastic containers for further analysis.
1 to ensure adequate dissolution and carbonation of brucite. The suspension was then sealed within plastic containers and a magnetic capsule was used for stirring the solution at a speed of 150–200 rpm for half an hour. The samples were collected after 1, 7, and 28 days of reaction through a vacuum filtration process using a 10-μm filter while hydration was stopped using isopropanol. Diethyl ether was used to wash isopropanol from the samples. Solid samples were then dried at 40 °C for 2 hours and then ca. 24 hours at room temperature to remove any leftover solvent and then preserved in plastic containers for further analysis.
| Sample names | Brucite (g) | NaHCO3 (g) | Water (ml) | 1 M Mg-acetate (ml) |
|---|---|---|---|---|
| Water | 2.9 | 4.2 | 50 | — |
| Mg-acetate | — | 50 |
2.2 STXM-XANES experiments
STXM experiments were conducted at SoftiMAX beamline26 at MAX IV SR facility, Sweden. The experiment was carried out in room-temperature and in vacuum environment, but in principle the STXM chamber of SoftiMAX can also be back-filled with gases and host different sample environments. Horizontally polarized synchrotron radiation produced by an elliptically polarising APPLE-II type undulator was monochromatised with a plane grating monochromator and focused on the sample with a Fresnel zone plate. X-ray photons transmitted through the samples were converted to visible photons by a phosphor (P43) which were then detected in single event counting mode by a photomultiplier tube (Hamamatsu H3164-10, Hamamatsu Photonics, Japan). The zone plate focused spot, and thus the spatial resolution, was approximately 50 nm in diameter.The STXM-XANES experiment involves acquiring an x–y raster-scanned image of the sample at several different photon energies. A set of raster scanned images across a certain core level edge form an energy stack. In this work, we collected energy stacks at Mg K-edge, with an energy range of 1297–1342 eV and at O K-edge covering a range of 527–559 eV. The spectral energy resolution of the beamline is around 0.05 eV for O K-edge, but for the Mg K-edge, it is closer to 0.1 eV. We used a varying energy step size across the energy range, utilising the smallest step size of 0.25 eV (O K-edge) and 0.5 eV (Mg K-edge), in the range of main spectral features. The signal collected from X-rays transmitted through sample particles I is converted to optical density (OD) using the Beer–Lambert law, OD = −ln(I/I0), where I0 is the signal recorded in an empty area devoid of sample, but including the membrane which supported the sample. All the XANES spectra presented in result section have been transformed to optical density, but for easier comparison they have been occasionally offset with respect to each other, thus the intensity of the spectrum does not reflect e.g. thickness variations of the samples. Energy calibration between STXM recordings has been carried out using the brucite spectrum, using its strongest and well-defined absorption peak which has been set at 1313.1 eV. This energy position has been obtained by linear interpolation between energy calibrations performed for metallic Cu L3-edge (933.7 eV27) and Al K-edge of corundrum (1567.4 eV28). The obtained value for brucite is in line with previously reported spectrum by Yoshida et al.22 The O K-edge spectral energy scales were calibrated by setting the signal in the I0 spectrum (measured through the Si3N4 window) to 530.8 eV, the O 1s → π* peak of O2(g),29 since O2 is leaked into the first mirror tank to reduce carbon build-up on the optics. We note this results in a position of the first peak in the O 1s spectrum of brucite occurring at 533.5 eV, as opposed to the value of 532.1 eV reported from electron energy loss near edge spectra measured in a transmission electron microscope.30
For STXM measurements, synthesized HMC powder samples were mounted on the 100 nm thick Si3N4 membranes in two different ways: (1) drop-casting a diethyl ether suspension and (2) sprinkling solid powder directly on the membranes, right before the experiment to prevent the exposure to CO2 in air. These two methods were tested in order to find out if one or the other technique would make the particles stick better on the membrane, as they easily pinged off during the measurement. There was no significant difference between the applied methods. The majority of the measurements were done on powder directly applied on membrane.
3 Data analysis
aXis2000 software31 was used for data visualization and analysis. The energy stacks were aligned using an algorithm written for aXis2000 by Jacobsen and converted to optical density using transmitted intensity I0 from the area devoid of sample of the Si3N4 membrane. There were occasional problems with the scanning stage of the STXM setup where the fine motors did not move properly, which generated lines of constant intensity across the image. These were removed by replacing the invalid line with the average of the two neighboring lines. Additionally, certain cases exhibited a “shaking” problem associated with the scanner, leading to images where very fine needle-like crystals appear to have a curly shape. These images are indicated in the following sections and no attempt was made to correct them by any image analysis. We present X-ray absorption spectra of different regions of interest which were extracted from the recorded STXM energy stacks. In order to highlight different HMC phases present in the samples, color composites were generated from phase component maps derived by fitting reference spectra to each pixel of the image using the singular value decomposition (SVD) approach. Red, green and blue color was assigned to each pixel according to the weight of the reference spectra in the fit. In case where only two components were fitted, we opted to use red color for brucite-type of spectrum and light blue color (combination of blue and green) to indicate HMC phase. This provided a clearer contrast and avoided the use of red-green color combination to ensure better accessibility. The peak fitting of XANES spectra were performed using OriginPro 2022b software (OriginLab, MA, USA). The non-linear peak fitting, which involved the use of a peak analyser with subsequent baseline correction, was carried through a second derivative (zeros) method that fixed the anchor points and baseline. A Lorentzian peak fitting function was used to fit the peak while opting for local maximum methods during peak findings. The fitting parameters were fixed and released for an automatic parameters initialization and the iteration was performed continuously until the fit converged.4 Results
This section describes a detailed analysis of STXM imaging conducted on HMC powder samples. Magnesium K-edge XANES spectroscopy was used to track the different phases of HMCs because of its strong dependency on the local environment of absorbing atom via multiple scattering (MS) effects and sensitivity to electronegativity.32 Mg K-edge XANES spectra, following the principles of MS theory, can be divided into a full multiple scattering (FMS) region with an energy range of 15 eV (1306 eV to 1321 eV)33 above the first near edge peak and an intermediate multiple scattering (IMS) region, that covers an extended range of energy from FMS till the post edge region (1360 eV or larger).34 The prominent spectral features in the near edge region are mainly determined by the local structure of Mg, and thus we concentrate on this spectral region in our study.4.1 Brucite reference XANES at Mg and O K-edges
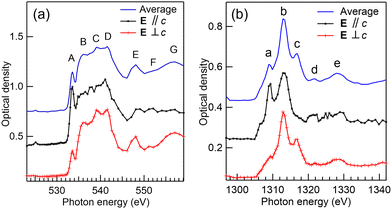
Fig. 1(a) and (b) present the XANES spectra of pure brucite at the O and Mg K-edges, respectively. The region of interest (ROI) from which the spectra have been extracted can be found in the ESI,† Fig. S1. The O K-edge XANES spectrum of brucite has been studied in detail both experimentally and theoretically by van Aken et al.30 They used crystal orientation dependent electron energy loss spectroscopy (EELS) in low scattering angles to be sensitive only to dipole transitions and interpreted the results using XANES calculations. Since our sample consists of fine powder with small crystals located at random orientations, depending on the ROI selected from the measured energy stack, we probe different angles between the crystallographic c axis and the polarization vector of linearly polarised light E. This is highlighted in Fig. 1(a), where spectra selected from two different ROIs match with the orientation-dependent spectra by van Aken et al., having the momentum transfer q either parallel or perpendicular to c. The labelling of spectral features (A–G) follow the labelling by van Aken et al.30 The peaks originate from the transitions to excited states with O p symmetry mixed with Mg 3s and 3p and H 1s orbitals. Our spectrum also shows a similar tiny peak at ∼525 eV which van Aken et al. found at 524 eV and assigned as minor chemical impurity. The origin of the peak remains unclear.In brucite structure, the OH-groups are aligned parallel to c, and opposing OH-groups separate the octahedral sheets. Thus, the parallel orientation of E vector wrt. c can emphasize their spectral contributions, and it has been shown that these groups contribute especially for features D and F.30
The same regions were recorded at the Mg K-edge. Orientation dependent spectra are presented in Fig. 1(b) together with an average spectrum, obtained by averaging the spectrum over a large area (approximately 3 × 2 μm2) of crystals. The Mg K-edge spectrum shows a strong absorption peak labelled as b at 1313.1 eV photon energy in near edge region alongside two smaller absorption peaks a and c, at 1308.9 and 1316.9 eV, respectively, as found from Lorentzian fitting. This triplet feature is common for samples with 6-fold coordinated Mg.23,24,35 The strongest middle peak b of the triplet has been associated with scattering from the first oxygen shell, the others mainly resulting from multiple scattering and higher distances.24 Peak a and its shoulder towards the lower photon energies are especially marked in the parallel orientation spectrum, whereas peak c is much stronger in the spectrum with perpendicular orientation. Vespa et al.24 compared XANES spectra of Mg-containing minerals and reported feature d, at 1321.7 eV from post edge region, present only in brucite and talc [Mg3Si4O10(OH)2]. They performed ab initio XANES modelling for talc, but were not able to reproduce this feature by calculations extending to 10 Å cluster size, indicating that it might be due to the multiple scattering at higher distances. Although, the parallel spectrum of brucite is noisier than the perpendicular spectrum, peak d seems to be stronger when E is parallel to c than in the perpendicular condition. A broad peak e at post edge region has also been observed in many other Mg based minerals, and seems to reflect multiple scattering in intermediate distances.34,36
The strong orientational dependence of the relative intensities of XANES features of brucite highlights that one needs to take care when interpreting the STXM-XANES results. Ideally, in order to avoid confusion between different crystal phases or different orientations of the same phase, the polarization of the SR light should be changed or the sample can be rotated and the spectromicroscopy performed with two different relative orientations.
4.2 HMC formation after 1-day reaction time in water
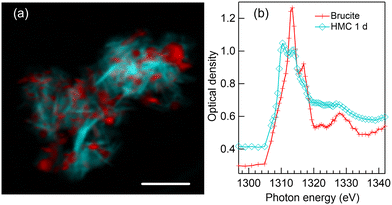
Fig. 2(a) presents a color composite map of two component maps derived from an SVD fit of a Mg K-edge stack recorded from the precipitates formed after one day reaction time in water. The specimen shows two intertwined components: thin elongated structures (light blue) interpreted as HMC and small grains (red) which are brucite. The magnesium K-edge XANES spectra which were used to fit HMC and brucite areas in Fig. 2(a) are shown in Fig. 2(b). The fitted spectra are averages of several positions within the precipitates to avoid orientation dependency. The red spectrum clearly resembles that of pure brucite (Fig. 1(b)). The previous XRD study by Nguyen et al.4 indicated that reaction time of 24 hours leaves some of the brucite unreacted, so the interpretation is straightforward. The HMC spectrum (light blue with diamonds in Fig. 2(b)) is clearly different from brucite, and it exhibits two prominent peaks in the near edge region: a stronger one at 1310.4 eV followed by a less intense peak at 1313.6 eV. There is a shoulder around 1317 eV within the post absorption feature. The XRD results4 showed presence of two phases of HMC after reaction time of 1 day, nesquehonite and dypingite [4MgCO3·Mg(OH)2·5H2O37].Based on the morphology of HMC, which is in agreement with small platelets observed using SEM,4,6 we interpret the HMC in this precipitate to be in the form of dypingite. Our SEM imaging of this sample (shown in Fig. S2 of ESI†) resembling thin flakes. The XANES spectrum does not fully agree with the dypingite spectrum reported previously by Farges et al.,23 as the relative intensity of the first peak at 1310.4 eV is stronger than reported by them. However, in both cases, the near edge region seems to consist of two peaks with a shoulder towards higher energies, which is stronger in the spectrum reported by Farges et al. compared to ours. The energy difference between the main absorption feature and the far post-edge peak at around 1328 eV is similar in both cases. The reason for the difference between the dypingite spectrum reported here and by Farges et al. remains elusive, but we note that Farges et al. recorded the spectra using Mg Kα fluorescence yield while our spectra are recorded in transmission mode. Also, the origin of the sample (e.g. synthesis) might affect the results, however, we do not have information about the origin of the sample by Farges et al. It is interesting to note that our spectrum reflects more the hydromagnesite spectrum recorded also by Farges et al.23 Hydromagnesite spectrum has also been studied with a lower energy resolution by Finch et al.38 Dypingite is considered to have similar or identical short-range order as hydromagnesite, which also has platelet-like morphology.39,40 Thus, it can be expected that the XANES spectra of these phases are also very similar.
It is important to note that even if the analysis by SEM and XRD on similarly prepared sample4 found large nesquehonite crystals to be present among the precipitates, we were only able to locate dypingite-type of particles (three particles were imaged in total). This underlines the necessity of complementary techniques like SEM, XRD or e.g. infrared-based spectroscopic techniques to characterise the average (bulk) properties of the samples.
We also studied an HMC precipitate after 1 day reaction time at O K-edge, and the results are presented in Fig. 3. Since the X-ray absorption is strong at O K-edge, a small precipitate was selected for this recording. Still, the center of this precipitate showed a saturated spectrum (i.e. no transmission through that part of sample), and the O K-edge XANES spectrum shown in Fig. 3(b) is from the thinner part at the bottom edge of the precipitate shown in Fig. 3(a). Spectra recorded across the particle varied in terms of relative intensity of the spectral features, which we correlate to thickness effect. Thus the spectrum presented in Fig. 3(b) is believed to be representative of dypingite and clearly different from the brucite spectrum shown in Fig. 1(a). The spectrum resembles O K-edge XANES reported for carbonates with a typical sharp O 1s → π* resonance at 533.7 eV and a broad post edge O 1s → σ* feature starting from 535 eV.41 There is also a small pre-edge peak around 531 eV, whose origin is unknown. STXM measurements of this same particle were also performed at Mg K-edge before and after O K-edge recording. Both the spectra and morphology of the particle remain unchanged between the measurements, which indicates that the effects of radiation damage are small.
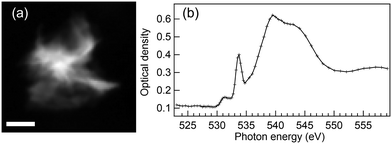 | ||
| Fig. 3 (a) Average STXM image of energies 533–534.8 eV and (b) O K-edge XANES spectrum of HMC precipitate formed after 1 day reaction time in water. Scale bar 800 nm. | ||
4.3 Improved HMC morphology after 1 day reaction with Mg-acetate
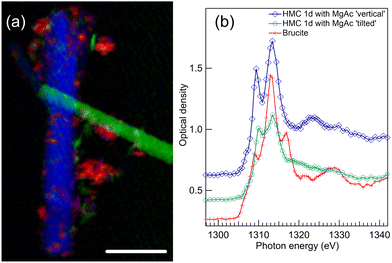
When compared to the reaction in water, the addition of Mg-acetate ligand significantly changes the morphology of HMC as realized from the STXM imaging of two long crystals (length ∼20 μm and diameter 1–2 μm), presented in Fig. 4(a). These two HMC crystals have different orientations wrt. SR polarization, and they thus have different spectra as shown in Fig. 4(b). The crystal depicted in green in Fig. 4(a) has an angle of approx. 25° wrt. E vector. Some residues of unreacted brucite are still present in the sample, shown in red in Fig. 4(a), and identified based on its typical spectrum shown with a red line with crosses in Fig. 4(b). The long crystals are nesquehonite (MgCO3·3H2O); similar needle like crystals were also reported in earlier studies.4,6The spectra of HMC crystals in Fig. 4(b) are in line with the nesquehonite XANES spectrum reported by Farges et al.23 Compared to dypingite spectrum, now the first peak at 1309.4 eV is less intense and the second peak at 1313.4 eV is strongest. There are small differences in the positions of those peaks and their relative intensity depending on the crystal orientation. In the post edge region, the crystal with the vertical orientation (blue spectrum with diamonds) has a clear peak at around 1324 eV which was also observed by Farges et al. However, this feature is missing from the spectrum of the tilted crystal (green line with spheres). The same characteristic is absent in another recorded crystal, which has an angle of approximately 60° wrt. the E vector (shown in Fig. S3 of ESI†). The absence of the broad peak serves as a reminder of how the XANES spectrum is influenced by the crystal's orientation, even when dealing with crystals of identical phases.
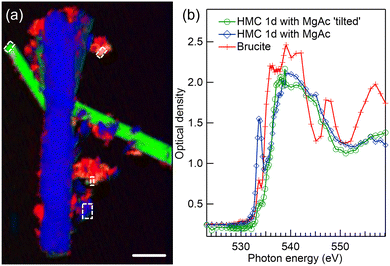
STXM spectromicroscopy of the same area as in Fig. 4(a) was also performed at O K-edge, as shown in Fig. 5. Here, the long crystals are too thick for a proper spectroscopic analysis since at energies of highest absorption the spectra are saturated, but the RGB spectral fitting algorithm was nevertheless able to separate the differently oriented crystals and brucite residues, as seen in Fig. 5(a).
A third elongated but thinner crystal becomes now evident in the left upper corner of the image, colored with green in the color composite map. We were able to extract non-saturated HMC spectra from the tip of this crystal and from a thin small precipitate on the right side of the long vertical crystal colored with blue. These regions are indicated with dashed rectangles in Fig. 5(a), and their spectra are presented Fig. 5(b) with green line with spheres (tilted crystal) and blue line with diamonds (small precipitate). Both HMC spectra are clearly different from brucite spectrum (red line with crosses) extracted from upper part of the image. There is an indication of the orientation dependence in the HMC spectra also here, as the first peak at around 533.7 eV is suppressed in the tilted crystal. We tentatively assign these HMC spectra to be orientation dependent spectra of nesquehonite. They differ from the dypingite spectrum shown in Fig. 3(b) as the small feature around 531 eV is now absent. The interpretation is not definitive since the ROI selected around the small blue precipitate is not from the well-defined long crystal typical for nesquehonite. The same region at Mg K-edge also showed a nesquehonite – type of spectrum, but indicated a mixture of orientations.
4.4 7 days of reaction time in water environment
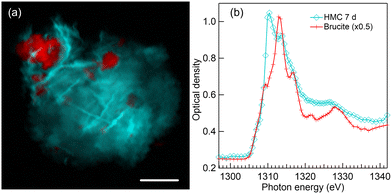
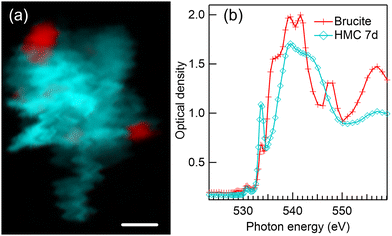
Fig. 6 presents a color composite map (a) and respective XANES spectra (b) of brucite and HMC derived from a Mg K-edge STXM stack of a precipitate formed after 7 days of reaction time in water. The formation of dypingite-type HMC is continued and brucite is still not fully reacted. Compared to 1 day reaction time (Fig. 2(a)), dypingite seems to be now in the form of larger flake like particles even though the morphology of dypingite is not that clear in this precipitate. This could be due to a higher degree of agglomeration making it difficult to identify the edges of each individual flake. The XANES analysis (Fig. 6(b)) reveals an intense first peak and a less intense second peak at 1310.2 eV and 1313.2 eV, respectively. The energy separation of 3 eV agrees fully with the fit of dypingite XANES in 1 day reaction time sample. Analysis of two more precipitates of this sample are presented in Fig. S4 of ESI.† In one of the precipitates, we were able to observe the edges of dypingite platelets. The intensity ratio of the XANES of first two peaks may slightly differ, but their energy difference remains always at about 3 eV and is clearly smaller than the peak separation in nesquehonite XANES spectrum (∼4 eV).STXM recording at O K-edge was carried out for another precipitate of 7 days reaction time sample as presented in Fig. 7. Similar agglomerate of dypingite-like HMC flakes (light blue) with some residual brucite (red) is observed in color composite map in Fig. 7(a). Here, the unfortunate “waviness” of the edges of the crystals is due to instabilities of the scanning stage in early commissioning beamtime. The XANES spectra presented in Fig. 7(b) matches with the spectra of brucite in Fig. 1(a) and dypingite in 1-day reaction time [Fig. 3(b)] samples. However, now the brucite sample also shows a pre edge peak at 531 eV, which could be due to the fact that it is difficult to avoid an overlap with HMC region when extracting the spectra. The Mg K-edge of the same precipitate is presented in Fig. S4 of ESI.†
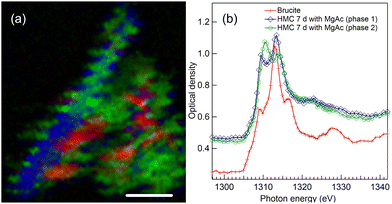
4.5 HMC formation after 7 days reaction time with Mg-acetate
Fig. 8 presents the results of an agglomerate of precipitate collected after 7-day of reaction in presence of Mg-acetate. The color composite map in Fig. 8(a) presents three identified components: unreacted brucite (red areas) and two HMC phases (green and blue). The longer needle like morphology and the XANES spectrum (as presented in Fig. 8(b) with blue line with diamonds) of the elongated crystal indicates the presence of nesquehonite. Also here, the instabilities of the scanning stage might have affected the observed morphology. The corresponding XANES fit indicates an energy difference of 3.8 eV (first less intense peak at 1309.5 eV and the intense second peak at 1313.3 eV), close to the 4 eV energy difference in the spectrum of nesquehonite crystals of 1-day reaction time sample with Mg-acetate (Fig. 4). We note that the post edge feature at around 1324 eV is very weak, in line with the earlier observation for tilted crystal.Another HMC phase alongside nesquehonite is present in this sample. The spectrum of the phase depicted with green color in Fig. 8(a) somewhat resembles dypingite, but there are some significant differences which make us believe that it can be a different new phase. The XANES spectral fit locates the two strong absorption features at around 1310.4 and 1313.9 eV, so that the 3.5 eV energy difference between the peaks matches neither with dypingite (3 eV) nor nesquehonite (4 eV). Furthermore, there is no flank after the second strong peak in contrast to dypingite, but a broad feature at around 1322 eV. Based on XRD and SEM data, Nguyen et al.4 reported the presence of giorgiosite phase in their sample after reaction time of 7 days with Mg-acetate. The phase was also observed by Ilango et al.9 in the acetate-containing brucite as the carbonate phase formed in this system. It is assumed that nesquehonite starts to convert to giorgiosite, which has been reported to form very thin needle-like crystals.4 However, this morphology is not evident in our studied precipitate, and prevents us to be conclusive about the phase of HMC in this sample. The XANES fit of this material phase has similarities with the HMC phase of 28 days Mg-acetate sample that will be discussed in Section 4.7.
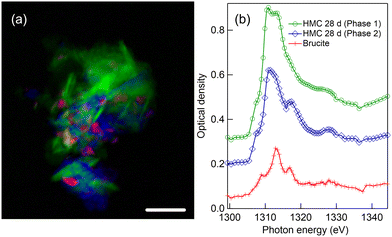
4.6 HMC formation after 28-day reaction time in water
Results for a precipitate formed after 28-day of reaction in water are presented in Fig. 9. Some unreacted brucite is still present in low amount as marked with red color in Fig. 9(a), identified by its familiar triplet XANES spectrum presented with red line with crosses in Fig. 9(b). HMC is in two different forms with green and blue color in the composite map displayed in Fig. 9(a). The morphology of phase colored with green suggests flakes with some clear edges and the corresponding XANES absorption features match with dypingite spectrum in 1- and 7-day reaction time samples. The other phase (blue) seems to be in form of smaller grains, intertwined with dypingite. The XANES spectrum of this precipitate [blue line with diamonds in Fig. 9(b)] shows two broad, asymmetric peaks with a separation of approximately 6 eV. There is also a clear third feature at around 1328 eV, 17 eV above the main absorption feature.Another precipitate (see Fig. S5 of ESI†) also showed this phase. We have not been able to find a XANES spectrum of HMCs from previous literature which would match this spectrum. We have considered if the XANES spectrum would be just from a dypingite crystal with a different orientation wrt. polarization vector, but this does not seem like a plausible explanation. In previous precipitates of 1- and 7-days reaction time, selecting different parts of dypingite region seems to affect the relative intensity of the main absorption peaks but no new peak at 1317 eV appears. Thus, this is considered as a separate HMC phase. It should be noted that a dypingite like phase with formula of [Mg5(CO3)4(OH)2·8H2O] has been reported,42 and it is still unclear at which conditions this phase forms. It can also be an amorphous transition phase, which would have been impossible to observe in previous work which utilised XRD.4
4.7 HMC formation after 28-day reaction time with Mg-acetate
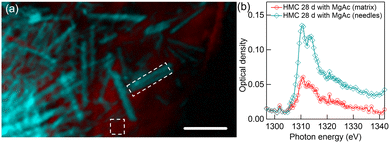
Mg K-edge STXM results for precipitates collected after the 28-day of reaction time in presence with Mg-acetate are shown in Fig. 10. The color composite map in Fig. 10(a) unveils a completely different morphology of the carbonated phase, very thin needles (light blue) embedded in a continuous-looking matrix (red). The color composite map is made by fitting a spectrum taken from matrix with very low absorption and a spectrum extracted from the bundle of needle-like structures so that thin needles are emphasized. The corresponding XANES spectrum of needles [light blue line with diamonds in Fig. 10(b)] is very similar to the HMC phase shown earlier with green color in 7 days reaction time precipitate in Fig. 8.The overall shape of the XANES spectrum of matrix is similar to the needles. Morphology of the HMC phase here, rod-like thin needles, strongly indicates that it is in the form of giorgiosite, a conclusion supported by the similarity of these smaller needles to those reported in prior research.4,6 The fits of the XANES spectra of thin needles give energies of 1310.4 and 1313.9 eV for the first two absorption peaks. There is no clear third peak in the far post-edge region. Overall, the spectra are in line with giorgiosite phase reported by Farges et al.23 Another set of precipitates consisting of thin needles with similar spectra is presented in the ESI† (see Fig. S6).
5 Discussion
Formation of hydrated magnesium carbonate is one of the promising ways of capturing CO2. In our study, HMCs are formed from the carbonation of brucite in water. Magnesium acetate was also added as hydration agent to increase the reaction rate. This addition potentially helps to block the formation of a surface passivating layer on brucite which hinders the reactivity of brucite. The implementation of advanced SR-based spectromicroscopic STXM-XANES method can contribute significantly in the development of carbonated magnesium cement by characterizing chemistry and morphology of starting and intermediate reaction materials to the end products.16 The final performance of end products or HMCs depend largely on the morphology, instead of their amount, as reported in several studies.6,43–45 Both the micro and nanostructure of HMC crystals with various morphologies can provide physical strength to cement paste due to their strong fibrous or elongated nature.65.1 XANES spectroscopy
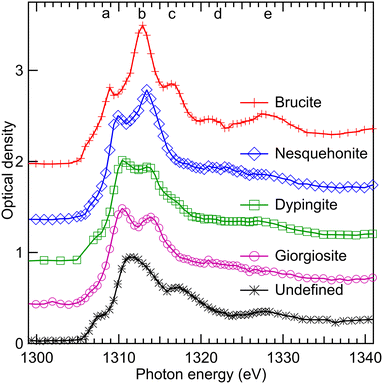
Our STXM-XANES analysis successfully distinguished the remaining precursor (brucite) and several HMC phases such as nesquehonite, dypingite and giorgiosite in the precipitates collected through a vacuum filtration process after 1, 7, and 28 days of reaction. Collection of observed Mg K-edge XANES spectra is presented in Fig. 11, where to improve statistics, HMC spectra are sums of same type of spectra from different measurements. This also reduces the orientational effects, as we showed using brucite (Fig. 1) and nesquehonite (Fig. 4 and 5) crystals that the relative angle between the crystal and light polarization axes can drastically change the observed spectrum. The unidentified phase observed in precipitates collected after 28-day reaction time in water is also presented Fig. 11. The interpretation of HMC XANES spectra is not straightforward, and a detailed analysis would require FMS simulations due to Mg K-edge XANES being very sensitive to electronegativity of the neighborhood of absorbing atom and its local coordination but also requiring a proper knowledge of longer range order (large cluster size in simulations).32,38 However, these very same properties makes XANES a powerful tool to differentiate HMC phases.A qualitative description of the spectra presented in Fig. 11 can be given using spectral features a–e observed for brucite as a reference. In nesquehonite, dypingite and giorgiosite phases, the main absorption feature clearly exhibits only two peaks, but dypingite has a clearer flank towards the feature c. The more hydrated HMCs, giorgiosite and dypingite, seems to have stronger peak a than peak b. FMS simulations by Cabaret et al. for monoclinic Mg-bearing mineral diopside showed that all the peaks from a–c as well as e are related to medium range order. Among HMCs, the feature d is only clearly visible in nesquehonite, especially in its spectrum with 90° angle between crystal axis and polarisation vector (Fig. 4(b)). The differences in nesquehonite in comparison to dypingite and giorgiosite can be understood from their different repeating units. Nesquehonite has a basis of MgCO3 units with 3 water molecules of hydration, while giorgiosite and dypingite have the structure [Mg5(CO3)4·(OH)2] with 5–6 water molecules of hydration. Nesquehonite exhibits a simple crystal structure33,46 where Mg ions are coordinated by six oxygen atoms to form infinite ribbons of MgO6 octahedra along the crystallographic b axis. These octahedra are connected to three CO3 groups, oriented along crystal axis c. The ribbons are interconnected by water molecules in a hydrogen bonding network.33 The information on crystal structure of giorgiosite and dypingite is scarce, which hinders e.g. FMS simulations. However, based on similarity of pair distribution functions, Yamamoto et al. concluded40 that dypingite has a similar crystal structure as hydromagnesite, which does not have network of hydrogen bonded water molecules in contrast to nesquehonite.33
In the unidentified phase, there seems to be a strong pre-peak before the feature a, and the peak b is clearly less intense than in other phases. However, the peak c is again stronger, as well as the feature e. The broad features can be an indication of a mixed or distorted transition phase.
As a general note, it is shown that Mg K-edge XANES is very sensitive to both the local structure of absorbing atom and crystal orientation. Thus, care has to be taken in the interpretation of phases based on small ROIs. As the photon beam can be focused down to tens of nanometers, and a spectrum acquired from such small regions, the deformations from ideal crystal structure and e.g. vacancies can significantly change the spectra. This can be again seen as a strength of the technique, being able to study local structures e.g. at interfaces, but when identifying sample phases in a larger scale, care has to be taken to select representative ROIs. Here, the presented spectra are averages of various locations on the sample.
At the O K-edge, brucite and HMCs can be clearly differentiated based on their XANES spectra, but identification of different HMCs phases was more challenging here due to strong absorption which leads to saturated spectral signals. Carbon K-edge XANES could bring additional insights for these samples, but thinner samples would be needed for satisfactory O K-edge and C K-edge measurements.
5.2 Spectromicroscopy
The phase, size, and morphology of these HMCs depends largely on the presence of Mg-acetate ligand and the duration of reaction. Dypingite is the most likely phase to crystallize in water. Agglomerates of platelet shape precipitates were observed in all of the studied samples without acetate addition (1, 7, and 28 days of reaction). Brucite, the source material, was also present in all the samples, but its amount seemed to decrease as a function of time, as also observed for the bulk samples.4 In a 1-day reaction time sample, brucite was strongly embedded into the agglomerate whereas longer reaction times showed smaller relative extent of brucite leading to more interconnected dypingite. Earlier studies have demonstrated that in an aqueous environment, the nesquehonite phase precipitates first, and converted to dypingite in time scale of hours.4,33,47 Tanaka et al.10 also observed a solvent-mediated transformation of nesquehonite to dypingite, the solubility difference between them being the driving force behind this transformation (dypingite being less soluble than nesquehonite). Several comprehensive studies allow the anticipation of the long-term stability of dypingite in liquid environment.10,33,47 It has a hydromagnesite like structure which is considered as the most stable phase of HMC.33 From our sample collected after 28-day reaction time, a new type of phase with submicron deposits without clear morphology was detected. Interestingly, previous XRD studies of a sample with identical preparation showed only dypingite as an HMC phase.4 It is possible that the phase is some amorphous transition phase without clear long-range order.The addition of magnesium acetate leads to a different trend in precipitates after 1, 7, and 28 days of reaction time compared to the reaction carried out in pure water. Particularly, we noticed a significant structural development in HMC crystals of 1 day Mg-acetate sample. Besides, some unreacted brucite deposits, long and wide nesquehonite crystals of varying size, even longer than 10 μm, were observed in the 1 day Mg-acetate sample. Similar type of crystals were also identified by Nguyen et al.4 and Dung et al.6 using SEM. They pointed out that these long crystals are favorable to build up an interconnected network. This network can help in binding the other HMC crystals to a more dense cluster like microstructure which can play an important role in defining the mechanical performance of magnesium cement.
The nucleation of longer crystals continues in acetate solution, and elongated crystals of nesquehonite were identified in the 7 days Mg-acetate sample. The agglomerate of precipitates of same sample in Fig. 8(a) also suggests the formation of an additional phase. The morphology of the phase was not very clear since it was intertwined with the agglomerate, but the spectroscopic analysis found similarities in the spectrum and peak energies with the identified HMC phase of 28 days Mg-acetate sample, which was giorgiosite. It is possible that the giorgiosite phase started to form on the nesquehonite surface first without clear needle-like morphology which is typical for giorgiosite. Some unreacted brucite was also observed.
The regularly formed long nesquehonite crystals of Mg-acetate sample, completely turned into rod like very thin giorgiosite needles after 28 days of reaction as also observed and reported in.4,6 Giorgiosite is a relatively new phase which is not yet well-described but its characterisation is critical for further studies. Our assumption is that the nesquehonite detected after 1 and 7 days reaction with Mg-acetate may be completely transformed to giorgiosite during 1 month of reaction due to a ligand mediated transformation, in contrast to converting to dypingite as is the case in pure water. Several studies39,48 have reported that the decomposition of nesquehonite forms hydromagnesite, another HMC phase. However, this formation is unlikely to follow a single simple sequential reaction pathway. Instead, several intermediate hydrated phases are formed, giorgiosite being one of them. Upon addition of Mg-acetate ligand, eventually complete dissolution of brucite can happen, leading to higher degree of reaction. That is why we did not find brucite in the sample with 28-day reaction time with Mg-acetate, in line with previous XRD results.4 The identification of magnesium carbonate phase at different time intervals are crucial since they differ not only by crystal morphology but also have different stability. The understanding of the effect of Mg-acetate ligand is also important in alternative concrete production as it reduces the conversion of HMC phases.
6 Conclusions
This paper presents a comprehensive investigation of hydrated magnesium carbonates using synchrotron radiation based scanning transmission soft X-ray spectromicroscopy. STXM-XANES integrates both spectroscopy and microscopy which helps to gain insight to the overall morphology of formed precipitates as well as their chemical structure. In addition to chemical sensitivity, lower radiation damage compared to electron microscopy, no need for conductive coating, and high spatial resolution makes STXM a good choice. Hydrated magnesium carbonates are promising materials for CO2-capturing cements. The model systems we have studied are formed in an aqueous environment from brucite with sodium bicarbonate as the carbonate source. Addition of magnesium acetate as a ligand to the reaction solution makes a drastic change to the formed precipitates. In acetate added reactions, HMCs form agglomerates leading to an interconnected network with a dense microstructure, which is important for the mechanical performance of the material. We have demonstrated that STXM-XANES has the potential in characterising such intertwined systems, since it does not rely only on different morphologies of particles, but combines it with spectral information, which is sensitive to subtle changes in bonding and coordination of the absorbing element, as well as the orientation of the particle relative to the incident E-vector.Nesquehonite is kinetically fast and formed initially during the reaction in presence of acetate ligand. Giorgiosite, which is a relatively poorly known phase, was often observed in the presence of acetate whereas dypingite favors to crystallize in water. SR-based techniques in ambient conditions such as wet cell STXM or very surface sensitive ambient pressure X-ray photoelectron spectroscopy could shed further light on the interaction between HMCs and acetate, and provide more in-depth understanding of the MgO–CO2-organic ligand-H2O system.
We presented XANES spectra at Mg K-edge for nesquehonite, dypingite, giorgiosite and for an undefined HMC phase. In case of nesquehonite and brucite, we also presented angularly resolved XANES, pointing out how the relative orientation of polarisation vector and crystal orientation affect the spectroscopic features. At O K-edge, we were able to differentiate nesquehonite and dypingite HMC phases from brucite, but a limitation regarding investigations of thick particles is evident: due to a large X-ray absorption cross-section and oxygen rich samples, the spectromicroscopy at O K-edge would require thinner samples.
The STXM-XANES technique is still evolving and a lot of progress is foreseen regarding e.g., sample preparation techniques and sample environments, including for example microfluidic devices which could be beneficial for in situ precipitation studies. Only a limited number of particles can be studied during a usual STXM-XANES campaign, and it is important to complement the studies with for example Raman spectroscopy or XRD for quantitative analysis. This synchrotron radiation-based STXM study on HMC materials serves as an effective basis for future studies inspecting the carbonation of Mg-based cements. It can develop as an important tool for qualitative and quantitative analysis of the precipitation of HMC phases, even in a time-resolved manner.
Author contributions
Md Thasfiquzzaman: data curation, formal analysis, investigation, validation, visualization, writing – original draft, writing – review and editing; Hoang Nguyen: conceptualization, funding acquisition, investigation, project administration, resources, validation, writing – review and comments; Tuomas Mansikkala: investigation, writing – review and editing; Marko Huttula: resources, funding acquisition, writing – review and editing; Igor Beinik: investigation; Jörg Schwenke: investigation; Karina Thånell: investigation; Adam P. Hitchcock: software, investigation, formal analysis, validation, writing – review and editing; Paivo Kinnunen: conceptualization, funding acquisition, project administration, supervision, writing – review and editing; Minna Patanen: conceptualization, data curation, formal analysis, funding acquisition, investigation, project administration, resources, supervision, validation, visualization, writing – original draft, writing – review and editing.Conflicts of interest
There are no conflicts to declare.Acknowledgements
We acknowledge Dr Tolek Tyliszczak for his support during the beamtime. We acknowledge MAX IV Laboratory for time on Beamline SoftiMAX under Proposals 20200746 and 20230842. Research conducted at MAX IV, a Swedish national user facility, is supported by the Swedish Research council under contract 2018-07152, the Swedish Governmental Agency for Innovation Systems under contract 2018-04969, and Formas under contract 2019-02496. We acknowledge funding from the University of Oulu and The Research Council of Finland Profi5 project 326291, and University of Oulu Kvantum Institute. P. K. and H. N. acknowledge the Research Council of Finland projects 329477 and 347183. Part of the work was carried out with the support of the Centre for Material Analysis, University of Oulu, Finland.Notes and references
- K. L. Scrivener, V. M. John and E. M. Gartner, Cem. Concr. Res., 2018, 114, 2–26 CrossRef CAS.
- R. M. Andrew, Earth Syst. Sci. Data, 2018, 10, 195–217 CrossRef.
- E. Gartner and T. Sui, Cem. Concr. Res., 2018, 114, 27–39 CrossRef CAS.
- H. Nguyen, H. Santos, H. Sreenivasan, W. Kunther, V. Carvelli, M. Illikainen and P. Kinnunen, Cem. Concr. Res., 2022, 153, 106696 CrossRef CAS.
- N. Dung, A. Lesimple, R. Hay, K. Celik and C. Unluer, Cem. Concr. Res., 2019, 125, 105894 CrossRef CAS.
- N. Dung and C. Unluer, Cem. Concr. Compos., 2017, 82, 152–164 CrossRef CAS.
- J. Hövelmann, C. V. Putnis, E. Ruiz-Agudo and H. Austrheim, Environ. Sci. Technol., 2012, 46, 5253–5260 CrossRef PubMed.
- D. Filippou, N. Katiforis, N. Papassiopi and K. Adam, J. Chem. Technol. Biotechnol., 1999, 74, 322–328 CrossRef CAS.
- N. Kamala Ilango, H. Nguyen, A. German, F. Winnefeld and P. Kinnunen, Cem. Concr. Res., 2024, 175, 107357 CrossRef CAS.
- J. Tanaka, J. Kawano, T. Nagai and H. Teng, J. Mineral. Petrol. Sci., 2019, 114, 105–109 CrossRef CAS.
- P. Willmott, An Introduction to Synchrotron Radiation: Techniques and Applications, Wiley, 2011 Search PubMed.
- E. Qoku, K. Xu, J. Li, P. J. Monteiro and K. E. Kurtis, Cem. Concr. Res., 2023, 174, 107335 CrossRef CAS.
- B. Rösner, S. Finizio, F. Koch, F. Döring, V. A. Guzenko, M. Langer, E. Kirk, B. Watts, M. Meyer, J. L. na Ornelas, A. Späth, S. Stanescu, S. Swaraj, R. Belkhou, T. Ishikawa, T. F. Keller, B. Gross, M. Poggio, R. H. Fink, J. Raabe, A. Kleibert and C. David, Optica, 2020, 7, 1602–1608 CrossRef.
- D. A. Shapiro, S. Babin, R. S. Celestre, W. Chao, R. P. Conley, P. Denes, B. Enders, P. Enfedaque, S. James, J. M. Joseph, H. Krishnan, S. Marchesini, K. Muriki, K. Nowrouzi, S. R. Oh, H. Padmore, T. Warwick, L. Yang, V. V. Yashchuk, Y.-S. Yu and J. Zhao, Sci. Adv., 2020, 6, eabc4904 CrossRef CAS PubMed.
- J. Ha, S. Chae, K. W. Chou, T. Tyliszczak and P. J. M. Monteiro, Transp. Res. Rec., 2010, 2142, 83–88 CrossRef CAS.
- P. J. M. Monteiro, M. Mancio, A. P. Kirchheim, R. Chae, J. Ha, P. Fischer and T. Tyliszczak, AIP Conf. Proc., 2011, 1365, 351–356 CrossRef CAS.
- G. Geng, R. Taylor, S. Bae, D. Hernández-Cruz, D. A. Kilcoyne, A.-H. Emwas and P. J. Monteiro, Cem. Concr. Res., 2015, 77, 36–46 CrossRef CAS.
- S. Bae, R. Taylor, D. Hernández-Cruz, S. Yoon, D. Kilcoyne and P. J. Monteiro, J. Am. Ceram. Soc., 2015, 98, 2914–2920 CrossRef CAS.
- G. Geng, R. J. Myers, Y.-S. Yu, D. A. Shapiro, R. Winarski, P. E. Levitz, D. A. Kilcoyne and P. J. Monteiro, Cem. Concr. Res., 2018, 111, 130–137 CrossRef CAS.
- Q. Li, Y. Wang, G. Geng, H. Chen, P. Hou, X. Cheng, P. J. M. Monteiro, S. Huang and J. H. Kim, J. Nanomater., 2020, 2020, 8419130 Search PubMed.
- M. D. Jackson, S. R. Chae, S. R. Mulcahy, C. Meral, R. Taylor, P. Li, A.-H. Emwas, J. Moon, S. Yoon, G. Vola, H.-R. Wenk and P. J. Monteiro, Am. Mineral., 2013, 98, 1669–1687 CrossRef CAS.
- T. Yoshida, T. Tanaka, H. Yoshida, T. Funabiki, S. Yoshida and T. Murata, J. Phys. Chem., 1995, 99, 10890–10896 CrossRef CAS.
- F. Farges, A. Meibom, A.-M. Flank, P. Lagarde, M. Janousch and J. Stolarski, J. Phys.: Conf. Ser., 2009, 190, 012175 CrossRef.
- M. Vespa, R. Dähn, T. Huthwelker and E. Wieland, Phys. Chem. Earth, 2017, 99, 168–174 CrossRef.
- K. Inoue, Y. Nishiki, K. Fukushi, R. Suma, T. Sato, H. Sakuma, K. Tamura, S. Yokoyama, M. Shimbashi, T. Mizukami, K. Unami, Y. Noji, T. Kitajima, S. Fukaya, Y. Takeichi, S. Yamashita, H. Suga and Y. Takahashi, Appl. Clay Sci., 2023, 245, 107152 CrossRef CAS.
- J. Schwenke, K. Thanell, I. Beinik, L. Roslund and T. Tyliszczak, Microsc. Microanal., 2018, 24, 232–233 CrossRef.
- P. Jiang, D. Prendergast, F. Borondics, S. Porsgaard, L. Giovanetti, E. Pach, J. Newberg, H. Bluhm, F. Besenbacher and M. Salmeron, J. Chem. Phys., 2013, 138, 024704 CrossRef PubMed.
- D. Cabaret, P. Sainctavit, P. Ildefonse and A.-M. Flank, J. Phys.: Condens. Matter, 1996, 8, 3691 CrossRef CAS.
- A. Hitchcock and C. Brion, J. Electron Spectrosc. Relat. Phenom., 1980, 18, 1–21 CrossRef CAS.
- P. A. van Aken, Z. Y. Wu, F. Langenhorst and F. Seifert, Phys. Rev. B: Condens. Matter Mater. Phys., 1999, 60, 3815–3820 CrossRef CAS.
- A. P. Hitchcock, J. Electron Spectrosc. Relat. Phenom., 2023, 266, 147360 CrossRef CAS.
- D. Cabaret, P. Sainctavit, P. Ildefonse and A.-M. Flank, Am. Mineral., 1998, 83, 300–304 CrossRef CAS.
- G.-i Yamamoto, A. Kyono and S. Okada, Sci. Rep., 2021, 11, 22876 CrossRef CAS PubMed.
- L. Dien, P. Ming-sheng and T. Murata, Can. Mineral., 1999, 37, 199–206 Search PubMed.
- J. Wong, G. George, I. Pickering, Z. Rek, M. Rowen, T. Tanaka, G. Via, B. DeVries, D. Vaughan and G. Brown, Solid State Commun., 1994, 92, 559–562 CrossRef CAS.
- M. Sánchez del Río, M. Suárez, E. García Romero, L. Alianelli, R. Felici, P. Martinetto, E. Dooryhée, C. Reyes-Valerio, F. Borgatti, B. Doyle, A. Giglia, N. Mahne, M. Pedio and S. Nannarone, Nucl. Instrum. Methods Phys. Res., Sect. B, 2005, 238, 55–60 CrossRef.
- G. Raade, Am. Mineral., 1970, 55, 1457–1465 CAS.
- A. A. Finch and N. Allison, Mineral. Mag., 2007, 71, 539–552 CrossRef CAS.
- L. Hopkinson, P. Kristova, K. Rutt and G. Cressey, Geochim. Cosmochim. Acta, 2012, 76, 1–13 CrossRef CAS.
- G. I. Yamamoto, A. Kyono and S. Okada, Mater. Lett., 2022, 308, 131125 CrossRef CAS.
- F. Frati, M. O. J. Y. Hunault and F. M. F. de Groot, Chem. Rev., 2020, 120, 4056–4110 CrossRef CAS PubMed.
- J. Suzuki and M. Ito, J. Jpn. Assoc. Mineral., Petrol. Econ. Geol., 1973, 68, 353–361 CrossRef CAS.
- P. De Silva, L. Bucea, D. Moorehead and V. Sirivivatnanon, Cem. Concr. Compos., 2006, 28, 613–620 CrossRef CAS.
- L. Mo and D. K. Panesar, Cem. Concr. Res., 2012, 42, 769–777 CrossRef CAS.
- D. K. Panesar and L. Mo, Cem. Concr. Compos., 2013, 38, 40–49 CrossRef CAS.
- G. Giester, C. Lengauer and B. Rieck, Mineral. Petrol., 2000, 70, 153–163 CrossRef CAS.
- G. Montes-Hernandez and F. Renard, Cryst. Growth Des., 2016, 16, 7218–7230 CrossRef CAS.
- J. H. Canterford, G. Tsambourakis and B. Lambert, Mineral. Mag., 1984, 48, 437–442 CrossRef CAS.
Footnote |
| † Electronic supplementary information (ESI) available: ROIs of brucite, SEM image of 1-day reaction time sample, additional STXM recordings of precipitates formed in 7 and 28 days in water, and 1 and 28 days in Mg acetate solution. See DOI: https://doi.org/10.1039/d4ma00044g |
| This journal is © The Royal Society of Chemistry 2024 |

