 Open Access Article
Creative Commons Attribution 3.0 Unported Licence
Advantages incorporating V2O5 nanoparticles into PMMA composite membranes for the structural, optical, electrical, and mechanical properties for conductive polymeric membrane applications
Mabkhoot A.
Alsaiari
 a,
Mohamed
Morsy
 bc,
Mona
Samir
c,
Abdulaziz
Al-Qahtani
a,
Rami
Aslsaiari
a,
Ali
Alsaiari
a,
Elbadawy A.
Kamoun
 *def,
Ahmed I.
Ali
 *cgh and
Galal H.
Ramzy
i
aEmpty Quarter Research Unit, Department of Chemistry, Collage of Science and Art in Sharurah, Najran University, Sharurah, Saudi Arabia
bBuilding Physics and Environment Institute, Housing & Building National Research Center (HBRC), 12311 Dokki, Giza, Egypt
cNanotechnology Research Center (NTRC), The British University in Egypt (BUE), El Sherouk City, Suez Desert Road, Cairo 11837, Egypt. E-mail: Ahmed_ali_2010@techedu.helwan.edu.eg
dBiomaterials for Medical and Pharmaceutical Applications Research Group, Nanotechnology Research Center (NTRC), The British University in Egypt (BUE), Cairo, 11837, Egypt. E-mail: badawykamoun@yahoo.com; elbadawy.kamoun@bue.edu.eg; Tel: +201283320302
eDepartment of Chemistry, Collage of Science, King Faisal University, Al-Ahsa 31982, Saudi Arabia
fPolymeric Materials Research Dep., Advanced Technology and New Materials Research Institute (ATNMRI), City of Scientific Research and Technological Applications (SRTA-City) Alexandria, New Borg El-Arab City, Egypt
gBasic Science Department, Faculty of Technology and Education, Helwan University, Saray–El Qoupa, El Sawah St., 11281 Cairo, Egypt
hDepartment of Applied Physics, Kyung Hee University, Yongin 17104, Republic of Korea
iPhysics Department, Faculty of Science, Cairo University, Giza 12613, Cairo, Egypt
First published on 19th February 2024
Abstract
Poly(methylmethacrylate) (PMMA) and PMMA membranes with incorporated vanadium pentoxide (V2O5) nanoparticles were prepared using the solution-casting method with different ratios of dopant (V2O5:0, 0.1, 0.5, 1.0, and 3.0 wt%). The structure of the membranes was investigated using X-ray diffraction (XRD), field emission scanning electron microscopy (FE-SEM), Fourier transform infra-red spectroscopy (FT-IR), and thermogravimetric analysis (TGA). The diffraction pattern of the pure PMMA membrane demonstrates an amorphous structure, while V2O5 demonstrates an orthorhombic structure. The thermal stability of the blank PMMA is improved as the amount of V2O5 increases. Optical parameters, including the refractive index and optical bandgap energy, were calculated, and it was confirmed that with the addition of V2O5, the bandgap value changed from 4.88 eV (direct transition) to 1.32 eV (indirect transition) for the blank PMMA and 3% V2O5/PMMA, respectively. Measurement of the dielectric behavior shows that V2O5-doping of the PMMA increased the dielectric constant, dielectric loss, and impedance. Furthermore, the electrical conductivity is enhanced with the addition of V2O5. Moreover, the dynamic mechanical properties were investigated, and the storage modulus E′ has a relatively high value (∼1.6 GPa) at room temperature (∼300 K). As the temperature increases, E′ decreases drastically to 12.5% of its value at room temperature at 80 °C.
1. Introduction
With the advent of new technologies, composite materials based on organic and inorganic constituents have become the focus of scientists due to their novel properties related to the combination of different materials at the molecular level. They have potential applications in many fields, such as molecular electronics,1 electromagnetic shields,2 microwave-absorbing materials,3–5 supercapacitors6,7 and batteries.8Among the organic materials, polymethylmethacrylate (PMMA) is a lightweight insulating synthetic polymer with a high Young's modulus and high transparency. PMMA has drawn considerable interest for its amorphous nature, optical clarity, and biocompatibility. Recently, there has been significant interest in producing conducting PMMA9,10 for use in a variety of applications,11–15 including electronics, corrosion-resistant coatings, diodes, and sensors.
Alternatively, among the inorganic materials, transition metal oxides (TMO) are interesting materials for the synthesis of nanocomposites due to their different oxidation states, high stability, and natural abundance. V2O5 is an important TMO, as it is a promising material for several applications.16,17 It is a significant photonic and electrical material. V2O5 has intriguing uses in memory switching, optical switching devices, and electrical thresholds due to its comparatively high electrical conductivity and thermal stability.
Many polymer composites have been established through combining several nanofillers, such as carbon-based materials, nickel and silica. The dielectric and mechanical properties of PMMA nanocomposites reinforced with nickel silica,18–22 as well as with silica, titania, etc.,23–25 have been studied. The addition of nanofillers to polymers has been studied to develop polymer materials with excellent properties for expanded industrial applications.26 Among the various areas of polymer material investigation, researchers have developed novel functional polymers to meet the requirements of contemporary applications in engineering.27,28
Developing a conducting polymer such as PMMA using nanofillers such as V2O5 nanoparticles is one of our aims in material research. To the best of our knowledge, no previous studies have been devoted to the studying the influence of V2O5 nanoparticles (NPs) on the morphological, electrical, and mechanical properties of PMMA/V2O5 NP composites, which have potential applications in the area of thermally stable electro-optic materials that could be useful for advanced engineering applications. In addition, the high corrosion resistance of V2O5 effectively shields delicate glass fibers from environmental hazards such as soil, moisture, and chemicals, ensuring long-lasting performance and minimal degradation. Moreover, its exceptional heat resistance and ability to withstand high temperatures make it suitable for demanding environments, including industrial settings and high-power laser applications. The superior electrical insulation properties of V2O5 allow it to act as a robust barrier against electromagnetic interference (EMI), minimizing signal distortions and ensuring data integrity. Furthermore, V2O5 can enhance light transmission because it has specific optical properties that contribute to improved light transmission within the fibers, leading to faster data speeds and greater bandwidth capabilities.29–35
In this report, the effect of the additive vanadium pentoxide (V2O5) on the structure and morphology of polymethylmethacrylate (PMMA) is studied using XRD, FE-SEM, FT-IR, and thermal analysis. Samples of the PMMA/V2O5 nanocomposite were prepared in membrane form using the casting technique. The optical properties, including the optical parameters, were estimated. Mechanical properties such as Young's modulus were studied at room temperature. The dielectric properties of the samples under investigation were measured as a function of frequency.
2. Materials and methods
2.1. Materials
Polymethylmethacrylate (PMMA) (average Mw ∼350![[thin space (1/6-em)]](https://www.rsc.org/images/entities/char_2009.gif) 000 g mol−1 by GPC [linear formula: CH2C(CH3)(CO2CH3)]n) was purchased from Alfa Aesar, Germany. Vanadium pentoxide (V2O5, 98.5%) (particle size 40–45 nm) was obtained from Anhui Fitech Materials, China. Dimethyl formamide (DMF, >99%) was purchased from Thermo Fisher, UK.
000 g mol−1 by GPC [linear formula: CH2C(CH3)(CO2CH3)]n) was purchased from Alfa Aesar, Germany. Vanadium pentoxide (V2O5, 98.5%) (particle size 40–45 nm) was obtained from Anhui Fitech Materials, China. Dimethyl formamide (DMF, >99%) was purchased from Thermo Fisher, UK.
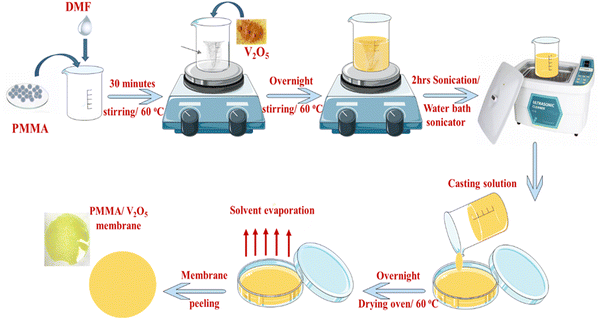
2.2. Preparation of PMMA/V2O5 nanocomposite membranes
PMMA (15% w/v) was dissolved in DMF at 60 °C. The PMMA solution was kept under continuous stirring for about 30 minutes until a transparent solution was obtained. Different concentrations of vanadium pentoxide (0.0, 0.1, 0.5, 1.0, and 3% w/v) were incorporated into PMMA/DMF solution and magnetically stirred overnight at 60 °C until a homogeneous solution of the PMMA/V2O5 mixture is obtained. The latter mixture was then further sonicated in an ultrasonic water bath for two hours, and the mixed PMMA–V2O5 solution was then poured into glass Petri dishes and dried in an oven at 60 °C overnight. Finally, the obtained PMMA/V2O5 was peeled off the Petri dishes. The preparation scheme is depicted in detail in Fig. 1.2.3. Characterization and measurements
X-ray diffraction (XRD) patterns of the casted membranes were acquired with a diffractometer (PANalytical Empyrean 3rd generation, the Netherlands) using Cu-Kα radiation (λ = 1.540 Å) and operated at 40 kV. Scans were performed with a detector step size of 0.02° s−1 over a 2θ range of 10 to 80°. The crystallographic database PDF4 was used to analyze the XRD results.Field emission scanning electron microscopy (FE-SEM): morphological analysis of the V2O5 powder and PMMA/V2O5 membranes was conducted using FE-SEM (Thermo Scientific, FE-SEM Quattro S, USA).
Fourier transform infrared spectroscopy (FT-IR) was recorded in the spectral range of 4000–400 cm−1 using a Vertex 70 instrument (Bruker, Germany) to investigate the functional chemical groups of the nanomaterials.
Optical spectra (UV/Vis) were measured using a spectrophotometer (Agilent Cary5000, Germany). Absorption and transmittance were recorded in the wavelength range of from 300 nm to 900 nm. The optical parameters were estimated using known empirical equations.
Dielectric properties were measured using an LCR analyzer (Haioki im-3533) with active Kelvin electrodes. The experimental data was measured at room temperature (∼303 K) as a function of frequency over the range 1–200 kHz.
A dynamic mechanical analyzer (Metravib-DMA 25) was used to analyze the prepared composites at different temperatures (∼300 K) and six selected frequencies in the range (1–50 Hz).
3. Results and discussions
3.1. XRD analysis
The XRD patterns of the pure PMMA and PMMA/V2O5 nanocomposite membranes are depicted in Fig. 2(a). The diffraction patterns of the pure PMMA membrane demonstrate an amorphous structure with a main broad peak centered around 2θ = 14.2°. Other broad peaks at 2θ values of 30.4° and 42.1° were also observed and coincide with ICDD card No. 00-064-1603 for PMMA. The diffraction pattern of the nanocomposite membrane that contains 0.1% w/v V2O5 is almost the same as that of the PMMA membrane. This could be correlated to the small amount of the additive V2O5 compared to the content of the pure PMMA host matrix. With further increasing the amount of V2O5 incorporated, intense peaks begin to appear. The intensity of the peaks increases as the amount of V2O5 increases. The diffraction patterns of the nanocomposite membranes containing 0.5, 1, and 3% w/v of V2O5 exhibit intense peaks at 2θ values of 19.24°, 25.1°, 30.1°, and 33.3°, corresponding to the (010), (101), (310), and (011) diffraction planes. The indexed peaks exactly match card No. 01-072-0433 for the orthorhombic structure of V2O5.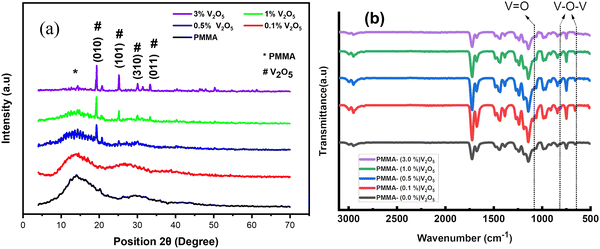 | ||
| Fig. 2 (a) XRD diffraction patterns and (b) FT-IR spectra of the PMMA membrane and PMMA/V2O5 nanocomposite membranes containing different amounts of V2O5 (0.1, 0.5, 1.0, and 3.0% w/v). | ||
Obviously, the XRD results reflect the high crystallinity of the V2O5 and the trend of obtaining PMMA/V2O5 with increased crystallinity along the specified planes with the addition of V2O5, specifically at the highest (3%) content of V2O5.
3.2. FT-IR analysis
The specific functional groups present in the prepared PMMA/V2O5 nanocomposite membranes were revealed by the FT-IR spectra of the materials (Fig. 2(b)). The presence of an ester carbonyl group stretching vibration caused a prominent, powerful peak to develop at ν = 1731 cm−1. The large peak between ν = 1260 and 1000 cm−1 can be attributed to the stretching vibration of C–O (ester bond). The bending of C–H gives rise to the wide band between ν = 950 and 650 cm−1. Its stretching vibration causes the broad peak that spans from ν = 3100 to 2900 cm−1. In the IR spectra of the V2O5 nanoparticles, four distinctive peaks were seen at ν = 1018, 829, and 611 cm−1. The existence of the peak at 1018 cm−1 confirms that terminal oxygen bonds (V![[double bond, length as m-dash]](https://www.rsc.org/images/entities/char_e001.gif) O) are vibrating in a stretching manner. The peak at ν = 829 cm−1 confirms the vibration of doubly coordinated oxygen (bridge oxygen) bonds. Triply coordinated oxygen (chain oxygen) bonds exhibit asymmetric and symmetric stretching vibrations at ν = 611 cm−1.
O) are vibrating in a stretching manner. The peak at ν = 829 cm−1 confirms the vibration of doubly coordinated oxygen (bridge oxygen) bonds. Triply coordinated oxygen (chain oxygen) bonds exhibit asymmetric and symmetric stretching vibrations at ν = 611 cm−1.
3.3. SEM investigation
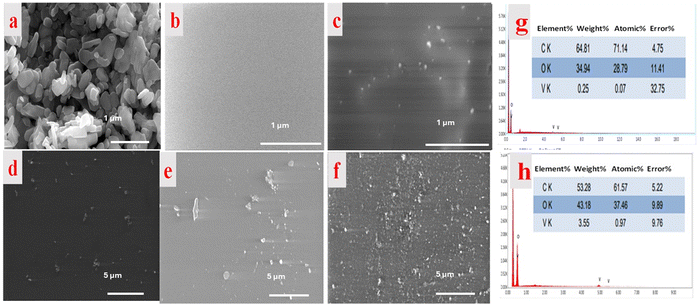
Fig. 3 presents the surface morphological investigation of the pure V2O5 powder and PMMA/V2O5 nanocomposite membranes. As shown in Fig. 3a, the V2O5 NPs are composed of grains with uneven sizes between 0.5 and 2 μm. The morphology of pure PMMA (Fig. 3b) is also shown for comparison with the doped samples. As shown in Fig. 3c, the surface of the sample with the lowest concentration of V2O5 (e.g., 0.1% w/v) is clearly heterogeneous, as the bright spots are slightly spread out and there are large distances between the V2O5 NPs. Similarly, the images of Fig. 3d and e exhibit some agglomeration. However, close inspection of Fig. 3f shows that a superb particle distribution occurs for the PMMA membrane with a 3% concentration of V2O5 NPs.From the EDX spectra (Fig. 3g and h), the bright spots on the surface of the produced PMMA nanocomposite membranes containing V2O5 were verified at low (0.1%) and high (3%) concentrations of V2O5. The EDX data confirmed the homogenous distribution of V2O5 inside the host PMMA matrix (SEM). The highest amount of V2O5 incorporated in the PMMA matrix was 3 wt%. This ratio was confirmed via EDX analysis, which indicated the presence of 3.55 wt% vanadium. The theoretical values of the other PMMA components are 70% carbon and 30% oxygen. In the obtained EDX spectrum, carbon represents 64 wt% and oxygen represents 35 wt%. The increase in oxygen content is due to the amount of incorporated V2O5.
3.4. Thermal analysis (TGA)
Fig. 4 presents the thermogravimetric analysis (TGA) thermographs of the PMMA membrane and PMMA/V2O5 nanocomposite membranes. It is clear from the figure that the weight loss from room temperature to 225 °C is negligible, whereas, with increasing temperature between 250–350 °C, a small weight loss (from 10% to 20% of the initial weight) is detected. Moreover, at higher temperatures (400–550 °C) the sample with the highest V2O5 doping level (3% w/v) exhibited the greatest thermal stability among the composite membranes. Furthermore, the glass temperature increased with the addition of V2O5 into PMMA membranes (Fig. 4b). Notably, the thermal stability of all the prepared PMMA/V2O5 nanocomposite membranes was enhanced progressively based on the amount of V2O5 incorporated into PMMA membranes, compared to that of the pure PMMA membrane.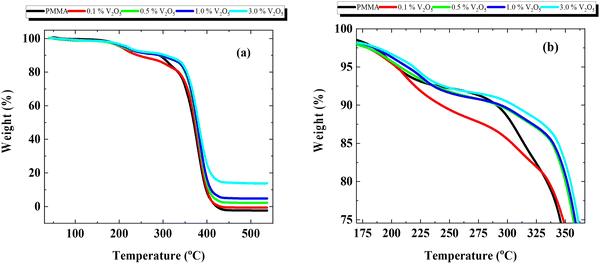 | ||
| Fig. 4 Thermal analysis of PMMA/V2O5 nanocomposite membranes with different concentrations of V2O5 (0, 0.1, 0.5, 1.0, and 3.0% w/v). | ||
3.5. Optical properties
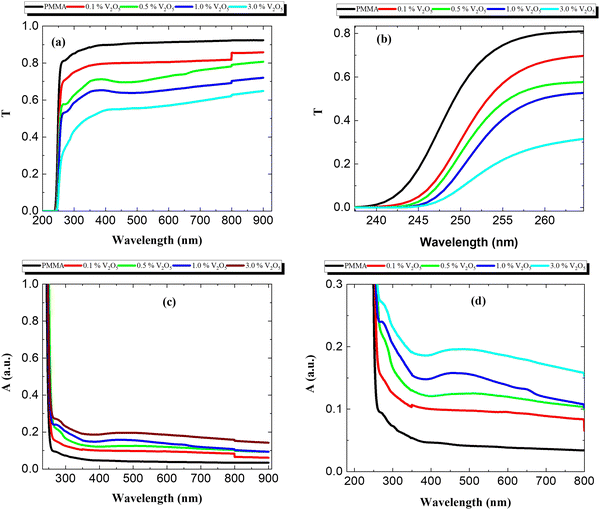
Fig. 5 presents the optical properties of the PMMA/V2O5 nanocomposite membranes containing different amounts of V2O5 (0, 0.1, 0.5, 1.0, and 3.0% w/v), e.g., transmittance (T), absorption (A) and reflection (R). The relationships between the transmittance (T) of the materials and wavelength (200–900 nm) are depicted in Fig. 5(a).Interestingly, the transmittance was decreased with increasing V2O5 concentration in PMMA membranes. For the pure PMMA membrane, at low frequencies (λ > 300 nm) the transmittance was found to be around 90%, whereas for the sample with 3% V2O5 doping, the transmittance was less than 60% of the incident beam. Fig. 5(b) presents a zoomed-in view of the transmittance at lower wavelengths (λ < 300 nm). The behavior of these samples is also reflected in the absorption data (Fig. 5c and d), in which the absorption increases with increasing V2O5 doping ratios. These results may be due to fact that the nanoparticles of metal oxide could easily scatter the photons incident on the sample. One can note that the absorption of the powder V2O5 nanoparticles has nearly the same values as that of PMMA. However, when the PMMA matrix is doped with V2O5 nanoparticles in the composite membranes, the absorption values double and continuously increase with higher levels of doping, indicating increased absorption and decreased transmittance of the light from the samples.
Fig. 6(a) and (b) show the reflectance (R) and absorption coefficients of the PMMA/V2O5 nanocomposite membranes with different concentrations of V2O5 as a function of the wavelength (200 < λ < 900 nm). The reflectance is almost constant for wavelengths of 250 nm to 800 nm. However, the reflectance values at short wavelengths (less than 300 nm) are high due to the decrease in the transmittance and absorption values in this wavelength range. The value of reflectance increases with increasing V2O5 nanoparticle content in the PMMA matrix.
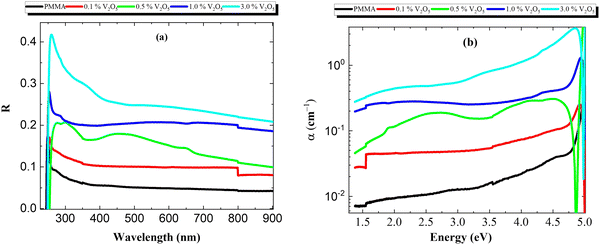 | ||
| Fig. 6 (a) Reflection and (b) absorption coefficient of PMMA/V2O5 nanocomposite membranes with different concentrations of V2O5 (0.1, 0.5, 1.0, and 3.0% w/v). | ||
As shown, the reflectance spectrum increases significantly with the addition of V2O5 NPs compared to that of the pure PMMA membrane, whilst the transmittance (T) decreases and the absorption (A) spectrum increases in the PMMA/V2O5 nanocomposite membranes. This means that the reflection increases with increasing V2O5 concentrations. The absorption coefficient (α) of the PMMA/V2O5 nanocomposite membranes containing different ratios of V2O5 (0, 0.1, 0.5, 1.0, and 3.0% w/v) were calculated as shown in the following equations.4
 | (1) |
| α = A(hν − Eg)p | (2) |
Fig. 7(a–e) show the relationship between (αhv)2 and (hv) for the PMMA/V2O5 nanocomposite membranes. As presented, the bandgap energies of all membranes were calculated from this relationship [(αhv)2vs. (hv)]. Fig. 7(a) shows that the electronic transitions of the PMMA membrane are of the direct type with a bandgap energy value of Eg = 4.88 eV. The energy bandgap of the 3.0% V2O5 nanocomposite membrane is lower (Eg = 1.32 eV) than the usual value for PMMA due to the oxidation of the samples from the V2O5 in the PMMA, which increases the conductivity of the samples. As the amount of V2O5 added to the PMMA nanocomposite membranes increases, the insulating state decreases and the optical conductivity clearly increases.
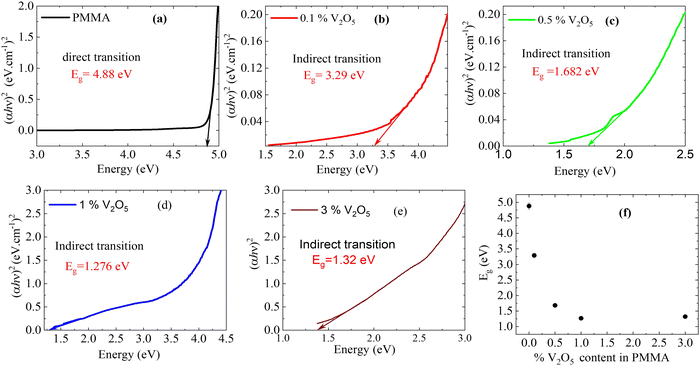 | ||
| Fig. 7 Energy bandgap of PMMA/V2O5 nanocomposite membranes with different concentrations of V2O5 (0, 0.1, 0.5, 1.0, and 3.0% w/v). | ||
The energy gaps of the other samples with the additives V2O5 change to the indirect type and decreases from 4.88 eV to 1.32 eV for the PMMA nanocomposite membrane containing 3% V2O5. Fig. 7(f) confirms the decrease in the bandgap energies with doping level; the bandgap decreases sharply with increasing with the doping level of V2O5 up to 1% V2O5 doping, then becomes nearly constant for doping levels higher than 1% V2O5. This data indicates a change from the insulating state of PMMA to become metallic with V2O5 doping. The optimum sample is the 1 wt% V2O5-doped PMMA sample.
Fig. 8(a and b) presents the refractive index (n) and extinction coefficient (k) spectra of the pure PMMA and its V2O5 nanocomposites. The refractive index (n) for these samples was estimated using the equation below:6
 | (3) |
 | (4) |
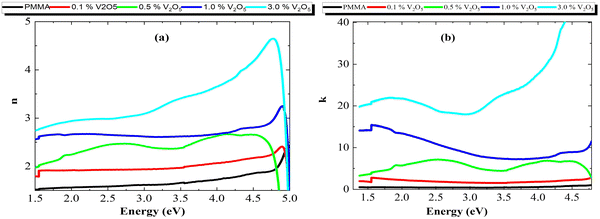 | ||
| Fig. 8 (a) Refractive index (n) and (b) extinction coefficient (k) of the PMMA/V2O5 nanocomposite membranes with different concentrations of V2O5 (0.1, 0.5, 1.0, and 3.0% w/v). | ||
The relationship between the photon energy and refractive index (n) for these membranes is presented in Fig. 8(a). The n values increased with the V2O5 content, from 1 for pure PMMA to around 3 for the highest doping level of 3% V2O5. This may be attributed to the increase in the R values. The V2O5 increased the conductivity and the scattering of the incident photons due to the oscillations of the electrons because of the conducting nature of the V2O5 nanoparticles in the PMMA host matrix.
The extinction coefficient (k) for the nanocomposite membranes is depicted in Fig. 8b. From this data, it is clear that k increases with V2O5 incorporation; this is due to the increasing number of free electrons, which gives rise to an increase in the absorbed light. At low energies (energy <4 eV), the k-value increased from 0.1 for pure PMMA to 23 for the 3% V2O5 doping ratio. However, at energies higher than 4.0 eV, the k-values increased an order of magnitude for the highest doping ratio (3% V2O5).
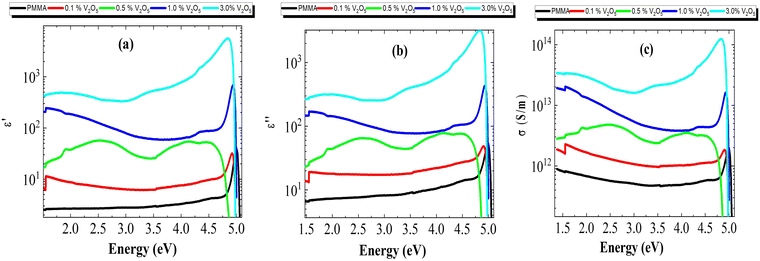
From the above results, the optical dielectric parameters, including the optical dielectric constant (ε′) and optical dielectric loss (ε′′) of the nanocomposite membrane were determined using eqn (5) and (6).7,9
| ε′ = (n2 − k2) | (5) |
| ε′′ = 2nk | (6) |
Fig. 9(a and b) shows both the optical dielectric constant (ε′) and the optical dielectric loss (ε′′) of the PMMA/V2O5 nanocomposite membranes. Obviously, both the (ε′) and (ε′′) values increased with the V2O5 ratio owing to the conducting nature of V2O5; this was confirmed by the experimental data showing increasing absorption with increasing V2O5 content.
The real part of the optical conductivity (σ1) for the investigated samples was calculated using eqn (7):8
 | (7) |
3.6. Dielectric properties
The dielectric properties of materials always provide deep insight into the polarization state of the materials, as well as the possible conduction mechanisms and probable relaxation processes for the frequency and temperature ranges under study. The dielectric properties depend on several factors, e.g., the chemical composition, preparation method, etc.10 The dielectric properties of the prepared composites were measured at room temperature (∼303 K) in the frequency range of 0.5–200 kHz. However, the data for the prepared composites was found to be unaltered with temperature, so only the data at room temperature are depicted.| ε* = ε′ − jε′ | (8) |
 | (9) |
 | (10) |
 . ε0 is the permittivity of free space (8.854 × 10⁻¹² F m−1), d is the thickness of the membrane, and A is the electrode cross-sectional area. C and G are the measured capacitance and conductance, respectively, and ω = 2πf is the angular frequency.
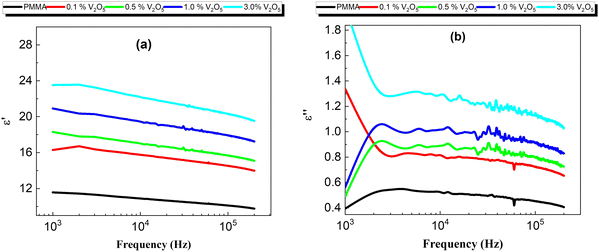
The real part (ε′) and the imaginary part (ε′′) of the frequency response of the dielectric constant ε′ of all the nanocomposite membranes ε′′ room temperature (308 K) are shown in Fig. 10a and b, respectively. Obviously, the real part of the dielectric constant (ε′) in Fig. 10a is affected by two factors, the content of V2O5 and the frequency; specifically, (ε′) increases with V2O5 content and decreases with frequency. This behavior might be explained by using the Maxwell–Wagner double-layer model of space charges. According to this model, the increase in the real part of the dielectric constant with the V2O5 content may be attributed to the accumulation of the space-charge effect occurring at the electrode-composite interface and/or the grain boundaries within the composites, while the decrease of ε′ with frequency results from the reduction in the space charge polarization effect at the grains and/or the grain boundaries.12,13
3.7. AC conductivity
Fig. 11 depicts the frequency-dependence of the AC conductivity of all the prepared nanocomposite membranes. Obviously, the AC conductivity increases with the incorporation of V2O5 NPs. This behavior might be attributed to the increase in mobile charge carriers with the addition of V5+ ions. For the present nanocomposite membranes, the frequency-dependent AC conductivity of the composites exhibits two regions; the first region is the low-frequency region, in which the AC conductivity is nearly independent of frequency; while in the second region, the AC conductivity shows a strong frequency-dependence. | ||
| Fig. 11 Frequency dependence of conductivity at 308 K for all the prepared PMMA/V2O5 nanocomposite membranes with different concentrations of V2O5 (0, 0.1, 0.5, 1.0, and 3.0% w/v). | ||
3.8. Impedance analysis
Fig. 11(a and b) shows Z′ and Z′′ as a function of the frequencies for all the PMMA and V2O5-doped PMMA samples at room temperature. The general behavior of the real part of impedance is for Z′ to decrease with increasing frequency, whilst with increasing concentration of V2O5, the impedance decreased from 0.08 MΩ for the samples with low V2O5 concentrations (0 and 0.1%) to 0.2 MΩ for the sample with the highest V2O5 content. In the (Z′ vs. f) curve, the Z′ value rapidly decreases with increasing frequency at low frequency; this effect may be because of the direct transportation of free charge carriers. Moreover, in the middle frequency range, the Z′ value decreases linearly with increasing frequency until 104 Hz, after which the Z′ value starts to be constant, this behavior represents the transition from the long-range hopping at low frequency to the localized motion of the charge carriers at high frequency.14–16In addition, the imaginary part (Z′′) of the impedance increases with the frequency, this is the natural trend of the polymers. It is very clear that same behavior is observed for all the samples. The behavior of the impedance may be attributed to the increasing concentration of V2O5 in the membrane leading to an increase in the free charge carriers and therefore decreasing the impedance of the sample.17,28
3.9. Electrical modulus
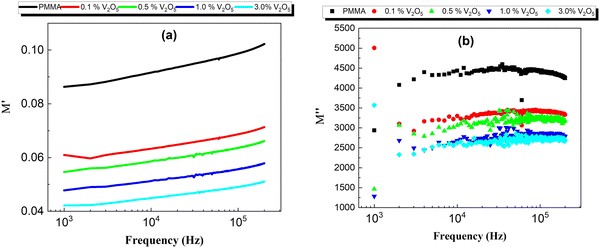
The real and imaginary parts of the electrical modulus (M′, M′′) of the PMMA and PMMA/V2O5 nanocomposite membranes were calculated using the following equations:11 | (11) |
 | (12) |
Fig. 12 presents the complex electrical modulus as a function of frequency for the PMMA and PMMA/V2O5 nanocomposite membranes. Electrical modulus spectroscopy is very useful to understand the electrical properties of the low dielectric constant for nanomaterial composites. Also, electrical modulus spectroscopy can be used to further understand the grain boundary conduction mechanism and the electrode polarization in a perfect method.36,37 The real and imaginary parts of the complex electrical modulus (M′ and M′′) of the PMMA and the PMMA/V2O5 nanocomposite membranes were investigated as a function of frequency (500 Hz–200 kHz) at room temperature and are shown in Fig. 12. Moreover, at lower frequency, the M′ values are low, but with increasing frequency, the M′ values are high, due the fact that the dipole moment can rotate sufficiently fast at low frequency, whilst at higher frequency, the dipole moment cannot follow the oscillations of the applied electric field.14
3.10. Dynamic mechanical analysis (DMA)
Dynamic mechanical analysis (DMA) provides deep insight into nanocomposite membranes made of polymers loaded with fillers.36 DMA was used to characterize the PMMA/V2O5 nanocomposite membranes at different temperatures (35–80 °C) at a strain of 2 × 10⁻⁵, with an angular frequency of 6.28 rad s−1 and a heating rate of 1 °C min−1 and a stabilization time of 3 min. The temperature dependence of the storage modulus E′ for the PMMA/V2O5 membranes was studied, as shown in Fig. 13a. Obviously, for the pristine membranes (PMMA/0% V2O5), the storage modulus E′ has a relatively high value (∼1.6 GPa) at room temperature (35 °C). As the temperature increases to 80 °C, E′ decreases drastically to 12.5% of its value at the room temperature. This might be attributed to the structural softening that occurs because of the increase in the volume available for the motion of the molecular main chains. The same behavior is repeated for all the other PMMA/V2O5 membranes. However, we noticed that in Fig. 13b, the storage modulus E′ decreases with the V2O5 content; at room temperature (∼35 °C), the storage modulus decreased from 1.6 GPa for the PMMA sample to around 0.4 GPa for the 3 wt% V2O5-doped sample. This decrease might be ascribed to the structural softening that perhaps accompanied the addition of V2O5.20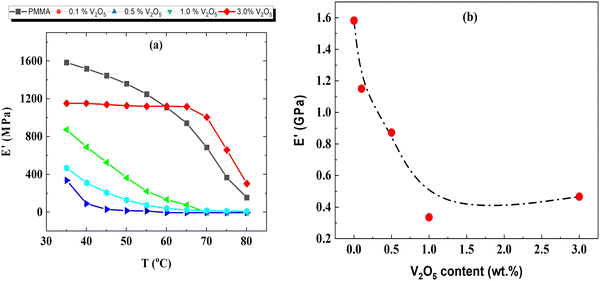 | ||
| Fig. 13 TGA thermograph results for the PMMA/V2O5 nanocomposite membranes with different concentrations of V2O5 (0, 0.1, 0.5, 1.0, and 3.0% w/v). | ||
4. Conclusions
To summarize, V2O5 (0, 0.1, 0.5, 1.0 and 3.0% w/v) was successfully dispersed into PMMA membranes by a solution-casting method. The structure of the prepared PMMA/V2O5 nanocomposite membranes was verified to be an orthorhombic structure of V2O5. The crystallinity of PMMA/V2O5 improved with the addition of V2O5 along the specified planes specifically at the highest (3%) content of V2O5. The FE-SEM image showed that the V2O5 NPs were composed of grains with uneven sizes between 0.5–2 μm. Four distinctive peaks in the IR spectra of V2O5 nanoparticles were seen at ν = 1018, 829, and 611 cm−1. The thermal stability of all the prepared PMMA/V2O5 nanocomposite membranes was progressively enhanced compared to that of the pure PMMA membrane. Optical investigation confirmed that the addition of V2O5 changed the bandgap from a direct to an indirect transition, and the bandgap values decreased from 4.88 to 1.32 eV for the sample with 3% V2O5. The dielectric constant decreased with increasing frequency and V2O5 content, while the conductivity increased, due to the motion of the V2O5 ions in the PMMA matrix. The decreasing dielectric constant is normal behavior due to the insulating nature of the PMMA. In addition, dynamic mechanical analysis (DMA) confirmed the reduction of the storage modulus with increasing V2O5 ion content. The storage modulus E′ has a relatively high value (∼1.6 GPa) at room temperature (35 °C), but decreases drastically to 12.5% of its value at room temperature at 80 °C, which was attributed to structural softening.Data availability
All data generated or analyzed during this study are included in this submitted manuscript.Conflicts of interest
The authors declare no competing interests.Acknowledgements
The authors are thankful to the deanship of Scientific Research at Najran University for funding this work under the student research funding program grant code (NU/SRP/SERC/12/21).References
- Y. S. Thakur, A. D. Acharya, S. Sharma and Bhawna, Reinforcement of V2O5 nanoparticle in polyaniline to improve the optical and UV- shielding properties, Results Opt., 2023, 11, 100400, DOI:10.1016/j.rio.2023.100400.
- J. Li, Y. He and Y. Sun, et al., Synthesis of polypyrrole/V2O5 composite film on the surface of magnesium using a mild vapor phase polymerization (VPP) method for corrosion resistance, Coatings, 2020, 10(4), 402, DOI:10.3390/coatings10040402.
- S. Bisoyi, A. D. Acharya and S. S. Manhas, et al., Preparation and Characterization of Vanadium Doped Polyvinylpyrrolidone Nanocomposite, J. Phys.: Conf. Ser., 2022, 2267(1), 012032, DOI:10.1088/1742-6596/2267/1/012032.
- X. Li, Q. Tan and L. Qin, et al., A high-sensitivity MoS2/graphene oxide nanocomposite humidity sensor based on surface acoustic wave, Sens. Actuators, A, 2022, 341, 113573, DOI:10.1016/j.sna.2022.113573.
- A. I. Ali, A. H. Ammar and A. Abdel Moez, Influence of substrate temperature on structural, optical properties and dielectric results of nano- ZnO thin films prepared by Radio Frequency technique, Superlattices Microstruct., 2014, 65, 285–298, DOI:10.1016/j.spmi.2013.11.007.
- T. S. Soliman, M. F. Zaki and M. M. Hessien, et al., The structure and optical properties of PVA-BaTiO3 nanocomposite films, Opt. Mater., 2021, 111, 110648, DOI:10.1016/j.optmat.2020.110648.
- A. C. K. C. George, Defect induced modifications in the optical, dielectric, and transport properties of hydrothermally prepared ZnS nanoparticles and nanorods, J. Nanopart. Res., 2014, 16(3), 2238, DOI:10.1007/s11051-013-2238-5.
- M. S. El-Bana and S. S. Fouad, Opto-electrical characterisation of As33Se67−xSnxthin films, J. Alloys Compd., 2017, 695, 1532–1538, DOI:10.1016/j.jallcom.2016.10.295.
- A. I. Ali, J. Y. Son and A. H. Ammar, et al., Optical and dielectric results of Y0.225Sr0.775CoO3 ± δ thin films studied by spectroscopic ellipsometry technique, Results Phys., 2013, 3, 167–172, DOI:10.1016/j.rinp.2013.08.004.
- Impedance Spectroscopic Characterization of Sm and Ho Doped Ni Ferrites, J. Electrochem. Soc., 2011, 158, G71 DOI:10.1149/1.3534800.
- M. Gökçen and T. Tunç, Enhancement of Dielectric Characteristics of Polyvinyl Alcohol (PVA) Interfacial Layer in Au/PVA/n-Si Structures by Bi2O3 Disperse, Int. J. Appl. Ceram. Technol., 2013, 10, E64–E69 CrossRef.
- M. Niranjana, L. Yesappa and S. P. Ashokkumar, et al., Optical and electrical studies of vanadium pentoxide doped polyaniline composite, AIP Conf. Proc., 2017, 1832, 1–4, DOI:10.1063/1.4980212.
- M. Chereches, D. Bejan and E. I. Chereches, et al., An Experimental Study on Electrical Conductivity of Several Oxide Nanoparticle Enhanced PEG 400 Fluid, Int. J. Thermophys., 2021, 42(7), 1–11, DOI:10.1007/s10765-021-02855-4.
- V. K. Bhatnagar and K. L. Bhatia, Frequency dependent electrical transport in bismuth-modified amorphous germanium sulfide semiconductors, J. Non-Cryst. Solids, 1990, 119(2), 214–231, DOI:10.1016/0022-3093(90)90845-D.
- A. I. Ali, M. A. Ahmed and N. Okasha, et al., Effect of the La3+ ions substitution on the magnetic properties of spinal Li-Zn-ferrites at low temperature, J. Mater. Res. Technol., 2013, 2(4), 356–361, DOI:10.1016/J.JMRT.2013.09.001.
- A. I. Ali, C. W. Ahn and Y. S. Kim, Enhancement of piezoelectric and ferroelectric properties of BaTiO3 ceramics by aluminum doping, Ceram. Int., 2013, 39(6), 6623–6629, DOI:10.1016/J.CERAMINT.2013.01.099.
- A. I. Ali, A. Hassen and N. C. Khang, et al., Ferroelectric, and piezoelectric properties of BaTi1-xAlxO3, 0 ≤ x ≤ 0.015, AIP Adv., 2015, 5, 097125, DOI:10.1063/1.4930859/898636.
- Y. Kojima, A. Usuki, M. Kawasumi, A. Okada, Y. Fukushima, T. Kurauchi and O. Kamigaito, Mechanical properties of nylon 6-clay hybrid, J. Mater. Res., 1993, 8, 1185–1189, DOI:10.1557/JMR.1993.1185.
- K. Yusupov, A. Zakhidov, S. You, S. Stumpf, P. M. Martinez, A. Ishteev, A. Vomiero, V. Khovaylo and U. Schubert, “Influence of oriented CNT forest on thermoelectric properties of polymer-based materials”, J. Alloys Compd., 2018, 741, 392–397, DOI:10.1016/j.jallcom.2018.01.010.
- D. Abulyazied and H. Abomostafa, Dielectric and mechanical properties of nickel silica core-shell reinforced PMMA nanocomposites, J. Compos. Mater., 2021, 55(21), 2841–2855, DOI:10.1177/00219983211000434.
- J. Ma, Y. Li, X. Yin, Y. Xu, J. Yue, J. Bao and T. Zhou, Poly(vinyl alcohol)/graphene oxide nanocomposites prepared by in situ polymerization with enhanced mechanical properties and water vapor barrier properties”, RSC Adv., 2016, 6, 49448–49458, 10.1039/C6RA08760D.
- Y. Dai, Q. Tang, Z. Zhang, C. Yu, H. Li, L. Xu, S. Zhang and Z. Zou, Enhanced mechanical, thermal, and UV-shielding properties of poly(vinyl alcohol)/metal–organic framework nanocomposites, RSC Adv., 2018, 8(67), 38681–38688, 10.1039/C8RA07143H.
- X. Su, S. Mahalingam, M. Edirisinghe and B. Chen, Highly Stretchable and Highly Resilient Polymer–Clay Nanocomposite Hydrogels with Low Hysteresis, ACS Appl. Mater. Interfaces, 2017, 9, 22223–22234, DOI:10.1021/acsami.7b05261.
- L. Song, Z. Wang, X. Tang, L. Chen, P. Chen, Q. Yuan and L. Li, Enhanced mechanical, thermal, and UV-shielding properties of poly(vinyl alcohol)/metal–organic framework nanocomposites, Macromolecules, 2017, 50, 7249–7257, DOI:10.1021/acs.macromol.7b00539.
- S. Javadi, M. Panahi-Sarmad and M. Razzaghi-Kashani, Interfacial and dielectric behavior of polymer nano-composites: Effects of chain stiffness and cohesive energy density, Polymer, 2018, 145, 31–40, DOI:10.1016/j.polymer.2018.04.061.
- A. M. El-Nahrawy, A. I. Ali, A. B. Abou Hammad and A. M. Youssef, Influences of Ag-NPs doping chitosan/calcium silicate nanocomposites for optical and antibacterial activity, Int. J. Biol. Macromol., 2016, 267–275, DOI:10.1016/j.ijbiomac.2016.08.045.
- S. Amrollahi, B. Ramezanzadeh, H. Yari, M. Ramezanzadeh and M. Mahdavian, Synthesis of polyaniline-modified graphene oxide for obtaining a high performance epoxy nanocomposite film with excellent UV blocking/anti-oxidant/anti-corrosion capabilities, Composites, Part B, 2019, 173, 106804, DOI:10.1016/j.compositesb.2019.05.015.
- A. I. Ali, V. Senthikuma and I. W. Kim, et al., The influence of SrTiO3 buffer layer on ferroelectric properties of Al-doped BaTiO3 thin films, J. Electroceram., 2014, 33(1–2), 47–52 CrossRef CAS.
- Y. Zhang, Y. Zhang and J. He, Vanadium pentoxide: A versatile material for fiber optics, J. Mater. Chem. C, 2018, 6(42), 10585–10602 RSC.
- A. A. El-Sherif, Vanadium pentoxide-based materials for fiber optic applications, J. Opt. Lasers Eng., 2018, 56(1), 1–11 Search PubMed.
- S. B. Sahu, S. K. Panda and B. C. Dash, Vanadium pentoxide-based optical fibers: A review, J. Mater. Sci.: Mater. Electron., 2019, 30(22), 24106–24122, 10.1039/D2TC03168J.
- R. C. Sriram, S. K. Singh and S. K. Mishra, Recent advances in vanadium pentoxide-based optical fiber coatings, Adv. Opt. Mater., 2020, 8(3), 1900519 Search PubMed.
- C.-Y. Chen, C.-Y. Lin and Y.-C. Lo, Vanadium pentoxide-based optical fiber for high performance applications, J. Mater. Chem. C, 2014, 10, 7364–7376 Search PubMed.
- A. Dhawan, Y. Sharma, L. Brickson and J. F. Muth, Incorporation of vanadium oxide films in optical fibers for temperature sensing and optical switching applications, Opt. Mater. Express, 2014, 4(6), 1148, DOI:10.1364/OME.4.001128.
- A. D. Patil, S. B. Kondhalkar, S. G. Algude, S. E. Shirsath, V. S. Shinde and S. M. Patange, Influence of Ta2O5 additive on the structural, optical and magnetic properties of Ni-Cu-Zn nanocrystalline spinel ferrites, Mater. Res. Express, 2019, 6, 96103, DOI:10.1088/2053-1591/ab294f.
- C. Rayssi, S. El Kossi and J. Dhahri, et al., Frequency and temperature-dependence of dielectric permittivity and electric modulus studies of the solid solution Ca0.85Er0.1Ti1−xCo4x/3O3 (0 ≤ x ≤ 0.1), RSC Adv., 2018, 8(31), 17139–17150, 10.1039/C8RA00794B.
- K. Senthilkumar, M. Chandrasekar and O. Y. Alothman, et al., Flexural, impact and dynamic mechanical analysis of hybrid composites: Olive tree leaves powder/pineapple leaf fibre/epoxy matrix, J. Mater. Res. Technol., 2022, 21, 4241–4252, DOI:10.1016/j.jmrt.2022.11.036.
| This journal is © The Royal Society of Chemistry 2024 |

