 Open Access Article
CeO2-promoted Cu2O-based catalyst sprayed on the gas diffusion layer for the electroreduction of carbon dioxide to ethylene†
A.
Alarcón
 *ac,
T.
Andreu
 ab and
C.
Ponce de León
 c
c
aFacultat de Química, Universitat de Barcelona, Martí i Franquès, 1, Barcelona 08028, Spain. E-mail: a.alarcon@ub.edu
bSustainable Electrochemical Processes, Universitat de Barcelona, 08028, Barcelona, Spain
cElectrochemical Engineering Laboratory, Energy Technology Research Group, Faculty of Engineering and Physical Sciences, University of Southampton, Highfield Campus, University Road, Southampton, SO17 1BJ, UK
First published on 5th February 2024
Abstract
The development of efficient and selective catalysts for the carbon dioxide reduction reaction (CO2RR) is crucial for sustainable energy and chemical synthesis. In this work, CeO2-y (y = C (cubic) and R (rod)) was incorporated into Cu2O nanocube electrocatalyst as a promoter for ethylene (C2H4) production. The results demonstrate that the catalyst with a loading of 5 wt% crystalline CeO2-C exhibits competitive activity and stability for ethylene production compared to pristine Cu2O. Under optimized reaction conditions of −250 mA cm−2 current density and 1 M KOH electrolyte, the Cu2O–5CeO2-C catalyst achieved a faradaic efficiency (FE) of ∼53% for C2H4 production, while maintaining stability over a period of 120 minutes. In contrast, non-promoted Cu2O exhibited a lower FE for C2H4 (∼38%) and experienced partial deactivation after 45 minutes. The characterization of the catalysts before and after the reaction revealed that the interaction between Cu2O and CeO2-C creates intrinsic sites (Cux–CeO2−x; Cux = Cu2+, Cu+, and Cu0) for the binding of CO2 and H2O molecules. Moreover, the Cu2O–5CeO2-C catalyst outperforms other reported systems in terms of FE and partial current density for C2H4 production. It requires a lower potential (−0.98 V vs. RHE) to operate at the same electrolyte concentration. This finding highlights the promising nature of Cu2O–5CeO2-C as an efficient and cost-effective catalyst for C2H4 production.
Introduction
The electrochemical carbon dioxide reduction reaction (CO2RR) has attracted enormous interest due to its mild reaction conditions and potential to be used for renewable electricity storage via the production of synthetic fuels. Particularly, the CO2RR to ethylene (C2H4) aiming at high current densities and faradaic efficiencies (FE) is intensively studied because of the extremely high industrial value and the need to transition away from fossil fuel C2H4 production.1 Copper-based (Cu,2–4 CuO5–8 and Cu2O9–14) electrodes are proven to be the most used heterogeneous catalysts that tend to produce hydrocarbons and oxygenate compounds with competitive activity. However, as multi-step electron and proton transfer processes are involved in C2H4 formation, hydrogen (H2) and other by-products such as methane (CH4) will inevitably be produced during electrolysis. Therefore, the design of efficient catalysis systems specific for the CO2RR to ethylene with both high selectivity and high FE as well as low overpotential is highly desirable.Various catalyst design strategies have been reported to effectively regulate the selectivity of the CO2RR.15–17 Notably, by altering the electronic structure of Cu-based catalysts by the addition of a second metal18–20 or metal oxide promoter21 phase provides a significant improvement for C2H4 production. Ceria (CeO2) is widely used as a catalyst, support and promoter for a variety of heterogeneous catalytic reactions involving the hydrogenation of CO222 due to its acid–base and unique redox properties of oxygen storage and release.23 The size and shape modification, surface/face reconstruction, and faceting of ceria at the nanoscale level can offer an important tool to govern activity and stability in these reactions.24 Furthermore, strong interaction between noble metals and ceria leads to their higher dispersion, electronic modifications and enhanced catalytic activity.25
Recently, the implementation of CeO2 as a support material for the CO2RR has been investigated by some researchers. For instance, a high methane (CH4) faradaic efficiency (up to ∼54% at −1.2 V vs. RHE) over Cu/CeO2−x nanocrystalline heterodimers was reported by S. Varandili et al.26 In another study, Cu/CeO2 carbon nanofiber (Cu/CeOx@CNF) catalysts synthesized by an electrospinning method were explored by X. Zong et al.27 In this case, their optimized Cu/CeOx@CNFS-2 catalyst exhibited a high CO faradaic efficiency (up to ∼59% at −0.6 V vs. RHE) at a high current density of 100 mA cm−2. Most recently, Zhao et al.28 have that the Cu electrode coating with CeO2 nanoparticles largely enhanced the C2+ product selectivity during CO2 electroreduction. The FE and partial current density of C2+ products on the CeO2–Cu electrode achieved in a gas-tight H-type electrolytic cell with 0.1 M KHCO3 was 61% and 8.45 mA cm−2 at −1.05 V vs. RHE, respectively. In that study, 1.5 mg cm−2 was found to be the optimal CeO2 coating. The improved CO2RR selectivity and activity of CeO2–Cu were attributed to the interface between Cu and CeO2, which promotes C–C coupling towards C2+ production products. The CO2RR to C2+ has also been evaluated over a CuO modified 20 wt% CeO2 catalyst using a flow cell at 1 M KOH. Under those conditions, the reported faradaic efficiency of the C2+ products was ∼75.2% at a current density of 1.21 A cm−2. S. Yan et al.29 revealed that CeO2 and Cu and the subsurface Cu2O coexisted in CeO2/CuO during the CO2RR and two competing pathways for C–C coupling were promoted separately, of which hydrogenation of *CO to *CHO is energetically favoured.
In terms of the CO2RR to C2H4, the stabilization of Cu+ within a CuO–CeO2 interface has been reported by S. Chu et al.30 They suggested that tuning the CuO/CeO2 interfacial interaction permits dramatic suppression of proton reduction and enhancement of CO2 reduction. The C2H4 faradaic efficiency (up to ∼50% at −1.1 V vs. RHE) was obtained over an optimised CuO/30 wt% CeO2 using a liquid H-type cell with continuous CO2 bubbling in 0.1 M KHCO3 electrolyte. Lately, the effect of exposed facets of CeO2 (cubes (100), rods (110), and octahedral (111)) has also been investigated under similar reaction conditions by S. Chu et al.31 In the CeO2-supported Cu nanoparticles, they found that CeO2 changed the oxidation state of Cu atoms towards Cu+ at the CuO–CeO2 interface. This fact was mainly identified on the Cu/CeO2(110), flowed by Cu/CeO2(100) and Cu/CeO2(111). The existence of Cu+ species was supposed to be likely the adsorption and active sites for CO2 activation followed by further C–C coupling to yield C2H4. The FE towards C2H4 was ∼39% on the Cu/CeO2(110) at a mild overpotential of 1.13 V. In another study performed on a flow-cell at high current density and under 1 M KOH, Ce-doped Cu nanoparticles (Ce–Cu NPs) were reported to be highly selective to C2H4. A high faradaic efficiency (FE) of C2H4 close to 53% at a current density of 150 mA cm−2 was achieved using a Ce/(Cu + Ce) precursor ratio = 10%. J. Shan et al.32 suggested that the high performance, which is 2.8 times higher than Cu nanoparticles under the same conditions, is due to the shrinking of the particle sizes due to Ce doping resulting in more catalytic active sites with oxygen defects. It seems that the proximity of the Ce atoms can boost the local electronic distribution on the Cu nanoparticles. Under similar reaction conditions, anchoring CeO2 quantum dots on to the CuO surface has been evaluated by S. Wang et al.33 Their optimal catalyst consisting of 100 wt% CeO2 and 50 wt% CuO achieved a high faradaic efficiency of ∼50% for ethylene with a partial current density of 197 mA cm−2, attributed to the CuO/CeO2 interfaces that simultaneously stabilize Cu+ and key intermediates.
Despite these advances in CuO supported CeO2 electrocatalysts for CO2RR to C2H4, the role of the CeO2 as a promoter using Cu2O instead of CuO has not been investigated yet. Recent studies have revealed that the Cu2O phase provides a higher selectivity to ethylene compared to CuO.34 Furthermore, the economic viability of most large-scale chemical processes relies on the use of simple and low-cost catalytic materials. Therefore, the implementation of CeO2 as a promoter instead of bulk support is a practical way to design cost-effective electrocatalytic materials. In this line, the promoter content optimization into Cu2O can provide a highly active-stable, and low-cost electrocatalytic formulation for C2H4 production.
Here, we developed a CeO2-promoted Cu2O-based catalyst sprayed on a carbon-based gas diffusion layer for the CO2RR to C2H4. A series of Cu2O–xCeO2 were synthesized by the simple liquid phase reduction method. The influence of CeO2 crystallinity and promoter loading (x = 5–20 wt%) was studied under relevant reaction conditions (current density (j) = −[50–300] mA cm−2, 1 M KOH, and flow of CO2 (FCO2) = 200 mL min−1). Furthermore, the influence of the KOH concentration (0.1–3 M) and electrolyte type (KOH, KCl, and KHCO3,) over the optimized Cu2O–5CeO2 GDE was investigated to identify the best reaction components. Lastly, its stability was additionally tested under the selected reaction conditions (j = −250 mA cm−2, electrolyte = 1 M KOH, and FCO2 = 200 mL min−1). The physico-chemical properties responsible for catalyst performance were studied using scanning electron microscopy-energy dispersive X-ray spectroscopy (SEM-EDX), transmission electron microscopy (TEM), X-ray diffraction (XRD), and Raman and photoelectron spectroscopy (XPS).
Experimental section
Chemicals and reagents
All chemical reagents used were of analytical grade without further treatment. Copper(II) sulfate [CuSO4, 99%] and Nafion® perfluorinated resin solution (5 wt% in a mixture of lower aliphatic alcohols and water, 45% water) were purchased from Sigma Aldrich. Cerium(III) nitrate hexahydrate [Ce(NO3)3·6H2O, 99.5%] was purchased from Thermo Scientific. L(+)-Ascorbic acid [C6H8O6, 99%] was purchased from Acros Organics. Sodium hydroxide [NaOH, 97%], potassium hydroxide [KOH], and ethanol absolute [C2H6O, 99.8%] were purchased from Fisher Scientific. Ultrapure water was provided by Milli-Q Millipore source (18.2 MΩ cm, 20 °C).Preparation of the catalysts
The promoter phase, CeO2, was first synthesized using a hydrothermal method. In a typical synthesis, 3.25 g of Ce(NO3)3·6H2O was dissolved in 15 mL of deionized water to obtain cerium nitrate aqueous solution. Then, a NaOH aqueous solution was prepared in a Teflon-lined steel reactor using 9 g of NaOH and 50 mL of deionized water. The cerium nitrate aqueous solution was later added dropwise into the NaOH aqueous solution. After magnetic stirring for 30 min, the reactor was sealed and heated at two different temperatures of 80 °C and 240 °C for 24 h to obtain rod (R) and cubic (C) ceria particles, respectively. After cooling down to room temperature, the resulting precipitate was separated by centrifugation (4000 rpm for 5 min) and washed three times with excess ethanol, followed by drying in an oven overnight at 80 °C.The series of CeO2-promoted Cu2O (Cu2O–xCeO2-y; x = 5, 10, 15 and 20 wt% and y = rod (R) and cubic (C) shape) samples were synthesized using a simple liquid phase reduction method. CuSO4 (0.2689 g) and the respective amount of the promoter (CeO2) were dissolved into 50 mL of distilled water under sonication for 30 min and later by magnetic stirring for 30 min. Sequentially, 0.8 g NaOH was dissolved in 50 mL of distilled water and added to the mixture dropwise. In the next step, 0.7045 g of C6H8O6 as a reducing agent, was added to the mixture and kept constantly stirring for 30 min. Then, the CeO2-promoted Cu2O catalysts were centrifuged at 4000 rpm for 5 min and washed three times with excess ethanol. Finally, they were dried overnight in an oven at 80 °C. A non-promoted Cu2O was also synthesized using the same procedure.
Preparation of gas diffusion electrode (GDE)
The GDE usually consists of a gas diffusion layer (GDL) on which a catalytic layer is deposited. The carbon-based GDL (Freudenberg H23C6) was used as the support. A catalytic ink was formulated by mixing 20 mg of the as-prepared catalyst, 0.5 mL of ethanol absolute and 140 μL of Nafion® perfluorate. The ink deposition on the GDL was performed using the spray coating technique. The catalyst loading mass was fixed to 1 ± 0.05 mg cm−2 according to the previous control test, see Fig. SI1 (ESI†). After the catalyst deposition, GDEs were dried at room temperature. The GDEs were denoted as Cu2O, Cu2O–5CeO2-C, Cu2O–10CeO2-C, Cu2O–15CeO2-C, Cu2O–20CeO2-C, CeO2-C, Cu2O–5CeO2-R, and CeO2-R. Fig. SI2 (ESI†) shows a systematic representation of the catalyst and GDE preparation.CO2 electroreduction set-up
The electrocatalytic tests were carried out using a compact H-type electrochemical cell.35 The cell is shown in Fig. SI3 (ESI†), and included a current collector made of stainless steel with a built-in spiral flow field, which connected the cathode compartment and the GDE of the cell and guaranteed homogeneous distribution of the inlet reactants. In the first series of experiments, the influence of the promoter phase (CeO2) was investigated using a CO2 flow rate of 200 mL min−1, which was adjusted by a manual flow meter (FR2000, Key Instruments). The working gas diffusion electrodes had a projected area of 1 cm2 to the 1 M KOH aqueous electrolyte, while a platinum square mesh of 1 × 1 cm2 was used as the counter electrode, located at the anode compartment and separated from the catholyte compartment by a proton exchange membrane (PEM, Nafion® 115) and immersed in 1 M KOH aqueous electrolyte. The total volume of the electrolyte was 150 mL. The reference electrode was an Hg/HgO (1 M NaOH) electrode. The potential values were then translated into RHE (reversible hydrogen electrode) voltages by using eqn (1) and verified by a hydrogen reference electrode (Hydroflex®(M-v01-0071)). | (1) |
For each electrode, the faradaic efficiency (FE) was evaluated by varying the current density from −50 to −300 mA cm−2 (Δj = −50 mA cm−2) and using cronopotentiometry (PGSTAT204, Metrohm-Autolab). At each current density, the presence of gas products from the cathode outlet stream was examined for 5 minutes. During this time, the volume of the outlet products was measured and then analysed using an on-line gas chromatography (Shimadzu GC 2030) equipped with a Porapak Q 80/100 column. The gases (H2, CO, CH4 and C2H4) were detected using a thermal conductivity detector (TCD) and a flame ionization detector (FID).
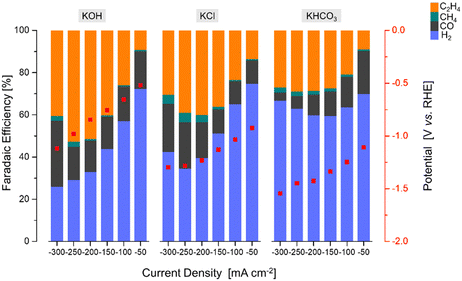
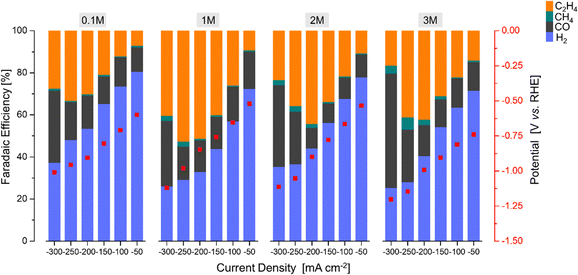
After the identification of the most promising Ce-promoted copper-based GDE, the influence of the KOH concentration (0.1 M–3 M) and electrolyte type (KCl, KOH, KHCO3,) over the optimized Cu2O–5CeO2-C GDE was additionally investigated to find the most effective electrolyte conditions. Finally, a stability test was performed at the selected reaction conditions (j = −250 mA cm−2, electrolyte = 1 M KOH, FCO2 = 200 mL min−1).
The FEX of the X obtained products, such as C2H4, CH4, CO and H2, were estimated by using the following equation (eqn 2):
 | (2) |
![[thin space (1/6-em)]](https://www.rsc.org/images/entities/char_2009.gif) 485 C mol−1).
485 C mol−1).
Catalyst characterization
The series of catalysts sprayed on the carbon-based gas diffusion layer were characterized by different physico-chemical techniques like scanning electron microscopy-energy dispersive X-ray spectroscopy (SEM-EDX), transmission electron microscopy (TEM), X-ray diffraction (XRD), and Raman and photoelectron spectroscopy (XPS).The surface morphology and elemental composition were investigated using a JEOL JSM-7200F high-resolution SEM equipped with an EDX detector (Oxford instruments) and AZtecEnergy software. Prior to EDX analysis, catalysts were fixed over an aluminium holder. Elemental analysis was carried out at 20 kV and restricted to Cu, Ce, and O to avoid inconsistent results. TEM images were recorded on a FEI Tecnai T12 electron microscope operating at 120 kV. The powder samples were dispersed by ultrasound in ethanol. Suspension drops were deposited on a holey carbon-coated copper grid of 300 mesh and then dried in air.
The crystal structure of the catalysts was examined using a Bruker type XRD D2 Phaser diffractometer. X-ray powder diffraction patterns were acquired by applying a Cu Kα radiation (λ = 1.5406 Å), a voltage of 40 kV, and a current of 40 mA. Continuous scans were collected over the 2θ range of 10° to 80°. The crystalline phases present in the samples were identified by comparison with reference patterns available in the JCPDS database. The crystallite sizes of the main Cux species (Cu2O, CuO and Cu0) and cerium oxide (CeO2) were estimated using the Scherrer's equation at 2θ = 36.46° for Cu2O (111), 38.76° for CuO (111), 43.32° for Cu (111), and 28.53° for CeO2 (111); D = (Kλ/β![[thin space (1/6-em)]](https://www.rsc.org/images/entities/char_2009.gif) cos
cos![[thin space (1/6-em)]](https://www.rsc.org/images/entities/char_2009.gif) θ), where λ is the X-ray wavelength, β is the full width of the diffraction line at half maximum (FWHM), and θ is the Bragg angle.
θ), where λ is the X-ray wavelength, β is the full width of the diffraction line at half maximum (FWHM), and θ is the Bragg angle.
Raman measurements were recorded on a Raman spectrometer (Horiba LabRAM HR800) equipped with a CCD detector, using a laser with a wavelength of 532 nm as the excitation source. The Raman spectra were obtained using a x50LWD objective with an incident power of 0.1 mW (5 acquisitions, 60 s of exposure time).
X-ray photoelectron spectroscopy (XPS) experiments were performed in a PHI 5500 Multitechnique System (from Physical Electronics) with a monochromatic X-ray source (Al Kα 1486.6 eV).
Results and discussion
Characterization
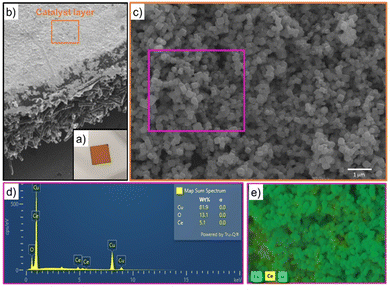
SEM images displayed in Fig. SI4 (ESI†) evidenced that the formation of particles with cubic-like morphology was achieved for both the active phase (Cu2O) and promoter phase (CeO2-C) prepared at 240 °C. In the case of CeO2-R prepared at 80 °C, its morphology was not possible to identify by SEM because the particle sizes were below the detection limits. When the electrocatalysts were synthetised in the presence of CeO2-C, a catalytic system composed of particles with a cubic shape was also achieved for the series of CeO2-C-promoted Cu2O-based catalyst. Furthermore, EDX analysis performed over all catalysts proved the presence of their main components (Cu, Ce, and O). As a representative example, the EDX elemental mapping image exhibited in Fig. 1 demonstrated the experimental composition (82 wt% Cu, 5 wt% Ce, and 13 wt% O) and interaction between the cubic particles of the Cu2O–5CeO2-C catalyst.A summary of the elemental composition of all the as-prepared catalysts is shown in Table 1. The experimental composition of the CeO2 promoter phase falls within the range of 6–21 wt% ± 1, which closely matches the theoretical values. On the other hand, a slight difference in the elemental composition was mainly identified between the two synthesized promoters (CeO2-R (81 wt% Ce and 19 wt% O) and CeO2-C (83 wt% Ce and 17 wt% O)), suggesting the possible presence of different oxidation state of cerium (Ce3+ and Ce4+) over these samples. Therefore, the used temperature for the synthesis of CeO2 nanoparticles can be a key parameter for the generation of Ce3+ and Ce4+.
| Sample | Elemental composition | ||
|---|---|---|---|
| Cu | Ce | O | |
| [wt% ±2] | |||
| Cu2O | 89 | — | 11 |
| Cu2O–5CeO2-C | 82 | 5 | 13 |
| Cu2O–10CeO2-C | 75 | 9 | 16 |
| Cu2O–15CeO2-C | 70 | 12 | 18 |
| Cu2O–20CeO2-C | 62 | 17 | 21 |
| CeO2-C | — | 83 | 17 |
| CeO2-R | — | 81 | 19 |
| Cu2O–5CeO2-R | 81 | 4 | 15 |
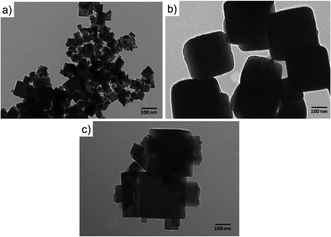
The cubic-like morphology of the CeO2-C promoter (Fig. 2(a)) and pristine Cu2O (Fig. 2(b)) was additionally confirmed by TEM. Regarding the CeO2-R, rod-like morphologies with particle sizes of ∼8 nm and irregular length can be identified, see Fig. SI5 (ESI†). Between cubic particles, the main difference observed was the size. The cubic CeO2-C particles (∼29 nm) were smaller than cubic Cu2O particles (∼165 nm). The interaction between the CeO2-C and Cu2O particles was clearly detected over a series of Cu2O–CeO2-C catalysts. Fig. 2(c) is an example of the strong Cu2O–CeO2 interaction achieved over the Cu2O catalyst promoted by 5 wt% CeO2-C. For this CeO2-C-promoted Cu2O catalyst, a decrease in the Cu2O particle sizes was found, suggesting that the addition of CeO2 during the synthesis inhibits the growth of Cu2O particles. The average particle sizes estimated for CeO2-C and Cu2O were 43 nm and 160 nm, respectively.
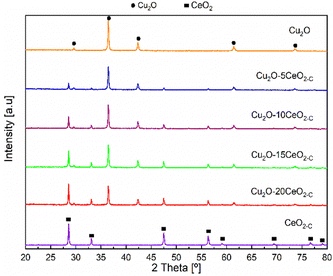
The XRD patterns of the CeO2-C promoter, pristine Cu2O and the series of CeO2-C-promoted Cu2O are shown in Fig. 3. The XRD profiles confirmed the phase purity of the polycrystalline CeO2 (JCPDS: 00-034-0394) and Cu2O (JCPDS: 00-005-0667). For the CeO2-C sample, the high-intensity reflections are observed at 2θ = 28.53, 33.09, 47.48, 56.33, 59.08, 69.41, 76.69, and 79.04° corresponding to the CeO2 (111), (200), (220), (311), (222), (400), (331), (420) lattice planes. On the other hand, the diffraction peak at around 2θ = 29.61, 36.46, 42.34, 61.42, and 73.56° represent the Cu2O (110), (111), (200), (220), and (311) lattice planes. Over the series of Cu2O–CeO2-C catalysts, CeO2 and Cu2O reflections were identified at a similar 2θ position, but with differences in their relative intensity, in agreement with the composition. With higher CeO2 content, the intensity of the reflections of CeO2 increased, while the reflections of Cu2O were decreased. Compared to CeO2-C promoter, the XRD profiles of CeO2-R suggested that the sample appeared to be composed of small particles. Only four reflections were identified for the CeO2-R. As can be seen in Fig. SI6 (ESI†), the reflections related to CeO2 phase in the Cu2O–CeO2-R were under the detection limit. These reflections were identified at 2θ = 28.53, 33.09, 47.48, 56.33° and associated to the CeO2 (111), (200), (220), (311) lattice planes.
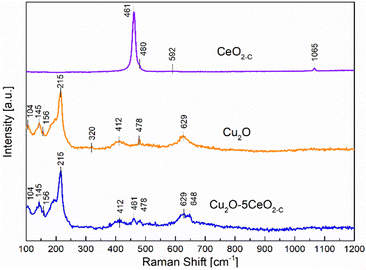
On the other hand, Raman spectroscopy analysis was additionally performed over the most promising fresh samples (CeO2-C, Cu2O, and Cu2O–5CeO2-C) taking into consideration that the formation of defective sites can be interpreted by the alteration in M–O vibration frequency after CeO2 introduction to the Cu2O structure. Fig. 4 proved that the fluorite-type cubic crystal structure of ceria in the CeO2-C sample exhibits one first-order Raman active fundamental mode located at 461 cm−1.36 This F2g mode was associated with the symmetric vibrations of oxygen ions around Ce4+ ions in octahedral Ce–O8.37 The bands at 480 and 592 cm−1 were attributed to the oxygen vacancies due to the presence of reduced Ce3+ cations (Ce3+O8)38 and the vacancy-interstitial Frenkel-type oxygen intrinsic defects in pure ceria,39 respectively. Additionally, solid-state phonons assigned to second-order features 2ωR(X) were observed at 1065 cm−1.40
In the non-promoted Cu2O sample, the most intense Raman peak identified at 215 cm−1 was related to the second-order overtone 2Γ12−.41 The remaining Raman bands were assigned as follows: an inactive mode Γ12− at 104 cm−1, an IR active mode Γ15(1) (LO) at 145 cm−1, a fourth order overtone 4Γ12− at 412 cm−1, and an IR active mode Γ15(1) (TO) at 629 cm−1.42–44 In addition to the prominent peaks observed for Cu2O, a weak band was also observed at 320 cm−1, which corresponds to the Ag mode of CuO.45 On the other hand, the introduction of CeO2 into the Cu2O structure induced the formation of a new extrinsic MO8 site capable of delivering oxygen under reducing conditions, i.e. part of a Frenkel defect.46 This new Raman peak identified over the Cu2O–5CeO2-C catalyst located at 648 cm−1 can be probably an effect of the strong interaction between Cu+ and Ce3+ cations.47 Furthermore, the presence of the CuO phase was not identified in comparison with the Cu2O sample, implying that CeO2 avoids overoxidation of Cu2O and preserves the Cu(I) oxidation state.
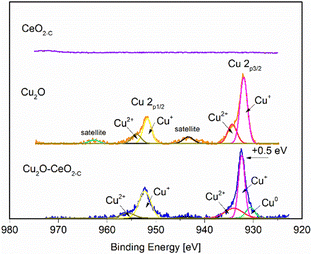
The surface elemental composition and chemical state of the fresh CeO2-C, Cu2O and Cu2O–5CeO2-C samples were examined by X-ray photoelectron spectroscopy. The survey scan in Fig. SI7 (ESI†) shows the presence of C, Cu, Ce and O. The C 1s peak at 284.4 eV was used as a reference peak for calibration of all the spectra. The high-resolution XPS spectra of Cu 2p are presented in Fig. 5. The peaks at 932.1 eV and 951.9 eV were linked to Cu+ 2p3/2 and Cu+ 2p1/2, respectively. Furthermore, characteristic shoulder peaks can also be resolved at 934.8 and 954.8 eV, which were associated with Cu2+ 2p1/2 and Cu2+ 2p3/2, respectively. The presence of satellite peaks at the binding energies of 943.4 indicated that Cu(I) was the major valence state for Cu species.48
The peaks of the Cu2O–5CeO2-C nanocomposites shift in the direction of high binding energy compared with that of the Cu2O nanocrystals. The difference between the two peaks is 0.5 eV from the binding energy, which indicates that there is an electronic exchange between Cu2O and CeO2. In particular, the Cu0 phase was identified in the Cu2O–5CeO2-C sample, suggesting that CeO2 promotes the reduction of CuO. Regarding the CeO2 phase (see Fig. SI8, ESI†), peaks at 881.9, 888.1, 897.9, 899.8, 901.8, and 916.1 eV were only detected in the Ce 3d spectrum of the CeO2 sample, corresponding to the binding energies of Ce4+ 3d5/2, Ce3+ 3d5/2, SU1, Ce4+ 3d3/2, SU2, and Ce3+ 3d3/2, respectively.49 Fig. SI9 (ESI†) depicts the high-resolution O 1s spectra of the different catalysts. The characteristic peaks resolved in the binding energy range of 534.6 to 526.3 eV were assigned to lattice oxygen (Olat) and oxygen vacancies (OVs).50,51 Compared to Cu2O, the relative proportion of oxygen vacancies was higher for the Cu2O–5CeO2. The Ovs are renowned for their possession of weakly bound electrons, serving as exceptional Lewis base sites for CO2 adsorption. These electrons contribute to the formation of the CO2˙− intermediate by providing electron donation.52,53 Therefore, this indicates that the Cu2O–5CeO2 exhibits the strongest ability for CO2 adsorption and subsequent electrochemical reduction.
CO2RR
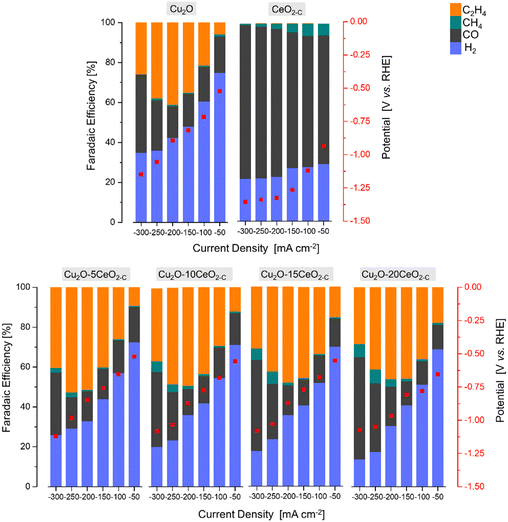 | ||
| Fig. 6 The faradaic efficiency [%] and potential [V vs. RHE] as a function of the current density [mA cm−2] over the series of Cu2O-based GDEs. | ||
The product formation on the CeO2-C electrode starts at approximately −0.93 V vs. RHE, see Fig. 6. The achieved faradaic efficiencies (FEs) for C2H4 were lower compared to the FEs for other sub-products such as H2, CO, and CH4. The maximum FEC2H4 observed for this electrode was 0.6% at −1.34 V vs. RHE, and this was achieved at a high current density (j = −250 mA cm−2). In contrast, when the current densities exceeded −150 mA cm−2, a noticeable increase in FECO (>75% at −1.33 V vs. RHE) and a decrease in FECH4 (<3% at −1.33 V vs. RHE) were observed. Comparing with the CeO2-C electrode, the Cu2O electrode exhibited a maximum FEC2H4 of approximately 41% at −0.87 V vs. RHE, which was achieved at a current density of −200 mA cm−2. The onset potential for C2H4 formation (approximately −0.52 V vs. RHE) was lower compared to the CeO2-C electrode.
The observed behaviour of faradaic efficiencies (FEs) for the Cu2O–CeO2-C series indicates that a lower amount of the CeO2 promoter is favoured to enhance C2H4 production. In this case, the potential at which C2H4 formation starts ranged between −0.52 and −0.67 V vs. RHE. It is noteworthy that the maximum FEs for C2H4 were shifted towards lower current densities due to the increased CeO2 loading. Furthermore, the FECO and FECH4 increased, while FEH2 decreased with both increasing CeO2 loading and current density. Among the Cu2O–CeO2-C electrodes, Cu2O with 5 wt% of CeO2-C was determined to be the optimum electrode for C2H4 production. It achieved a maximum FEC2H4 of approximately 53% at −0.98 V vs. RHE, at a current density of −250 mA cm−2.
To investigate the influence of the CeO2 particle morphology, a CO2RR test was conducted using rod-like ceria particles (CeO2-R) with the optimized promoter content of 5 wt% (previously found for cubic-like ceria particles, CeO2-C), under the same reaction conditions (1 M KOH, j = −50 to −300 mA cm−2). Fig. SI10 and SI11 (ESI†) revealed that the FEs for C2H4 formation are dependent on the shape of the promoter particles.
In the CeO2-R promoter electrode, the main products observed were CO, H2, CH4, and C2H4, similar to the CeO2-C promoter. However, compared to CeO2-C, the CeO2-R electrode required a more negative potential (−0.94 V vs. RHE) to initiate C2H4 formation. Furthermore, the maximum FE for C2H4 (∼0.15% at −1.26 V vs. RHE) over CeO2-R was detected at a current density of −150 mA cm−2. This suggests that the rod-like ceria morphology is less favourable for C2H4 production, as a higher potential was achieved at relatively low current densities. Regarding the FEs for other subproducts, CeO2-R exhibited a lower FE for CO and higher FE for H2 and CH4 compared to CeO2-C, as shown in Fig. SI10 (ESI†).
On the other hand, the combination of Cu2O with CeO2-R did not have a positive effect on enhancing the faradaic efficiency for C2H4, see Fig. SI11 (ESI†). The maximum FEC2H4 achieved over the Cu2O–CeO2-R electrode was only ∼50% at −0.90 V vs. RHE. This low faradaic efficiency can be attributed to the insignificant promotion of CO2 and H2O activation by the presence of CeO2-R, as shown in Fig. SI9 (ESI†). Therefore, the results suggest that CeO2-C promotes more suitable activation of both CO2 and H2O molecules, which is crucial for ensuring the selective formation of C2H4. It should be noted that the optimum catalyst exhibits a low cathodic polarization compared to pristine Cu2O (Fig. SI12, ESI†) attributed to the local CO formation at the CeO2-C promoter and simultaneous CO2 and CO electroreduction. Thus, the combination of Cu2O with CeO2-C demonstrates improved performance in terms of FEC2H4 compared to Cu2O–CeO2-R.
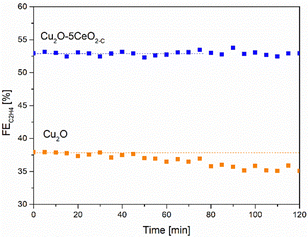 | ||
| Fig. 9 C2H4 FE [%] as a function of the time [min] over the Cu2O–5CeO2-C GDE. Reaction conditions: electrolyte = 1 M KOH and j = −250 mA cm−2. | ||
In contrast, when using non-promoted Cu2O, the initial FEC2H4 reached a maximum value of approximately 38% at −1.05 V vs. RHE but experienced partial deactivation after 45 minutes. The FE for C2H4 on the Cu2O electrode decreased by approximately 5%. Notably, the FEs for CO and H2 increased as the FE for C2H4 and CH4 decreased on Cu2O (see Fig. SI14, ESI†).
Consistently with these experimental findings, the 5 wt% CeO2-C-promoted Cu2O demonstrated enhanced performance compared to the non-promoted Cu2O electrode in terms of ethylene production, aligning with the results obtained from linear sweep voltammetry (see Fig. SI15, ESI†). The Cu2O–5CeO2-C electrode exhibited a more positive onset potential than Cu2O, indicating that it was the most active catalyst for the CO2RR.
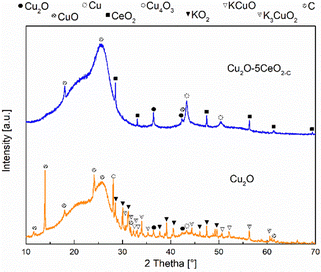
XRD measurements were also conducted on the Cu2O and Cu2O–5CeO2-C gas diffusion electrodes at different reaction times (t = 0 (before reaction: fresh), 5 and 120 min (after reaction: used)) to investigate the surface copper species during the stability test. In both the fresh and used electrodes, reflections at 18.15, 25.67, and 52.74° were attributed to the carbon phase (JCPDS: 00-047-0787 and 00-026-1076) of the carbon-paper support (see Fig. SI16, ESI†). Prior to sample activation (t = 0 min), characteristic reflections associated with the Cu2O phase were observed in both Cu2O (see Fig. SI17, ESI†) and Cu2O–5CeO2-C (Fig. SI18, ESI†) electrodes. Additionally, CeO2 was detected on the Cu2O–5CeO2-C electrode.
After a reaction time of 5 min, the intensity of reflections corresponding to Cu2O decreased in both gas diffusion electrodes, and two new phases, CuO (JCPDS: 01-078-0428) and metallic Cu0 (JCPDS: 00-004-0836), were identified. A similar behaviour was observed for the intensity of the reflections related to the CeO2 phase in the Cu2O–5CeO2-C electrode. However, two new phases, Cu4O3 (JCPDS: 00-033-0480) and K3CuO2 (JCPDS: 00-038-0971), were specifically identified in the Cu2O electrode.
At a total reaction time of 120 min (see Fig. 10), the reflections corresponding to CuO phases disappeared, and the intensity of reflections related to Cu2O and Cu0 decreased. Additionally, new reflections were observed in the Cu2O electrode, which were associated with the KCuO (JCPDS: 01-076-2437) and KO2 (JCPDS: 01-084-1972) phases. In contrast, the reflections of Cu2O–5CeO2-C remained like those identified at 5 min, indicating that CeO2 promoted the stability of the main copper species (Cu2O, CuO, and Cu0) involved in the CO2RR. These identified copper species were consistent with those detected through cyclic voltammetry measurements (see Fig. SI19, ESI†).
According to XRD analysis, the crystallite size of the main Cux = Cu2+, Cu+, and C0 species were modified after the reaction, see Table SI1 (ESI†). The increase of the Cu2O crystallite size for the non-promoted Cu2O catalyst was 15%, while for the Cu2O–5CeO2-C it was 1%. For Cu2O–5CeO2-C, the CeO2 crystallite sizes were also slightly increased by 8%. Furthermore, the crystallite size corresponding to the Cu phase (20 nm) was higher for the Cu2O sample. Therefore, the poor stability of the Cu2O catalyst can result in the increase of the crystallite sizes of the main copper species.
Additionally, SEM-EDS analysis was performed after the reaction to verify the catalyst composition, see Table SI2 (ESI†). Besides the main elements (Cu, Ce, and O), the potassium (K) phase was also detected on the surface of both used catalysts. However, a clear modification of the catalyst composition was identified for used Cu2O. In this catalyst, the Cu phase decreased by 55% compared to its fresh estate. This behaviour can be related to the presence of the new KOx and KCuOx phases (see Fig. SI20, ESI†), in agreement with post-catalysis XRD results. Regarding the used Cu2O–5CeO2, its composition was slightly modified, suggesting that CeO2-C (see Fig. SI21, ESI†) inhibits the formation of potassium species, which are negative for ethylene production.
Based on the electrochemical and catalyst characterization conducted before and after the reaction, it can be concluded that the interaction between Cu2O and CeO2 creates intrinsic sites (Cux–CeO2−x; Cux = Cu2+, Cu+, Cu0) for the binding of CO2 and H2O. The proposed mechanism, illustrated in Fig. 11(a), suggests that CO2 can be adsorbed around the Cux–CeO2−x interface and reduced to *CO on the CeO2−x site. This step is crucial as CO serves as the key intermediate for the production of C2+ products.30,33 Subsequently, *CO can undergo further reduction to C2H4 through enhanced *CO–*CO coupling, which occurs on Cux = Cu2+, Cu+, and Cu0 sites, with the assistance of H+ species derived from adsorbed H2O on Cu+–CeO2−x sites.30,54 Therefore, the improved and stable FEC2H4 achieved with the Cu2O–5CeO2-C catalyst supports the assertion that CeO2-C plays a significant role in the CO2RR. It promotes the formation of Cux–CeO2−x sites, which govern the activity, selectivity, and stability of C2H4 production by synergistically activating CO2 and H2O molecules.
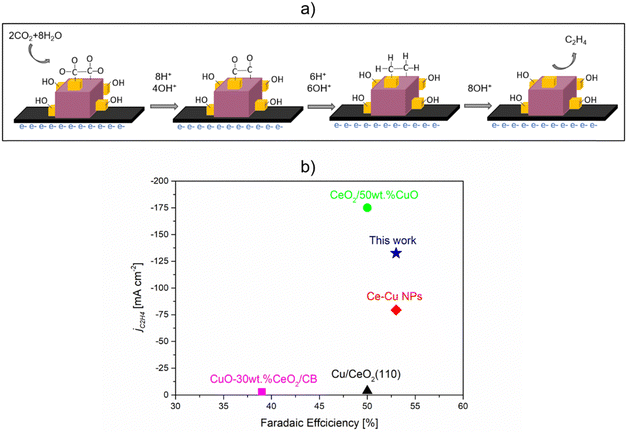 | ||
| Fig. 11 CO2RR to ethylene over Cu2O–5CeO2 GDE. (a) Plausible mechanism of CO2RR to C2H4. (b) Performance comparison with similar catalytic system reported in the literature. 0.1 M KHCO3 was used for CuO-30 wt% CeO2/CB31 and Cu/CeO2(100),31 while 1 M KOH was used for CeO2/50 wt% CuO,33 Ce–Cu NPs,32 and Cu2O-5 wt% CeO2 (this work). | ||
The performance comparison with catalysts shown in Fig. 11(b), in terms of faradaic efficiency (FE) and partial current density, indicates that Cu2O–5CeO2-C is a promising catalytic system for C2H4 production. Compared to other reported catalytic systems, Cu2O–5CeO2-C demonstrates a high FE for C2H4 (FEC2H4 ∼53%) at a high partial current density (jC2H4 = 132 mA cm−2). Additionally, one of the most significant advantages of Cu2O–5CeO2-C is that it requires a lower potential (−0.98 V vs. RHE) than the reported CeO2/50 wt% CuO system (−2.3 V vs. RHE) to operate at the same electrolyte concentration of 1 M KOH.33
Conclusions
This study investigated the influence of CeO2 promotion on the catalytic performance of Cu2O-based catalysts for the electrochemical reduction of CO2. The addition of the CeO2-C promoter phase was found to enhance the formation of C2H4, a valuable commercial product, during the CO2RR compared to the non-promoted Cu2O catalyst. The characterization techniques, including SEM, TEM, XRD, Raman spectroscopy, and X-ray photoelectron spectroscopy, provided valuable insights into the structural and compositional properties of the catalysts.The results indicated that the synthesized catalysts exhibited well-defined morphologies, with cubic-like particles for Cu2O and CeO2-C, and rod-like morphologies for CeO2-R. The XRD analysis confirmed the phase of Cu2O and CeO2, while Raman spectroscopy revealed characteristic peaks for both materials and a new peak indicating the interaction between Cu+ and Ce3+ cations. X-ray photoelectron spectroscopy further confirmed the presence of different copper oxidation states in the Cu2O-based catalysts.
The electrochemical evaluation of the catalysts demonstrated that the CeO2-C-promoted Cu2O-based gas diffusion electrodes (GDEs) exhibited higher faradaic efficiencies for C2H4 production compared to the non-promoted Cu2O GDE. The optimal loading of CeO2-C for maximum C2H4 production was determined to be 5 wt%. The proposed Cu2O–5CeO2-C GDE demonstrates enhanced and stable C2H4 production through the interaction of Cu2O and CeO2, creating active sites (Cux–CeO2−x; Cux = Cu2+, Cu+, Cu0) for the CO2RR. It exhibits high faradaic efficiency (FEC2H4 ∼ 53%) and partial current density (jC2H4 = 132 mA cm−2) at a low potential (−0.98 V vs. RHE) with 1 M KOH electrolyte, making it a promising catalyst. As an important fact, the FEs for C2H4 in the Cu2O–5CeO2-C GDE were found to be influenced by the type of electrolyte and its concentration.
These findings highlight the potential of CeO2 promotion in improving the selectivity and activity of Cu2O-based catalysts for the CO2RR. The study contributes to the understanding of the structure–property relationship in CO2 electrochemical conversion and provides a foundation for further development of more efficient catalysts.
Conflicts of interest
There are no conflicts to declare.Acknowledgements
This work was funded by AEI projects PID2019-108136RB-C33 and CNS2022-135235 (MCIN/AEI/10.13039/501100011033 and NextGenerationEU/PRTR). A. A. acknowledges the support from the Margarita Salas grant from the European Union – Next Generation EU through the Universitat de Barcelona.References
- C. Pappijn, M. Ruitenbeek, M. F. Reyniers and K. Van Geem, Front. Energy Res., 2020, 8, 557466 Search PubMed.
- G. L. De Gregorio, T. Burdyny, A. Loiudice, P. Iyengar, W. A. Smith and R. Buonsanti, ACS Catal., 2020, 10, 4854–4862 CrossRef CAS PubMed.
- B. Zhang, J. Zhang, M. Hua, Q. Wan, Z. Su, X. Tan, L. Liu, F. Zhang, G. Chen, D. Tan, X. Cheng, B. Han, L. Zheng and G. Mo, J. Am. Chem. Soc., 2020, 142, 13606–13613 CrossRef CAS PubMed.
- J. Kim, W. Choi, J. W. Park, C. Kim, M. Kim and H. Song, J. Am. Chem. Soc., 2019, 141, 6986–6994 CrossRef CAS PubMed.
- D. Tan, J. Zhang, L. Yao, X. Tan, X. Cheng, Q. Wan, B. Han, L. Zheng and J. Zhang, Nano Res., 2020, 13, 768–774 CrossRef CAS.
- A. Zahid, A. Shah and I. Shah, Nanomaterials, 2022, 12, 1380 CrossRef CAS PubMed.
- W. Liu, P. Zhai, A. Li, B. Wei, K. Si, Y. Wei, X. Wang, G. Zhu, Q. Chen, X. Gu, R. Zhang, W. Zhou and Y. Gong, Nat. Commun., 2022, 13, 1877 CrossRef CAS PubMed.
- Y. Jiang, C. Choi, S. Hong, S. Chu, T. S. Wu, Y. L. Soo, L. Hao, Y. Jung and Z. Sun, Cell Rep. Phys. Sci., 2021, 2, 100356 CrossRef CAS.
- W. Fu, Z. Liu, T. Wang, J. Liang, S. Duan, L. Xie, J. Han and Q. Li, ACS Sustainable Chem. Eng., 2020, 8, 15223–15229 CrossRef CAS.
- W. Lin, H. Chen, Z. Li, K. Sasaki, S. Yao, Z. Zhang, J. Li and J. Fu, ChemSusChem, 2021, 14, 3190–3197 CrossRef CAS PubMed.
- R. M. Arán-Ais, F. Scholten, S. Kunze, R. Rizo and B. Roldan Cuenya, Nat. Energy, 2020, 5, 317–325 CrossRef.
- Q. Zhu, X. Sun, D. Yang, J. Ma, X. Kang, L. Zheng, J. Zhang, Z. Wu and B. Han, Nat. Commun., 2019, 10, 3851 CrossRef PubMed.
- Y. Gao, Q. Wu, X. Liang, Z. Wang, Z. Zheng, P. Wang, Y. Liu, Y. Dai, M. Whangbo and B. Huang, Adv. Sci., 2020, 7, 1902820 CrossRef CAS PubMed.
- J. Bugayong and G. L. Griffin, ECS Trans., 2013, 58, 81–89 CrossRef.
- A. Vasileff, C. Xu, Y. Jiao, Y. Zheng and S. Z. Qiao, Chem, 2018, 4, 1809–1831 CAS.
- X. Wang, S. Liu, H. Zhang, S. Zhang, G. Meng, Q. Liu, Z. Sun, J. Luo and X. Liu, Chem. Commun., 2022, 58, 7654–7657 RSC.
- X. Zhao, H. Xie, B. Deng, L. Wang, Y. Li and F. Dong, Chem. Commun., 2024, 60, 542–545 RSC.
- J. Wang, Z. Li, C. Dong, Y. Feng, J. Yang, H. Liu and X. Du, ACS Appl. Mater. Interfaces, 2019, 11, 2763–2767 CrossRef CAS PubMed.
- D. Meng, M. Zhang, D. Si, M. Mao, Y. Hou, Y. Huang and R. Cao, Angew. Chem., Int. Ed., 2021, 60, 25485–25492 CrossRef CAS PubMed.
- T. T. H. Hoang, S. Verma, S. Ma, T. T. Fister, J. Timoshenko, A. I. Frenkel, P. J. A. Kenis and A. A. Gewirth, J. Am. Chem. Soc., 2018, 140, 5791–5797 CrossRef CAS PubMed.
- I. Merino-Garcia, J. Albo, J. Solla-Gullón, V. Montiel and A. Irabien, J. CO2 Util., 2019, 31, 135–142 CrossRef CAS.
- A. Alarcón, J. Guilera, R. Soto and T. Andreu, Appl. Catal., B, 2020, 263, 118346 CrossRef.
- T. Montini, M. Melchionna, M. Monai and P. Fornasiero, Chem. Rev., 2016, 116, 5987–6041 CrossRef CAS PubMed.
- F. Wang, M. Wei, D. G. Evans and X. Duan, J. Mater. Chem. A, 2016, 4, 5773–5783 RSC.
- C. Yang, Y. Lu, L. Zhang, Z. Kong, T. Yang, L. Tao, Y. Zou and S. Wang, Small Struct., 2021, 2, 2100058 CrossRef CAS.
- S. B. Varandili, J. Huang, E. Oveisi, G. L. De Gregorio, M. Mensi, M. Strach, J. Vavra, C. Gadiyar, A. Bhowmik and R. Buonsanti, ACS Catal., 2019, 9, 5035–5046 CrossRef CAS.
- X. Zong, J. Zhang, J. Zhang, W. Luo, A. Züttel and Y. Xiong, Electrochem. Commun., 2020, 114, 106716 CrossRef CAS.
- Z. Zhao, X. Li, J. Wang, X. Lv and H. Bin Wu, J. CO2 Util., 2021, 54, 101741 CrossRef CAS.
- X. Yan, C. Chen, Y. Wu, S. Liu, Y. Chen, R. Feng, J. Zhang and B. Han, Chem. Sci., 2021, 12, 6638–6645 RSC.
- S. Chu, X. Yan, C. Choi, S. Hong, A. W. Robertson, J. Masa, B. Han, Y. Jung and Z. Sun, Green Chem., 2020, 22, 6540–6546 RSC.
- S. L. Chu, X. Li, A. W. Robertson and Z. Y. Sun, Acta Phys.-Chim. Sin., 2021, 37, 2009023 Search PubMed.
- J. Shan, Y. Shi, H. Li, Z. Chen, C. Sun, Y. Shuai and Z. Wang, Chem. Eng. J., 2022, 433, 133769 CrossRef CAS.
- S. Wang, H. Chen, W. Lin, W. Zhou, X. Lv, J. Wang and J. Fu, Ind. Eng. Chem. Res., 2022, 61, 16445–16452 CrossRef CAS.
- R. M. Arán-Ais, R. Rizo, P. Grosse, G. Algara-Siller, K. Dembélé, M. Plodinec, T. Lunkenbein, S. W. Chee and B. Roldan Cuenya, Nat. Commun., 2020, 11, 3489 CrossRef PubMed.
- S. C. Perry, S. M. Gateman, R. Malpass-Evans, N. McKeown, M. Wegener, P. Nazarovs, J. Mauzeroll, L. Wang and C. Ponce de León, Chemosphere, 2020, 248, 125993 CrossRef CAS PubMed.
- S. Loridant, Catal. Today, 2021, 373, 98–111 CrossRef CAS.
- N. Kainbayev, M. Sriubas, D. Virbukas, Z. Rutkuniene, K. Bockute, S. Bolegenova and G. Laukaitis, Coatings, 2020, 10, 432 CrossRef CAS.
- C. Schilling, A. Hofmann, C. Hess and M. V. Ganduglia-Pirovano, J. Phys. Chem. C, 2017, 121, 20834–20849 CrossRef CAS.
- E. Sartoretti, C. Novara, F. Giorgis, M. Piumetti, S. Bensaid, N. Russo and D. Fino, Sci. Rep., 2019, 9, 3875 CrossRef PubMed.
- R. Zamiri, H. Abbastabar Ahangar, A. Kaushal, A. Zakaria, G. Zamiri, D. Tobaldi and J. M. F. Ferreira, PLoS One, 2015, 10, e0122989 CrossRef PubMed.
- H. Solache-Carranco, G. Juárez-Díaz, M. Galván-Arellano, J. Martínez-Juárez, G. Romero-Paredes and R. Peña-Sierra, in 5th International Conference on Electrical Engineering, Computing Science and Automatic Control (CCE 2008), IEEE, 2008.
- A. Singhal, M. R. Pai, R. Rao, K. T. Pillai, I. Lieberwirth and A. K. Tyagi, Eur. J. Inorg. Chem., 2013, 2640–2651 CrossRef CAS.
- A. Sahai, N. Goswami, S. D. Kaushik and S. Tripathi, Appl. Surf. Sci., 2016, 390, 974–983 CrossRef CAS.
- C. Lu, Z. Li, L. Ren, N. Su, D. Lu and Z. Liu, Sensors, 2019, 19, 2926 CrossRef CAS PubMed.
- L.-C. Chen, C.-C. Chen, K.-C. Liang, S. H. Chang, Z.-L. Tseng, S.-C. Yeh, C.-T. Chen, W.-T. Wu and C.-G. Wu, Nanoscale Res. Lett., 2016, 11, 402 CrossRef PubMed.
- M. Dosa, M. Piumetti, S. Bensaid, T. Andana, C. Novara, F. Giorgis, D. Fino and N. Russo, Catal. Lett., 2018, 148, 298–311 CrossRef CAS.
- A. Nakajima, A. Yoshihara and M. Ishigame, Phys. Rev., 1994, 50(18), 13297–13307 CAS.
- Y. Wang, Y. Lü, W. Zhan, Z. Xie, Q. Kuang and L. Zheng, J. Mater. Chem. A, 2015, 3, 12796–12803 RSC.
- Y. Tian, X. Fei, H. Ning, W. Wang, X. Tan, X. Wang, Z. Ma, Z. Guo and M. Wu, Front. Chem., 2022, 10, 915759 CrossRef CAS PubMed.
- Y. Wang, Y. Lü, W. Zhan, Z. Xie, Q. Kuang and L. Zheng, J. Mater. Chem. A, 2015, 3, 12796–12803 RSC.
- A. Dey, G. Chandrabose, L. A. O. Damptey, E. S. Erakulan, R. Thapa, S. Zhuk, G. K. Dalapati, S. Ramakrishna, N. S. J. Braithwaite, A. Shirzadi and S. Krishnamurthy, Appl. Surf. Sci., 2021, 541, 148571 CrossRef CAS.
- Z. Gu, N. Yang, P. Han, M. Kuang, B. Mei, Z. Jiang, J. Zhong, L. Li and G. Zheng, Small Methods, 2019, 3, 1800449 CrossRef.
- T. Wei, S. Zhang, Q. Liu, Y. Qiu, J. Luo and X. Liu, Acta Phys.-Chim. Sin., 2022, 202207026 Search PubMed.
- Y. Wu, C. Chen, X. Yan, S. Liu, M. Chu, H. Wu, J. Ma and B. Han, Green Chem., 2020, 22, 6340–6344 RSC.
Footnote |
| † Electronic supplementary information (ESI) available. See DOI: https://doi.org/10.1039/d3ma01009k |
| This journal is © The Royal Society of Chemistry 2024 |

