
 Open Access Article
 This Open Access Article is licensed under a
 Creative Commons Attribution 3.0 Unported Licence
A histidine-functionalized ROS scavenging hybrid nanozyme for therapeutic application in Parkinson's disease pathogenesis†
Sanjay
Prasad‡
,
Parth Sarathi
Nayak‡
and
Patrick
D'Silva
 *
*
Department of Biochemistry and Inorganic & Physical Chemistry, Indian Institute of Science, Bangalore – 560012, India. E-mail: Patrick@iisc.ac.in
First published on 24th January 2024
Abstract
Oxidative stress-mediated neurotoxicity is one of the significant molecular consequences in the progression of neurodegenerative diseases like Parkinson's disease (PD). Although many genetic mutations are implicated in developing familial and sporadic PDs, the progressive degeneration of dopaminergic neurons still lacks therapeutic intervention. Biocompatible nanomaterials with enzyme-like characteristics, especially SOD1 activity to scavenge excessive reactive oxygen species, can serve as an effective tool to treat PD pathogenesis. Here we report novel histidine-functionalized zinc oxide nanoparticles (ZnNPs-H) and the corresponding copper-doped nanoparticles (ZnCuNPs-H) mimicking SOD1 activity. The functionalized NPs exhibit superior nanozyme activity by robust reactive oxygen species (ROS) scavenging potential compared to previously reported NPs in vitro. The functionalized NPs exhibited excellent biocompatibility in the neuronal cellular model and were targeted efficiently into mitochondrial compartments. The NPs showed robust superoxide dismutase nanozyme activity and scavenged the excess ROS upon rotenone and lung cancer screen-1 (LCS-1) treatment. The nanozyme effectively substituted the endogenous functions of SOD1 and reinstated the cellular redox homeostasis. Most importantly, the NPs rescued neuronal cells from the toxic effects of MPP+ conditions and restored the mitochondrial health associated with cellular morphology, highlighting their neuroprotective role in preventing Parkinson's disease pathogenesis, thus opening a therapeutic strategy for disease management.
1. Introduction
Reactive oxygen species (ROS) are generated as a natural by-product of cellular oxidative metabolism and through the mitochondrial respiration process. This includes superoxide anions (O2˙−), hydroxyl radicals (˙OH), peroxyl radicals (˙O2R) and singlet oxygen (1O2).1 The basal levels of ROS are essential to maintain cellular health through several intracellular signalling pathways. Redox homeostasis is maintained by well-defined cellular antioxidant machinery, which is at times overwhelmed by unregulated production under various pathological conditions leading to oxidative stress. The enhanced level of ROS can induce DNA damage, lipid peroxidation and protein modification, and underlines the denominator for various pathogeneses, such as cancer, cardiovascular diseases and neurodegenerative disease.2 Therefore, to maintain the redox equilibrium and keep the oxidative stress under check, which is critical for cellular homeostasis, we need to develop cytoprotective molecules against various neurodegenerative diseases caused by ROS. Parkinson's disease (PD) is one of the most studied neurodegenerative diseases linked to elevated cellular ROS levels resulting in selective degeneration of dopaminergic neurons in the substantia nigra par compacta and dopamine levels in the corpus striatum.3 The current clinical diagnosis is based on altered physical phenotypes such as resting tremor, bradykinesia, rigidity and postural instability.4 The development of PD is multifactorial, with 90% of cases being sporadic while 10% are linked to genetic predisposition. Although the precise etiology of PD remains elusive, many familial cases are connected to a single gene mutation in several gene loci, including SNCA, LRRK2, PARK7, PINK1 and PARK2 (parkin). In the context of familial PD, mitochondrial dysfunction is well established as one of the vital etiologies at the molecular level. For example, a mutation in PINK1 and Parkin actively disrupts the quality control process of mitochondria, which may result in autosomal recessive PD.5 Notably, the aid of oxidative stress, mitochondrial dysfunction, accumulation of iron ions, α-synuclein amyloidosis (Lewy body) and activation of the apoptotic cascade is the key determinant of dopaminergic neuron susceptibility in PD.6,7 Among all other mechanisms proposed to be involved in PD, mitochondrial dysfunction results in the chronic production of ROS, leading to unusual oxidative stress as the primary initiating event in the disease progression. Furthermore, the brain has a higher oxygen consumption rate and abundance of lipids, making it more vulnerable to ROS.8 Although no precise therapeutic intervention is available, increasing demand to design biocompatible materials to mimic the antioxidant machinery to regulate ROS-mediated damage to mitigate PD progression has been explored recently.Over the past decade, nanozymes with ROS scavenging properties have attracted significant attention in treating oxidative stress-related neurodegenerative diseases.9 Unlike natural enzymes, nanomaterial-based 'nanozymes' are more stable, often mimicking multiple cellular enzymes and providing unique catalytic activity in extreme pH and temperature conditions.10,11 For instance, Mn3O4, Cu2O and CeVO4 have been demonstrated to rescue cells from oxidative stress in PD conditions.12–14 Synthesis and surface capping methods overcome the drawbacks of traditional surface adsorption methods, including lower surface exposure and easy disassembly on interaction with the biological milieu. Functional groups like –NH3, –OH, –CH3, and –COOH are designed to functionalize the nanomaterial to impart unique properties like binding, ligand interaction, signaling and immunization.15,16 These chemical modifications of nanomaterials also help to promote their biocompatibility, bio-distribution, drug targeting and replacement of specific enzymes in living systems.17–19 To further enhance their specificity and reactivity at the cellular level, the present research is directed at developing nanozymes with the active site of natural enzymes that could mimic its catalytic center at atomic levels.20
In the current study, we report stable biocompatible histidine functionalized ZnNPs-H and ZnCuNPs-H nanomaterials with robust nanozyme activity compared to previously reported materials. The bio-functionalized NPs exhibit superior SOD1 activity in vitro and in cellular model systems. Importantly, these nanozymes demonstrate mitochondrial targeting efficacy and provide excellent organellar protection against elevated ROS levels mimicking PD-disease pathogenesis. These characteristics of bio-functionalized NPs are of great significance for the therapeutic management of PD progression.
2. Experimental section
2.1. Chemical
Zinc acetate dihydrate (Zn(CH3COO)2·2H2O), copper acetate (Cu(CH3COO)2), potassium hydroxide (KOH), a SOD detection assay kit, fluorescein-5-isothiocyanate (FITC)-F7250, histidine, aspartate, cysteine, serine, glutamate, arginine, bovine erythrocytes SOD1-574594, poly D-lysine (Sigma P6407-5mg) chloroauric acid-254169, manganese chloride (MnCl2), bovine serum albumin (BSA), 2-mercaptoethanol, sodium dodecyl sulfate (SDS), rotenone, LCS-1-SML0466, DAPI, 2′,7′-dichlorofluorescein diacetate-D6883 and MPP+ iodide (N-methyl-4-phenylpyridinium iodide-D048) were purchased from Sigma Aldrich, India. Agarose, ethylenediaminetetraacetate (EDTA), sodium dihydrogen phosphate (NaH2PO4) and disodium hydrogen phosphate (Na2HPO4) were purchased from Merck, India. Uranyl acetate was purchased from EMS. Polyvinylidene difluoride (PVDF) membrane was purchased from Millipore, India. The Plasmid Isolation Kit was purchased from Invitrogen, India. Bradford reagent and protein molecular ladders were purchased from Bio-Rad, India. Dulbecco's modified Eagle's medium (DMEM), glutamax-35050061, lipofectamine™ 2000-11668019, transfection reagent, trypsin-EDTA, fetal bovine serum (FBS), MitoSox-M36008, JC-1 dye-T3168 and penicillin–streptomycin (Pen-strep) were purchased from ThermoFisher Scientific, India. Bcl-2, p-Akt and β-actin were purchased from Santa Cruz Biotechnology. The Caspase-Glo 3/7 assay kit was purchased from Promega Corporation, Madison-G8090. Restriction endonuclease (BamHI, HindIII) was purchased from Takara Bio Inc., India. Carbon-coated copper grid-Lot#10101901810 was purchased from Ted Pella Inc, USA. All other reagents and chemicals were of analytical and molecular grade and used without further purification.2.2. Synthesis and functionalization of ZnNPs and Cu-doped ZnNPs (ZnCuNPs)
Pure ZnNPs and ZnCuNPs were prepared as described in a previous research article with further modification.21 Different percentages of copper (2.5%, 5%, 10% Cu) were doped into ZnO. Briefly, for the synthesis of ZnO nanoparticles, 0.05 M zinc acetate dihydrate (Zn(CH3COO)2·2H2O) was dissolved in 100 mL of dd H2O at 60 °C and kept stirring. To this, KOH at ten times the concentration of Zn(CH3COO)2·2H2O) was added and left for 3 h under stirring at 60 °C. The Cu-doped ZnO was prepared by the addition of appropriate amounts of copper acetate monohydrate (Cu(CH3COO)2·H2O) in aqueous solutions containing Zn(CH3COO)2·2H2O and the procedure mentioned above was repeated. The concentration of copper was varied as 2.5%, 5% and 10% with respect to that of Zn(CH3COO)2·2H2O.The functionalization of histidine over the nanoparticle surface was carried out during the synthesis of the nanoparticles. After 5 min of KOH addition, histidine (50 mM) was added to the reaction volume and the stirring at 60 °C was continued. However, Cu and histidine were added together during Cu-doped ZnNP synthesis. The formation of a colloidal suspension occurs faster in the case of histidine functionalization. The white nanoparticle suspension of histidine-functionalized ZnNPs and grey nanoparticle suspension of histidine-functionalized Cu-doped ZnNPs were allowed to cool down to room temperature. Thereafter, the nanoparticle suspension was washed thrice by centrifugation at 2000 rpm with double distilled (dd) H2O to remove the unadsorbed histidine molecules. The precipitated sample obtained was dried in a thermal vacuum furnace at 80 °C for 12 h. The dried sample was stored at room temperature and further used for characterization and antioxidant experiments. The residual histidine in the supernatant was again subjected to a ninhydrin test for its quantification. Briefly, the histidine molecules in the solution were mixed with 2% ninhydrin dissolved in water![[thin space (1/6-em)]](https://www.rsc.org/images/entities/char_2009.gif) :isopropanol (v/v) and heated for 15 min at 90 °C. The absorbance of color intensity was recorded at 570 nm and compared with the standard to determine the concentration of amino acid.
:isopropanol (v/v) and heated for 15 min at 90 °C. The absorbance of color intensity was recorded at 570 nm and compared with the standard to determine the concentration of amino acid.
2.3. Characterization of ZnNPs and Cu-doped ZnNPs
All the UV-Vis absorption spectra were acquired by using a Shimadzu UV-2600 spectrophotometer. The different concentrations of samples were dissolved in ethanol. Pure ethanol was used as a blank in a reference cell. Powder X-ray diffraction (PXRD) was recorded to check the phase purity and crystallinity of the materials on a Phillips PANalytical diffractometer using CuKα (λ = 1.5406 Å) radiation. The emission current of 30 mA and accelerating voltage of 40 kV were used during the PXRD measurement. The morphological analysis of the NPs was achieved by scanning electron microscopy (SEM). Briefly, the non-conductive materials are generally coated with an ultra-thin layer of electrically conductive material. After sputtering, the stubs were used for SEM imaging. The high-resolution transmission electron microscopy (HRTEM), X-ray mapping images and energy dispersive spectroscopy (EDS) were recorded on a JEOL transmission electron microscope operating at 200 kV. The nanoparticles were sonicated and loaded onto a formvar-coated copper grid to visualize in TEM. X-ray photoelectron spectroscopy (XPS) analyzes the energy of the electron based on the shell from which it is ejected. The spectrum obtained from the detector gives the details of binding energy versus counts. X-ray photoelectron spectroscopy (XPS) was performed using an AXIS Ultra, Kratos Analytical, Shimadzu. In Raman spectroscopy, increase, decrease or any shift in the Raman peaks depicts the molecular changes occurring in the sample.22 The spectra of the samples were recorded by a Raman spectrophotometer (Horiba LabRAM HR Evolution, Horiba JY, Japan). For the experiment a 785 nm laser was used at 50% power for 5 accumulations with 10 sec exposure time. The hydrodynamic size (using DLS) and surface potential of the NPs were determined using a zeta sizer (Nano Particle Analyzer SZ-100, HORIBA Scientific) upon dilution in deionized water followed by sonication. The quantitative analysis of the functionalized NPs was determined by ninhydrin assay. The ninhydrin test is a qualitative and quantitative chemical test performed to detect the presence of amino acids.23 This test involves the addition of a ninhydrin reagent to the test sample, resulting in the formation of deep blue color, often termed Ruhemann's purple, in the presence of an amino group. Briefly, a standard amino acid solution (0–500 μg) was prepared in respective labeled test tubes and dd water was added to make up the volume to 1 mL. 500 μL of ninhydrin reagent was added to all the test tubes including the labeled blank and unknown. Then all the test tubes were placed in a boiling water bath for 15 min. Finally, we recorded the absorbance of all the test tubes at 570 nm and plotted a standard curve to identify the unknown sample.2.4. Antioxidant analysis
Superoxide dismutase (SOD) is the most important antioxidant enzyme. It catalyzes the dismutation of superoxide anions (O2˙−) into molecular oxygen and hydrogen peroxide.24 There are several direct and indirect methods to determine the SOD activity. Nitroblue tetrazolium (NBT) is commonly used due to its convenience and ease, but the problem is that NBT is water-insoluble. Sigma Aldrich has developed a highly water-soluble Dojindo's tetrazolium salt, (WST)–1(2-(4-iodophenyl)-3-(4-nitrophenyl)-5-(2,4disulfophenyl)-2H-tetrazolium, monosodium salt) kit for SOD activity detection.12 The SOD assay Kit was purchased from Sigma Aldrich (CS0009). WST-1 produces a water-soluble formazan dye upon reduction with superoxide anions. The decrease in the formazan formation as a function of SOD activity at 440 nm was measured on a microplate reader (Tecan-Microplate Reader-Infinite 200 pro). The reduction rate by superoxide is linearly related to the xanthine oxidase (XO) activity and is inhibited by SOD.2.5. Cell culture and cell-viability assay (MTT assay)
N2a cells in a plate were washed with PBS and then trypsinized. To count the cells, 50 μL of cells from a 1 mL suspension (1:3) was taken and mixed well with 150 μL of trypan blue (0.4%) and kept for 5 min. 10 μL of this was put onto the hemocytometer and the cells were counted accordingly. For 96 well-plates, around 10000 cells; for 12 well-plates 40000 cells and for 6 well-plates around 50000 cells were seeded and incubated for 24 h in a CO2 incubator at 37 °C with 5% CO2.
The 3-(4,5-dimethylthiazol-2-yl)-2,5-diphenyltetrazolium bromide (MTT) assay is a colorimetric assay for assessing cell metabolic activity. Cellular NADPH oxidoreductase enzymes can reduce the tetrazolium dye (yellow) into insoluble purple formazan. A solubilizing agent such as DMSO is used to solubilize the formazan and then the concentration of this purple solution is measured at 570 nm. First 12 mM of MTT is made in PBS. The 96-well microtiter plate was aspirated and 90 μL of fresh medium was added to each well. 10 μL of freshly prepared MTT was added in the dark and the plate was covered with aluminium foil. It was incubated for two hours in a CO2 incubator for the formation of a purple formazan complex. The media was removed carefully without disturbing the complex formed and to it 100 μL of DMSO was added and shaken well. The plate was incubated for 15 min and then the plate was read at 570 nm in a microtiter plate reader.
2.6. Cellular internalization of NPs
ZnNPs/ZnCuNPs and ZnNPs-H/ZnCuNPs-H were tagged with FITC to detect the localization of the nanozyme in the N2a cells. Initially, NPs of 1 mg mL−1 stock were prepared in dd water (pH 7.2). 50 μL of FITC (1 μg mL−1) dissolved in anhydrous DMSO was added to 1 mL of nanozyme stock solution slowly in 10 μL aliquots with continuous stirring. The whole reaction was carried out in the dark and incubated for 8 h at 4 °C. After the incubation, ammonium chloride (NH4Cl) was added to a final concentration of 50 mM and further incubated for 2 h at 4 °C followed by the addition of glycerol (25% v/v). Finally, the completed reaction mixture was centrifuged at 10000 rpm for 45 min, followed by washing with deionized water to separate the untagged FITC. For the cell internalization assay, N2a cells were grown in advanced DMEM/F12 media supplemented with 10% FBS in an incubator with a continuous inflow of 5% CO2 at 37 °C. Approximately 1 million cells were seeded and the cells were treated with the FITC conjugated NPs with a concentration of 5 μg mL−1 and counterstained with 2 μg mL−1 DAPI to analyze the internalization. The subcellular localization of the NPs was analyzed using MTS-DsRed, where mitochondria were decorated with constitutively expressing MTS-DsRed vector, which precisely targets DsRed to mitochondria because of MTS's presence. MTS-DsRed DNA and lipofectamine were briefly added to opti-MEM (500 μL) in separate microfuge tubes, incubated for 5 min and then the DNA was mixed with the lipofectamine. The DNA-lipofectamine complex was incubated for 20 min and then it was added to the cell culture along with the fresh media. The cellular uptake of NPs was monitored by confocal laser scanning microscopy (Olympus FV3000) equipped with a 60X and 100X oil immersion objective, high-sensitivity GaAsP photomultiplier tube (PMT) detectors, and solid-state lasers (488 nm and 561 nm).
2.7. Measurement of mitochondrial ROS and mitochondrial membrane potential (ΔΨm)
To evaluate the mitochondrial protective activity of the functionalized NPs, N2a cells pre-incubated with nanozyme (5 μg mL−1) were treated with rotenone (100 μM) for 1 h to compromise the mitochondrial integrity. Briefly, post-rotenone treated N2a cells were harvested using trypsin and washed with fresh media by centrifugation (1500 rpm for 3 min). After that, rotenone was removed and the cells were washed with PBS twice, treated with MitoSox (2 μM) and shaken gently. MitoSox-treated cells were incubated for 30 min in a CO2 incubator at a temperature of 37 °C followed by flow cytometry analysis. Flow cytometry quantifies the fluorescence response of MitoSox in cells in the PE. Similarly, confocal microscopy was implemented to observe the superoxide level in mitochondria treated with rotenone in the absence and presence of functionalized nanozyme. Unlike FACS analysis, adherent cells were not treated with trypsin in confocal microscopy imaging. To determine the ΔΨm, cells treated with rotenone/LCS-1 were incubated with JC-1 (2 μM) for 20 min. Cells were then washed with PBS followed by centrifugation at 3000 rpm for 2 min and the fluorescence was analyzed using flow cytometry in the absence and presence of NPs. Additionally, the JC-1 cells were also analyzed using confocal laser scanning microscopy with lasers (488 nm and 561 nm).2.8. MPP+-induced neurotoxicity, determination of intracellular ROS levels and apoptosis in the presence of NPs
The N2a cell viability mediated by MPP+-induced neurotoxicity was determined by MTT assay. Briefly, N2a cells were seeded into a 96 well-plate (1 × 10⁴ cells per well). Then, cells pre-incubated with different concentrations of NPs (0–50 μg mL−1) were either left untreated or treated with MPP+ (1 mM) for 24 h at 37 °C. Thereafter, an MTT assay was performed as mentioned above in the cell viability assay.Intracellular ROS generated due to MPP+ were evaluated using DCFH-DA, following the protocol adopted by Singh et al.25 In brief, pre-incubated N2a cells with NPs (5 μg mL−1) were either left untreated or treated with MPP+ (1 mM) for 24 h at 37 °C. The cells were then stained with 10 μM DCFH-DA for 30 min at 37 °C. The cells were later trypsinized and washed with 1X PBS and analyzed by flow cytometry (Ext/Ems: 485/535 nm). The fluorescence intensity values of the cells were represented as fold change with respect to untreated cells (control).
Activation of Caspase-3/7 was measured in order to determine the status of apoptosis in N2a cells treated with MPP+, as per the manufacturer's instructions supplied in the caspase-activity detection kit (Promega G8090). Briefly, 50 μL of Caspase-Glo 3/7 reagent was added to each well of a 96 well-plate containing treated and untreated cells with 50 μL fresh media. The plate was incubated at room temperature for 1 h and then the luminescence of each sample was measured in a plate-reading luminometer (Tecan 200 infinity series).
Cellular signaling pathways were analyzed using western blot analysis. Briefly, after MPP+ treatment, cells were lysed in radioimmunoprecipitation assay (RIPA) buffer containing 1 mM sodium orthovanadate (Na3VO4), sodium pyrophosphate (Na4P2O7), and 1 mM phenylmethylsulfonyl fluoride (PMSF). The total protein in the cell lysate was extracted and quantified by Bradford reagent. Cell lysates were resolved by 12% SDS-PAGE and electro-transferred to a PVDF membrane. The PVDF blots were blocked in 5% skim milk prepared in Tris–buffered saline containing 0.1% Tween-20 (TBST) for 1 h. This process was followed by an overnight incubation of blots in corresponding primary antibodies (Mouse/Rabbit) at 4 °C. The membranes were washed thrice with TBST buffer, followed by incubation with 1:10000 dilution of secondary antibody (HRP-conjugated) for 1 h at room temperature. Subsequently, the membrane was washed with TBST and exposed to luminol solution (Bio-RAD).
Cellular morphological changes were acquired using phase contrast microscopy (Carl Zeiss Microscope). To resolve the morphological details of the N2a cells upon MPP+ treatment in the absence and presence of NPs, they were observed by SEM. The samples were prepared using the protocol followed by Arakha et al.26 Cells were grown on a poly D-lysine (Sigma P6407-5 mg) coated cover slip and treated with MPP+ (1 mM) in the absence and presence of NPs for 24 h. After 24 h, the medium was removed, and cells were washed with PBS buffer and fixed with 2% paraformaldehyde for 4 h at 4 °C. The cells were re-washed with PBS and treated with OsO4 for post-fixation for 1 h. Finally, the cells were dehydrated in ethanol (20%, 50%, 70% and 100%) and dried at room temperature.
3. Results and discussion
The primary goal of the present study is to design a novel class of NPs with enzymatic functions that can potentially alleviate disease pathogenesis mediated by oxidative stress. For therapeutic interventions, we synthesized and functionalized NPs to mimic the SOD1 with robust nanozyme activity. We synthesized ZnNPs and ZnCuNPs based on the core of the active site of the SOD1 enzyme containing metal ions.21 In addition to the metal center, the core active site of SOD1 consists of histidine residues crucial for its catalytic function.27 Hence, we functionalized NP surfaces with histidine residues to mimic the active site of SOD1 to retain the catalytic activity.3.1. Synthesis, functionalization, and characterization of NPs
The ZnNPs and ZnCuNPs were subjected to characterizations using various spectroscopic and imaging techniques. The TEM images showed the nanoflake morphology of the ZnNPs/ZnCuNPs and ZnNPs-H/ZnCuNPs-H (Fig. 1a, b, e and f). The interplanar spacing between the lattice fringes observed through the HR-TEM images of the ZnNPs/ZnNPs-H corresponds to the d-spacing of pure ZnO (Fig. 1c and g). However, the reduced d-spacing in ZnCuNPs/ZnCuNPs-H corresponds to the doping of Cu in the ZnNPs (Fig. 1d and h). Interestingly, no morphological changes were observed in the ZnCuNPs with 2.5% and 10% doping of Cu (Fig. S1a–d, ESI†). The elemental composition of the synthesized NPs investigated by EDX spectroscopy present with TEM confirms the presence of Zn, Cu, and O (Fig. S2a–d, ESI†). Notably, the EDX spectra of the functionalized NPs detect traces of nitrogen, confirming the conjugation of histidine over ZnNPs-H/ZnCuNPs-H (Fig. S2e and f, ESI†). The PXRD data of the NPs further supported that functionalized and non-functionalized samples were crystalline with peaks at different 2θ values, which are well indexed to hexagonal wurtzite (JCPDS no. 36-1451) (Fig. 2a). The surge in distortedness of the ZnO crystallinity is due to the smaller atomic radii of Cu (0.057 Å) compared to Zn (0.06 Å) and the presence of surface functionalized histidine. The composition of the NPs was further analysed using FTIR spectroscopy, shown in Fig. 2c and d. The spectra of the materials showed a transmittance peak at 570 cm−1 for ZnNPs/ZnCuNP corresponding to metal–metal and metal-oxygen bond stretching in the nanocrystal lattice28 (Fig. 2c). The prominent peak at 2355 cm−1 was due to the asymmetric vibration of C![[double bond, length as m-dash]](https://www.rsc.org/images/entities/char_e001.gif) O bonds. The presence of Zn–O bond vibration was also supported by FTIR spectra of ZnNPs-H/ZnCuNPs-H (Fig. 2d). In contrast, strong transmittance peaks in ZnNPs-H/ZnCuNPs-H are dominated by surface-functionalized histidine. In context, the IR peaks at 1637 cm−1 and 3200–3500 cm−1 correspond to the stretching vibration of amide-I and amide A, respectively.29 Hence, the peaks in ZnNPs-H/ZnCuNPs-H further strengthened the presence of histidine as a corona over the NP surface. Additionally, we employed Raman spectroscopy to gain insight into the nature of bonding between atoms in our NPs (Fig. S3, ESI†). The peaks at 332 cm−1 and 438 cm−1 are from different ZnO and Cu-doped ZnO modes. The peak at 438 cm−1 is the characteristic E2 (high) peak of ZnO and this is from the vibration of oxygen atoms (Fig. S3a, ESI†). This peak is very prominent in the case of pure ZnO and decreases as the copper doping increases. This confirms the doping of copper in the ZnO nanomaterial. Interestingly, the functionalized NPs exhibit their N–H characteristic peak at 1050–1105 cm−1, which further strengthens the presence of histidine over the NPs surface30 (Fig. S3b, ESI†). XPS was performed to characterize the Zn and Cu surface properties and oxidation states in the respective NPs (Fig. S4, ESI†).
O bonds. The presence of Zn–O bond vibration was also supported by FTIR spectra of ZnNPs-H/ZnCuNPs-H (Fig. 2d). In contrast, strong transmittance peaks in ZnNPs-H/ZnCuNPs-H are dominated by surface-functionalized histidine. In context, the IR peaks at 1637 cm−1 and 3200–3500 cm−1 correspond to the stretching vibration of amide-I and amide A, respectively.29 Hence, the peaks in ZnNPs-H/ZnCuNPs-H further strengthened the presence of histidine as a corona over the NP surface. Additionally, we employed Raman spectroscopy to gain insight into the nature of bonding between atoms in our NPs (Fig. S3, ESI†). The peaks at 332 cm−1 and 438 cm−1 are from different ZnO and Cu-doped ZnO modes. The peak at 438 cm−1 is the characteristic E2 (high) peak of ZnO and this is from the vibration of oxygen atoms (Fig. S3a, ESI†). This peak is very prominent in the case of pure ZnO and decreases as the copper doping increases. This confirms the doping of copper in the ZnO nanomaterial. Interestingly, the functionalized NPs exhibit their N–H characteristic peak at 1050–1105 cm−1, which further strengthens the presence of histidine over the NPs surface30 (Fig. S3b, ESI†). XPS was performed to characterize the Zn and Cu surface properties and oxidation states in the respective NPs (Fig. S4, ESI†).
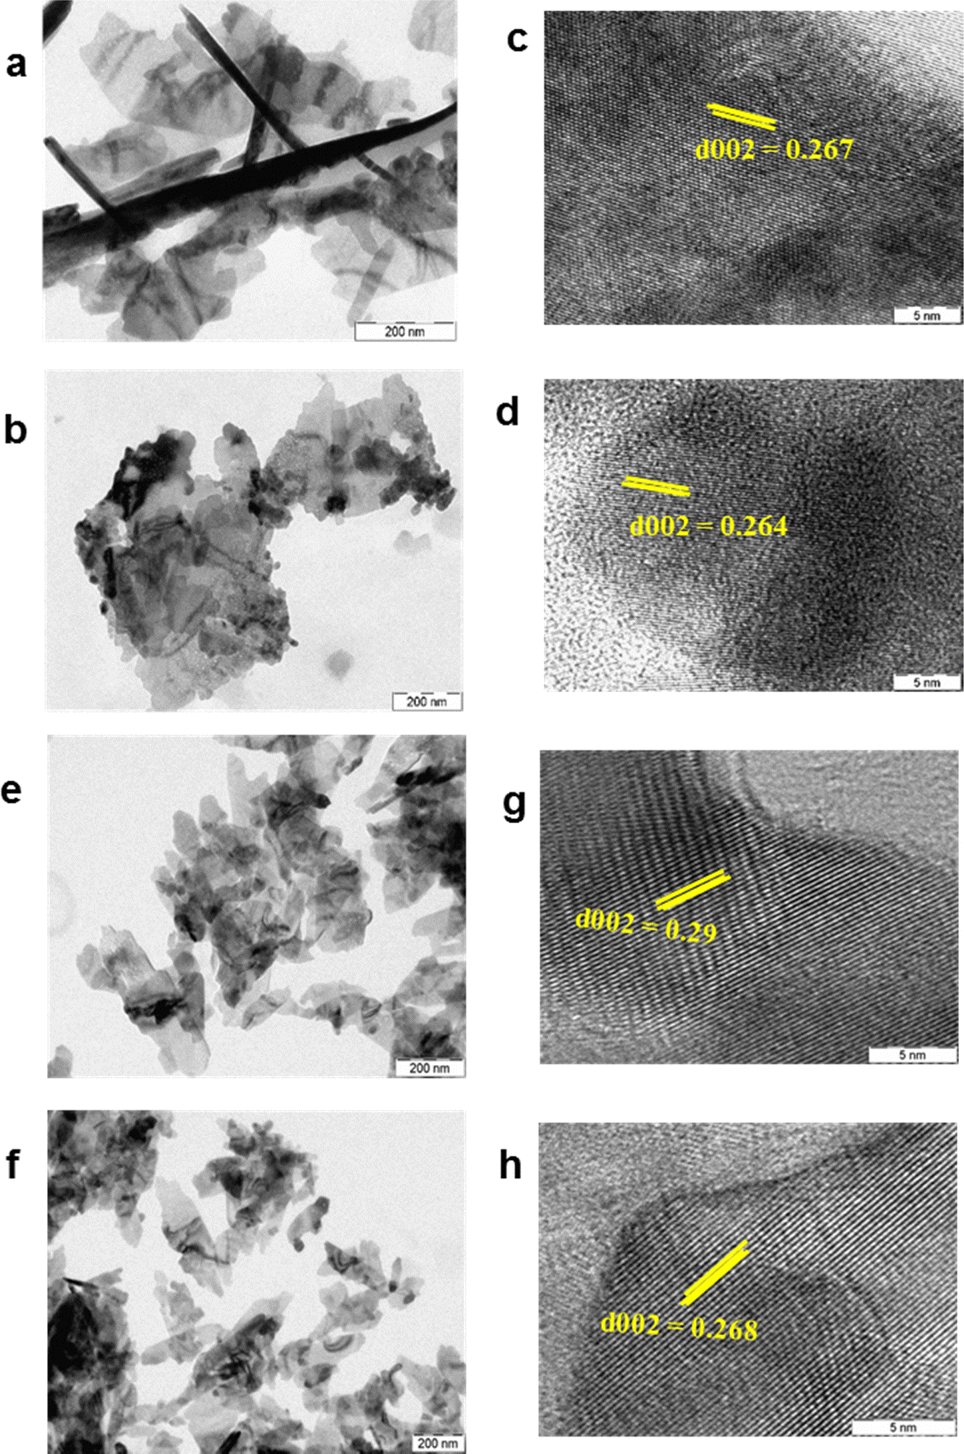 | ||
| Fig. 1 Morphological characterization of NPs. (a)–(d) TEM and HR-TEM images of ZnNPs and Cu-doped ZnNPs. (e)–(h) TEM and HR-TEM images of ZnNPs-H and Cu-doped ZnNPs-H. | ||
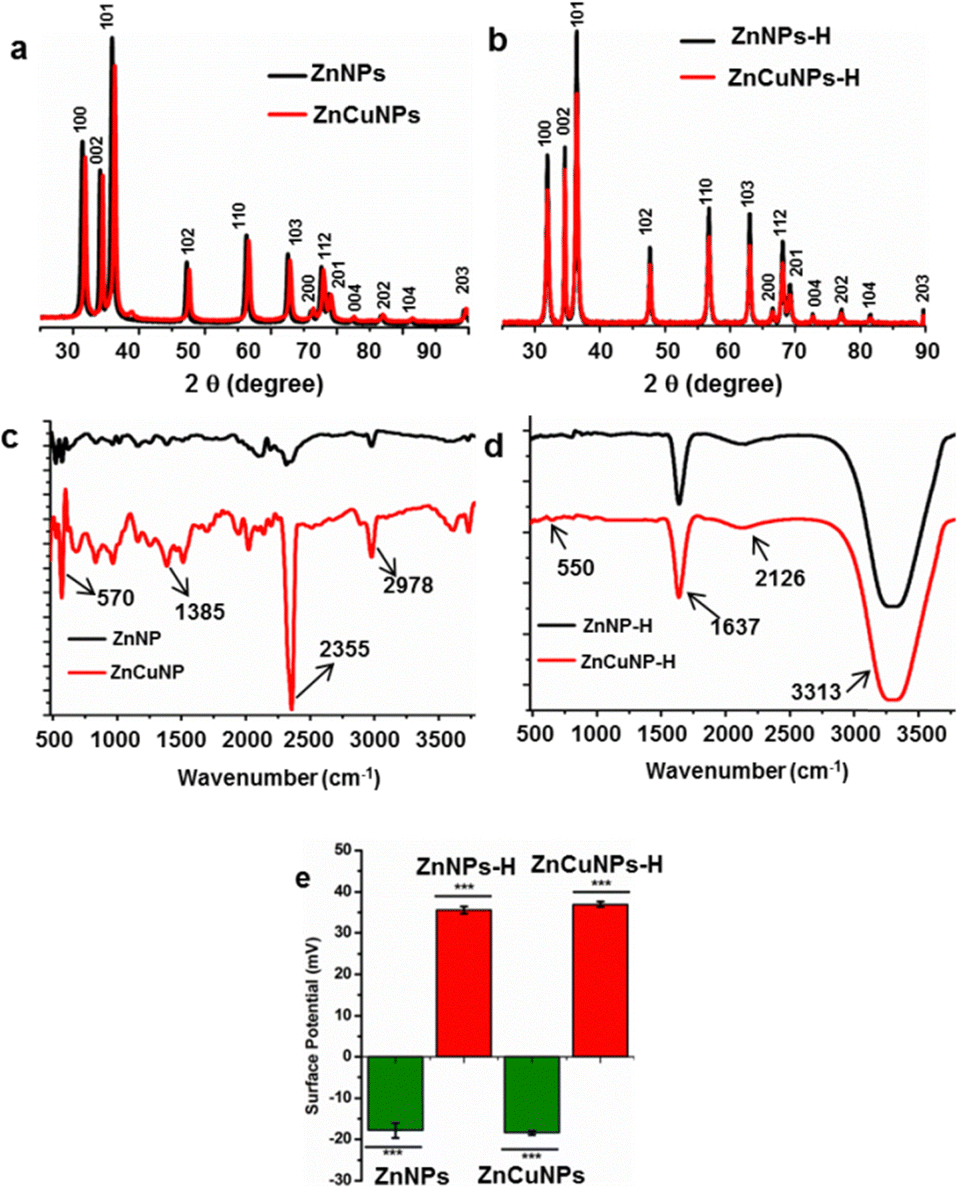 | ||
| Fig. 2 Surface characterization of the NPs. (a) and (b) XRD spectra of ZnNPs/ZnCuNPs and ZnNPs-H/ZnCuNPs-H. (c) and (d) FTIR spectra of ZnNPs/ZnCuNPs and ZnNPs-H/ZnCuNPs-H. (e) Surface potential analysis of the NPs. | ||
The pure ZnNPs have a sharp peak at 1020.88 eV for Zn 2p3/2, and as the doping percentage increases, this peak shifted to higher energy (1022.18 eV) and reduced the symmetry of the Zn 2p3/2 peak. This shift is well reported and attributed to Cu surface band bending and doping into ZnO.31,32 The peak positions for Cu 2p3/2 and Cu 2p1/2 are around 933.5 eV and 953.5 eV, respectively. Satellite peaks follow the core peaks at higher binding energy directions around 943 eV and 962 eV. The core peak position, shape, and corresponding satellite peaks prove that the copper is in a Cu2+ oxidation state.33 Furthermore, the successful doping of Cu in ZnO was evident by the appearance of peaks for copper exclusively in doped samples but not in pure ZnNPs. The hydrodynamic sizes of the NPs before and after functionalization were evaluated using DLS techniques (Fig. S5, ESI†). As shown in Fig. S5a–d (ESI†), the average hydrodynamic size of the ZnNPs/ZnCuNPs was 26.3/26.1 nm with a polydispersity index (PDI) of 0.408/0.428. Interestingly, after histidine functionalization, the size of ZnNPs-H/ZnCuNPs-H increased to 41.7/37.6 nm with a PDI of 0.324/0.409. The increase in the size of the functionalized NPs is rationalized to the presence of an amino acid corona over the NP surface.34 However, the reduction in PDI indicates a relatively higher stability of the NPs due to positively charged histidine.
As a next step, we measured the surface potential of ZnNPs/ZnCuNPs, which was found to be −17.9/−18.6 mV (Fig. 2e (Fig. S4e and f, ESI†: Raw data)). However, the surface potential of the NPs changed to +35.6/+ 37.6 mV after the histidine functionalization (Fig. 2e (Fig. S4g and h, ESI†: Raw data)). The surface potential change reflects the surface modification by histidine that binds covalently to the nanomaterial surface at the carboxyl end.13 Hence, the positive surface potential of ZnNPs-H/ZnCuNPs-H was attributed to the availability of –NH2 functional groups over the NP surface.35 In context, the functionalization of NPs changes the surface potential and not the morphology as shown in the TEM images. Moreover, the surface potential of 2.5% and 10% Cu-doped ZnNP-H was found to be −17.1 and −0.3 mV, suggesting that histidine functionalization does not impart significant changes in surface properties and higher order of Cu doping reduces the stability of the NPs. Therefore, 5% Cu-doped ZnNPs were employed for further experiments.
3.2. Functionalized NPs exhibit robust nanozyme activity in vitro
The possible mechanism of histidine-coated NPs in the dismutation of O2˙− into H2O2 and molecular O2 is depicted in Fig. 3a. Here, histidine bound to the metal centre imparts a positive charge and helps attract and guide the negatively charged O2˙− to the active site. After a comprehensive characterization of the NPs, their ability to mimic SOD1 antioxidant activity was examined through colorimetric assay. The presence of histidine in the proximity of Zn and Zn–Cu NPs resembles the active site of SOD1. This enzymatic activity of the NPs was found to be concentration-dependent for histidine functionalization (1–100 mM). We observed that 10 mM histidine functionalized Zn and ZnCu NPs showed the maximum nanozyme activity. Additionally, we quantified the number of histidine molecules functionalized over Zn:His and ZnCu:His using ninhydrin analysis and found them to be 145:9.35 mg (∼3.612 × 10¹⁹ mol of His) and 132:8.25 mg (2.19 × 10¹⁹ mol of His) (wt/wt), respectively. In support of our hypothesis and analysis, Changlong Hao et al. demonstrates that besides ligands over the nanoparticle surfaces, other physiochemical properties also dictate the catalytic activity of the NPs like charge, size, shape and surface area 13. In context, we have also observed that changing the doping of Cu percentage in ZnNPs not only affects their surface charge (Fig. S5i and j, ESI†) but also affects their SOD1 mimic activity. Thus, it explains why the nanozyme activity of the resulting nanoformulation is only observed by adding histidine to the NP surface rather than the NP-histidine complex.
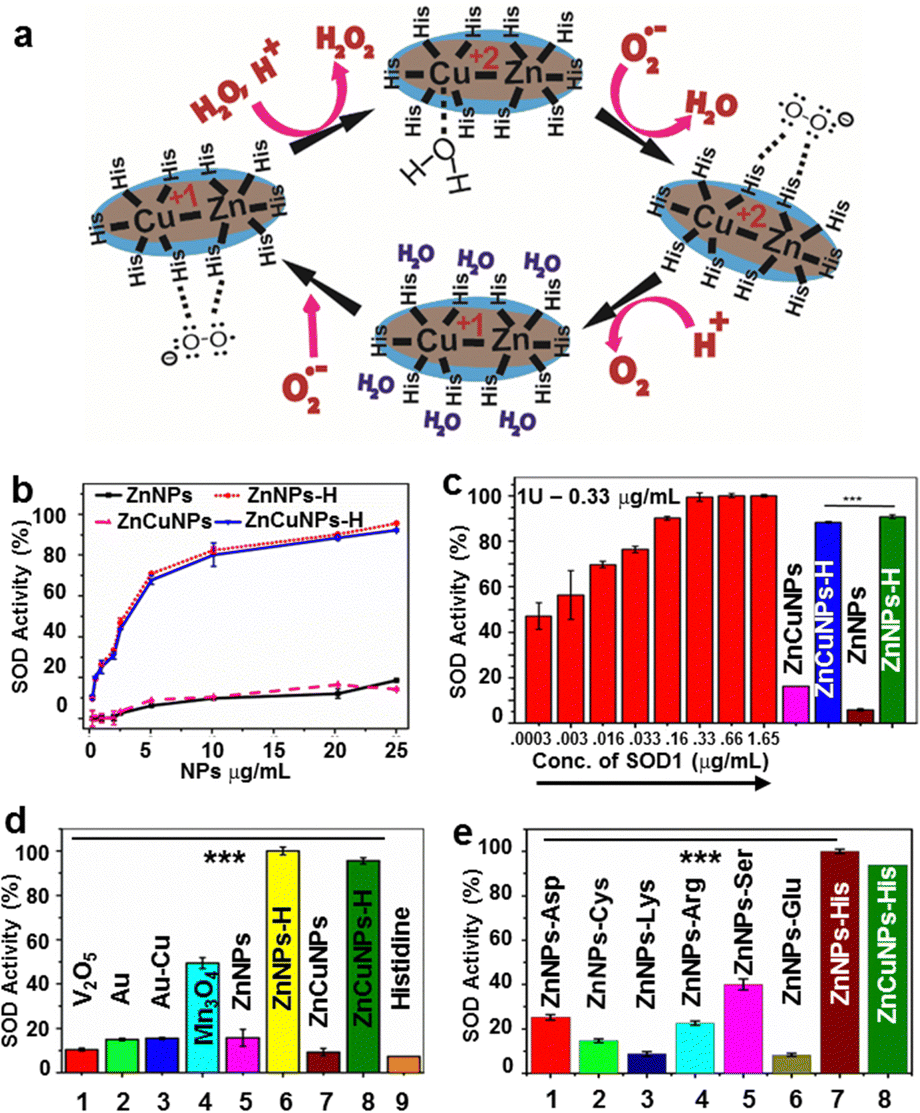 | ||
| Fig. 3 Nanozyme activity of functionalized NPs. (a) Illustration of the SOD1 mimicking activity of ZnNPs-H/ZnCuNPs-H acting as an electron transfer center and catalyzing negatively charged superoxide into hydrogen peroxide and oxygen. (b) SOD1 enzyme mimicking activity of ZnNPs-H/ZnCuNPs-H. (c) Nanozyme activity of functionalized and non-functionalized ZnNPs/ZnCuNPs compared with bovine erythrocytes SOD1 standard. (d) A comparison of the SOD1 mimicking activity of ZnNPs-H/ZnCuNPs-H with different reported nanomaterials. (e) A comparison of the SOD1 mimicking activity of ZnNPs-H/ZnCuNPsH on different amino acid functionalization. The error bar indicates ± S.E.M. of three independent experiments with respective significance value, *p < 0.05; **p < 0.01; ***p < 0.001, compared to control. | ||
ZnNPs-H/ZnCuNPs-H exhibited higher SOD1 activity than non-functionalized NPs (Fig. 3b). The IC50 value for inhibition of formazan production as a function of O2˙− by ZnNPs-H/ZnCuNPs-H was found to be 3.16 and 2.1 μg mL−1, respectively, indicating its ability to mimic SOD1 at much lower concentrations (Fig. 3c). Interestingly, ZnNPs-H/ZnCuNPs-H showed significantly higher activity than previously reported control triple enzyme mimics like Mn3O412,13 (Fig. 3d). To determine the specificity of the NPs with histidine for SOD1 activity, we decorated the NP surface with other amino acids, including aspartate, glutamate, serine, arginine, and cysteine. These amino acids were selected based on their proximity to the natural SOD1 active site.36 Remarkably, only histidine-bound ZnNPs/ZnCuNPs exhibited significant activity indicating strong evidence of histidine-metal conjugation mimicking the biological SOD1 enzyme framework for catalysis11,37 (Fig. 3e). Nevertheless, serine-labelled NPs also showed SOD1 activity but to a lesser extent.
3.3. Functionalized NPs preferentially partition into the mitochondrial compartment
To further evaluate the nanozyme activity of the NPs in a cellular model system, we utilized a mouse neuroblastoma cell line, Neuro2a cells (N2a). First, the cytotoxicity of the nanozymes was determined by MTT assay in a dose-dependent manner (2–50 μg mL−1) (Fig. S6a–d, ESI†). Lower concentrations of NPs did not cause significant changes in cell viability. However, non-functionalized NPs were more toxic at higher concentrations than their functionalized counterparts. At 5 μg mL−1, the NPs substantially maintained the viability of cells at IC50 values (Fig. 4a). On the contrary, ZnNPs-H/ZnCuNPs-H exhibit cell viability up to 96% and 86% suggesting higher biocompatibility and highlighting the importance of functionalization.17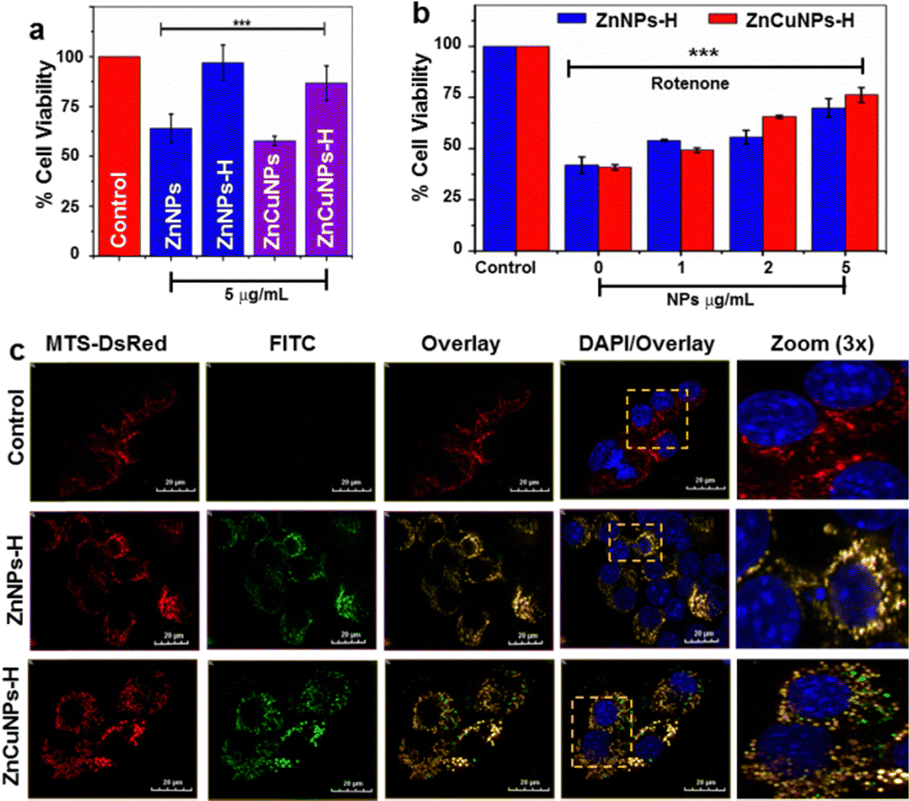 | ||
| Fig. 4 Cytotoxicity and co-localization analysis of functionalized NPs. (a) Cellular toxicity profile of ZnNPs/ZnCuNPs and ZnNPs-H/ZnCuNPs-H on the N2a cell line. (b) The cytoprotective activity of dose-dependent ZnNPs-H/ZnCuNPs-H in the absence and presence of rotenone. (c) Mitochondrial-specific localization of functionalized NPs in cells tracked with mitochondrial-specific protein transfected (MTS-DsRed) and FITC-tagged ZnNPs-H/ZnCuNPs-H (counter stain by DAPI) (Scale bar is 20 mm). The error bar indicates ± S.E.M. of three independent experiments with respective significance values, *p < 0.05; **p < 0.01; ***p < 0.001, compared to the control. | ||
The cytoprotective role of functionalized NPs under oxidative stress was determined by challenging the cells with rotenone (Fig. 4b). Rotenone is a neurotoxic compound that induces O2˙− species production by inhibiting complex I of the mitochondrial respiratory chain.12 Cells treated with only rotenone showed 40% viability (negative control). On the other hand, NPs actively rescued and restored cell viability dose-dependently. Since rotenone is known to induce cell death through mitochondrial ROS, we investigated whether cell viability was restored due to the localization of functionalized NPs into the mitochondria by labelling them with FITC. Mitochondria were fluorescently decorated by transfecting the cells with a plasmid construct DsRed vector constitutively expressing mitochondrial precursor protein with targeting signal sequence (MTS-DsRed).38 Interestingly, FITC-labelled ZnNPs-H/ZnCuNPs-H (green fluorescence) co-localized with DsRed (red fluorescence) in the mitochondria (Fig. 4c). The merged yellow fluorescence image indicates active import of NPs into the mitochondrial compartment (Fig. 4c zoom panels). Pearson's correlation coefficient was found to be close to 1 for ZnNPs-H/ZnCuNPs-H and mitochondria, indicating a positive strong correlation between FITC and MTS-DsRed signals (Fig. S6e, ESI†). Moreover, both the Manders’ M1 and M2 coefficients ranged from 0.55 to 0.7, indicating the co-occurrence of NPs in the mitochondrial area (Fig. S6f, ESI†). We envisioned that the selective partitioning of functionalized NPs may be attributed to its high positive surface potential mimicking the net positively charged N-terminal signal sequence utilized to import proteins into the mitochondrial compartment.39 The higher mitochondrial uptake is facilitated by a potential difference between the nanozyme and the mitochondrial membrane.40,41 At the same time, this further explains that the negatively charged non-functionalized NPs showed less mitochondrial co-localization (Fig. S6g, ESI†).
3.4. ROS scavenging potential of functionalized NPs in a neuronal cellular model
Oxidative damage of cells induced by O2˙− primarily originates in mitochondria.42 The intracellular ROS scavenging nanozyme activity of the functionalized NPs was further studied using MitoSox dye which penetrates mitochondria and interacts with O2˙− to give a red fluorescence. To test the cytoprotectivity, functionalized NP pre-incubated cells were challenged with rotenone, without perturbing the natural SOD1 enzymatic system, and stained with MitoSox. These treated cells were analyzed by flow cytometric measurements (Fig. 5a and Fig. S7, ESI†: Raw data). The flow cytometric analysis revealed that cells treated with only rotenone (NP–) and non-functionalized NPs had higher levels of O2˙− in comparison to control cells. On the contrary, cells treated with functionalized NPs reduce the O2˙− species to a significant level in the presence of rotenone. This is further corroborated by confocal fluorescence microscopic imaging results where cells exhibit a substantial reduction in the mitochondrial O2˙− upon treatment by ZnNPs-H/ZnCuNPs-H (Fig. S8, ESI†), thus establishing a robust nanozyme function to neutralize the excess intracellular ROS. The pathological conditions associated with excess ROS accumulation due to impairment in the natural antioxidant machinery have been critical therapeutic targets for treating most neurodegenerative diseases.9,12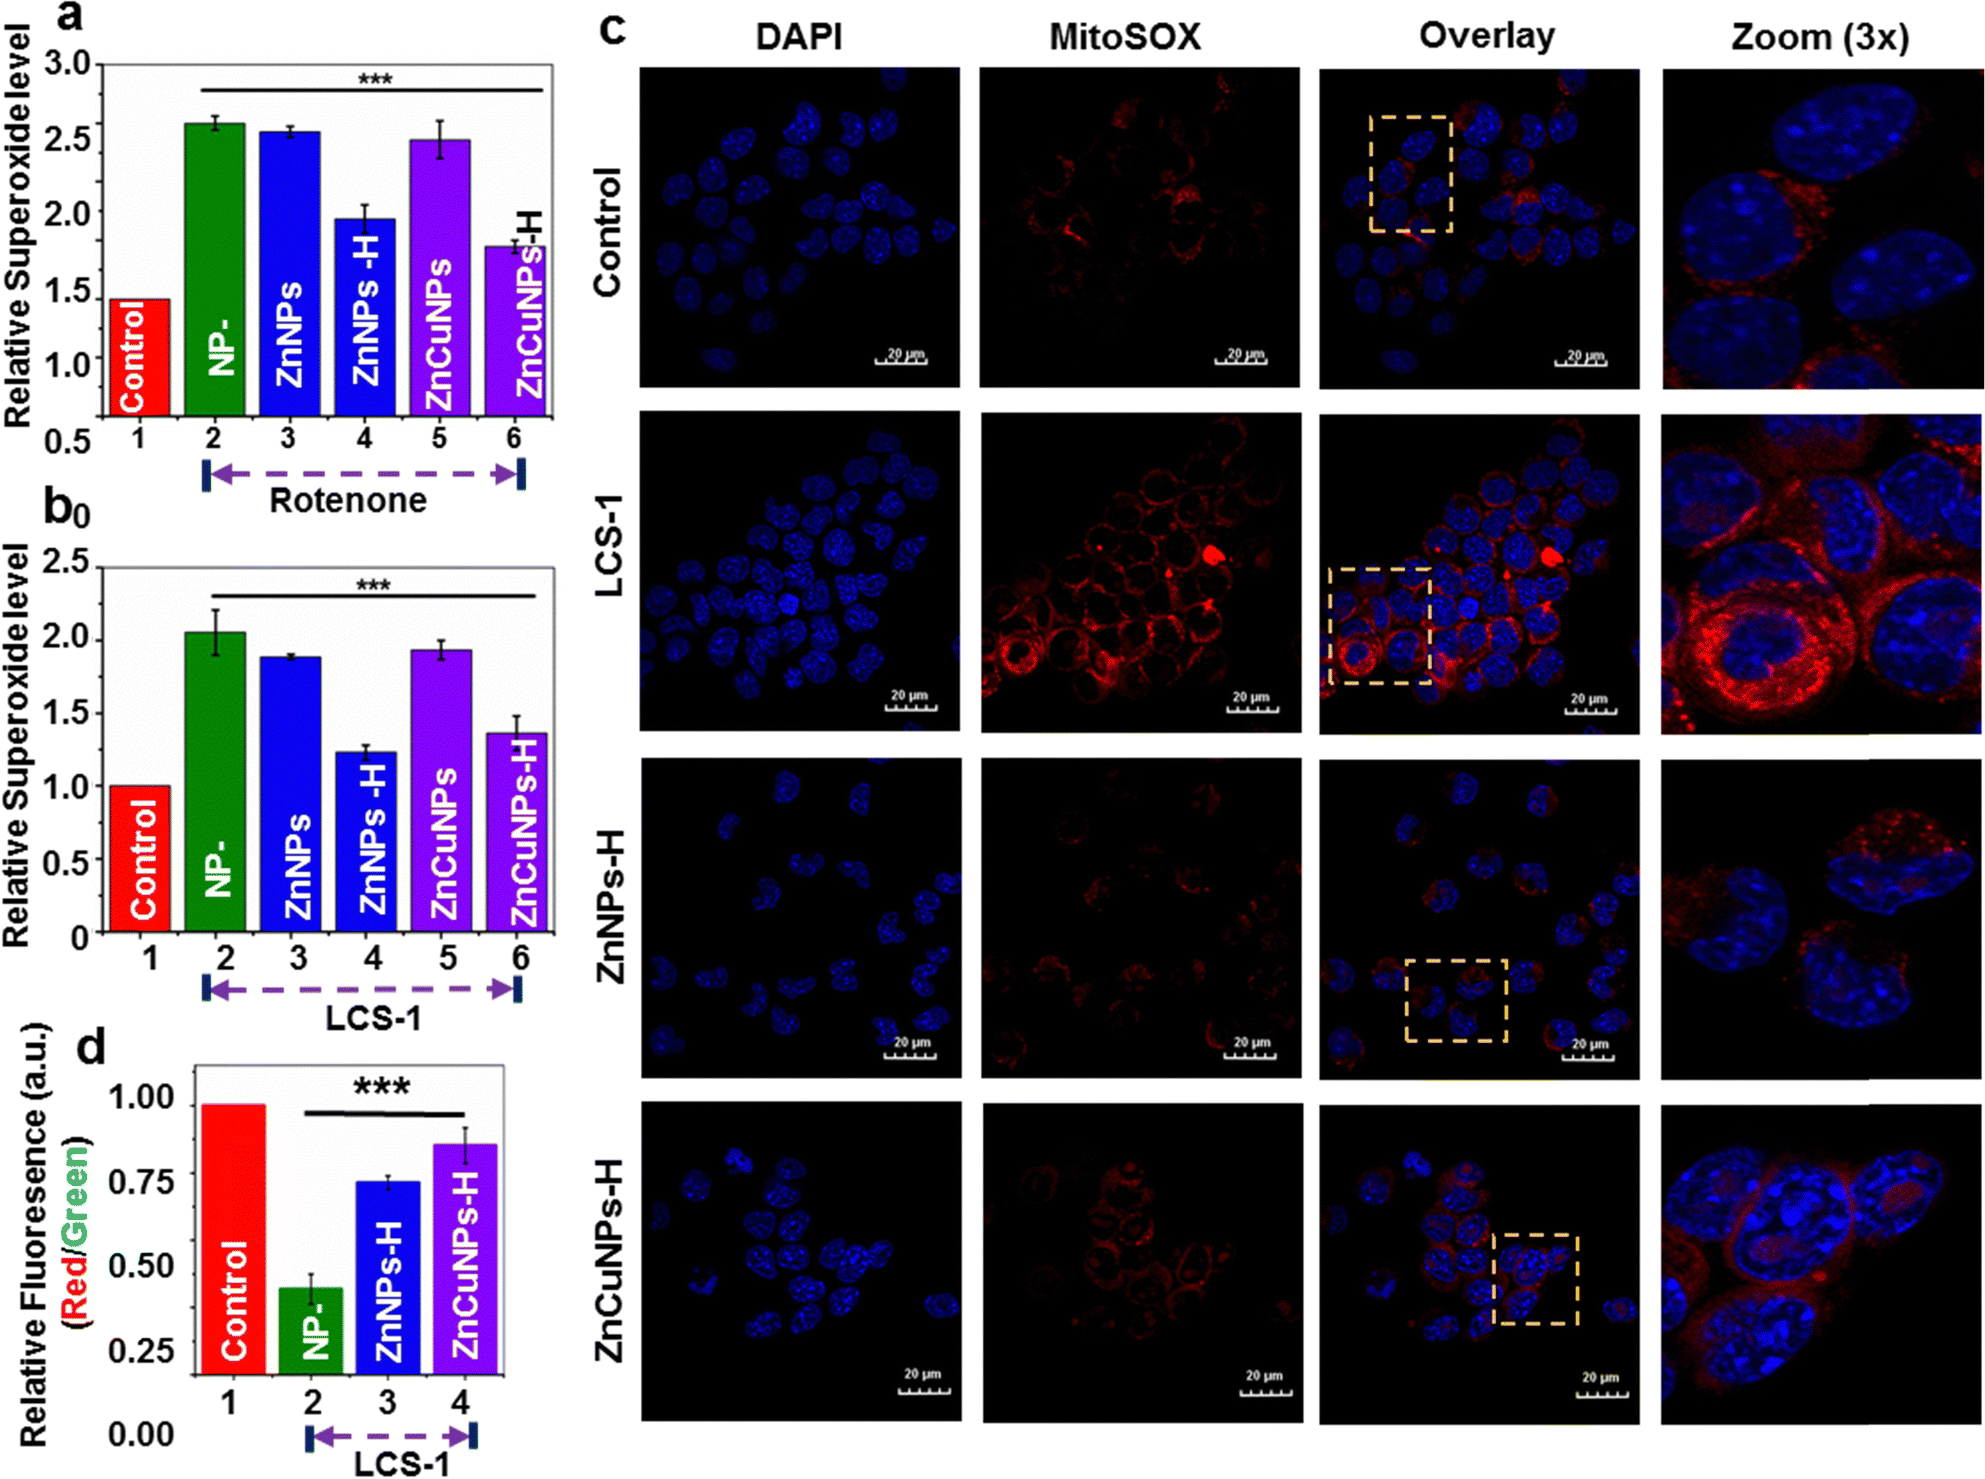 | ||
| Fig. 5 Superoxide scavenging activity of functionalized NPs. (a) and (b) Flow cytometric analysis showing superoxide scavenging of ZnNPs/ZnCuNPs and ZnNPs-H/ZnCuNPs-H after rotenone and LCS-1 treatment in N2a cells stained with MitoSox dye. (c) Superoxide scavenging activity of ZnNPs/ZnCuNPs and ZnNPs-H/ZnCuNPs-H in N2a cells treated with LCS-1 analyzed by confocal microscopy. (d) Flow cytometric analysis of mitochondrial membrane potential of ZnNPs-H/ZnCuNPs-H treated cells using JC-1 dye in the absence or presence of LCS-1 (Scale bar is 20 mM). The error bar indicates ± S.E.M of three independent experiments with respective significant values, *p < 0.05; **p < 0.01; ***p < 0.001, compared to the control. | ||
To test the similar therapeutic efficacy of our nanozymes, we challenged cells with widely used Lung cancer screen-1 (LCS-1) molecules to mimic molecular conditions that inhibit the cellular SOD1 enzymatic system. LCS-1 directly targets the SOD1 gene transcription and is also found to inhibit its activity in vitro.43 This hinders natural antioxidant machinery under physiological conditions and cells become less competent to scavenge the ROS generated, thus influencing the overall cellular viability.42,44 Flow cytometric analysis and confocal microscopy of cells treated with only LCS-1 indicate increased mitochondrial ROS (Fig. 5b and c and Fig. S9, ESI†: Raw data). However, compared to non-functionalized NPs (Fig. S10a and b, ESI†), a significant reduction in superoxide was observed in the presence of functionalized NPs through its nanozyme potential. So, we believe that the cytoprotective role of ZnNPs-H/ZnCuNPs-H when cells were challenged with rotenone and LCS-1 is due to its SOD1 mimicking activity which is primarily attributed to histidine functionalization and its effective partitioning into the mitochondrial compartment. To test how effectively the nanozyme activity of functionalized NPs protects mitochondrial health, we measured the mitochondrial-specific parameters such as membrane potential (MMP, ΔΨm) and its morphology.45 To determine the ΔΨm of nanozyme-treated cells in the presence of LCS-1, we used JC-1 dye followed by confocal microscopic analysis and flow cytometric measurements. In healthy cells with higher ΔΨm, JC-1 penetrates mitochondria, forms aggregates, and emits red fluorescence42,46 (Fig. S11, ESI† control panels). In contrast, under reduced ΔΨm, JC-1 is retained in the cytoplasm and emits green fluorescence, a critical indication of mitochondrial defects (Fig. S11, ESI† LCS-1 panels). On the contrary, cells pre-incubated with functionalized NPs challenged with LCS-1 showed a reduction in green fluorescence followed by higher red fluorescence due to JC-1 aggregates in the mitochondria indicating higher ΔΨm (Fig S11, ESI† ZnNPs-H/ZnCuNPs-H panels). Intriguingly, the ZnCuNP nanozymes showed significant scavenging potential as they showed higher red fluorescence due to better retention of ΔΨm. Flow cytometric measurements obtained similar results. The flow cytometric data showed that only LCS-1 treated cells had a significant reduction in the normalized fluorescence intensity (red/green ratio), indicating reduced membrane potential due to excessive O2˙− generation (Fig. 5d (Fig. S12, ESI†: Raw data)). On the other hand, cells pre-incubated with functionalized NPs showed a reversal of membrane potential upon LCS-1 treatment due to their O2˙− scavenging nanozyme activity, which is consistent with microscopic data. In conclusion, microscopic and flow cytometric analysis findings highlight that functionalized NPs can robustly protect mitochondrial functions through their nanozyme activity in simulated pathological conditions.
3.5. Functionalized nanozymes rescue cells against MPP+-induced oxidative stress in a PD model
A redox imbalance due to the downregulation of the cellular antioxidant system may lead to the development of various neurodegenerative diseases, including PD. The uncontrolled production of ROS leading to mitochondrial dysfunction is the key attribute of PD pathology.47 This comprises defects in mitochondrial structure, function and dynamics leading to impaired energy production, increased oxidative stress and compromised cellular health.48 Unlike normal conditions, mitochondrial abnormality causes excessive generation of ROS that can cause oxidative damage to DNA, proteins and other biomolecules.2,7 The ability of functionalized NPs to mimic SOD1 activity in the biological milieu prompted us to investigate whether ZnNPs-H/ZnCuNPs-H can complement the antioxidant ability in PD conditions. Several disease models have been developed to study PD, including toxin-induced, genetic and transgenic animal models. The toxin-induced system involves the administration of chemical compounds to induce selective damage. The MPP+ is widely used and considered one of the best approaches to study aspects of PD progression in vitro and in vivo. We induced the N2a cells with PD conditions by MPP+ treatment, an active toxicant of a non-cytotoxic prodrug MPTP that can cross the blood–brain barrier.5At first, we analysed the NPs potential to rescue the cells against MPP+-induced neurotoxicity (Fig. S13a and b, ESI†). The cell viability improved with increasing NPs until 5 μg mL−1 and gradually decreased at higher concentrations. In subsequent experiments, 5 μg mL−1 of NPs were used to test the cytoprotective activity (Fig. 6a). To validate the intracellular ROS scavenging potential of the functionalized NPs, we used cell-permeable DCFH-DA dye. DCFH-DA is a sensitive fluorophore that measures total ROS levels including hydroxyl and peroxyl radicals. MPP+-challenged N2a cells showed a high level of ROS (∼2 fold) even in the presence of non-functionalized ZnNPs/ZnCuNPs as compared to untreated cells (Fig. 6b). On the other hand, ZnNPs-H/ZnCuNPs-H significantly reduced the intracellular oxidative load in N2a cells confirming its robust antioxidant potential. To further ascertain the ROS scavenging activity of ZnNPs-H/ZnCuNPs-H, we performed DCFH-DA fluorescent imaging of MPP+ treated groups.49 Treatment of NPs to MPP+ challenged cells significantly downregulated the production of intracellular ROS (Fig. S13c, ESI†). To further determine the O2˙− scavenging potential of functionalized NPs, we treated the MPP+ (1 mM) exposed N2a cells with O2˙− specific dye MitoSox. Cells treated with only MPP+ exhibit a high level of O2˙− fluorescence compared to the control (untreated cells) (Fig. 6c). Interestingly, ZnNPs-H/ZnCuNPs-H treated cells suppress the level of O2˙− comparable to the untreated cells, indicating its robust SOD1 mimetic activity. The rejuvenation of MPP+-challenged cells by functionalized NPs in the presence of MitoSox further indicates its sub-cellular localization.
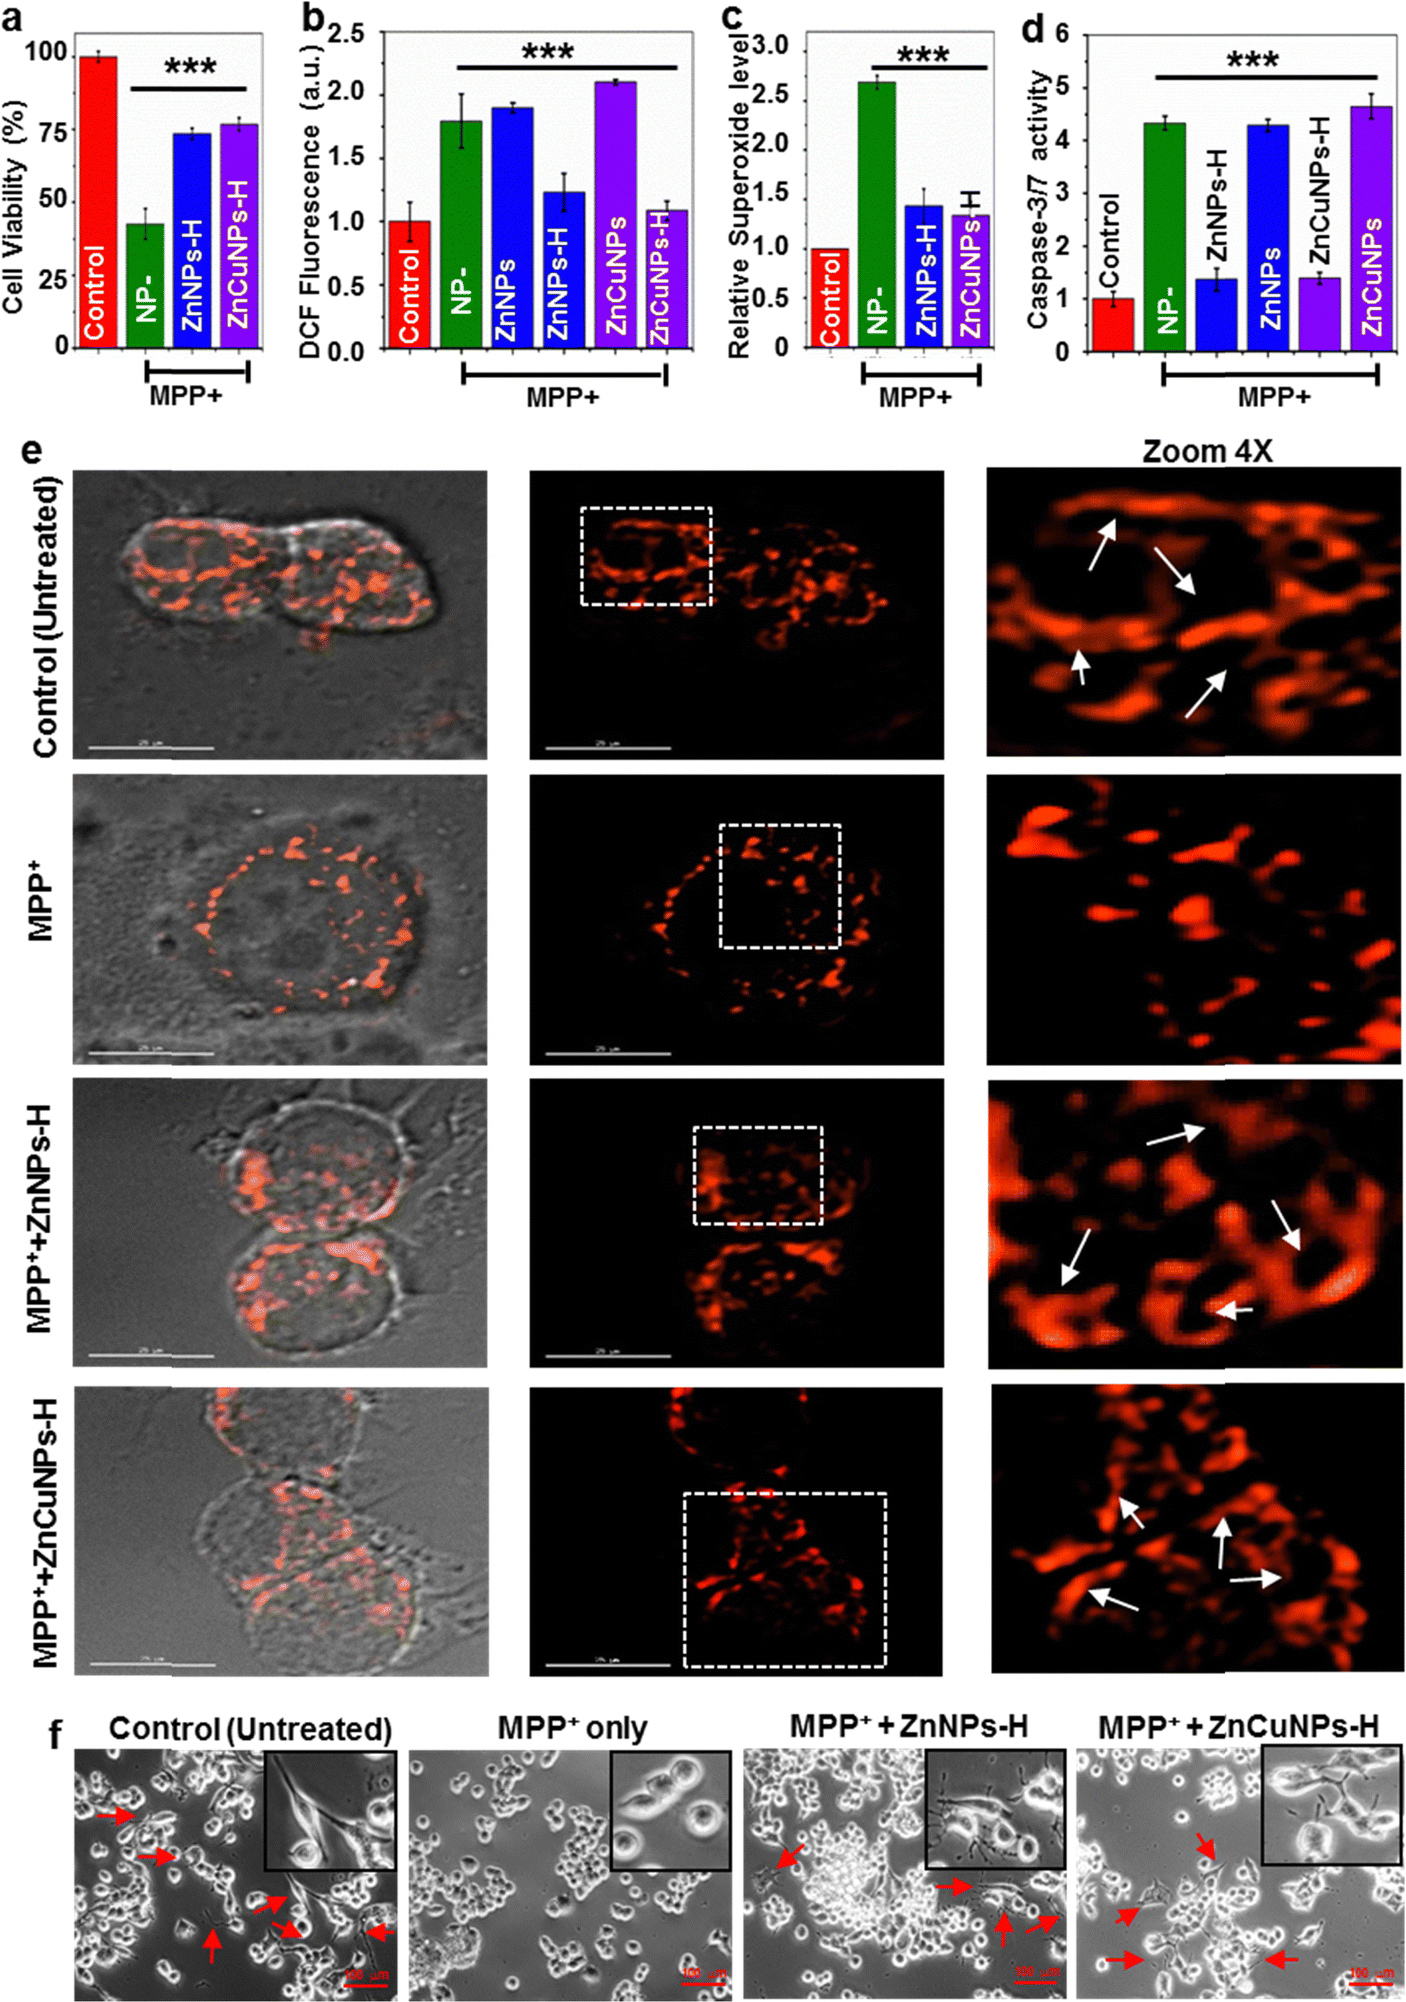 | ||
| Fig. 6 Functionalized NPs showed antioxidant potential against oxidative stress and restored the cellular morphology. (a) Cytoprotective role of ZnNPs-H/ZnCuNPs-H in the presence of MPP+. (b) Relative mean DCFDA fluorescence intensity of the cell indicating the ROS scavenging activity of the NPs. (c) Relative superoxide level in N2a cells treated with MPP+ and visualized by MitoSox dye, indicating ROS scavenging activity of the NPs. (d) Protection of neurotoxin-mediated apoptosis by ZnNPs-H/ZnCuNPs-H analyzed through caspase-3 activity. (e) Mitochondrial morphological changes in N2a cells (Scale bar is 20 μm). (f) Phase-contrast microscope images showing morphological changes in N2a cells. Images were obtained with an inverted phase-contrast microscope. Representative images were taken from three separate experiments (Scale bar is 100 μm). The error bar indicates ± S.E.M. of three independent experiments with respective significance values, *p < 0.05; **p < 0.01; ***p < 0.001, compared to the control. | ||
As the MPP+ causes ROS-mediated apoptosis in cells, we analysed the anti-apoptotic effects of NPs as a function of caspase 3/7 activation in cells treated with MPP+. High levels of ROS can trigger caspase-3 activation. This interaction involves the oxidation and modification of specific amino acid residues within caspase-3, promoting its enzymatic activity and the initiation of apoptosis.50 Compared to the control sample (untreated), MPP+-challenged cells showed an elevated level of caspase-3 confirming the induction of apoptosis (Fig. 6d). However, the functionalized NP treatment significantly reduced the number of apoptotic cells by ∼3 fold after being challenged by MPP+. Based on the observation, the reduction of intracellular ROS production and accumulation by functionalized NPs likely protected the activation of caspases, thereby preventing apoptotic cell death.
To further evaluate the cytoprotective effect of ZnNPs-H/ZnCuNPs-H, we examined the changes in anti-apoptotic protein levels like Bcl-2 in N2a cells. In context, we investigated the levels of anti-apoptotic protein (Bcl-2 and p-Akt) in the cytosol. MPP+ is known to suppress the level of Bcl-2 in PD models.3 Similar to this finding, the MPP+ treated cells decreased the Bcl-2 level after 24 h of exposure (Fig. S14a, ESI† (Bcl-2 lane)). In contrast, the Bcl-2 level was significantly increased in ZnNPs-H/ZnCuNPs-H treated N2a cells. Thus, promoting the expression of Bcl-2 by NPs is attributed to its cytoprotective role in MPP+ treated cells. We further examined the anti-apoptotic function of NPs by investigating the Akt phosphorylation in N2a cells (Fig. S14b, ESI† (p-Akt lane)). In agreement with previous studies,50 we observed that MPP+ treatment reduces the phosphorylation of Akt in neuroblastoma cells. Meanwhile, ZnNPs-H/ZnCuNPs-H significantly protected the cells from MPP+ toxicity, as evidenced by the increased level of p-Akt. Together, caspase activation and the analysis of anti-apoptotic factors provide compelling evidence in favour of suppressing MPP+-induced neurotoxicity by the cytoprotective role of functionalized NPs.
Exposure to MPP+ can have significant effects on the mitochondrial network within cells leading to the generation of fragmented mitochondria.3 Hence, to determine the therapeutic potential of NPs in disease progression, mitochondrial morphological changes were assessed upon transfection of MTS-DsRed. The MPP+-challenged cells treated and untreated with ZnNPs-H/ZnCuNPs-H expressing MTS-DsRed were subjected to the confocal microscope to visualize the abnormalities in the mitochondrial integrity. Normal N2a cells exhibit filamentous mitochondrial interconnected networks, a characteristic feature of healthy cells with functional mitochondria (Fig. 6e Control panels). However, cells treated with MPP+ showed impaired mitochondrial morphology with fragmented and punctate structures indicating accumulation of dysfunctional mitochondria (Fig. 6e MPP+ panels). This excessive mitochondrial fission could be attributed to the ROS-mediated neurotoxicity associated with MPP+ interference with the mitochondrial transport chain by alleviating the ROS levels leading through metabolic rewiring in the cells.3 Remarkably, the functionalized NP treated cells restored the mitochondrial filamentous integrity compared to untreated controls (Fig. 6e, ZnNPs-H & ZnCuNPs-H panels). In summary, these findings provide compelling experimental evidence to highlight the robust nanozyme functions as a SOD1 mimic, especially in preventing mitochondrial dysfunction, which is most critical in inhibiting Parkinson's disease progression and neuronal death.
Previous reports suggest that MPP+-induced ROS-mediated cellular injury can cause the retraction of neurites, which can disrupt the intricate neuronal network and impair cellular communication.12,13 In context, MPP+ exposure also induces cellular shrinkage or atrophy accompanied by cytoskeletal rearrangement and changes in the distribution of cellular organelles. Therefore, we monitored the morphological changes in N2a cells using differential interference contrast (DIC) imaging (Fig. 6f). Notably, the loss of neurites upon exposure to neurotoxins was rescued by functionalized NPs. As illustrated in Fig. 6f (control panels), untreated N2a cells have a polygonal shape with distinct edges indicating normal cellular integrity. In particular, MPP+ treatment displayed changes in shape from polygonal to globular (shrunken cells) with smooth edges reflecting the apoptotic character and cellular damage in N2a cells (Fig. 6f (MPP+ panels)). Notably, ZnNPs-H and ZnCuNPs-H potentially alleviate the toxic effects of MPP+ on neurites and rejuvenate the cellular architecture by facilitating neurite outgrowth in N2a cells (Fig. 6f (ZnNPs-H/ZnCuNPs-H panels). To monitor the morphological changes of MPP+ treated and untreated N2a cells, we performed the cellular structure analysis through SEM. As shown in Fig. S14b (ESI†), the control cells showed intact morphology. However, N2a cells treated with MPP+ exhibit significant morphological alteration indicating complete cell shrinkage to oval shape (MPP+ panels). The reduced cell size and shape are presumably due to apoptotic behaviour in response to the neurotoxic effect of MPP+. In contrast, MPP+-challenged cells treated with ZnNPs-H/ZnCuNPs-H restored the morphology to the wild type, as indicated in Fig. S14b, ESI† (NP panels).
4. Conclusions
In summary, we report a new class of engineered nanomaterials with nanozyme activity specific to SOD1. The functionalized NPs (ZnNPs-H and ZnCuNPs-H) exhibited superior nanozyme activity by robust ROS scavenging compared to previously reported NPs. Moreover, the nanozyme effectively substituted the functions of SOD1 when challenging the mitochondrial integrity and cellular homeostasis in vitro. Most importantly, our tailored NPs were effectively internalized into mammalian cells without extrinsic targeting molecules and helped to restore the cellular integrity in functionally challenged mitochondria in cell line model systems. Our results highlight the advantages of SOD1 mimics as a nanozyme in maintaining cellular homeostasis, cytoskeletal architecture and protecting the mitochondrial oxidative injury critical to Parkinson's disease progression. Consequently, featuring a stable and potent candidate with robust bioavailability can revolutionize the drug industry with a multifaceted class of therapeutics. Thus, our findings may open new avenues for designing future therapeutics to treat neurological disorders associated with mitochondrial dysfunction.Author contributions
The manuscript was written through contributions of all authors. All authors have given approval to the final version of the manuscript.Conflicts of interest
The authors state that there are no conflicts to declare.Acknowledgements
This study was supported by the Department of Biotechnology (DBT-IISc Partnership Program Phase-II, no. BT/PR27952/IN/22/212/2018) and the Department of Science and Technology (DST-FIST Program-Phase III, no. SR/FST/LSII-045/2016-G). Sanjay Prasad would like to thank the Inorganic & Physical Chemistry department, Indian Institute of Science and Horiba Center for utilizing their Raman spectroscopy facility and zeta potential measurements, and Dr Parth Sarathi Nayak, for the DBT-RA post-doctoral fellowship (DBT-RA). The authors thank the TEM and confocal imaging facility in the Biochemistry department, Division of Biological Sciences, Indian Institute of Science. We also thank Dr Sourab Ghosh, Dr Devanjan Sinha, and Dr Srujan Matta for their critical and valuable comments on the manuscript.References
- C. Lennicke and H. M. Cochemé, Mol. Cell, 2021, 81, 3691–3707 CrossRef CAS PubMed.
- H. Sies and D. P. Jones, Nat. Rev. Mol. Cell Biol., 2020, 21, 363–383 CrossRef CAS PubMed.
- X. Dong-Chen, C. Yong, X. Yang, S. Chen-Yu and P. Li-Hua, Signal Transduction Targeted Ther., 2023, 8, 73 CrossRef PubMed.
- G. E. Vázquez-Vélez and H. Y. Zoghbi, Annu. Rev. Neurosci., 2021, 44, 87–108 CrossRef PubMed.
- M. E. Johnson, B. Stecher, V. Labrie, L. Brundin and P. Brundin, Trends Neurosci., 2019, 42, 4–13 CrossRef CAS PubMed.
- C. W. Ip, L.-C. Klaus, A. A. Karikari, N. P. Visanji, J. M. Brotchie, A. E. Lang, J. Volkmann and J. B. Koprich, Acta Neuropathol. Commun., 2017, 5, 1–12 CrossRef PubMed.
- A. Umeno, V. Biju and Y. Yoshida, Free Radical Res., 2017, 51, 413–427 CrossRef CAS PubMed.
- S. Salim, J. Pharmacol. Exp. Ther., 2017, 360, 201–205 CrossRef CAS PubMed.
- Y. Huang, J. Ren and X. Qu, Chem. Rev., 2019, 119, 4357–4412 CrossRef CAS PubMed.
- J. Wu, X. Wang, Q. Wang, Z. Lou, S. Li, Y. Zhu, L. Qin and H. Wei, Chem. Soc. Rev., 2019, 48, 1004–1076 RSC.
- D. Wang, D. Jana and Y. Zhao, Acc. Chem. Res., 2020, 53, 1389–1400 CrossRef CAS PubMed.
- N. Singh, M. A. Savanur, S. Srivastava, P. D'Silva and G. Mugesh, Angew. Chem., 2017, 129, 14455–14459 CrossRef.
- C. Hao, A. Qu, L. Xu, M. Sun, H. Zhang, C. Xu and H. Kuang, J. Am. Chem. Soc., 2018, 141, 1091–1099 CrossRef PubMed.
- H. J. Kwon, D. Kim, K. Seo, Y. G. Kim, S. I. Han, T. Kang, M. Soh and T. Hyeon, Angew. Chem., Int. Ed., 2018, 57, 9408–9412 CrossRef CAS PubMed.
- P. S. Nayak, S. M. Borah, H. Gogoi, S. Asthana, R. Bhatnagar, A. N. Jha and S. Jha, Chem. Eng. J., 2019, 361, 470–484 CrossRef CAS.
- M. Liang and X. Yan, Acc. Chem. Res., 2019, 52, 2190–2200 CrossRef CAS PubMed.
- R. Thiruppathi, S. Mishra, M. Ganapathy, P. Padmanabhan and B. Gulyás, Adv. Sci., 2017, 4, 1600279 CrossRef PubMed.
- S. J. Amina and B. Guo, Int. J. Nanomed., 2020, 15, 9823–9857 CrossRef CAS PubMed.
- D. Kim, K. Shin, S. G. Kwon and T. Hyeon, Adv. Mater., 2018, 30, 1802309 CrossRef PubMed.
- S. Ji, B. Jiang, H. Hao, Y. Chen, J. Dong, Y. Mao, Z. Zhang, R. Gao, W. Chen and R. Zhang, Nat. Catal., 2021, 4, 407–417 CrossRef CAS.
- S. Kuriakose, B. Satpati and S. Mohapatra, Phys. Chem. Chem. Phys., 2015, 17, 25172–25181 RSC.
- B. Singh, R. Gautam, S. Kumar and S. Umapathy, Curr. Sci., 2012, 102, 232–244 CAS.
- S. Moore, J. Biol. Chem., 1968, 243, 6281–6283 CrossRef CAS PubMed.
- J. A. Tainer, E. D. Getzoff, J. S. Richardson and D. C. Richardson, Nature, 1983, 306, 284–287 CrossRef CAS PubMed.
- N. Singh, M. A. Savanur, S. Srivastava, P. D'Silva and G. Mugesh, Nanoscale, 2019, 11, 3855–3863 RSC.
- M. Arakha, J. Roy, P. S. Nayak, B. Mallick and S. Jha, Free Radicals Biol. Med., 2017, 110, 42–53 CrossRef CAS PubMed.
- A.-F. Miller, Curr. Opin. Chem. Biol., 2004, 8, 162–168 CrossRef CAS PubMed.
- M. Arakha, J. Roy, P. S. Nayak, B. Mallick and S. Jha, Free Radicals Biol. Med., 2017, 110, 42–53 CrossRef CAS PubMed.
- Y. Ji, X. Yang, Z. Ji, L. Zhu, N. Ma, D. Chen, X. Jia, J. Tang and Y. Cao, ACS Omega, 2020, 5, 8572–8578 CrossRef CAS PubMed.
- H. Takeuchi, Biopolymers, 2003, 72, 305–317 CrossRef CAS PubMed.
- J. B. Zhong, J. Zhang Li, Y. Lu, X. Yang He, J. Zeng, W. Hu and Y. Cheng Shen, Appl. Surf. Sci., 2012, 258, 4929–4933 CrossRef CAS.
- C.-C. Lin, H.-P. Chen, H.-C. Liao and S.-Y. Chen, Appl. Phys. Lett., 2005, 86, 183103 CrossRef.
- H. Ma, L. Yue, C. Yu, X. Dong, X. Zhang, M. Xue, X. Zhang and Y. Fu, J. Mater. Chem., 2012, 22, 23780–23788 RSC.
- I. A. Mudunkotuwa and V. H. Grassian, Langmuir, 2014, 30, 8751–8760 CrossRef CAS PubMed.
- B. Meesaragandla, S. Karanth, U. Janke and M. Delcea, Sci. Rep., 2020, 10, 1–14 CrossRef PubMed.
- R. A. Copeland, Enzymes: a practical introduction to structure, mechanism, and data analysis, John Wiley & Sons, 2000 Search PubMed.
- J. Baek, B. Rungtaweevoranit, X. Pei, M. Park, S. C. Fakra, Y.-S. Liu, R. Matheu, S. A. Alshmimri, S. Alshehri and C. A. Trickett, J. Am. Chem. Soc., 2018, 140, 18208–18216 CrossRef CAS PubMed.
- T. P. Waingankar and P. D’Silva, J. Biol. Chem., 2021, 297, 101349 CrossRef CAS PubMed.
- A. Saminathan, M. Zajac, P. Anees and Y. Krishnan, Nat. Rev. Mater., 2022, 7, 355–371 CrossRef.
- R. K. Pathak, N. Kolishetti and S. Dhar, Wiley Interdiscip. Rev.: Nanomed. Nanobiotechnol., 2015, 7, 315–329 CAS.
- C. He, Y. Hu, L. Yin, C. Tang and C. Yin, Biomaterials, 2010, 31, 3657–3666 CrossRef CAS PubMed.
- N. Singh, S. K. NaveenKumar, M. Geethika and G. Mugesh, Angew. Chem., Int. Ed., 2021, 60, 3121–3130 CrossRef CAS PubMed.
- R. Somwar, H. Erdjument-Bromage, E. Larsson, D. Shum, W. W. Lockwood, G. Yang, C. Sander, O. Ouerfelli, P. J. Tempst and H. Djaballah, Proc. Natl. Acad. Sci. U. S. A., 2011, 108, 16375–16380 CrossRef CAS PubMed.
- S. Li, L. Fu, T. Tian, L. Deng, H. Li, W. Xia and Q. Gong, Cell Commun. Signaling, 2018, 16, 1–13 CrossRef PubMed.
- A. Rovini, K. Heslop, E. G. Hunt, M. E. Morris, D. Fang, M. Gooz, A. A. Gerencser and E. N. Maldonado, FASEB J., 2021, 35, e21148 CrossRef CAS PubMed.
- F. Sivandzade, A. Bhalerao and L. Cucullo, Bio-Protoc., 2019, 9, e3128 Search PubMed.
- W. Poewe, K. Seppi, C. M. Tanner, G. M. Halliday, P. Brundin, J. Volkmann, A.-E. Schrag and A. E. Lang, Nat. Rev. Dis. primers, 2017, 3, 1–21 Search PubMed.
- A. B. Malpartida, M. Williamson, D. P. Narendra, R. Wade-Martins and B. J. Ryan, Trends Biochem. Sci., 2021, 46, 329–343 CrossRef CAS PubMed.
- H. Kim and X. Xue, J. Visualized Exp., 2020, 160, e60682 Search PubMed.
- H. Yang, L. Li, Y. Jiao, Y. Zhang, Y. Wang, K. Zhu and C. Sun, Sci. Rep., 2021, 11, 21604 CrossRef CAS PubMed.
Footnotes |
| † Electronic supplementary information (ESI) available. See DOI: https://doi.org/10.1039/d3ma00743j |
| ‡ These authors contributed equally to this work. |
| This journal is © The Royal Society of Chemistry 2024 |