
 Open Access Article
 This Open Access Article is licensed under a Creative Commons Attribution-Non Commercial 3.0 Unported Licence
Insight into the electron transfer and anti-thermal quenching of europium doped Li4SrCa(SiO4)2†
Jieqi
Hu
 ab,
Philippe F.
Smet
a,
Rik
Van Deun
b and
David
Van der Heggen
*a
ab,
Philippe F.
Smet
a,
Rik
Van Deun
b and
David
Van der Heggen
*a
aLumiLab, Department of Solid State Sciences, Ghent University, Krijgslaan 281-S1, 9000 Gent, Belgium. E-mail: david.vanderheggen@ugent.be
bL3, Department of Chemistry, Ghent University, Krijgslaan 281-S3, 9000 Gent, Belgium
First published on 28th November 2023
Abstract
The understanding of lanthanide-related electron transfer processes is crucial for designing efficient and functional luminescent phosphors. However, the current knowledge on those processes between Eu ions with different oxidation states is rather scarce, which limits the progress of developing new efficient phosphors with good stability. In this work, we report on Eu2+-doped Li4SrCa(SiO4)2 and its solid solutions, in which optically-induced reversible electron transfer between Eu2+ and Eu3+ is demonstrated under illumination at different wavelengths. It is confirmed that the reversible electron transfer between Eu2+ and Eu3+ in inequivalent sites can be initiated by exciting the corresponding Eu2+. Additionally, it is shown that the strong increase in orange emission intensity of EuCa2+ with temperature can be attributed to the thermally-assisted energy transfer from EuSr2+ to EuCa2+ and an increase of EuCa2+ centers due to photoinduced electron transfer. This phosphor was previously reported as a potential candidate for luminescence thermometry but, as shown here, the temperature-dependent, reversible electron transfer processes in combination with temperature-dependent energy transfer between Eu2+ ions on two different crystallographic sites would strongly compromise any attempt of measuring temperatures with this phosphor. The results of this work advance our understanding of electron transfer between Eu2+ and Eu3+ in general, which is very relevant for other europium doped phosphors.
Introduction
Lanthanide activators are widely used in luminescent materials.1 As a commonly used lanthanide dopant, europium (Eu) can be incorporated in both divalent and trivalent oxidation states.1 Even in phosphors that are intentionally doped with Eu2+, the presence of Eu3+ is often unavoidable due to incomplete reduction during synthesis.2–4 In certain cases, illumination of the phosphor can also result in optically-induced oxidation or reduction of Eu2+ and Eu3+, respectively, due to an electron transfer between the activator ion and another dopant ion or intrinsic defect such as a vacancy.4–7 If this electron transfer occurs between two metal ions differing only in oxidation state, the process is called intervalence charge transfer (IVCT).8 However, such IVCT between Eu2+ and Eu3+ usually manifests itself as a quenching effect when the two Eu ions are incorporated on the same crystallographic site, or as so-called anomalous emission in a few exceptions, making it difficult to be identified.9–11If the Eu ions are incorporated on two non-equivalent crystallographic sites, one may expect IVCT between Eu2+ and Eu3+ which will result in a change in emission color of the phosphor, because the emission spectrum originating from the 4f65d1–4f7 parity-allowed transitions of Eu2+ is highly sensitive to the local environment around Eu2+.1,12 This kind of IVCT and the accompanying change in luminescence has been reported in Li4SrCa(SiO4)2:Eu2+ by Shi et al.12 In Li4SrCa(SiO4)2, there are two crystallographic sites available for Eu substitution, a Sr2+ site (CN = 10) with Cs symmetry in a coordination polyhedron of distorted bicapped square antiprisms, and a Ca2+ site (CN = 6) with C2 symmetry in a smaller distorted octahedron (see Fig. S1, ESI†).13 As reported in literature, Eu2+ ions prefer to occupy the Sr2+ site (denoted as EuSr2+) resulting in blue emission, while only a small fraction of Eu2+ ions are incorporated on the Ca2+ site (denoted as EuCa2+) resulting in orange emission.12,14 Such preferential site occupation is also consistent with the fact that there is a smaller ionic radius difference between 10-coordinated Eu2+ (1.35 Å) and Sr2+ (1.36 Å), than between 6-coordinated Eu2+ (1.17 Å) and Ca2+ (1.0 Å).15 Shi et al. reported that there is a substantial increase of EuCa2+-related orange emission and a simultaneous small decrease of EuSr2+-related blue emission if the sample is exposed to 330 nm illumination at an elevated temperature of 227 °C.12 Moreover they showed that this optically induced change in luminescence is stable under repeated heating and cooling of the material, provided that an equilibrium is reached under 330 nm illumination at 227 °C first. Based on these two properties it was claimed that Li4SrCa(SiO4)2:Eu2+ can be exploited for temperature sensing based on the intensity ratio of the orange to blue emission under 330 nm excitation because the intensity ratio increases with temperature.12 However, the origin of this increase was not discussed.12 Unfortunately, the presented emission spectra for the temperature sensing are area-normalized, which obscures the analysis of the thermal quenching behaviour of EuCa2+ orange emission under 330 nm excitation.12
However, following the work of Shi et al., the idea to apply Li4SrCa(SiO4)2:Eu2+ for temperature sensing was adopted by Wu et al. using the same intensity ratio method but under 363 nm excitation.16 They also found that the orange to blue intensity ratio increases with temperature, and the non-normalized emission spectra at different temperatures clearly show the anti-thermal quenching of EuCa2+ orange emission, i.e. an increase in emission intensity with temperature. In this case, the anti-thermal quenching was attributed to the temperature-dependent energy transfer, but the optically-induced electron transfer process, which also impacts the temperature-dependent luminescence, was not discussed. Recently, Su et al. exploited the luminescence properties of Li4SrCa(SiO4)2:Eu2+ for pressure sensing based on the same intensity ratio method under excitation with a 355 nm laser.17 Unfortunately, the influence of optically-induced electron transfer process during the measurement was not considered either.17
As a consequence, the effects of optical stimulation and temperature on the luminescence changes in Li4SrCa(SiO4)2:Eu2+ are still only poorly understood as the two processes that affect it, i.e. energy transfer and electron transfer, have not yet been considered simultaneously. Moreover, the irreversibility of the charge transfer process reported by Shi et al. is in stark contrast to the behaviour of many other materials such as persistent phosphors like Sr4Al14O25:Eu2+,Dy3+, optically stimulated or thermally stimulated dosimeters like SrAl2O4:Eu2+,Sm3+ or photochromic materials like CaF2:Eu2+,Sm3+ in which the charge transfer between defects is usually reversible if the material is heated to a sufficiently high temperature or exposed to stimulation light with a suitable wavelength.5,12,18,19 Given that the applicability of this phosphor as an optical thermometer or pressure sensor highly depends on the stability of the charge transfer state, it is highly desirable that these charge and energy transfer processes are studied in more detail.
To study the electron transfer process responsible for the reduction and oxidation of the Eu dopant in this system, Li4Sr1+xCa1−x(SiO4)2:Eu2+ solid solutions were prepared. The influence of illumination wavelength, illumination time, illumination sequence and the role of temperature on the charge transfer between Eu2+ and Eu3+ were investigated in detail through photoluminescence and reflectance spectroscopy. Thermal quenching, thermally-assisted energy transfer and electron transfer are all considered at different temperatures to get a comprehensive understanding of the relevant processes at play in these materials.
Methods
Li4Sr0.99+xCa0.99−x(SiO4)2:0.02Eu2+ (x = −0.25, 0, 0.4) powders were synthesized by a high-temperature solid-state reaction, using high-purity Li2CO3 (Alfa Aesar, 99.998%), Sr2CO3 (Sigma Aldrich, 99.9%), CaCO3 (Sigma Aldrich, 99.0%), SiO2 (Alfa Aesar, 99.5%) and Eu2O3 (Alfa Aesar, 99.95%) as precursors. Stoichiometric mixtures of the precursors were weighed and ground and then precalcined at 700 °C in air for 6 h and finally fired at 920 °C for 6 h in a tube furnace under a flow of forming gas (10% H2, 90% N2). Then the product was naturally cooled to room temperature and slightly re-ground for further characterizations. A Li4Sr0.9975Ca0.9975(SiO4)2:0.005Eu2+ sample with a lower doping concentration was also prepared by the same procedure. In addition, firing in air atmosphere, instead of a reducing atmosphere, was applied to prepare Eu3+ doped Li4Sr0.99Ca0.99(SiO4)2:0.02Eu3+ while keeping other preparation conditions the same.The phase purity was determined by X-ray diffraction (XRD) using a Siemens D5000 diffractometer (40 kV, 40 mA) with Cu Kα radiation (λ = 0.154 nm). From XRD peaks, lattice parameters were calculated using UnitCellWin software.20 Photoluminescence (PL) emission and excitation (PLE) spectra of the sample were collected at room temperature using an Edinburgh Instrument FS920 fluorescence spectrometer equipped with a monochromated 450 W xenon arc lamp as excitation source. Low-temperature PL/PLE measurements were done inside a cryostat (Oxford Instruments Optistat CF). All spectra were corrected for detector response. To investigate the wavelength-dependent electron transfer, efficiency spectra for electron transfer are estimated by comparing the change of orange emission intensity before and after the illumination with the same number of incident photons with a certain wavelength. The efficiency of this process in the range of 300–430 nm for Li4Sr0.99+xCa0.99−x(SiO4)2:0.02Eu2+ (x = −0.25) was recorded using the monochromated xenon arc lamp from the FS920 spectrometer as the illumination source of different wavelengths. The same setup was used to record emission spectra upon excitation at 420 nm. The efficiency of the process in the range of 410–570 nm for Li4Sr0.99+xCa0.99−x(SiO4)2:0.02Eu2+ (x = 0.4) or 330 nm illuminated Li4Sr0.99+xCa0.99−x(SiO4)2:0.02Eu2+ (x = −0.25), was measured in a setup, having a wavelength-tunable OPO laser (Ekspla NT340), shutters, and a fiber-based detection (QE65000 spectrometer, Ocean Optics) of the emission spectra under 420 nm LED excitation. The intensity of the illumination light at the different wavelengths originating from the monochromated xenon arc lamp and the OPO laser was measured with a thermal power sensor (S401C, Thorlabs) and a pyroelectric energy sensor (ES220C, Thorlabs), respectively, to correct for the differences in illumination intensity. Measurements of the reflectance at 420 nm accompanied with recording the PL spectrum as a function of 365 nm LED illumination time under excitation with 365 nm LED or 420 nm LED, were performed in an experimental setup schematically depicted in Fig. S2 (ESI†), having two LEDs, two shutters and two spectrometers (QE65000, and AvaSpec-HERO, Avantes). Temperature-dependent PL under 365 nm or 420 nm LED excitation, were measured with a Linkam THMS600 temperature-controlled stage (60 °C min−1) and fiber-based detection setup. To minimize the effect of electron transfer resulted from excitation LED during temperature-dependent PL measurement, the shutter for the excitation LED was open only when necessary.
Results and discussion
To investigate the composition-dependent and concentration-dependent electron and energy transfer processes, Li4Sr0.99+xCa0.99−x(SiO4)2:0.02Eu2+ (x = −0.25, 0, 0.4) and Li4Sr0.9975Ca0.9975(SiO4)2:0.005Eu2+ were prepared under a reducing atmosphere. Hereinafter, these compositions will be abbreviated as Ca-rich:0.02Eu, Ca-Sr:0.02Eu, Sr-rich:0.02Eu, and Ca-Sr:0.005Eu, respectively. Other compositions with x outside the range of −0.25 to 0.4 could not be synthesized as impurity phases appear.14 In addition, Li4Sr0.99Ca0.99(SiO4)2:0.02Eu3+ (abbreviated as Ca-Sr:0.02Eu (air)) was prepared in an air atmosphere to investigate the Eu3+ photoluminescence. As shown in Fig. 1a, the XRD patterns of all samples match well with the standard pattern of Li4SrCa(SiO4)2 (JCPDS 83-0763). The corresponding lattice parameters increase with the Sr-content due to the larger ionic radius of Sr2+ than Ca2+ (Fig. 1b).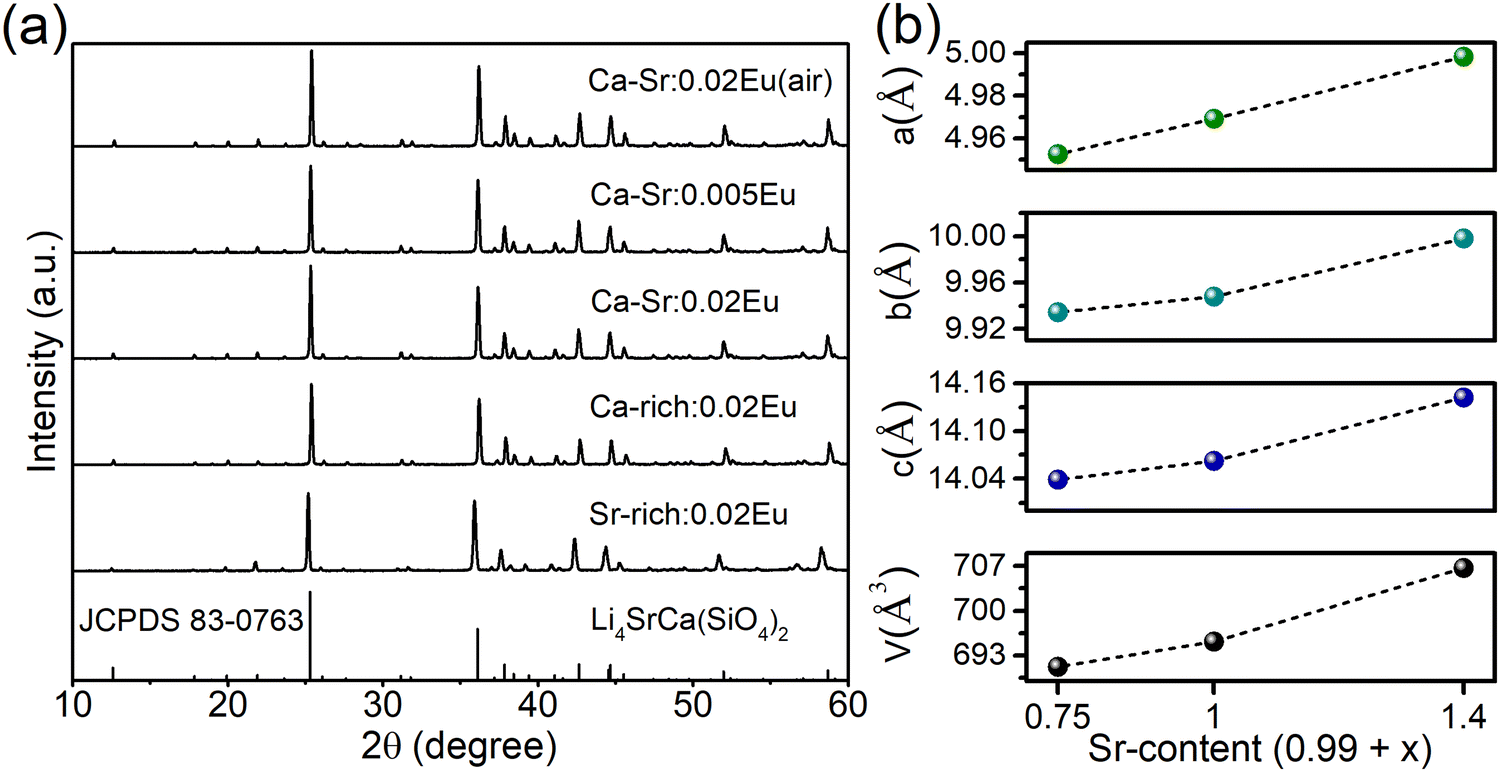 | ||
| Fig. 1 (a) XRD patterns of all samples and the reference pattern of Li4SrCa(SiO4)2 (JCPDS 83-0763). (b) The lattice parameters extracted from the XRD patterns for the samples prepared under a reducing atmosphere with 0.02Eu concentration. | ||
When prepared in air, Eu is incorporated in its trivalent oxidation state and low-temperature PL and PLE measurements allow to differentiate between Eu3+ ions incorporated on the two available sites (Fig. 2). Here EuCa3+ gives rise to a prominent emission at 588.5 nm originating from the 5D0 → 7F1 transition when excited by 250 nm, while an intense 5D0 → 7F4 emission can be observed at 692.5 nm under 280 nm excitation which can be ascribed to EuSr3+.12,21,22 Such a difference in Eu3+ luminescence is due to the difference in site symmetry, i.e. C2 symmetry for Ca2+ site and Cs symmetry for Sr2+ site.21 When a reducing atmosphere is used during the synthesis, two broad emission bands are observed in Ca-Sr:0.02Eu, each with a distinct excitation spectrum (Fig. 3a). Following the assignments by Shi et al., the blue emission, peaking at 433 nm, is due to EuSr2+while the orange emission, peaking at 589 nm originates from EuCa2+. The coexistence of both emission bands is better visualized in Fig. 3b under 365 nm excitation, a wavelength which predominantly excites EuSr2+. However, if we change the host composition to Ca-rich:0.02Eu, the orange emission is absent in the as-synthesized sample under 365 nm excitation and only the blue emission band is observed (Fig. 4a). On the contrary, in as-synthesized Sr-rich:0.02Eu, a pronounced orange emission band appears, even under 330 nm excitation which favors the excitation of the blue-emitting centers much more than the orange-emitting centers (Fig. 4b).14 It hence appears that increasing the Ca-content suppresses the formation of orange-emitting EuCa2+ centers during synthesis while an increase of Sr-content results in an increased formation of EuCa2+ centers.14
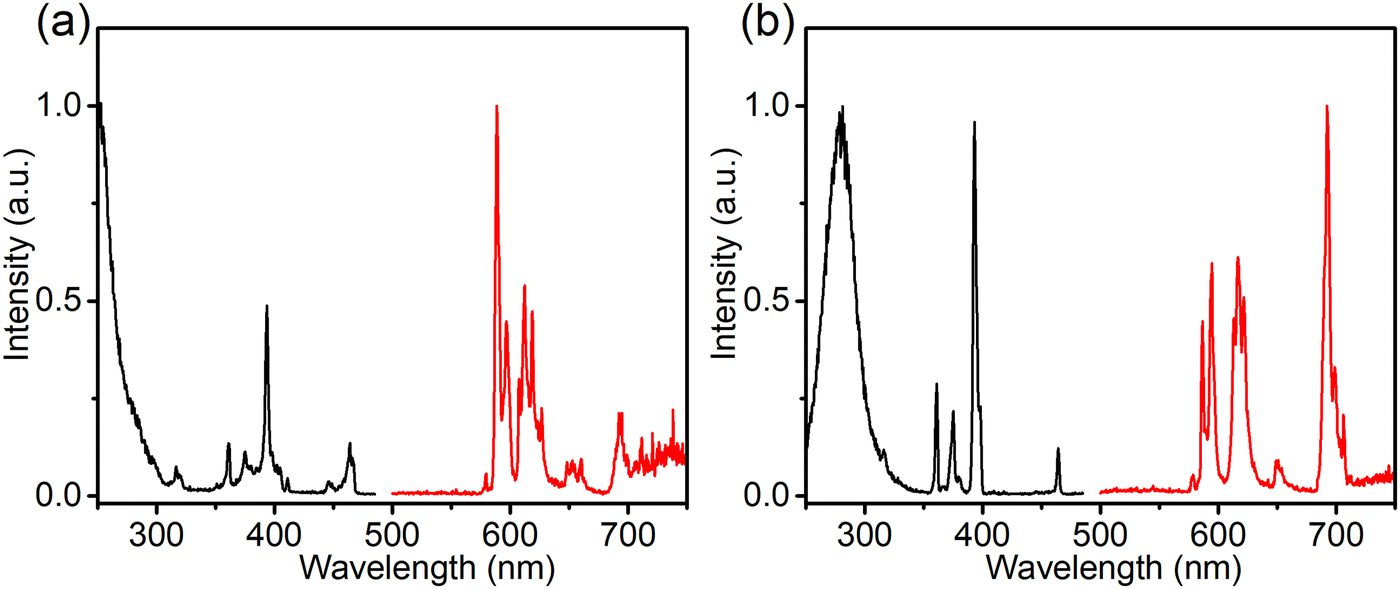 | ||
| Fig. 2 Normalized PL and PLE spectra (at −196 °C) of the Ca-Sr:0.02Eu (air) for (a) EuCa3+ sites (λem= 588.5 nm; λex = 250.0 nm) and (b) EuSr3+ sites (λem= 692.5 nm; λex = 280.0 nm). | ||
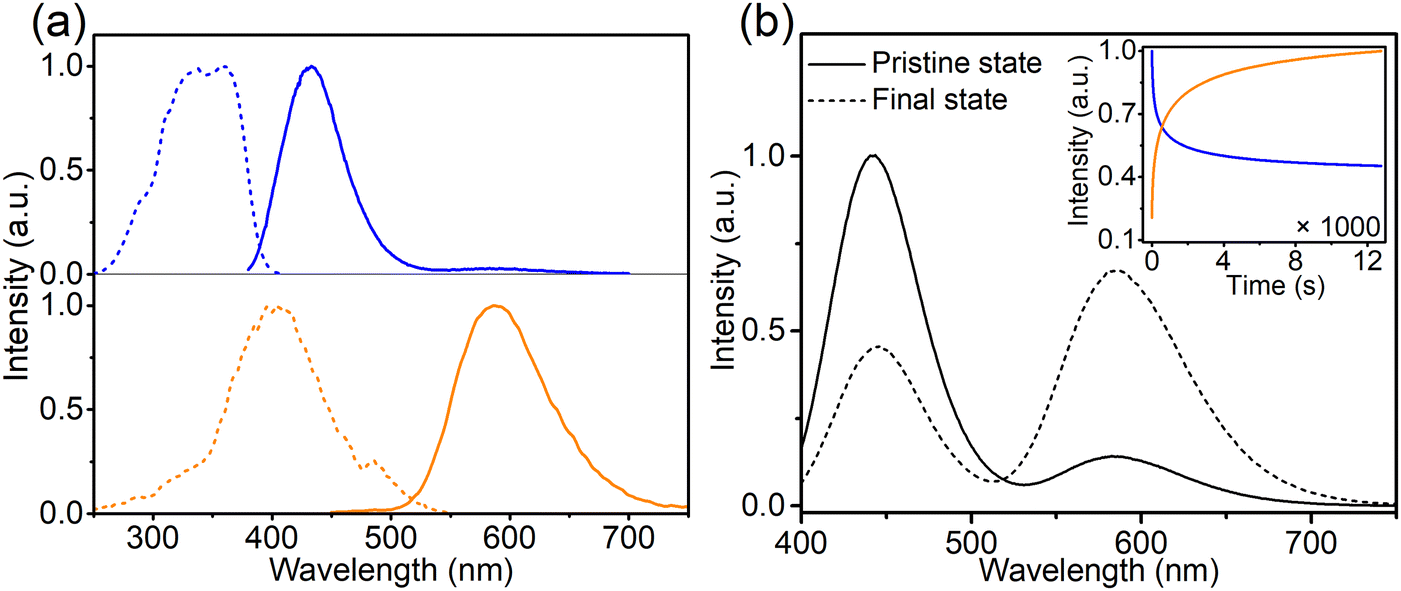 | ||
Fig. 3 (a) Normalized PL (—) and PLE (---) spectra of the Ca-Sr:0.02Eu for the blue (λem= 450 nm; λex = 330 nm) and orange (λem= 589 nm; λex = 420 nm) emission centers. (b) PL of the Ca-Sr:0.02Eu before and after 365 nm LED illumination under the excitation of the same LED. The inset shows the change of blue and orange emission intensities as a function of illumination time (pristine is taken at t = 0 s, while the final state is for t = 12![[thin space (1/6-em)]](https://www.rsc.org/images/entities/char_2009.gif) 000 s). 000 s). | ||
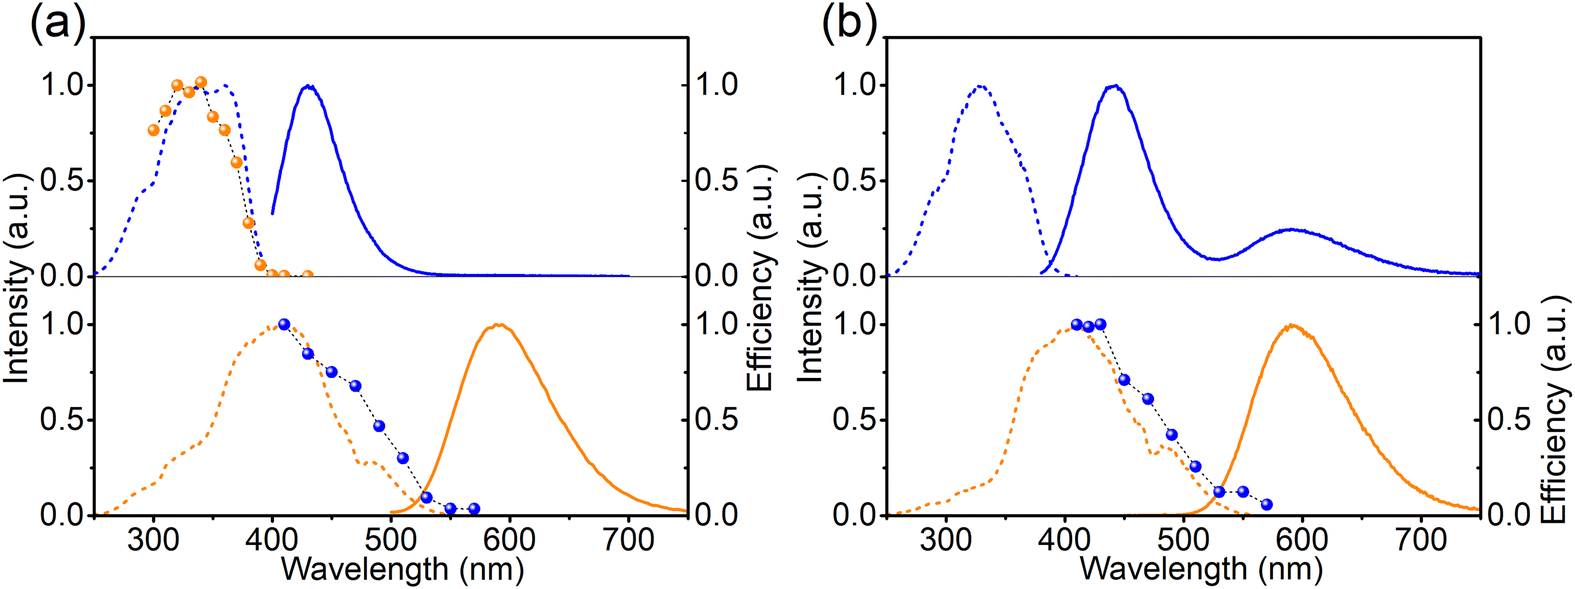 | ||
| Fig. 4 (a) PLE (---) and PL (—) of as-synthesized Ca-rich:0.02Eu (blue lines, λem= 450 nm; λex = 365 nm) and of Ca-rich:0.02Eu after 330 nm illumination (orange lines, λem= 589 nm; λex = 420 nm). Electron transfer efficiency spectra for forward (orange spheres) and backward (blue spheres) electron transfer. (b) PLE (---) and PL (—) of as-synthesized Sr-rich:0.02Eu for the blue (λem= 450 nm; λex = 330 nm) and orange (λem= 589 nm; λex = 420 nm) emission centers, and the efficiency spectrum for backward electron transfer (blue spheres). | ||
The intensity of the two emission bands in Ca-Sr:0.02Eu exhibits a strong variation under continuous 365 nm excitation (3.8 mW cm−2, inset of Fig. 3b). After 12000 s of irradiation the intensities stabilize. The blue emission intensity has then decreased by roughly 50% while the orange emission intensity has increased dramatically by 380%. A similar evolution of the Eu2+ luminescence in Li4SrCa(SiO4)2:Eu2+ has been reported by Shi et al. under illumination with 330 nm light at the elevated temperature of 227 °C, but they claimed that there is no detectable luminescence change when applying the same illumination at room temperature.12 In contrast, here we demonstrate that a similar effect can be achieved at room temperature even under illumination with lower energy photons. After the illumination is ended, the change is spontaneously reversed albeit relatively slowly at room temperature (Fig. S3, ESI†). If the material is heated to 200 °C, this reverse process can be accelerated (Fig. S3, ESI†). Both observations contradict the results by Shi et al.12 One might argue that this is due to the different temperature at which the samples were illuminated. Hence the sample was exposed to 365 nm (2.8 mW cm−2) at 227 °C for 20 min to induce the creation of EuCa2+ centers and then kept at room temperature (60 min), 80 °C (30 min) and 200 °C (20 min). As shown in Fig. S4 (ESI†) also in this case the induced luminescence change is unstable.
This behaviour is also observed in Ca-rich:0.02Eu and Sr-rich0.02Eu samples, as will be shown later. This behaviour is very similar to what is encountered in many other inorganic luminescent or photochromic materials, such as CaF2:Eu2+,Sm3+, SrAl2O4:Eu2+,Sm3+ and Sr4Al14O25:Eu2+,Dy3+.5,18,19 In accordance with the widely accepted mechanisms in these materials, we propose a similar charge transfer process to explain the luminescence evolution:
| EuSr2+ + EuCa3+ ↔ EuSr3+ + EuCa2+ | (1) |
To study the mechanism behind the optically induced forward (from left to right in eqn (1)) or backward (from right to left in eqn (1)) charge transfer, the pristine Ca-rich:0.02Eu sample was exposed to light with different wavelengths but equal integrated intensities. The changes in EuCa2+ concentration were monitored by recording the orange emission intensity under 420 nm excitation. Note that prior to the measurement for the backward charge transfer in Ca-rich:0.02Eu, the sample was illuminated by 330 nm for a sufficiently long time to maximize the concentration of EuCa2+ ions as almost no EuCa2+ centers are present in the as-synthesized material. As shown in Fig. 4a, the efficiency spectra for forward and backward charge transfer in Ca-rich:0.02Eu almost perfectly coincide with the PLE spectra of the involved divalent europium ions. Small discrepancies in the range of 340–370 nm can most likely be attributed to the overlap between the PLE of EuCa2+ and EuSr2+ which results in a competition between the two opposite directions of the reaction in eqn (1). This result indicates that the reaction in eqn (1) can be initiated in both directions through excitation of the involved divalent lanthanide ion. Similar results are obtained for the Sr-rich:0.02Eu (Fig. 4b) where the charge transfer efficiency spectrum for backward charge transfer coincides with the PLE of EuCa2+ as well, suggesting the charge transfer can be achieved by exciting EuCa2+. The efficiency spectrum corresponding to the forward charge transfer of Sr-rich:0.02Eu is not measured, since the existing high concentration EuCa2+ centers dramatically affects the recorded efficiency spectrum making it impossible to extract reliable information from the result. It should be emphasised that for the Sr-rich:0.02Eu most EuCa2+ centers already exist in the as-synthesized sample, whereas for the Ca-rich:0.02Eu sample most of the EuCa2+ centers are obtained by illumination. It can thus not a priori be assumed that both will behave in exactly the same way.
It is now clear that it is possible to change the ratio of blue to orange emission intensity in the as-synthesized materials by changing the composition of the host matrix. Naturally also the optically induced photoreduction and oxidation of the Eu ions are affected by the change in composition. If the as-synthesized samples are exposed to 330 nm light (Fig. 5a), thereby almost exclusively exciting the EuSr2+, the blue emission intensity decreases and simultaneously the orange emission increases in all compositions. This indicates that the reaction in eqn (1) proceeds in the forward direction, as expected. If the samples are subsequently exposed to 420 nm light which exclusively excites the EuCa2+ centers, the changes are reversed indicating the reaction in eqn (1) proceeds in the backward direction.
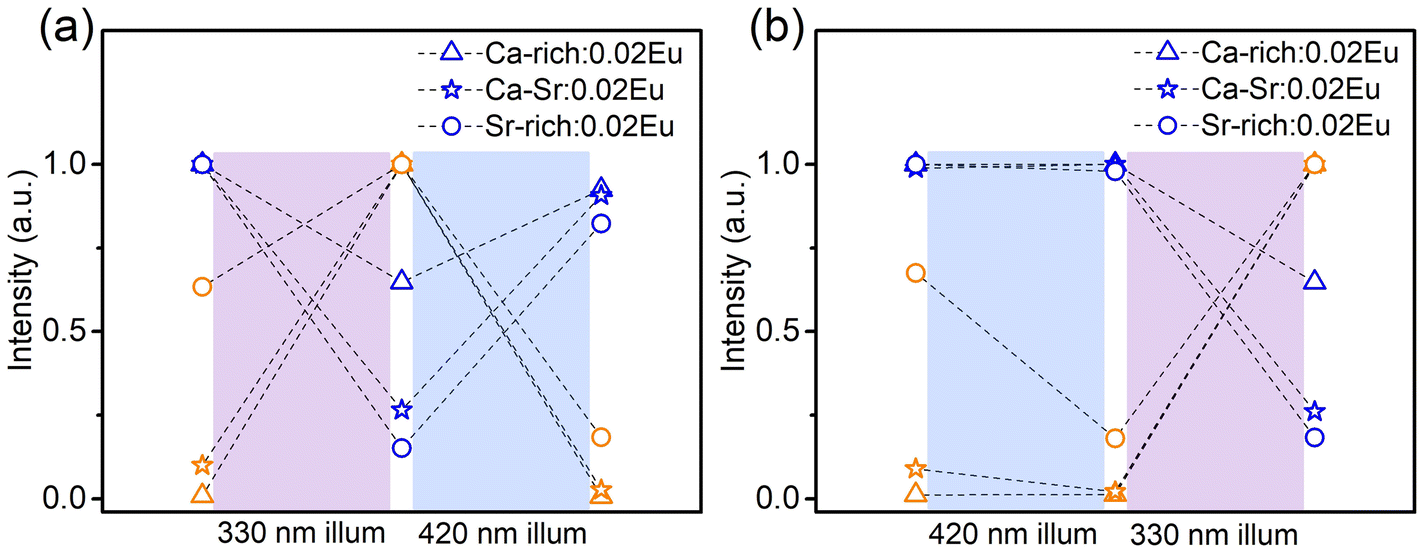 | ||
| Fig. 5 Variation of blue and orange emissions excited using 365 nm light after illumination in a sequence of (a) 330 nm then 420 nm or (b) 420 nm then 330 nm for sufficiently long time, until saturation. | ||
If the sequence of illumination is changed (Fig. 5b), the situation is slightly more complicated. For the as-synthesized Ca-rich:0.02Eu and Ca-Sr:0.02Eu samples, illumination with 420 nm again induces an electron transfer from EuCa2+ to EuSr3+ although the changes are small due to the relatively small concentration of EuCa2+. However, in the Sr-rich:0.02Eu sample the decrease in orange emission intensity is not accompanied by an increase in blue emission. This can be understood by considering that the reaction in eqn (1) can only occur in the backward direction if there are sufficient EuSr3+. The existence of a large fraction of Eu3+ in Li4SrCa(SiO4)2:Eu2+ has previously been confirmed using X-ray absorption near-edge structure measurement, however, site-selective PL spectroscopy suggested a preferential occupation of Eu3+ on Ca2+ sites in Li4SrCa(SiO4)2:Eu3+.12,15 In addition, Zhang et al. has reported the presence of narrow Eu3+ emission at 589 and 611 nm in Li4Ca0.8Sr1.16(SiO4)2:0.04Eu2+, which can be ascribed to EuCa3+ according to our previous analysis in Fig. 2.14 Also here only emission related to EuCa3+ could be identified in the as-synthesized Sr-rich:0.02Eu (Fig. S5, ESI†). This suggest that the redox reaction in eqn (1) cannot proceed in the backward direction due to a shortage of EuSr3+ centers in the as-synthesized Sr-rich:0.02Eu. Hence, another defect acts as an electron trapping center. Unfortunately, the chemical nature of this defect remains unknown at the moment. We also evaluated the repeatability of electron transfer process by alternating 330 nm and 420 nm illumination for multiple cycles, and the variations of orange emission shown in Fig. S6 (ESI†) convince us that electron transfer process is optically reversible with good repeatability for all the samples.
For the sake of completeness, the behaviour of all samples under illumination with 365 nm LED (7.93 mW cm−2), close to the wavelength of 363 nm employed by Wu et al., was also investigated (Fig. 6a and b).16 At this wavelength both sites are excited with a comparable efficiency (Fig. 3 and 4). Hence, the direction in which the reaction in eqn (1) will proceed will be determined by the initial concentrations of EuSr2+ and EuCa2+ centers in the as-synthesized samples and will result in a decrease of the most abundant species. In the Ca-rich:0.02Eu and Ca-Sr:0.02Eu samples, illumination with 365 nm light will mainly excite EuSr2+ centers and hence the behaviour is similar to that under exposure to 330 nm light. In contrast, in the Sr-rich:0.02Eu sample mostly EuCa2+ centers will be excited and hence the behaviour is similar to that encountered under illumination with 420 nm light.
 | ||
| Fig. 6 Variation of blue (blue lines) and orange (orange lines) emissions over time under continuous 365 nm illumination using 365 nm light (a) and (c) or 420 nm light (b) and (d) to excite the luminescence in different samples. | ||
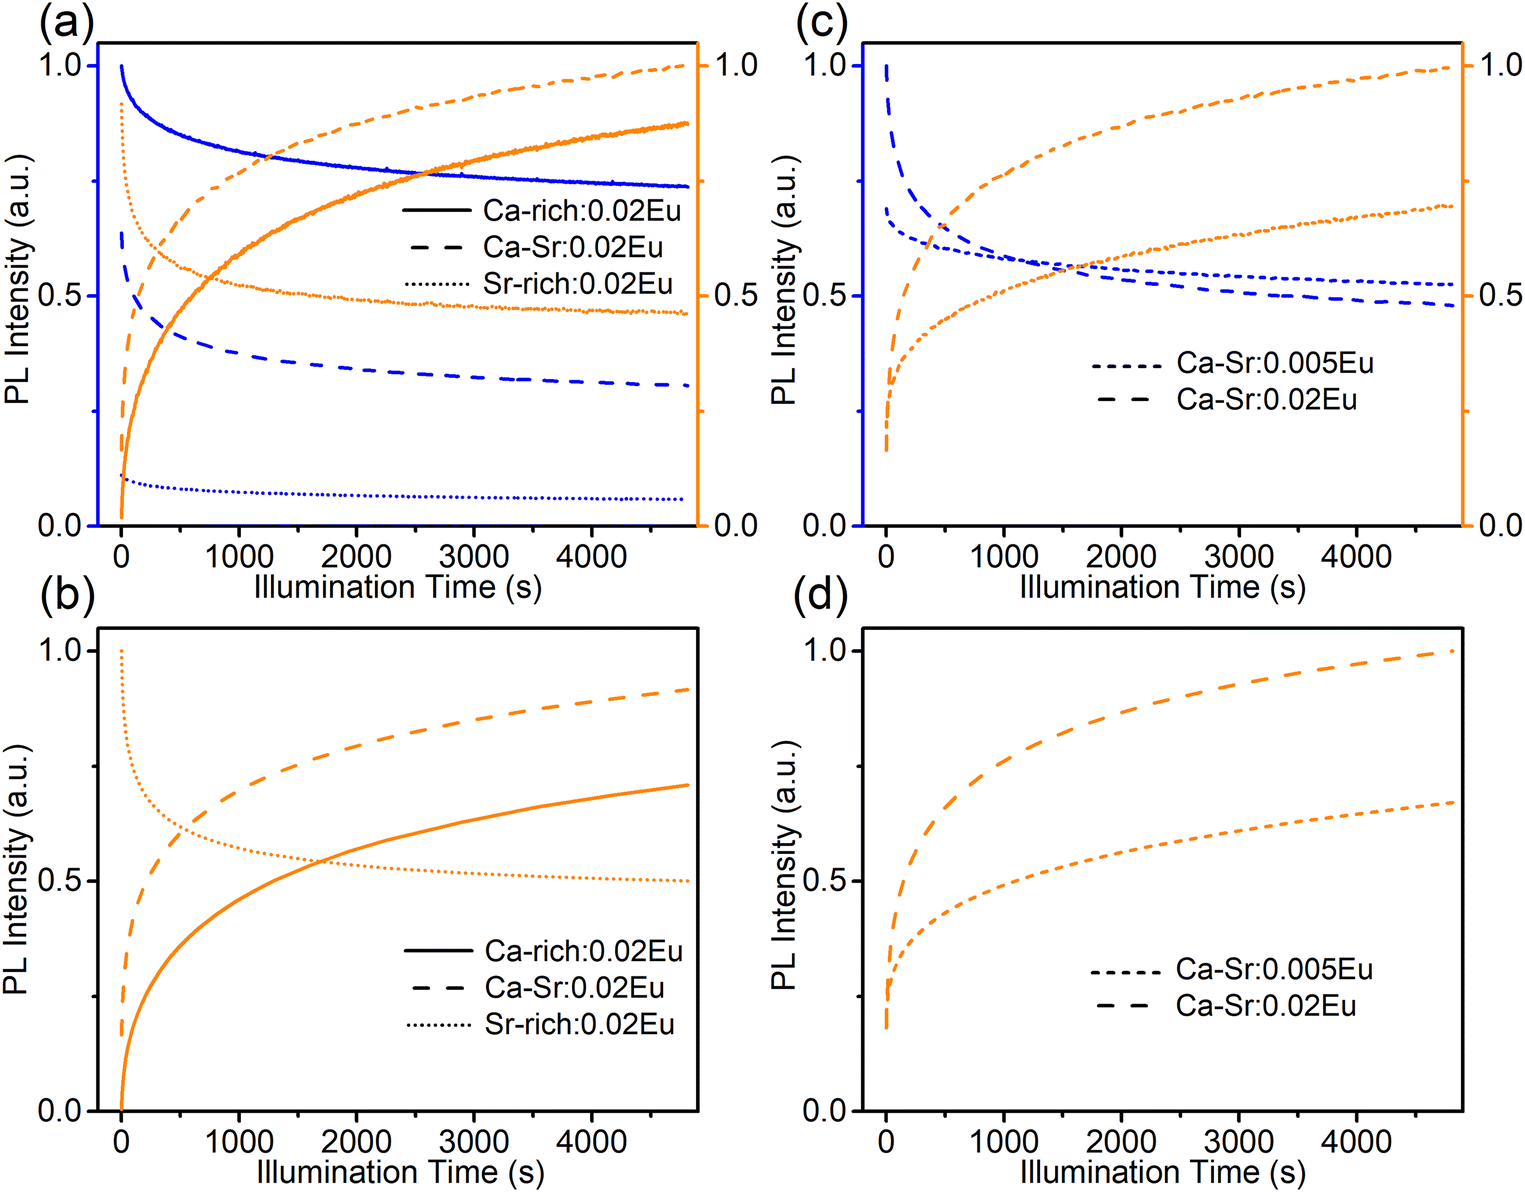
Apart from varying compositions also the influence of doping concentration was investigated (Fig. 6c and d) by comparing the photoredox processes for Ca-Sr:0.005Eu and Ca-Sr:0.02Eu. The increase of both orange emission intensity and the absorption at 420 nm (Fig. S7b, ESI†) are much more evident in Ca-Sr:0.02Eu than in Ca-Sr:0.005Eu. Therefore, it is safe to conclude that a higher doping concentration leads to the formation of more EuCa2+ centers when the same 365 nm illumination process is applied. This concentration dependency might also offer an explanation why Shi et al. did not observe any charge transfer under 330 nm illumination at room temperature as the doping concentration in their sample is 60% lower than the concentration used here.12 However, the intensity of the illumination light might also play a role since a high power 365 nm LED was used in our case while they only used monochromated 330 nm from Xe lamp.12
To construct a more detailed picture of electron transfer, and to facilitate the analysis of the following thermal quenching (TQ) behaviour, the effect of temperature on the photo-redox efficiency was investigated (Fig. 7 and Fig. S8, ESI†). After 365 nm (2.8 mW cm−2) illumination at 227 °C, the orange emission of Ca-Sr:0.02Eu significantly increased by a factor of 8.6 (Fig. 7a), while the same illumination at room temperature only resulted in an increase by a factor of two (Fig. 7a), thus confirming a strong temperature dependency of the forward electron transfer in eqn (1). To test the thermal activation of the backward charge transfer, the Ca-Sr:0.02Eu sample was first illuminated with 365 nm LED for 40 min at room temperature to maximize the orange emission intensity and then kept in the dark at room temperature for another 40 min to minimize the effects of fading after which the sample was subjected to three different treatments. If the sample was exposed to 490 nm light (21 mW cm−2) for 3.5 min at room temperature, the orange emission decreased by only 6.6% (Fig. 7b). If this illumination was carried out at 227 °C, the decrease in orange emission intensity amounted to 25.9% (Fig. 7b) whereas only a decrease of 14.8% (Fig. 7b) was obtained if the sample was kept at 227 °C without any illumination. Clearly the change upon illumination at an elevated temperature is substantially larger than the sum of the two separate processes, i.e. illumination at room temperature or an elevated temperature without illumination, thereby confirming the existence of thermal activation of the backward charge transfer. However, the effect is much smaller compared to the forward charge transfer. The temperature dependency of electron transfer, as we have shown above, is similar to what has been observed in some persistent phosphors where there is a thermal barrier for charge trapping, for example in Sr2MgSi2O7:Eu2+,Dy3+ or in SrAl2O4:Eu2+,Dy3+.23–25
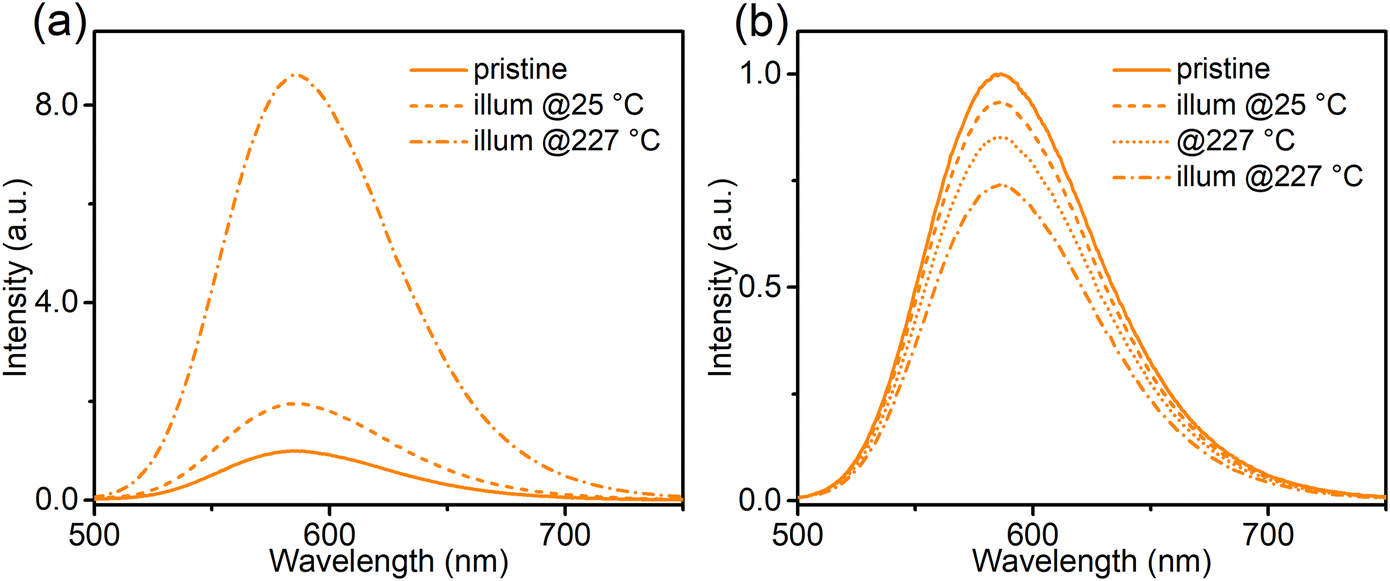 | ||
| Fig. 7 (a) The orange emission spectra (λex = 420 nm, all recorded at 25 °C) of Ca-Sr:0.02Eu in as-prepared state (solid curve), and after illumination (365 nm LED, 2 min) at 25 °C or at 227 °C separately. (b) Ca-Sr:0.02Eu was firstly illuminated with 365 nm LED (40 min, 25 °C) and then kept in dark (40 min, 25 °C). The emission spectra (λex = 420 nm, 25 °C) of this treated state (solid curve), and the state with additional treatment by illumination (490 nm LED, 3.5 min, 25 °C) or annealing (3.5 min, 227 °C), or illumination at high temperature (490 nm LED, 3.5 min, 227 °C) separately. | ||
The TQ profiles (Fig. 8) for all samples were recorded under excitation with 365 nm light (exciting both orange and blue emission) and 420 nm light (exciting only the orange emission, Fig. 8f) while heating at a rate of 60 °C min−1. The corresponding emission spectra are shown in Fig. S9 and S10 (ESI†). The TQ profiles of the blue emission recorded under 365 nm excitation show a conventional behaviour with a quenching temperature T0.5 of 160 °C for Ca-rich:0.02Eu, Ca-Sr:0.005Eu and Ca-Sr:0.02Eu and a slightly lower temperature of only 148 °C for Sr-rich:0.02Eu. In contrast, the orange emission intensity under 365 nm excitation increases with temperature for all samples except for Sr-rich:0.02Eu. This unusual anti-thermal quenching behaviour is a consequence of temperature-dependent energy transfer from the blue-emitting EuSr2+ centres to the orange-emitting EuCa2+ centres in combination with an increase of EuCa2+ centers due to the photoinduced charge transfer upon 365 nm excitation. The latter can be attributed to the forward electron transfer shown in eqn (1), which is inevitable, especially at elevated temperatures where the process proceeds with a higher efficiency as shown in Fig. 7a. The contribution of the charge transfer to the increase in intensity was quantified by measuring the orange and blue emission intensities after cooling down to room temperature again.
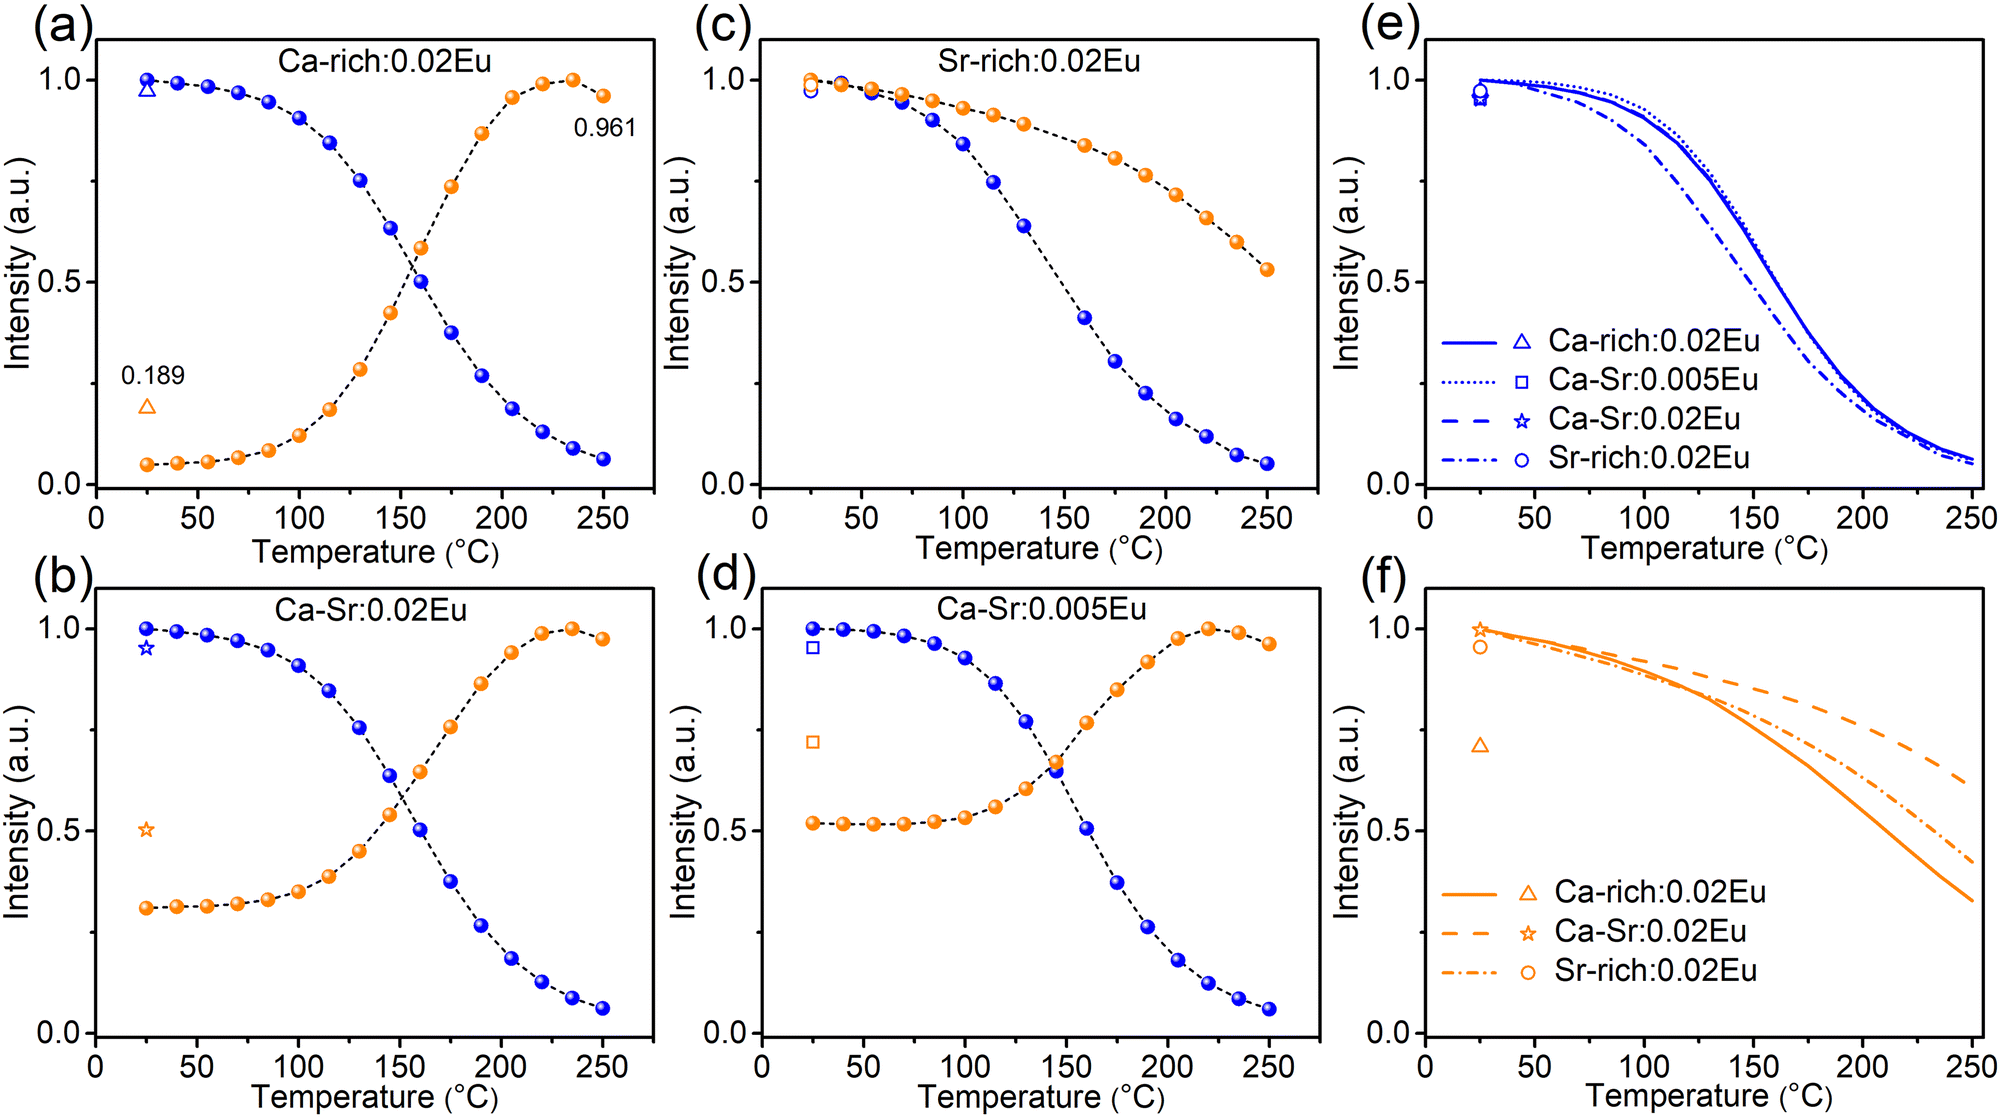 | ||
| Fig. 8 Thermal quenching profiles of blue emission (blue curves) and orange emission (orange curves) in Ca-rich:0.02Eu (a), Ca-Sr:0.02Eu (b), Sr-rich:0.02Eu (c), Ca-Sr:0.005Eu (d) recorded under 365 nm LED excitation while heating at a rate of 60 °C min−1. The results for the blue emission are summarized in (e). (f) Thermal quenching profiles of orange emission recorded under 420 nm LED excitation while heating at a rate of 60 °C min−1. Ca-rich:0.02Eu in (f) was pre-illuminated by 365 nm LED for 1.5 h and then kept in the dark at room temperature for 1.5 h because there is no orange emission in the as-synthesized material. The emission intensity after cooling back to 25 °C (without illumination during cooldown) was also recorded and is shown using the symbol in each figure. | ||
However, the optically-induced electron transfer only contributes to a small extent to such anti-thermal quenching of EuCa2+ under 365 nm excitation shown in Fig. 8a, b and d. This can be substantiated by considering the situation of Ca-rich:0.02Eu in Fig. 8a as an example. If the TQ is recorded under excitation with 420 nm light (Fig. 8f), thereby only exciting the orange emission, the intensity decreases to 33% of the original intensity when heated to 250 °C. After the sample is cooled down (without illumination) to 25 °C it can be observed that the orange emission intensity has dropped to 71% of the intensity recorded prior to the TQ measurement indicating that the concentration of EuCa2+ centres has decreased due to the illumination with 420 nm at an elevated temperature. Assuming a linear decrease in concentration during the measurement, the TQ profile can be corrected to isolate the actual quenching behaviour of the orange emission centre as shown in Fig. S11 (ESI†). This information can subsequently be used to correct the TQ curve recorded under 365 nm excitation (Fig. S11, ESI†) for the quenching of the orange emission centre. It can then be seen that the orange emission intensity doubles when heating to 250 °C while the EuCa2+ concentration increases by only 19% as a consequence of the illumination with 365 nm light as evidenced by a PL measurement at 25 °C after the TQ measurement. Hence it can safely be concluded that the electron transfer only slightly contributes to the anti-thermal quenching of EuCa2+, and that thermally-assisted energy transfer is the driving force for the increase in intensity with temperature. A similar reasoning holds for Ca-Sr:0.02Eu and Ca-Sr:0.005Eu. The different behaviour of the Sr-rich:0.02Eu sample (Fig. 8c) can be understood by considering that the relatively low concentration of EuSr2+ centers minimizes both the energy transfer and the charge transfer mechanisms that dominate in the other samples.
At the same time, the energy transfer is rather limited at room temperature even though there is an overlap between the PLE spectrum of EuCa2+ and the PL spectrum of EuSr2+. This can be deduced as follows. In Fig. 5, the numbers of EuCa2+ centres and EuSr2+ centers change considerably during 330 nm/420 nm illumination, which will definitely alter the ratio of energy donors (EuSr2+) to energy acceptors (EuCa2+). This then consequently changes the contribution of energy transfer for orange emission under 365 nm excitation. However, if 420 nm light is used to exclusively excite EuCa2+ centers during the same illumination process, the obtained orange emission intensity variations (Fig. S12, ESI†) are almost the same as the results shown in Fig. 5, thus confirming the limited energy transfer between EuSr2+ and EuCa2+ at room temperature. However, with increasing temperature the energy transfer is greatly enhanced, which leads to the unusual thermal behavior of EuCa2+ shown in Fig. 8. Energy transfer between non-equivalent Eu2+ ions is a very common phenomenon for the phosphors in which Eu2+ is incorporated on non-equivalent sites, such as in SrAl2O4:Eu2+, Sr4Al14O25:Eu2+, Sr5(PO4)3−x(BO3)xCl:Eu2+ (x = 0–0.7), Ca6BaP4O17:Eu2+, RbBaPO4:Eu2+, Sr5SiO4Cl6:Eu2+, Ba4Gd3Na3(PO4)6F2:Eu2+25–35 However, the detailed investigation of the temperature dependency of such energy transfer is very scarce. In the case of Li4Sr1+xCa1−x(SiO4)2:Eu, there are two possible explanations for the temperature dependency of the energy transfer. A first possibility is an increased spectral overlap between the EuSr2+emission and EuCa2+ absorption bands due to thermal broadening.27,28,36 Secondly, it is possible that higher temperatures promote the excitation energy migration from one EuSr2+ ion to another which is finally followed by energy transfer to a EuCa2+ ion.36–38 This type of diffusion-limited energy migration can result in a similar temperature dependency. However, based on the available data, it is not possible to differentiate between these two possibilities. Usually, the energy transfer process is concentration dependent.36 By comparing the TQ curves of Ca-Sr:0.02Eu and Ca-Sr:0.005Eu, which differ only in doping concentration (Fig. 8b and d), it can be seen that this concentration dependency is also demonstrated here as the orange emission intensity increases more at high temperature if the dopant concentration is increased. All in all, the results shown in Fig. 8 demonstrate how the excitation wavelength, the host composition and the doping concentration of Eu impact the thermal behaviour of Eu2+ orange emission from the perspective of thermally-activated characteristic of both electron transfer and energy transfer, which might be instructive to develop so-called zero- or anti-thermal quenching phosphors.39–44
Conclusion
A series of Eu2+ doped Li4Sr1+xCa1−x(SiO4)2 (x = −0.25, 0, 0.4) with blue-emitting EuSr2+ and orange-emitting EuCa2+ were prepared. By varying the relative contents of Sr and Ca, the occupation preference of Eu2+ on Sr2+ and Ca2+ sites can be regulated, thus the emission colour can be tuned. Moreover, illumination at different wavelengths, which induces reversible electron transfers between Eu2+ and Eu3+, is also effective in changing the emission spectra of the as-prepared samples in a desired way. Based on the electron transfer efficiency spectra it can be concluded that the electron transfer from EuSr2+ to EuCa3+ can be initiated by exciting EuSr2+, while the reverse process can be initiated by exciting EuCa2+. Both these processes are temperature-dependent, according to the performed temperature-dependent illumination experiments. Unusual thermal quenching of orange emission was observed in Ca-rich:0.02Eu, Ca-Sr:0.02Eu and Ca-Sr:0.005Eu samples under 365 nm LED excitation. This can be explained mainly by thermally-assisted energy transfer from EuSr2+ to EuCa2+. Thermally-assisted electron transfer from EuSr2+ to EuCa2+ also contributes to such behaviour, but to a lesser extent. Such uncommon thermal quenching was not observed in Sr-rich:0.02Eu due to the lack of EuSr2+. The concentration dependency of the electron transfer is also confirmed by comparing the illumination response of Ca-Sr:0.02Eu and Ca-Sr:0.005Eu. Cycling measurements by alternatively inducing forward and backward electron transfer suggest good repeatability of the electron transfer behaviour. Overall it can be concluded that the photo-induced and temperature-dependent luminescence changes in Li4Sr1+xCa1−x(SiO4)2:Eu result in a complicated behaviour which should be carefully considered before proposing the use of this phosphor in temperature and pressure sensing applications. Finally, such an electron transfer process may not be limited to Eu2+ and Eu3+ in inequivalent sites, similar processes between Sm2+ and Sm3+ probably occur in Li4Sr1+xCa1−x(SiO4)2 as well.Conflicts of interest
There are no conflicts to declare.Acknowledgements
The authors acknowledge the financial support from the China Scholarship Council (Grant No. 201706150080) and the FWO (Fund for Scientific Research−Flanders research project G0F9322N).References
- G. Blasse and B. C. Grabmaier, Luminescent Materials, Springer-Verlag, 1994 Search PubMed.
- S. X. Li, L. Wang, D. M. Tang, Y. Cho, X. J. Liu, X. T. Zhou, L. Lu, L. Zhang, T. Takeda, N. Hirosaki and R.-J. Xie, Chem. Mater., 2018, 30(2), 494–505 CrossRef CAS.
- J. Qiao, S. Zhang, X. Zhou, W. Chen, R. Gautier and Z. Xia, Adv. Mater., 2022, 34(26), 2201887 CrossRef CAS PubMed.
- L. Amidani, K. Korthout, J. J. Joos, M. van der Linden, H. F. Sijbom, A. Meijerink, D. Poelman, P. F. Smet and P. Glatzel, Chem. Mater., 2017, 29, 10122–10129 CrossRef CAS.
- J. J. Joos, K. Korthout, L. Amidani, P. Glatzel, D. Poelman and P. F. Smet, Phys. Rev. Lett., 2020, 125, 033001 CrossRef CAS PubMed.
- J. Hu, Z. Yang, A. Feng, R. Deun Van, P. F. Smet and D. Van der Heggen, J. Phys. Chem. C, 2022, 126, 21396–21404 CrossRef CAS.
- M. A. Van De Haar, M. Tachikirt, A. C. Berends, M. R. Krames, A. Meijerink and F. T. Rabouw, ACS Photonics, 2021, 8(6), 1784–1793 CrossRef CAS.
- Z. Barandiaran, A. Meijerink and L. Seijo, Phys. Chem. Chem. Phys., 2015, 17, 19874 RSC.
- C. MacKeen, F. Bridges, M. Kozina, A. Mehta, M. F. Reid, J.-P. R. Wells and Z. Barandiarán, J. Phys. Chem. Lett., 2017, 8, 3313–3316 CrossRef CAS.
- P. Dorenbos, J. Phys.: Condens. Matter, 2003, 15(17), 2645–2665 CrossRef CAS.
- J. J. Joos, L. Seijo and Z. Barandiarán, J. Phys. Chem. Lett., 2019, 10, 1581–1586 CrossRef CAS.
- R. Shi, L. Ning, Y. Huang, Y. Tao, L. Zheng, Z. Li and H. Liang, ACS Appl. Mater. Interfaces, 2019, 11, 9691–9695 CrossRef CAS.
- A. Akella and D. A. Keszler, Inorg. Chem., 1995, 34, 1308–1310 CrossRef CAS.
- J. Zhang, Z. H. Hua and S. Z. Wen, Opt. Mater. Express, 2015, 5, 1704–1714 CrossRef CAS.
- R. D. Shannon, Acta Crystallogr., Sect. A: Cryst. Phys., Diffr., Theor. Gen. Crystallogr., 1976, 32, 751–767 CrossRef.
- M. Wu, D. Deng, F. Ruan, B. Chen and S. Xu, Chem. Eng. J., 2020, 396, 125178 CrossRef CAS.
- K. Su, L. Mei, Q. Guo, P. Shuai, Y. Wang, Y. Liu, Y. Jiang, Z. Peng, B. Zou and L. Liao, Adv. Funct. Mater., 2022, 2305359 Search PubMed.
- D. Van der Heggen, R. Zilenaite, E. Ezerskyte, V. Fritz, K. Korthout, D. Vandenberghe, J. De Grave, J. Garrevoet, L. Vincze, D. Poelman, J. J. Joos and P. F. Smet, Adv. Funct. Mater., 2022, 32, 2109635 CrossRef CAS.
- J. J. Joos, D. Van der Heggen, L. Amidani, L. Seijo and Z. Barandiarán, Phys. Rev. B: Condens. Matter Mater. Phys., 2021, 104, L201108 CrossRef CAS.
- T. J. B. Holland and S. A. T. Redfern, Mineral. Mag., 1997, 61, 65–77 CrossRef CAS.
- K. Binnemans, Coord. Chem. Rev., 2015, 295, 1–45 CrossRef CAS.
- F. J. Avella, O. J. Sovers and C. S. Wiggins, J. Electrochem. Soc., 1967, 114, 613 CrossRef CAS.
- C. Tydtgat, K. W. Meert, D. Poelman and P. F. Smet, Opt. Mater. Express, 2016, 6, 844–858 CrossRef CAS.
- A. Feng, J. J. Joos, J. Du and P. F. Smet, Phys. Rev. B: Condens. Matter Mater. Phys., 2022, 105(20), 205101 CrossRef CAS.
- J. Botterman, J. J. Joos and P. F. Smet, Phys. Rev. B: Condens. Matter Mater. Phys., 2014, 90, 085147 CrossRef CAS.
- G. Blasse, J. Solid State Chem., 1986, 62, 207–211 CrossRef CAS.
- J. Bierwagen, S. Yoon, N. Gartmann, B. Walfort and H. Hagemann, Opt. Mater. Express, 2016, 6, 793–803 CrossRef CAS.
- D. Dutczak, T. Jüstel, C. Ronda and A. Meijerink, Phys. Chem. Chem. Phys., 2015, 17, 15236–15249 RSC.
- B. Smets, J. Rutten, G. Hoeks and J. Verlijsdonk, J. Electrochem. Soc., 1989, 136, 2119 CrossRef CAS.
- P.-P. Dai, C. Li, X.-T. Zhang, J. Xu, X. Chen, X.-L. Wang, Y. Jia, X. Wang and Y.-C. Liu, Light: Sci. Appl., 2016, 5, e16024 CrossRef CAS.
- R. Zhou, C. Liu, L. Lin, Y. Huang and H. Liang, Chem. Eng. J., 2019, 369, 376–385 CrossRef CAS.
- R. F. Zhou, F. K. Ma, F. Su, Y. Y. Ou, Z. M. Qi, J. H. Zhang, Y. Huang, P. Dorenbos and H. B. Liang, Inorg. Chem., 2020, 59, 17421–17429 CrossRef CAS.
- S. Dutta, S. Som, M. L. Meena, R. Chaurasiya and T. M. Chen, Inorg. Chem., 2020, 59(3), 1928–1939 CrossRef CAS.
- X. Fu, W. Lü, M. Jiao and H. You, Inorg. Chem., 2016, 55, 6107–6113 CrossRef CAS PubMed.
- S. Asaithambi, J. Lee, J.-W. Lee, B. D. Lee, M.-Y. Cho, W. B. Park and K.-S. Sohn, J. Lumin., 2023, 263, 120109 CrossRef CAS.
- P. A. Tanner, L. Zhou, C. Duan and K.-L. Wong, Chem. Soc. Rev., 2018, 47, 5234–5265 RSC.
- J. C. Bourcet and F. K. Fong, J. Chem. Phys., 1974, 60, 34–39 CrossRef CAS.
- V. Bachmann, C. Ronda and A. Meijerink, Chem. Mater., 2009, 21(10), 2077–2084 CrossRef CAS.
- Y. H. Kim, P. Arunkumar, B. Y. Kim, S. Unithrattil, E. Kim, S. H. Moon, J. Y. Hyun, K. H. Kim, D. Lee, J. S. Lee and W. B. Im, Nat. Mater., 2017, 16, 543–550 CrossRef CAS.
- J. W. Qiao, L. X. Ning, M. S. Molokeev, Y. C. Chuang, Q. L. Liu and Z. G. Xia, J. Am. Chem. Soc., 2018, 140, 9730–9736 CrossRef CAS.
- P. Dang, W. Wang, H. Lian, G. Li and J. Lin, Adv. Opt. Mater., 2022, 10, 2102287 CrossRef CAS.
- M. Hermus, P.-C. Phan, A. C. Duke and J. Brgoch, Chem. Mater., 2017, 29, 5267–5275 CrossRef CAS.
- L. Huang, Y. Wei, Y. Pan, E. Zhou, Z. Yuan, H. Song, Y. Wang, J. Zhou, J. Rui, M. Xu, L. Ning, Z. Liu, H. Wang, X. Xie, X. Tang, H. Su and X. Xing, Angew. Chem., Int. Ed., 2023, 135(27), e202303482 CrossRef.
- H. Zou, X. Yang, B. Chen, Y. Du, B. Ren, X. Sun, X. Qiao, Q. Zhang and F. Wang, Angew. Chem., Int. Ed., 2019, 58(48), 17255–17259 CrossRef CAS PubMed.
Footnote |
| † Electronic supplementary information (ESI) available. See DOI: https://doi.org/10.1039/d3ma00772c |
| This journal is © The Royal Society of Chemistry 2024 |