 Open Access Article
Creative Commons Attribution 3.0 Unported Licence
Bismuth tungstate nanocomposites for simultaneous detection of hydroquinone and resorcinol†
Thatchanamoorthy
Thenrajan
 a,
Madasamy
Madhu malar
a,
Sangeetha
Kumaravel
bd,
Rajendran
Rajaram
c,
Subrata
Kundu
a,
Madasamy
Madhu malar
a,
Sangeetha
Kumaravel
bd,
Rajendran
Rajaram
c,
Subrata
Kundu
 *d and
Jeyaraj
Wilson
 *a
*a
aPolymer Electronics Lab, Department of Bioelectronics and Biosensors, Alagappa University, Karaikudi – 630003, Tamil Nadu, India. E-mail: wilson.j2008@yahoo.com
bSchool of Advanced Sciences, Department of Chemistry, Kalasalingam Academy of Research and Education, Krishnankoil – 626126, Tamil Nadu, India
cDepartment of Chemistry, Madanapalle Institute of Technology and Science, Angallu (V), Madanapalle, Andhrapradesh – 517325, India
dElectrochemical Process Engineering (EPE) Division, CSIR-Central Electrochemical Research Institute (CECRI), Karaikudi – 630003, Tamil Nadu, India. E-mail: skundu@cecri.res.in
First published on 15th January 2024
Abstract
A simple wet-chemical co-precipitation method is presented to synthesize Bi2WO6 for the simultaneous detection of environmental pollutants hydroquinone (HQ) and resorcinol (RS) – a pioneering achievement in pollutant sensing. Leveraging its semiconducting nature and specific redox behavior, this composite serves as a smart platform for efficient pollutant detection. The synergistic effect of bismuth and tungstate led to a highly efficient interaction between modified electrode and analytes. The electronic interaction greatly influences the redox process as a result of Bi and WO binding affinity with the two pollutants. Hence, the Bi2WO6 composite exhibited linear ranges of 200 μM–5 mM for HQ and 20 μM–5 mM for RS in simultaneous detection with low limits of detection of 57 μM and 4.3 μM. Further, it showed stability up to 77% and 75% (HQ and RS) for 150 cycles and reproducibility (RSD 2.9% for HQ and 3.1% for RS) and, finally, for real sample analysis showed good recovery percentages of 53–58% for HQ and 79–81% for RS in tap water and 94–101% for HQ in an ointment sample. These findings highlight the great potential of Bi2WO6 as a versatile and effective tool for environmental pollutant sensing and monitoring.
1. Introduction
Catalysts that can efficiently convert chemical energy into electrical energy offer sustainable solutions for various applications. The conductivity of these materials is crucial for controlling electronic-based processes such as migration, charge separation, and light absorption. By introducing composites or doping, vacancies and defects are induced, to modify the physical, chemical, and electronic properties of the materials. The high surface area, electrochemical activity, and electron transport resulting from these modifications can increase the sensing ability of the materials by altering their bandgap. Rational designing of a promising platform is important to develop an efficient electrochemical reaction, particularly for pollutant detection. Interfacial electron transfer is significantly increased by synergistic effects.1 Bismuth oxide is a good catalytic material; however, doping with appropriate materials will further improve its sensing properties.Among various Bi-based composites, bismuth tungstate (Bi2WO6) stands out due to its unique properties. Additionally, Bi2WO6 has a narrow band gap, high stability with surface area, and possesses a redox potential which allows functional group transformation in organic reactions. The developed heterojunction between the Bi and W exhibits electrocatalytic activity due to their strong binding as a result of electrostatic interaction, and finally powerful free electrons are produced. This unique Aurivillius material provides a higher number of active sites for interaction with analytes, promoting more effective detection.2
Moreover, Bi2WO6 is a desirable option for ferroelectric applications because of its high Curie temperature, significant polarization, and general low-leakage, fatigue-free behaviors. The displacement of tungsten (W) atoms against the oxygen octahedra on the one hand, and the relative shift between the Bi2O2 layers and the WO6 blocks on the other, are thought to be the two separate polar distortions that are responsible for the ferroelectricity in Bi2WO6. It is used very much in photocatalysts owing to high photocatalytic activity and ionic conductivity, and reversible control of in-plane strain enables its role in electromechanical and magnetoelectric device applications.3 Studies reported that it possesses Rashba spin split on its band structure which was predicted to be controlled electrically.4 Additionally, it has non-linear dielectric susceptibility, piezoelectricity, pyroelectricity, ferroelectricity, catalytic and oxide anion conducting behavior.5 Hence, the superior performance of a Bi2WO6 catalyst highlights the significance of fabrication of a heterojunction system suitable for pollutant detection in this work.
The COVID-19 outbreak has drawn attention to the importance of sensors for environmental protection.6 Traditional methods used strong acids and bases for the synthesis of Bi2WO6, which can cause adverse effects on the environment. However, in this research, a simple procedure without any reducing agents was adopted. In the same sense, pollutant detection is significant to protect human health by avoiding prolonged diseases and contamination of the environment. Similar to metal ions like cadmium, lead, mercury etc., these pollutants also play a vital role in affecting human health.7 Therefore, detection of industrial pollutants has been a focus of recent research. Among various pollutants, the dihydroxybenzene isomers hydroquinone (HQ) and resorcinol (RS) are commonly found in nature. They are extensively used in a variety of sectors, including the tanning, cosmetics, dye, chemical, and pharmaceutical ones. These phenolic compounds are significant environmental pollutants due to their high toxicity, poor degradability, and environmental importance due to their antioxidation and antiviral effects, carcinogenicity, and ability to modify the activities of specific enzymes.8–10 Since these two pollutants coexist both in the environment and in various samples, their simultaneous detection is very important.11–13 So far, various methods including fluorescence,14 spectroscopy,15,16 and chromatography17,18 have been investigated for the detection of pollutant samples. Indeed, the electrochemical method as a result of its simplicity, rapidity, and accurate detection strategies has attained certain consideration in the scientific community. Previous literature for the detection of pollutants has been published, describing various composites using the electrochemical method. Cobalt-iron selenide-embedded porous carbon nanofibers,19 graphene gold nanocomposite film,20 ammoniated-phosphate buffer solution,21 molybdenum carbide carbon hollow spheres22etc. were reported with significant results and hence emerge for HQ and RS detection.
Based on the existing literature, numerous Bi2WO6-based composites have been developed for various applications, primarily focusing on photocatalysis. Despite the considerable advantageous properties of Bi2WO6, researchers have explored the preparation of composites to further enhance its efficiency and achieve noteworthy results. However, the number of studies investigating pure Bi2WO6 for applications other than photocatalysis, theoretical studies, and electrochemical sensors remains limited to the best of our knowledge.
In light of this knowledge gap, we take the opportunity to present a novel electrochemical sensor platform for pollutant detection using Bi2WO6 in this study. By exploring the untapped potential of pure Bi2WO6 as an electrochemical sensor, we aim to contribute to the growing body of research in this area and shed light on new possibilities for utilizing this material in diverse applications beyond photocatalysis.
2. Experimental
2.1 Synthesis of Bi2WO6 nanoparticles
The synthesis of Bi2WO6 nanoparticles was carried out using the co-precipitation method. Initially, 0.1 M (2.35 g) sodium tungstate was added to 80 ml of deionized (DI) water and stirred until fully dissolved. Subsequently, 0.2 M (7.76 g) bismuth nitrate pentahydrate was introduced into the above solution and stirred for a duration of 10 minutes. Following this, the resulting solution was subjected to multiple washings with water and then dried at a temperature of 70 °C to obtain Bi2WO6 nanoparticles as the final product.2.2 Preparation of the working electrode
A glassy carbon electrode (GCE) was initially polished using 0.5 M alumina powder and then cleaned with DI water. Subsequently, cyclic voltammetry (CV) was conducted using [Fe(CN)6]3−/4− until the peak potential difference (Ep) value reached approximately 59 mV. After optimization of the GCE, it was once again washed with alumina powder and DI water thoroughly to remove the adsorbed [Fe(CN)6]3−/4− on its surface. Then, the composite was mixed in DI water at a 1 mg/1 ml ratio and from that 8 μl of the dispersed composite was taken and coated equally every time on the GCE working area. So, as calculated earlier, the electrochemical active surface area is expected to be unchanged since we drop-cast 8 μl every time on the GCE surface equally. The composite modified GCE was then dried and ready for further experimentation and analysis. The details of chemicals used and instrumentation are given in the ESI.† In the synthesis of Bi2WO6, there is no use of heavy elements during the preparation. Also, in the sensing application, DI water is used as solvent for preparing the phosphate-buffered saline (PBS).3. Results and discussion
3.1 Physiochemical and morphological analysis
At first, X-ray diffraction (XRD) analysis was conducted to determine the crystalline phases and chemical composition of the material, as shown in Fig. 1A. The XRD pattern of Bi2WO6 exhibited several distinct diffraction peaks related to the (002), (113), (200), (100), (026), (133), (400), and (420) crystallographic planes. The corresponding diffraction angles were found to be 24.85°, 28.11°, 32.14°, 42.79°, 47.41°, 57.16°, and 78.39°, respectively. These diffraction peaks are characteristic of the crystalline structure of Bi2WO6, providing valuable insights into its crystallographic orientation and phase composition.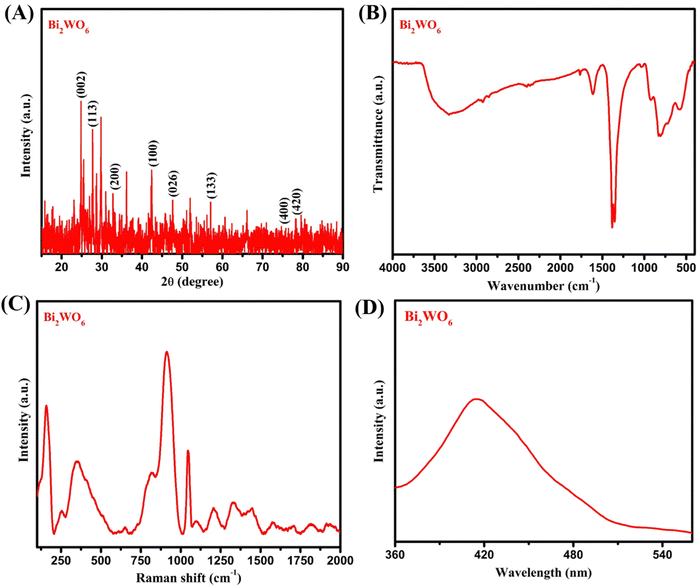 | ||
| Fig. 1 (A) XRD analysis, (B) FT-IR spectroscopic analysis, (C) Raman analysis, and (D) photoluminescence spectral analysis of Bi2WO6. | ||
The obtained diffraction pattern in Fig. 1A is in excellent agreement with the characteristic peaks of orthorhombic Bi2WO6 (JCPDS no. 73-1126), providing strong evidence that the formation of Bi2WO6 was successful.23 Furthermore, to identify the functional groups present in the synthesized Bi2WO6 nanoparticles, Fourier transform infrared (FT-IR) spectroscopy was performed, as depicted in Fig. 1B. The peaks at 584 cm−1, 735 cm−1, and 1388 cm−1 were assigned to the Bi–O and W–O stretching vibration modes, and the W–O–W bridge stretching modes, respectively, which align well with previous findings.24 These FT-IR results further support the formation of Bi2WO6.
Additionally, Raman spectroscopy was utilized to analyze the chemical bonds, as shown in Fig. 1C. The Raman peaks at 733 cm−1 to 914 cm−1 correspond to the antisymmetric and symmetric modes of the terminal O–W–O stretching modes of Bi2WO6. Likewise, the photoluminescence spectrum of Bi2WO6 is shown in Fig. 1D. The emission peak at 420 nm can be attributed to the intrinsic luminescence of Bi2WO6, which corresponds to the transition from the hybrid Bi6s and O2p orbital valence band to the empty W5d orbital conduction band in the WO62− complex.25,26 This transformation was used by Hoang et al.25 and Shen et al.26 to enhance the photocatalytic behavior. In this sense, we expect the same Bi2WO6 with good electrocatalytic behavior for the quantification of pollutant interaction. Furthermore, the additional Raman peak at 789 cm−1 indicates the presence of an antisymmetric bridging mode linked to the tungstate chain, while the band at 314 cm−1 is attributed to a translational mode involving simultaneous motion of the Bi3+ and WO6− ions, as reported in a prior study.27 These Raman spectroscopy findings provide further confirmation of the successful formation of Bi2WO6 nanoparticles. Overall, the combination of XRD, FT-IR, and Raman analyses provides strong and comprehensive evidence for the successful formation of Bi2WO6 nanoparticles, affirming their presence and composition in the proposed material.
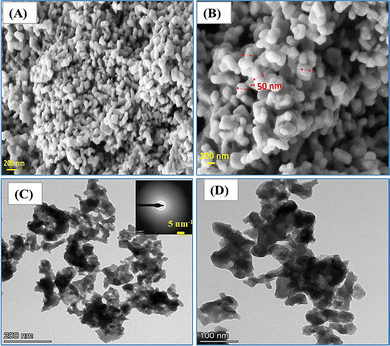
Further, morphological and elemental analyses were carried out using FE-SEM and HR-TEM techniques. The surface morphology of the synthesized Bi2WO6 nanoparticles was examined initially using FE-SEM analysis, as presented in Fig. 2A and B. The FE-SEM images reveal the presence of almost uniformly distributed smaller-diameter Bi2WO6 nanoparticles (∼50 nm) as marked in Fig. 2B. Moreover, at high magnification, spherical-like agglomerated particles of nanometer sized Bi2WO6 are clearly observed. Further evidence from the HR-TEM images confirms the similar nano-sized aggregated morphology of Bi2WO6 developed for sensing (Fig. 2C and D). The SAED pattern depicted in the inset of Fig. 2C shows that the developed Bi2WO6 is polycrystalline in nature. Further, the observed spherically enhanced surface area is expected to facilitate effective binding of analytes, thereby yielding significant sensing results. Additionally, the HAADF color mapping analysis confirms the sample purity with the presence of elements such as Bi, W, and O, without any indication of additional elements (Fig. 3A–E). This observation further strengthens the confirmation of the formation of pure Bi2WO6 nanoparticles. EDAX elemental analysis was carried out in the HR-TEM instrument, further clarifying the purity of the developed Bi2WO6 (Fig. 3F).
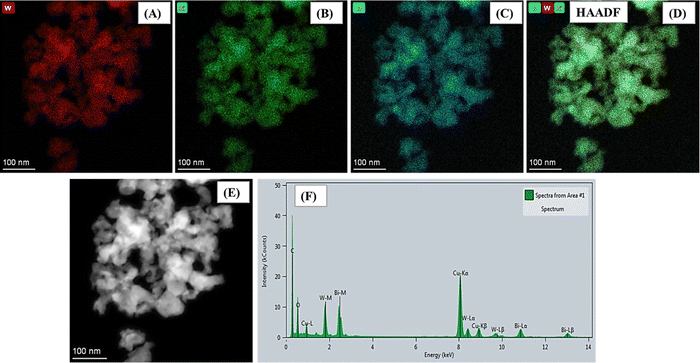 | ||
| Fig. 3 (A)–(E) Color mapping of various elements (Bi, W, and O) of Bi2WO6 and (F) EDAX elemental mapping of Bi2WO6. | ||
The developed Bi2WO6 was synthesized by using a simple co-precipitation method. The resultant morphology indicated spherical structures of aggregated nature with improved surface area, highly facilitating the simultaneous sensing of HQ and RS. Also, it clearly evidenced that the particle sizes were below 50 nm. Collectively, the FE-SEM and HR-TEM morphological analyses, along with the color mapping and EDAX results, provide compelling evidence of the successful formation of Bi2WO6 nanoparticles, confirming their unique surface morphology and elemental composition, which are crucial factors for the promising sensing capabilities of the material.
3.2 Electrochemical studies
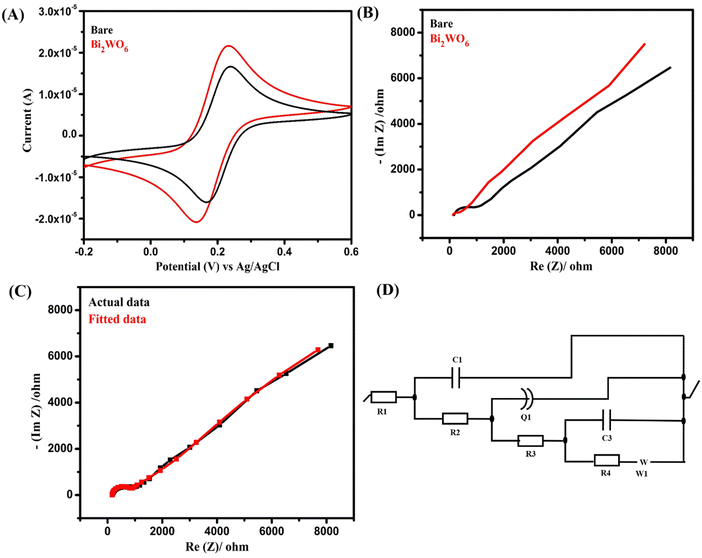
The incorporation of Bi2WO6 resulted in a noticeable improvement in the peak current, with the modified electrode exhibiting a peak current of 21.6 μA while only being 16.6 μA for the bare electrode. Factors including improved probe diffusion, higher rate of electron transfer and crystalline size and morphology of Bi2WO6 may also influence the peak current.28,29
To further verify the above considerations, EIS measurements were conducted to determine the resistance of the proposed Bi2WO6. The resistivity of the Bi2WO6-coated and uncoated GCEs was measured using the same experimental setup as for the CV study. From the impedance plot in Fig. 4B, Bi2WO6 exhibits lower resistance than the bare electrode providing additional confirmation of the material's enhanced conductivity. Also, the fitted Nyquist curve and the relevant equivalent circuit are also shown in Fig. 4C and D.
Overall, the combination of CV and EIS studies provides compelling evidence of the electrocatalytic activity and conductivity of Bi2WO6, making it a promising material for various electrochemical applications.
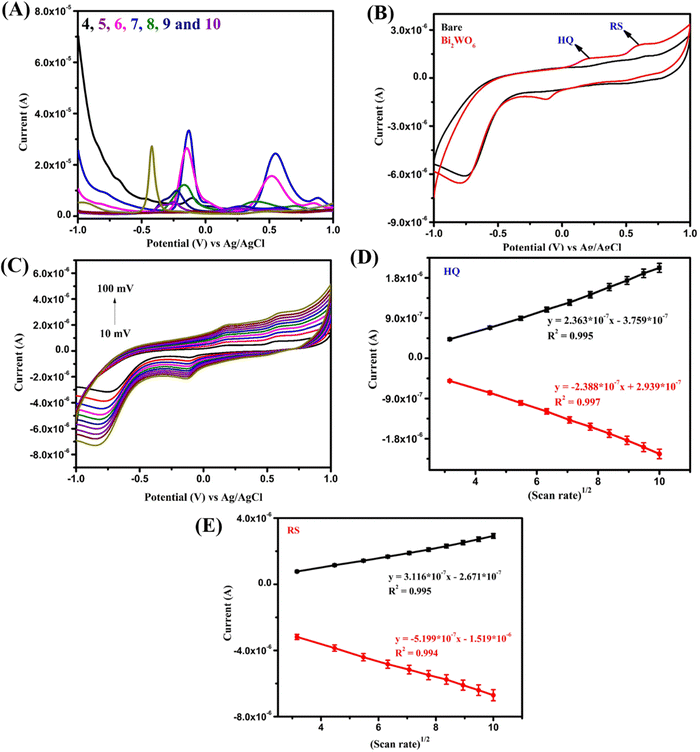
The sensing ability of the prepared Bi2WO6 was assessed through an experiment comparing the performance of the bare GCE with the Bi2WO6-modified GCE in 10 ml of PBS containing 200 μM HQ and RS. The results obtained (Fig. 5B) clearly show that Bi2WO6 exhibited significantly higher peak currents compared to the bare electrode at the oxidation potentials of both HQ and RS. This improved sensing ability is mainly due to the electrostatic attraction of the Bi and WO ions with the OH− groups of HQ and RS. Additionally, the composite's high ionic conductivity, catalytic activity, and ionic behavior indicated better binding affinity towards HQ and RS, contributing to enhanced sensing response.4,5 In order to validate the process involved in this reaction, the same setup was subjected to studies at different scan rates (Fig. 5C). These results clearly show that the whole reaction is due to a diffusion-controlled process which was further supported by the linear fit of scan rate vs the peak current curve (Fig. 5D and E).
A possible and plausible mechanism for HQ and RS sensing is as follows. The mechanism for HQ and RS sensing involves electrochemical processes that occur during charging and discharging cycles. The response can be understood by examining the oxidation and reduction reactions that take place at the electrode interface. HQ is oxidized into quinone. The oxidation (charging) of HQ involves the loss of two protons (2H+) and two electrons (2e−). This process occurs at its corresponding oxidation potential.
| Charging: HQ → Quinone + 2H+ + 2e− |
| Discharging: Quinone + 2H+ + 2e− → HQ |
 .
.
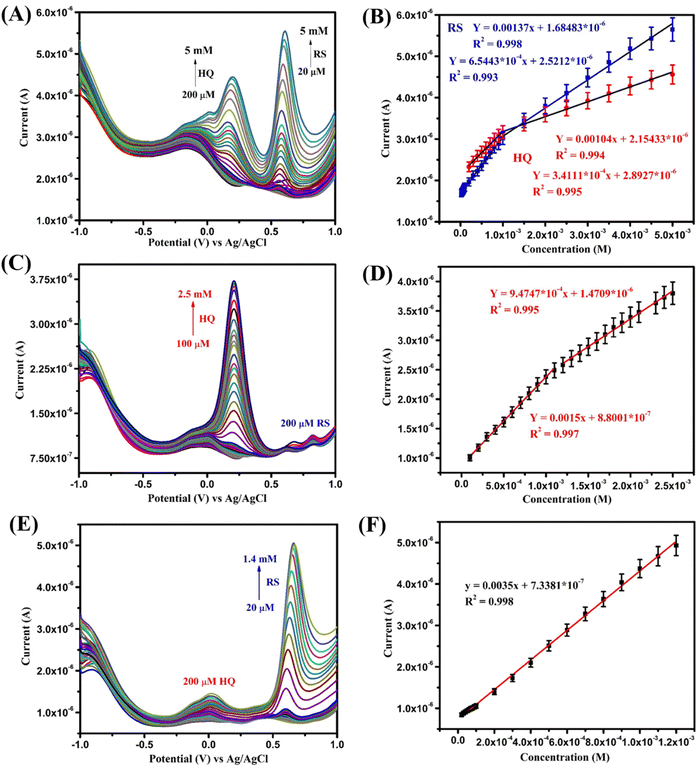 | ||
| Fig. 6 (A) SWV of the Bi2WO6-modified electrode for simultaneous detection of HQ and RS; (C) and (E) SWV of individual HQ and RS sensing; (B), (D), and (F) corresponding linear plots. | ||
The first detected concentration of RS was 10 times lower than that of HQ. This may be due to their oxidation potentials along with their electron transfer rates. RS has an oxidation potential value of around 0.58 V with 1-electron transfer and HQ of around 0.18 V with 2-electron transfer. As a result of this, RS is oxidized instantly with high peak current since it has one-electron transfer comparing with HQ with two-electron transfer. This may be why the first detected concentration of RS is 10 times lower than that of HQ.
However, in the case of multiple analyte detection, there should be no significant interference of one analyte with another. So, Bi2WO6 was tested by varying one analyte concentration while keeping the other constant. In this case, the SWV traces were taken of varying concentrations for HQ and RS and the constant concentration was kept as 200 μM. Results clearly exhibited the increase of peak currents of HQ and RS (Fig. 6C–F) with increasing concentration. The oxidation peak of HQ showed a linear range of 100 μM–2.5 mM with a detection limit of 45 μM. Similarly, RS showed a wide linear of 20 μM–1.4 mM and a lower detection limit value of 4.1 μM. These results clearly evidence that Bi2WO6 has the ability to distinguish the two different analytes in both simultaneous and individual detection. The peak around −0.125 V arises due to the bare GCE. The graph was plotted without doing any baseline correction to exhibit the results transparently. Also, this peak gradually decreases with an increase of HQ concentration which is clearly witnessed from Fig. 6A. Also, the SWV results start with different current value due to the background current on the electrode as the result of analyte oxidation. The individual SWV plot of HQ starts at around 1.75–2.75 μA and of RS at 2–3 μA. The range is mainly because while increasing the concentration of the analyte more molecules interact on the electrode surface which leads to an increase of the background current. A similar pattern is seen in the simultaneous detection also.
As stated earlier, the effective interaction of analytes binding with the metal ions present produces excellent results. Further, good conductivity at the interface, accessible catalytic sites, and high binding affinity of Bi2WO6 lead to these significant results without any cross interference in binary mixture. This clearly shows the Bi2WO6 sensitive sensing of HQ and RS which suggests its promising role for real-time applications. The SWV results for bare GCE towards simultaneous detection of HQ and RS and comparison with previous works are given in Fig. S1 and Table S1 in the ESI.†
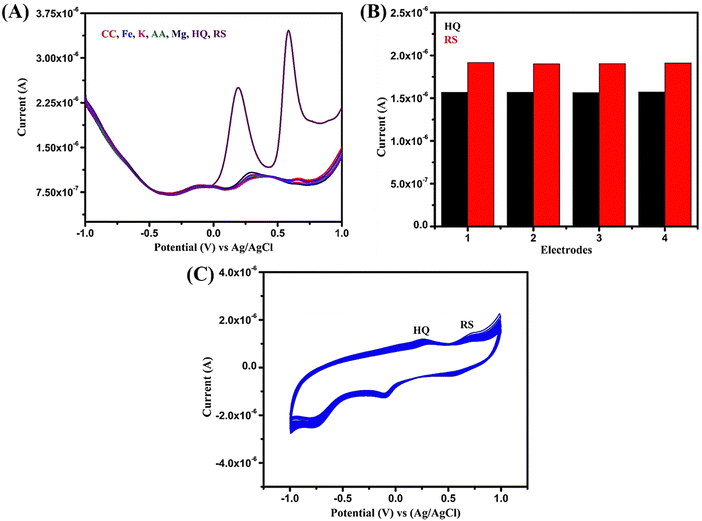
For determining the reproducibility of the proposed Bi2WO6 electrode, four different modified electrodes were used in a 10 ml PBS solution containing 200 μM of HQ and RS (shown in Fig. S2 in ESI†). The results (Fig. 7B) show acceptable relative standard deviation (RSD) and confirm the consistent current responses in the electrodes having values of 2.9% and 3.1% for HQ and RS without any surface fouling effect.
Stability is another essential aspect in evaluating the performance of the electrode material. The suggested sensor's stability was examined by executing CV up to 150 times in 10 ml of PBS with 200 μM of HQ and RS. Fascinatingly, the composite still retains 77% for HQ and 75% for RS of its initial current value after 150 cycles, proving its stability. Also, this confirms that the material is not leached from the GCE surface (Fig. 7C).
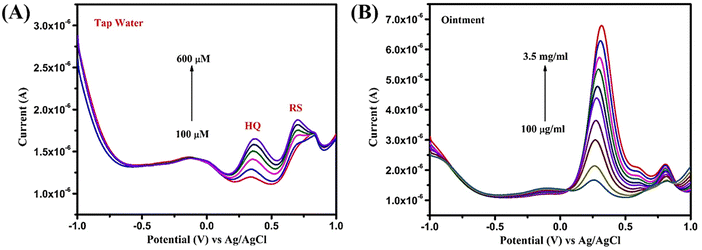
First, the tap water sample was filtered thoroughly using Whatman filter paper to remove unwanted impurities and the experiment was conducted using a standard addition method. The recoveries were calculated as 53–58% for HQ and 79–81% for RS. These results suggest the effectiveness of Bi2WO6 towards HQ and RS sensing. In the case of the ointment sample, 1 g of the ointment was added in 10 ml of PBS at pH 7 and stirred until complete dissolution. Then, the sample was added directly without any spiking and the recovery values were calculated as 94–101% for HQ. The recovery values of the three different samples are tabulated in Table 1. The ability to accurately detect and quantify the desired analytes in different real samples is crucial for the practical utility and reliability of the proposed sensing material.
| Analyte | Added (μM) | Current value found in SWV of commercial sample (μA) | Current value found in SWV of real sample (μA) | Recovery (%) | |||
|---|---|---|---|---|---|---|---|
| HQ | RS | HQ | RS | HQ | RS | ||
| Tap water | 200 | 2.38 | 1.96 | 1.28 | 1.60 | 53 | 81 |
| 300 | 2.46 | 2.11 | 1.41 | 1.69 | 57 | 80 | |
| 400 | 2.58 | 2.21 | 1.51 | 1.5 | 58 | 79 | |
| Analyte | Added (μM) | Current value found in SWV of commercial sample (HQ) (μA) | Current value found in SWV of real sample (HQ) (μA) | Recovery (%) |
|---|---|---|---|---|
| Ointment | 200 | 2.30 | 2.18 | 94 |
| 800 | 2.87 | 2.91 | 101 | |
| 2000 | 3.58 | 3.61 | 100 |
The reason behind the superior sensitivity is the effective interaction of analytes with the metal ions present in the composite, being responsible for the excellent results observed. This sensitive sensing capability of Bi2WO6 makes it a promising candidate for real-time applications, particularly in environmental monitoring and pollutant detection where the simultaneous detection of multiple analytes is crucial.
4. Future projections of this work
Herein, we have prepared pristine Bi2WO6 using a very simple method without any reducing agents in the synthesis process. In general, Bi2WO6 materials show high biocompatibility for antimicrobial and therapeutic applications; in photovoltaics they increase the overall life cycle in solar cells. Here, in a sensing application, Bi2WO6 showed excellent redox behaviour towards HQ and RS. In terms of limit of detection, stability, reproducibility, anti-interference nature, and real-sample analysis, the proposed sensor exhibited significant results even in pristine form (without compositing with any other material). The sensing results exhibited by this composite were somewhat similar to those previously reported for HQ and RS detection using various carbon, metal oxides etc. based on bi- and tri-hybrid composites. The idea of this work is to evaluate the sensing properties of pristine Bi2WO6 and to make it into composites with appropriate materials for further enhancement. Even though in terms of limit of detection the proposed sensor showed better performance than sensors in other reports, we believe that choosing a relevant composite material will enhance the overall sensing behaviour.5. Conclusion
In this study, we have successfully utilized pristine Bi2WO6 as an electrochemical sensor platform for the simultaneous detection of environmental pollutants HQ and RS. The sensor exhibited exceptional electrochemical characteristics when tested for simultaneous detection of both pollutants. The resulting electrode demonstrated wide linear ranges, allowing the detection of HQ and RS simultaneously and also the sensor could individually detect HQ and RS along with exhibiting low detection limits. Moreover, the developed sensor also has excellent reproducibility with stability and good selectivity, making it highly reliable for practical applications. Furthermore, the significant recoveries in pharmaceutical and water samples pave the way for the use of Bi2WO6-based devices as a sensing platform for the detection of HQ and RS.Conflicts of interest
There are no conflicts of interest to declare.Acknowledgements
Author JW gratefully acknowledges the RUSA 2.0 [F.24-51/2014-U, Policy (TN Multi-Gen), Dept. of Edn, Gol] for financial assistance. We wish to acknowledge Mr M. Ragunath for his great support in the instrumental characterizations and analysis. CSIR-CECRI MS Reference Number CECRI/PESVC/Pubs/2023-100.References
- M. Hao, D. Wei and Z. Li, Energy Fuels, 2022, 36, 11524–11531 CrossRef.
- W. Zhang, J. Zhao, A. A. Allam, Y. Xin, J. Lin, T. Gao, J. S. Ajarem, X. Li, C. Wang and D. W. Bahnemann, Energy Fuels, 2022, 36, 13852–13862 CrossRef.
- G. Dong, H. Hu, L. Wang, Y. Zhang and Y. Bi, J. Catal., 2018, 366, 258–265 CrossRef.
- J. Jeong, J. Mun, S. Das, J. Kim, J. R. Kim, W. Peng, M. Kim and T. W. Noh, ACS Appl. Electron. Mater., 2021, 3, 1023–1030 CrossRef.
- V. D. Nithya, R. K. Selvan, D. Kalpan, L. Vasylechko and C. Sanjeeviraj, Electrochim. Acta, 2013, 109, 720–731 CrossRef.
- B. Yao, G. Zheng, Y. Luan, L. Wang, X. Xing, Y. Wang, Y. Liu, J. He and F. Zhang, J. Mater. Sci.: Mater. Electron., 2023, 34, 1–19 CrossRef.
- A. M. de Campos, R. R. Silva, M. L. Calegaro and P. A. Raymundo-Pereira, Chemosensors, 2020, 8, 1–11 Search PubMed.
- F. Tian, H. Li, M. Li, C. Li, Y. Lei and B. Yang, Synth. Met., 2017, 226, 148–156 CrossRef.
- Y. Chen, X. Liu, S. Zhang, L. Yang, M. Liu, Y. Zhang and S. Yao, Electrochim. Acta, 2017, 231, 677–685 CrossRef CAS.
- T. C. Canevari, P. A. Raymundo-Pereira, R. Landers and S. A. S. Machado, Eur. J. Inorg. Chem., 2013, 5746–5754 CrossRef CAS.
- A. C. de Sá, S. C. Barbosa, P. A. Raymundo-Pereira, D. Wilson, F. M. Shimizu, M. Raposo and O. N. Oliveira, Chemosensors, 2020, 8, 1–11 Search PubMed.
- P. A. Raymundo-Pereira, N. O. Gomes, S. A. S. Machado and O. N. Oliveira, J. Electroanal. Chem., 2019, 848, 113319 CrossRef CAS.
- L. V. L. Martoni, N. O. Gomes, T. M. Prado, M. L. Calegaro, O. N. Oliveira Jr., S. A. S. Machado and P. A. Raymundo-Pereira, J. Environ. Chem. Eng., 2022, 10, 107556 CrossRef CAS.
- M. Pistonesi, M. E. Centurión, M. Pereyra, A. G. Lista and B. S. F. Band, Anal. Bioanal. Chem., 2004, 378, 1648–1651 CrossRef CAS.
- Y. C. Fiamegos, C. D. Stalikas, G. A. Pilidis and M. I. Karayannis, Anal. Chim. Acta, 2000, 403, 315–323 CrossRef CAS.
- M. F. Pistonesi, M. S. Di Nezio, M. E. Centurión, M. E. Palomeque, A. G. Lista and B. S. Fernández Band, Talanta, 2006, 69, 1265–1268 CrossRef CAS PubMed.
- A. Asan and I. Isildak, J. Chromatogr. A, 2003, 988, 145–149 CrossRef CAS.
- K. Fujino, T. Yoshitake, J. Kehr, H. Nohta and M. Yamaguchi, J. Chromatogr. A, 2003, 1012, 169–177 CrossRef CAS.
- D. Yin, J. Liu, X. Bo and L. Guo, Anal. Chim. Acta, 2020, 1093, 35–42 CrossRef CAS PubMed.
- L. Zaijun, S. Xiulan, X. Qianfang, L. Ruiyi, F. Yinjun, Y. Shuping and L. Junkang, Electrochim. Acta, 2012, 85, 42–48 CrossRef.
- H. Y. Liu, L. L. Zhu, Z. H. Huang, Y. B. Qiu, H. X. Xu, J. J. Wen, W. W. Xiong, L. H. Li and C. C. Gu, Chin. J. Anal. Chem., 2019, 47, e19113–e19120 Search PubMed.
- H. Ren, Y. Zhang, L. Liu, Y. Li, D. Wang, R. Zhang, W. Zhang, Y. Li and B. C. Ye, Microchim. Acta, 2019, 186 Search PubMed.
- A. Muthumariyappan, U. Rajaji, S. M. Chen, T. W. Chen, Y. L. Li and R. J. Ramalingam, Ultrason. Sonochem., 2019, 57, 233–241 CrossRef PubMed.
- Y. Song, F. Zhou, Y. Chai and S. Zhan, Res. Chem. Intermed., 2021, 47, 2297–2310 CrossRef.
- L. H. Hoang, N. D. Phu, P. Do Chung, P. C. Guo, X. B. Chen and W. C. Chou, J. Mater. Sci.: Mater. Electron., 2017, 28, 12191–12196 CrossRef.
- J. Shen, J. Xue, Z. Chen, J. Ni, B. Tang, G. He and H. Chen, J. Mater. Sci., 2018, 53, 4848–4860 CrossRef.
- S. Pramila, V. L. Ranganatha, T. L. Soundarya, R. Ramu, G. Nagaraju and C. Mallikarjunaswamy, J. Cluster Sci., 2022, 33, 2233–2248 CrossRef.
- U. Rajaji, M. Govindasamy, S. M. Chen, T. W. Chen, X. Liu and S. Chinnapaiyan, Composites, Part B, 2018, 152, 220–230 CrossRef.
- H. Ait Ahsaine, A. BaQais, M. Arab, B. Bakiz and A. Benlhachemi, Catalysts, 2022, 12 Search PubMed.
Footnote |
| † Electronic supplementary information (ESI) available. See DOI: https://doi.org/10.1039/d3ma00533j |
| This journal is © The Royal Society of Chemistry 2024 |

