DOI:
10.1039/D3MA00627A
(Paper)
Mater. Adv., 2024,
5, 1683-1690
Red gum-capped gold nanoparticles for electrochemical sensing of bromocresol purple in water
Received
31st August 2023
, Accepted 23rd December 2023
First published on 28th December 2023
Abstract
Bromocresol purple (BCP) dye changes the chemical and physical properties of water, thereby affecting the aquatic organisms. Therefore, it is highly necessary to assess BCP in water samples. Herein, gold nanoparticles (AuNPs) capped with red gum were used for assessing BCP in river water. First, AuNPs were synthesized via the reduction of Au(III) using red gum as a reducing and stabilizing agent. The synthesized AuNPs were then optically identified by ultraviolet-visible (UV-Vis) spectroscopy, which showed the characteristic absorption peak of AuNPs at 530 nm. Additionally, they were electrochemically identified using the square-wave voltammetry (SWV) technique, which monitored the characteristic oxidation peak of AuNPs at 1 V. Furthermore, transmission electron microscopy (TEM) revealed that AuNPs are spherical with an average size of 25 nm. Moreover, X-ray diffraction (XRD) and Fourier transform infrared (FT-IR) spectroscopy were used to characterize the surface functionalization of the synthesized AuNPs. Next, a glassy carbon electrode (GCE) was immersed in a suspension of red gum-AuNPs for 30 min. Then, red gum-AuNPs/GCE was electrochemically characterized by cyclic voltammetry (CV) and electrochemical impedance spectroscopy (EIS). The results of CV and EIS confirmed the catalytic activity of AuNPs and a 1.5-fold increase in the active surface area of the GCE after modification. The red gum-AuNPs/GCE sensor was used for detecting BCP via its oxidation through one-proton and one-electron transfer. The described SWV method was optimized and validated. The sensor showed detection and quantification limits of 0.015 and 0.05 ppm, respectively. Moreover, the sensor was applied for detecting BCP in river water samples over a wide linear range with an acceptable recovery value of 99%, which denotes the high sensitivity of the elucidated SWV method for the assay of BCP dye.

Moustafa Zahran
| Moustafa Zahran earned his bachelor's degree in chemistry (2012), master's degree in organic chemistry (2016), and PhD in organic electrochemistry (2022) from El-Menoufia University, Shibin El-Kom, Egypt. He is the Manager of Water Safety Management, Lab Sector, Menoufia Company for Water and Wastewater (MCWW), Holding Company for Water and Wastewater (HCWW), Egypt. His research is focused on the construction of electrochemical sensors based on metallic nanoparticles to detect organic pollutants in surface water. Currently, he is working on the development of water and wastewater treatment technologies. |

Magdi Abdel Azzem
| Magdi Abdel Azzem received his BSc (1976) and MSc (1980) degrees from Cairo University and PhD (1984) degree in chemistry from Cairo University and Joseph Fourier University, Grenoble, France (through the scientific channel system). Since 1995, he is a professor of electrochemistry in the Chemistry Department, Faculty of Science, Menoufia University, Egypt. He was the Chairman of Chemistry Department (2006-2009) and the Vice Dean for Community and Environmental Development (1998-2001). He was awarded the Prize of the State for the Encouragement (1996) and the Excellence award from Menoufia University (2016). His main fields of research interest are modified electrodes, sensors, and fuel cells. |

Mona El-Attar
| Mona El-Attar received her PhD from Tanta University in 2004. She had Postdoctoral Fellowship at Oklahoma University, Department of Chemistry and Biochemistry, Norman, USA (2007). She became an Assistant Professor in Physical Chemistry (2014). Her research interests include electroanalytical chemistry, and physical and inorganic chemistry. |
Introduction
Dyes play a crucial role in our life. They are responsible for the formation of colors due to the presence of chromophores such as azo, nitro, and carbonyl as well as auxochromes, which render solubility to the molecules and endow affinity to the fibers.1 They could be categorized as natural or synthetic depending on their original source. Natural dyes can be obtained from fruits, flowers, barks, and roots, while synthetic dyes were prepared using suitable chemical reagents. Ionic dyes, including cationic and anionic dyes, are considered the most widely used dyes.2 Anionic dyes include nitroso, nitro, triphenylmethane, anthraquinone and azo dyes, whilst cationic dyes include azine, azo, acridine, xanthene, anthraquinone, and oxazine dyes.3 Unfortunately, the dyes discharged into water change the chemical and physical properties of water, thereby affecting the aquatic organisms.1 Therefore, it is highly necessary to develop analytical tools to detect those dyes in the aquatic system as a preliminary step before their removal and/or degradation. Different chromatographic methods such as high-performance liquid chromatography (HPLC)4,5 and liquid chromatography/tandem mass spectrometry (LC/MS/MS)6 are used for detecting dyes. However, these methods require sample pretreatment, extraction prior to the analysis, and expensive equipment. Thus, there is a great interest in developing simple, sensitive, selective, and cheap sensors for detecting dyes. For example, electrochemical sensors are considered a suitable replacement for chromatographic techniques.7 In the present study, we report the electrochemical detection of bromocresol purple (BCP) for the first time.
BCP occupies a prominent place among the bromo derivatives of phenolsulfonphthalein.8 BCP as a sensitive element is utilized in colorimetric sensors for measuring the pH and ammonia content.9–11 Moreover, it can be used as a redox probe in the electrochemical sensors for enhancing the oxidation/reduction of targeted analytes. For example, poly(BCP) was used for the detection of 5-fluorouracil, 2,4,6-trichlorophenol, l-tyrosine, serotonin, and levodopa.12–15 However, BCP causes health problems to humans and aquatic organisms.16 Therefore, there is an urgent need for BCP removal from aqueous systems. Previously, its removal has been accomplished via adsorption on zeolite.16 However, analytical tools, which were used for BCP detection, should also be developed. A colorimetric sensor was previously studied for BCP detection.17 Herein, we report a novel electrochemical sensor based on gold nanoparticles (AuNPs) as redox probes for the determination of BCP.
AuNPs have attracted great attention due to their importance in biomedical and environmental applications. AuNPs are used for the construction of numerous electrochemical sensors due to their high surface area and chemical stability.18–23 For example, AuNPs are used as electrochemical probes for the detection of many analytes such as cortisol,24 diethylstilbestrol,25 dopamine,26 norepinephrine,27 serotonin,28 boron,29 copper(II) ions,30 arsenic ions,31 phosphates,32 and Escherichia coli.33 AuNPs can be fabricated by different methods such as laser-induced photochemical synthesis,34 plasma-based instant synthesis,35 UV-induced decomposition,36 chemical vapor deposition,37 and chemical reduction.38 Chemical reduction is considered the most widely used method for the synthesis of AuNPs. Various synthetic reducing agents such as trisodium citrate, ascorbic acid, and sodium borohydride as well as capping agents such as polyvinylpyrrolidone and cetyl-trimethyl-ammonium-bromide were used.39 The synthesis of AuNPs using biological reducing and capping agents has gained much interest.40 Plants are considered a potential source of reducing and capping compounds such as flavonoids, ascorbic acid, terpenes, and reductases.41 Plant materials including leaves, fruits, roots, or the whole plant could be used in the synthesis of AuNPs.42 For example, Eucalyptus tereticornis leaf extract has been used for the synthesis of AuNPs.43 However, additional capping agents may be required for enhancing the stability of metallic NPs. Therefore, researchers have recently focused on natural polymers including latex, mucilage, and gums, which are secreted by plants, as potential sources of reducing and capping agents.44–48 In the present study, a red gum polymer obtained from Eucalyptus tereticornis plant is utilized as a novel reducing and capping agent for the synthesis of AuNPs. The biosynthesized red gum-AuNPs were then used as electrocatalysts for improving the BCP dye oxidation as a step to detect the dye in river water.
Experimental
Materials and reagents
AuNP precursor, gold(III) chloride hydrate (HAuCl4·xH2O), was obtained from Sigma-Aldrich, while the targeted analyte, BCP dye, was obtained from PanReac AppliChem. Sodium hydrogen phosphate (Na2HPO4·H2O) and sodium dihydrogen phosphate (NaH2PO4·7H2O), which were obtained from Sigma-Aldrich, were used for the preparation of a phosphate buffer solution (PBS) (pH 4–7; 0.1 M). Acetate and citrate buffers as well as potassium ferrocyanide (K4Fe(CN)6·3H2O) were purchased from Sigma-Aldrich. Inorganic interferences, sodium chloride (NaCl), potassium chloride (KCl), calcium chloride (CaCl2), and magnesium chloride (MgCl2), as well as phenolphthalein, uric acid, dopamine, and ascorbic acid as organic interferents were purchased from Sigma-Aldrich, while the other organic interferents, methyl orange and Eriochrome Black T, were obtained from PanReac AppliChem.
Synthesis of red gum-AuNPs
Red gum was obtained from Eucalyptus tereticornis tree, which was cultivated in Menoufia governorate, Egypt. Red gum was obtained by gently scratching the tree. The ground red gum (1 gm) was dissolved in 30 mL distilled water. The red gum solution (5 mL) was mixed with 45 mL of gold(III) chloride hydrate solution (1 mM) and heated at 60 °C for 15 min for AuNP fabrication.
Identification and characterization of red gum-AuNPs
Red gum-AuNPs were optically identified and characterized using a Nanodrop spectrophotometer (Implen NanoPhotometer, N60). The specimen was diluted ten times before the spectrophotometer analysis. The wavelength range of 200–900 nm was used for monitoring the characteristic peak of AuNPs. Additionally, red gum-AuNPs were electrochemically identified using a BAS Epsilon-EC potentiostat/galvanostat (West Lafayette, IN 47,906, USA). A three-electrode setup comprising a glassy carbon electrode (GCE, 3 mm) as the working electrode, Ag/AgCl (1 M KCl) as the reference electrode, and a Pt wire as the counter electrode was used. The GCE was polished with 1.0, 0.3 and 0.05 μm alumina slurry for removing impurities from the surface of the GCE. The cleaned GCE was modified with red gum-AuNPs by immersing it in a suspension of AuNPs (5 mL) for 30 min. The modified GCE was then immersed in an electrochemical cell containing 0.1 M PBS (20 mL) of pH 7 for conducting the square-wave voltammetry (SWV) experiment in the potential range of 0.6–1.2 for monitoring the characteristic oxidation peak of AuNPs. Furthermore, a transmission electron microscope (TEM) [JEM-2100 (JEOL), Tokyo, Japan] was employed for determining the morphology, size, and diffraction pattern of AuNPs. For conducting an X-ray diffraction (XRD) experiment, an LY-10N/12N/18N Series vacuum freeze dryer was used for freeze-drying AuNPs. The analysis of the sample was conducted in powder form using a high-resolution GNR, APD 2000 Pro Step Scan Diffractometer Cu-Kα radiation, Italia (Central Laboratory, Tanta University, Egypt), λ = 1.540598 Å in the range of diffraction angle (2θ° = 5–70°). The applied voltage and current flow are 40 kV and 30 mA, respectively. The CRYSFIRE computer program was used to determine the indexed diffraction peaks in powder spectra and the lattice parameters; furthermore, the values of Miller indices (hkl) were estimated using the CHEKCELL program.49 Moreover, the chemistry of capping layer of AuNPs was studied using a Fourier transform infrared (FT-IR) spectrometer (Bruker Tensor 27, Germany). An IR spectrum of Red gum-AuNPs as the liquid sample was recorded within the range of 4000–200 cm−1 with KBr discs (Central Laboratory, Tanta University, Egypt).
Red gum-AuNPs/GCE for BCP detection
The efficacy of the red gum-AuNPs/GCE for detecting BCP was studied. First, the oxidation peak of BCP was monitored by SWV, and then the effects of incubation time, scan rate, and pH on the oxidation peak current were discussed. Different incubation times (5, 10, 15, 20, 25, 30, and 35 sec), scan rate values (0.02, 0.04, 0.06, 0.08, and 0.1 V s−1), and pH values (4, 5, 5.5, 6, 6.5, and 7) were tested.
The oxidation peak current was calculated from the straight lines connecting the minima and maxima of each peak. The calibration curves were obtained using the OriginPro software (Origin Lab Corporation, USA). Based on the analysis of the calibration curve, the limits of detection (LOD) and quantification (LOQ) were determined using eqn (1) and (2), respectively.
| | | Limit of detection (LOD) = 3 s/b | (1) |
| | | Limit of quantification (LOQ) = 10 s/b | (2) |
where
s refers to the standard deviation of the
y-intercept and
b refers to the slope of the calibration curve, respectively. Additionally, the relative standard deviation (RSD) for the peak current of 15 ppm based on six replicates was calculated for determining the repeatability of the proposed sensor. Moreover, the sensitivity was determined, where slope = sensitivity.
Interference studies
The tested inorganic interferents included Na+, K+, Ca2+, and Mg2+, while the organic interferences included Eriochrome Black T, methyl orange, phenolphthalein, uric acid, dopamine, and ascorbic acid as possible interferents in river water samples.
Real sample studies
The river water samples were collected in high-density polyethylene bottles from Al-Bajouria canal, Menoufia, Egypt. The samples were filtrated at the day of collection through cellulose acetate membrane filters with 0.45 mm pore size. The filtrated samples were diluted twice with 0.1 M PBS of pH 7 before spiking with 5, 15, and 25 ppm of BCP dye. The concentration of BCP dye was determined from the calibration curve based on its SW oxidation current. The recovery value was determined according to eqn (3). Additionally, the spectrophotometric analysis was conducted to investigate the accuracy of the proposed electrochemical sensor.| | | Recovery (%) = (found concentration/added concentration) × 100 | (3) |
Results and discussion
Synthesis and characterization of red gum-AuNPs
The synthesis of AuNPs was accomplished by heating a mixture of the red gum polymer, which was obtained from E. tereticornis, and gold(III) chloride hydrate (Fig. 1). The capability of red gum to form AuNPs is attributed to the presence of kinotannic acid. Kinotannic acid could be easily oxidized, and the released electrons will be gained by Au(III) to form Au(0) (Fig. 2). The neutral Au atoms are then nucleated and aggregated to form AuNPs, which will be capped by the remaining kinotannic acid via steric attraction preventing the continuous aggregation process.
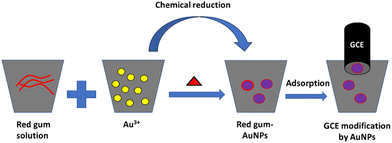 |
| | Fig. 1 Schematic of the AuNP synthesis and the subsequent electrode modification. | |
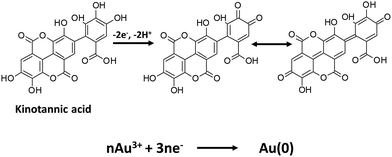 |
| | Fig. 2 Proposed mechanism of AuNP synthesis by kinotannic acid. | |
The formation and characterization of AuNPs were accomplished by ultraviolet-visible (UV-Vis) spectroscopy, SWV technique, and TEM studies. UV-Vis spectroscopy is a valuable tool for monitoring the localized surface plasmon resonance (LSPR) peak, which corresponds to metallic NPs.40,50–52 Reportedly, AuNPs showed their characteristic LSPR peak in the range of 500–600 nm according to the nanoparticle size.40 In this work, the LSPR peak of the biosynthesized red gum-AuNPs appeared at 530 nm (Fig. 3A). Additionally, electrochemical techniques could be used for detecting metallic NPs based on stripping of metallic NPs.53,54 Herein, direct stripping of AuNPs was used for the identification of AuNPs. First, the GCE was modified with AuNPs by immersing it in a AuNP suspension for a suitable time (30 min), as shown in Fig. 1. This immersion led to an electrostatic interaction between the AuNPs and the surface of GCE. Next, the modified GCE was immersed in a PBS electrolyte for conducting the SWV experiment. The AuNPs were oxidized to Au3+ giving a voltammogram with a characteristic oxidation potential at 1 V (Fig. 3B). Previously, AuNPs have shown a characteristic oxidation peak in the potential range of 0.7 to 1 V, confirming our results.55,56 Moreover, the TEM results showed that AuNPs are monodisperse single-crystalline spherical particles with an average diameter of 25 nm (Fig. 3C and D). Furthermore, EDX analysis and EDX mapping were performed to determine the composition of red gum-AuNPs, as shown in Fig. 3E and F. The presence of carbon and oxygen refers to the presence of kinotannic acid around the AuNPs.
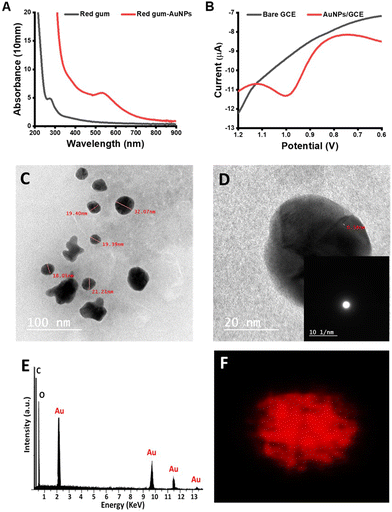 |
| | Fig. 3 (A) UV-Vis spectra, (B) SWV, (C) HR-TEM image, (D) diffraction pattern, (E) EDX, and (F) EDX mapping of red gum-AuNPs. | |
The crystalline nature of the as-prepared red gum-AuNPs was investigated by XRD, as shown in Fig. 4A. The XRD pattern was characterized by a broad peak at 2θ ≈ 23° and three sharp peaks at 2θ = 38.5°, 44.6° and 64.6°. Using Bragg's law: 2d![[thin space (1/6-em)]](https://www.rsc.org/images/entities/char_2009.gif) sin
sin![[thin space (1/6-em)]](https://www.rsc.org/images/entities/char_2009.gif) θ = nλ (where d is the interplanar distance, θ is Bragg's angle and λ is the X-ray wavelength (1.5406 Å)). The value of d was estimated for the present AuNPs and found to be in the range of 0.02–0.03 nm. The broad peak confirmed the amorphous nature of red gum polymer, while the sharp peaks proved the presence of some crystalline aggregations of AuNPs. Furthermore, the peaks are indexed according to JCPDS file No. 04-0784 for the observed sharp peaks as the lattice planes (111), (200) and (220) of the face-centered cubic (FCC) crystal structure of AuNPs.57,58
θ = nλ (where d is the interplanar distance, θ is Bragg's angle and λ is the X-ray wavelength (1.5406 Å)). The value of d was estimated for the present AuNPs and found to be in the range of 0.02–0.03 nm. The broad peak confirmed the amorphous nature of red gum polymer, while the sharp peaks proved the presence of some crystalline aggregations of AuNPs. Furthermore, the peaks are indexed according to JCPDS file No. 04-0784 for the observed sharp peaks as the lattice planes (111), (200) and (220) of the face-centered cubic (FCC) crystal structure of AuNPs.57,58
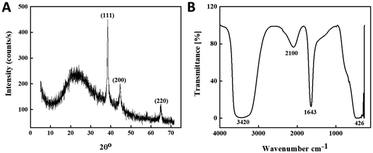 |
| | Fig. 4 (A) XRD pattern and (B) FT-IR spectra of red gum-AuNPs. | |
The average crystallite size S, dislocation density (δ) and microstrane (μ) of AuNPs can be evaluated using the following equations: S = kλ/β![[thin space (1/6-em)]](https://www.rsc.org/images/entities/char_2009.gif) cos
cos![[thin space (1/6-em)]](https://www.rsc.org/images/entities/char_2009.gif) (θ); δ = 1/S2; and μ = β/4
(θ); δ = 1/S2; and μ = β/4![[thin space (1/6-em)]](https://www.rsc.org/images/entities/char_2009.gif) tan(θ), where k is the Scherrer constant (0.95 Å) and β is full width at half maximum height of the (111) peak diffraction. The calculated value of S, δ and μ was found to be 15.4 nm, 4.2 × 10⁻³ nm−3 and 7.11 × 10⁻³, respectively. The value of the average crystallite size obtained by XRD is in good agreement with the results obtained from the TEM image presented in Fig. 3C and D.
tan(θ), where k is the Scherrer constant (0.95 Å) and β is full width at half maximum height of the (111) peak diffraction. The calculated value of S, δ and μ was found to be 15.4 nm, 4.2 × 10⁻³ nm−3 and 7.11 × 10⁻³, respectively. The value of the average crystallite size obtained by XRD is in good agreement with the results obtained from the TEM image presented in Fig. 3C and D.
FT-IR spectroscopy was performed to characterize the surface functionalization of the synthesized red gum-AuNPs. Fig. 4B depicts the FT-IR spectra of AuNPs with absorption bands at 3420, 2100, 1643, and 426 cm−1. The band at 1643 cm−1 was assigned to the stretching vibrations of the aromatic carbonyl group.59 The weak overtone band at 2100 cm−1 indicated the presence of aromatic compounds on the nanoparticle surface. While the intense broad absorption band at 3420 cm−1 was assigned to the O–H stretching vibrations, which might be responsible for the reducing property of kinotannic acid.
Electrochemical characterization of the red gum-AuNPs/GCE
CV was used for characterizing the bare and modified electrodes using ferrocyanide as an electrochemical probe. It is obvious that the red gum-AuNPs/GCE showed improved oxidation and reduction peak currents and reduced peak-to-peak separation (ΔEp) compared with the bare GCE (Fig. 5). The values of oxidation current of bare and modified electrodes were 39 and 58 μA, respectively, while the ΔEp value of bare and modified electrodes were 420 and 105 mV, respectively. The improved oxidation and reduction peak currents are attributed to the catalytic effect of AuNPs, while the reduction of peak-to-peak separation refers to rapid electron transfer. The role of AuNPs in enhancing the redox peak current of Fe(CN)64−/3− was reported previously.25,30 Additionally, electrochemical impedance spectroscopy (EIS) was performed to study the electron transfer at the electrode surface using the Randles equivalent circuit, where Rs, Q, Ret, and Zw refer to the electrolyte solution resistance, constant phase element, electron transfer resistance, and Warburg impedance, respectively. The Ret value was calculated from the diameter of the semicircle of the Nyquist plot (Fig. 5B). Obviously, the Ret value of the modified electrode is smaller than the Ret value of the bare one, confirming the enhancement in electron transfer after modification with AuNPs. The determination of exchange current density (I0) is necessary for studying the electrocatalytic activity of the modified electrodes.24 The I0 value was calculated using eqn (4):where R, T, n, and F refer to the gas constant, temperature, number of electrons transferred in the reaction, and Faraday constant, respectively. The values of I0 of the bare and modified electrodes were 1.1 and 1.9 μA, respectively proving the electrocatalytic activity of AuNPs. Moreover, the electroactive surface areas of both electrodes were calculated according to the Randles–Sevcik equation (eqn (5)):| | | ip = (2.69 × 10⁵)n3/2ACD1/2υ1/2 | (5) |
where ip, n, A, C, D, and υ refer to current (A), number of electrons transferred in the reaction, area of the electrode (cm2), concentration of the probe (mol cm−3), diffusion coefficient (6.67 × 10⁻⁶ cm2 s−1), and the scan rate (V s−1), respectively. The active surface areas of the bare GCE and red gum-AuNPs/GCE were 0.06 (± 0.03) and 0.09 (± 0.04), respectively, showing a 1.5-fold increase in the active surface area.
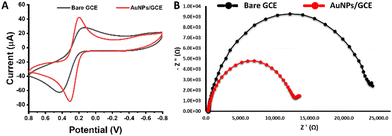 |
| | Fig. 5 (A) CV and (B) Nyquist plot measurements of the bare GCE and red gum-AuNPs/GCE using potassium ferrocyanide (5 mM) in KCl (1 M) at a scan rate of 0.02 V s−1. | |
Red gum-AuNPs/GCE for BCP detection
In this work, red gum-AuNPs/GCE was examined as a novel tool to determine BCP. First, the oxidation behavior of BCP at the bare GCE and red gum-AuNPs/GCE was studied, as shown in Fig. 6A. A characteristic peak corresponding to BCP oxidation appeared at 0.33 V. It is obvious that red gum-AuNPs/GCE resulted in a higher BCP oxidation peak current than that of the bare GCE. This is due to the catalytic effect of AuNPs as redox mediators. Additionally, red gum molecules play a great role in the interaction with BCP dye via hydrogen bonding. Fig. 6B shows the role of AuNPs in enhancing the oxidation current. Basically, the oxidation current in SWV was determined on the basis of the differential current, according to eqn (6).where ΔI, I1, and I2 refer to the differential current, forward (direct) pulse current, and backward (reverse) pulse current, respectively. In each pulse, the oxidation of BCP (forward pulse) is followed by its reduction (backward pulse). In the presence of AuNPs as a redox mediator, the backward pulse current was enhanced, and thus the differential current was increased (Fig. 6B). The chemical structure of BCP and the oxidation mechanism are shown in Fig. 7 and 8, respectively. One of the hydroxyl groups of BCP could be oxidized through one-proton and one-electron transfer, forming the radicals that can be combined via carbon–oxygen couplings. The oxidation current of BCP was enhanced through the optimization of parameters such as incubation time, scan rate, and pH (Fig. 9). The duration of modified GCE incubation in PBS containing BCP should be enough for efficient adsorption of BCP through hydrogen bonding at the modified electrode. The incubation time of 30 sec is appropriate for adsorption and subsequent oxidation of BCP (Fig. 9A).
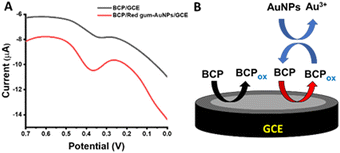 |
| | Fig. 6 (A) SWVs of BCP (5 ppm) oxidation at GCE and red gum-AuNPs/GCE. (B) Schematic of the redox cycling. | |
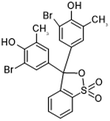 |
| | Fig. 7 Chemical structure of BCP. | |
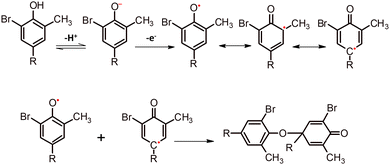 |
| | Fig. 8 Proposed mechanism of BCP oxidation and subsequent dimerization. | |
 |
| | Fig. 9 Effect of (A) incubation time, (B) scan rate, and (C) pH on the oxidation of BCP (5 ppm). | |
The incubation was achieved during stirring of the electrolyte containing BCP. The scan rate is also an important parameter for improving the oxidation process. A scan rate of 0.1 V s−1 is good for BCP oxidation with a high produced peak current (Fig. 9B). Additionally, pH adjustment is a critical parameter that affects the deprotonation and oxidation of BCP. Notably, the pH range of 6.5–7 resulted in the highest oxidation current (Fig. 9C). A pH of 7 was selected as the appropriate condition for both BCP deprotonation and subsequent oxidation, as well as for AuNP stability against aggregation. Moreover, the effect of the supporting electrolytes, phosphate, acetate, and citrate, on the oxidation peak of BCP dye was studied. Under the same conditions (pH 7, incubation time of 30 sec, and scan rate of 0.1 V s−1), the oxidation current was 1.82, 1.72, and 1.47 μA respectively for phosphate, acetate, and citrate electrolytes. The data proved the efficiency of phosphate buffer over acetate and citrate ones.
Under the appropriate conditions (incubation time of 30 sec, scan rate of 0.1 V s−1, and pH 7), the oxidation of different BCP concentrations (0.05–25 ppm) at red gum-AuNPs/GCE was achieved (Fig. 10). The sensor exhibited LOD and LOQ values of 0.015 and 0.05 ppm, respectively. Previously, the BCP dye was optically detected with an LOD of 135 ppm, confirming the high sensitivity of our proposed electrochemical sensor.17 Moreover, it exhibited a high sensitivity with a value of 0.14 μA mg−1 L−1 cm−2 (Table 1). Additionally, the sensor showed accepted repeatability with an RSD value of 1.98%. Furthermore, the regression equation of the sensor is I (μA) = 0.14 (± 0.05) CBCP mg−1 L−1 + 0.73 (± 0.08). Furthermore, the robustness of the sensor was tested by studying the effect of small variation of pH and pulse amplitude without variations in the other conditions. The results indicated that the recovery was in the range of 98.2 to 102.3% with an RSD value less than 2.0% (Table 2). Accordingly, our proposed sensor is considered a high-robust sensor.
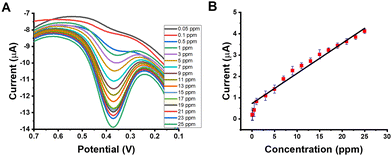 |
| | Fig. 10 (A) SWVs and (B) the corresponding calibration curve for BCP oxidation at red gum-AuNPs/GCE. Conditions: pH, 7; incubation time, 30 sec; scan rate, 0.1 V s−1; step potential, 0.004 V; frequency, 25 Hz; and amplitude, 0.05 V. | |
Table 1 Analytical parameters
| Sensor |
Linear range (ppm) |
R
2
|
LOD (ppm) |
LOQ (ppm) |
Sensitivity (μA (mg/L)−1 cm−2) |
RSD (%) |
| Red gum-AuNPs/GCE |
0.05–25 |
0.98 |
0.015 |
0.05 |
0.14 |
1.98 |
Table 2 Robustness results of the proposed electrochemical sensor
| Variable |
Value |
Recovery (%) |
RSD (%) |
| pH |
6.5 |
99.15 |
1.96 |
| 7 |
99.40 |
1.88 |
| Pulse amplitude (V) |
0.05 |
98.20 |
1.43 |
| 0.075 |
102.25 |
1.59 |
Interference study
In this study, we examined the effects of some possible organic and inorganic interferents on BCP oxidation at red gum-AuNPs/GCE. The maximum acceptable concentration of each interferent, which has led to less than 5% signal change, was determined (Table 3). The results showed the high selectivity of red gum-AuNPs/GCE in the presence of the selected interferents.
Table 3 Maximum acceptable concentration of the possible interferents
| Interference |
Maximum acceptable concentration mg−1 L−1a |
|
95% confidence interval calculated (n = 6).
|
| Na+ |
550 ± 2.0 |
| K+ |
490 ± 1.8 |
| Ca2+ |
530 ± 1.7 |
| Mg2+ |
519 ± 1.9 |
| Phenolphthalein |
670 ± 1.8 |
| Eriochrome black T |
430 ± 1.9 |
| Methyl orange |
350 ± 1.3 |
| Uric acid |
235 ± 1.5 |
| Dopamine |
320 ± 1.7 |
| Ascorbic Acid |
190 ± 1.4 |
Real sample study
The efficacy of the red gum-AuNPs/GCE sensor in the electrochemical detection of BCP in river water samples was studied. An accepted recovery value (99%) was reported for the proposed sensor (Table 4). This result refers to the suitability of the proposed electrochemical sensor for assessing BCP in river water without regard to the interferents of river water. Moreover, the standard addition technique was followed for evaluating the selectivity of the electrochemical sensor. The regression equation of the sensors is I = 0.14 (± 0.02) CBCP + 0.75 (± 0.1). Obviously, there was no considered difference between the calibration and regression equations, confirming the suitability of red gum-AuNPs/GCE for assessing the BCP dye in the samples of river water. Spectrophotometry is utilized as a reliable tool for confirming the results obtained by other techniques. Previously, it has been applied for quantifying the BCP dye.17 The spectrophotometric data confirmed the results of our proposed sensor.
Table 4 Electrochemical detection of BCP in the samples of river water
| Sensor |
Added BCP (ppm) |
Found BCP (ppm)a |
Recovery (%) |
Spectral analysis (ppm) |
|
95% confidence interval calculated (n = 6).
|
| Red gum-AuNPs/GCE |
5 |
4.87 ± 0.3 |
97 |
4.92 |
|
|
15 |
14.85 ± 0.3 |
99 |
14.9 |
|
|
25 |
24.93 ± 0.3 |
99 |
24.9 |
Conclusion
In the present study, AuNPs have been synthesized by reducing gold(III) using red gum. Red gum-AuNPs were optically and electrochemically identified by UV-Vis spectrophotometry and SWV technique, respectively. Their morphology and average size were determined by TEM. Additionally, the crystal structure and chemistry of the capping layer were studied by XRD and FT-IR spectroscopy, respectively. An electrochemical sensor was prepared by dipping a GCE in a red gum-AuNP suspension for 30 min. It was electrochemically characterized using CV and EIS, proving the catalytic activity of AuNPs. Red gum-AuNPs/GCE was dipped in PBS containing the BCP dye for the electrochemical detection of the dye via its oxidation through one-proton and one-electron transfer using the SWV technique. The analytical parameters including LOD, LOQ, RSD, and sensitivity of the proposed electrochemical sensor were determined. Additionally, the effects of possible inorganic and organic interferents on the BCP oxidation current were determined. Moreover, the suitability of the proposed electrochemical sensor to detect BCP in river water was evaluated. Overall, the proposed sensor is a good alternative for the quantification of harmful dyes with good rapidity, reliability, and simplicity.
Conflicts of interest
There are no conflicts to declare.
Acknowledgements
The authors acknowledge the scientific donation of the Alexander von Humboldt Foundation, Germany.
Notes and references
- R. D. Saini, Int. J. Chem. Eng. Res., 2017, 9, 121–136 Search PubMed.
- A. Tkaczyk, K. Mitrowska and A. Posyniak, Sci. Total Environ., 2020, 717, 137222 CrossRef PubMed.
- P. K. Yeow, S. W. Wong and T. Hadibarata, Biointerface Res. Appl. Chem., 2021, 11, 8218–8232 Search PubMed.
- I. Groeneveld, B. Pirok, S. Molenaar, P. Schoenmakers and M. van Bommel, J. Chromatogr. A, 2022, 1673, 463038 CrossRef PubMed.
-
A. Tatarus, C. M. Simionescu, R. E. Scutariu, V. Iancu, F. Pirvu, D. Puiu and T. Galaon, 2020.
- A. Al Tamim, M. AlRabeh, A. Al Tamimi, A. AlAjlan and A. Alowaifeer, Arabian J. Chem., 2020, 13, 3882–3888 CrossRef CAS.
- M. Zahran, Z. Khalifa, M. Zahran and M. A. Azzem, Mater. Adv., 2021, 2, 7350–7365 RSC.
- S. A. Shapovalov, Spectrochim. Acta, Part A, 2022, 269, 120741 CrossRef CAS.
- M. C. Cichero and J. H. Z. dos Santos, Appl. Surface Sci. Adv., 2021, 4, 100078 CrossRef.
- N. A. Gavrilenko, N. V. Saranchina, A. V. Sukhanov and D. A. Fedan, Mendeleev Commun., 2018, 28, 450–452 CrossRef CAS.
- H. Khanjanzadeh and B.-D. Park, Carbohydr. Polym., 2021, 273, 118550 CrossRef CAS.
- R. Banu and B. K. Swamy, Inorg. Chem. Commun., 2022, 141, 109495 CrossRef CAS.
- S. Shrestha, R. J. Mascarenhas, O. J. D'Souza, A. K. Satpati, Z. Mekhalif, A. Dhason and P. Martis, J. Electroanal. Chem., 2016, 778, 32–40 CrossRef CAS.
- D. K. Zeybek, B. Demir, B. Zeybek and Ş. Pekyardımcı, Talanta, 2015, 144, 793–800 CrossRef PubMed.
- X. Zhu, J. Liu, Z. Zhang, N. Lu, X. Yuan and D. Wu, Anal. Methods, 2015, 7, 3178–3184 RSC.
- L. Aljerf, J. Environ. Manage., 2018, 225, 120–132 CrossRef PubMed.
-
R. Gorkin, M. Czugala, C. Rovira-Borras, J. Ducree, D. Diamond and F. Benito-Lopez, International Conference on Solid State Sensors and Actuators (TRANSDUCERS), 2011, pp. 2526–2529 DOI:10.1109/TRANSDUCERS.2011.5969761.
- R. M. Mohamed, S. H. Mohamed, A. M. Asran, I. H. Alsohaimi, H. M. Hassan, H. Ibrahim and M. M. El-Wekil, Microchem. J., 2023, 190, 108696 CrossRef PubMed.
- M. Ibrahim, H. Ibrahim, N. B. Almandil, M. A. Sayed, A. N. Kawde and Y. Aldaqdouq, Electroanalysis, 2020, 32, 2146–2155 CrossRef.
- M. Ibrahim, H. Ibrahim, N. B. Almandil, M. A. Sayed and A.-N. Kawde, Anal. Methods, 2020, 12, 2846–2857 RSC.
- H. Ibrahim and Y. Temerk, Sens. Actuators, B, 2021, 347, 130626 CrossRef.
- H. Ibrahim and Y. Temerk, Mirochem. J., 2022, 178, 107425 CrossRef.
- M. L. Yola and N. Atar, Anal. Bioanal. Chem., 2021, 413, 2481–2492 CrossRef PubMed.
- C. Nong, B. Yang, X. Li, S. Feng and H. Cui, Microchem. J., 2022, 179, 107434 CrossRef.
- J. Wu, X. Zhao, Y. Zou, X. Wu, W. Bai and X. Zeng, Microchem. J., 2021, 164, 105952 CrossRef.
- Ş. Sağlam, A. Arman, A. Üzer, B. Ustamehmetoğlu, E. Sezer and R. Apak, Electroanalysis, 2020, 32, 964–970 CrossRef.
- A. Fajardo, D. Tapia, J. Pizarro, R. Segura and P. Jara, J. Appl. Electrochem., 2019, 49, 423–432 CrossRef.
- B. Wu, S. Yeasmin, Y. Liu and L.-J. Cheng, Sens. Actuators, B, 2022, 354, 131216 CrossRef.
- Ş. Sağlam, A. Üzer, E. Erçağ and R. Apak, Microchem. J., 2021, 166, 106252 CrossRef.
- M. Atapour, G. Amoabediny and M. Ahmadzadeh-Raji, RSC Adv., 2019, 9, 8882–8893 RSC.
- S. T. Niyomthai, P. Supaphol and P. Niyomthai, Mater. Today: Proc., 2022, 52, 2505–2511 Search PubMed.
- T. Wu, D. Xia, J. Xu, C. Ye, D. Zhang, D. Deng, J. Zhang and G. Huang, Microchem. J., 2021, 167, 106311 CrossRef.
- N. Razmi, M. Hasanzadeh, M. Willander and O. Nur, Anal. Methods, 2022, 14, 1562–1570 RSC.
- K. Y. Putri, A. L. Fadli, F. A. Umaroh, Y. Herbani, C. Imawan and D. Djuhana, Radiat. Phys. Chem., 2022, 110269 CrossRef.
- X. Li, C.-X. Zhao and L. Lin, Chem. Eng. Sci., 2022, 260, 117849 CrossRef.
- S. Li, Y. Xue, Y. Mai, Y. Zhang and Q. Shen, Int. J. Biol. Macromol., 2022, 211, 26–34 CrossRef PubMed.
- R. Holomb, O. Kondrat, V. Mitsa, A. Mitsa, D. Gevczy, D. Olashyn, L. Himics, I. Rigó, A. J. Sadeq and M. H. Mahmood, J. Alloys Compd., 2022, 894, 162467 CrossRef.
- R. H. Taha, Inorg. Chem. Commun., 2022, 109610 CrossRef.
- N. Sen, R. Chakravarty, K. Singh, S. Chakraborty, L. Panicker and K. Shenoy, Chem. Eng. Process., 2022, 179, 109036 CrossRef.
- A. Vávrová, T. Čapková, I. Kuřitka, J. Vícha and L. Münster, Int. J. Biol. Macromol., 2022, 206, 927–938 CrossRef.
- J. Santhoshkumar, S. Rajeshkumar and S. V. Kumar, Biochem. Biophys. Rep., 2017, 11, 46–57 Search PubMed.
- V. Sekar, M. M. Al-Ansari, J. Narenkumar, L. Al-Humaid, P. Arunkumar and A. Santhanam, J. King Saud Univ. Sci., 2022, 34, 102197 CrossRef.
- M. Kiran, V. S. Betageri, C. Kumar, S. Vinay and M. Latha, J. Inorg. Organomet. Polym. Mater., 2020, 30, 2916–2925 CrossRef CAS.
- Z. Khalifa, M. Zahran, M. A. Zahran and M. A. Azzem, RSC Adv., 2020, 10, 37675–37682 RSC.
- M. Zahran, Z. Khalifa, M. A. Zahran and M. A. Azzem, Microchem. J., 2021, 106173 CrossRef CAS.
- M. Zahran, Z. Khalifa, M. A. Zahran and M. A. Azzem, Electrochim. Acta, 2021, 394, 139152 CrossRef CAS.
- M. Zahran, Z. Khalifa, M. A.-H. Zahran and M. A. Azzem, Electrochim. Acta, 2020, 356, 136825 CrossRef CAS.
- M. Zahran and A. H. Marei, Int. J. Biol. Macromol., 2019, 136, 586–596 CrossRef CAS.
-
R. Shirley, The Lattice, 2000 Search PubMed.
- E. I. El-Aswar, S. E.-S. Gaber, M. M. Zahran and A. H. Abdelaleem, Desalination Water Treatment, 2020, 195, 275–285 CrossRef CAS.
- M. El-Kemary, M. Zahran, S. A. Khalifa and H. R. El-Seedi, Micro Nano Lett., 2016, 11, 311–314 CrossRef CAS.
- M. Zahran, M. El-Kemary, S. Khalifa and H. El-Seedi, Green Process Synth., 2018, 7, 100–105 CAS.
- A. de la Escosura-Muñiz, M. Maltez-da Costa and A. Merkoçi, Biosens. Bioelectron., 2009, 24, 2475–2482 CrossRef.
- D. Martín-Yerga, Biosensors, 2019, 9, 47 CrossRef.
- S. L. Allen, J. N. Sharma and F. P. Zamborini, J. Am. Chem. Soc., 2017, 139, 12895–12898 CrossRef CAS.
- D.-D. Han, S.-S. Li, Z. Guo, X. Chen, J.-H. Liu and X.-J. Huang, RSC Adv., 2016, 6, 30337–30344 RSC.
- S. Gurunathan, J. Han, J. H. Park and J.-H. Kim, Nanoscale Res. Lett., 2014, 9, 1–11 CrossRef PubMed.
- V. G. Kumar, S. D. Gokavarapu, A. Rajeswari, T. S. Dhas, V. Karthick, Z. Kapadia, T. Shrestha, I. Barathy, A. Roy and S. Sinha, Colloids Surf., B, 2011, 87, 159–163 CrossRef CAS.
-
B. H. Stuart, Infrared spectroscopy: fundamentals and applications, John Wiley & Sons, 2004 Search PubMed.
|
| This journal is © The Royal Society of Chemistry 2024 |
Click here to see how this site uses Cookies. View our privacy policy here.  Open Access Article
 *ab,
Magdi Abdel
Azzem
a and
Mona
El-Attar
c

![[thin space (1/6-em)]](https://www.rsc.org/images/entities/char_2009.gif) sin
sin![[thin space (1/6-em)]](https://www.rsc.org/images/entities/char_2009.gif) θ = nλ (where d is the interplanar distance, θ is Bragg's angle and λ is the X-ray wavelength (1.5406 Å)). The value of d was estimated for the present AuNPs and found to be in the range of 0.02–0.03 nm. The broad peak confirmed the amorphous nature of red gum polymer, while the sharp peaks proved the presence of some crystalline aggregations of AuNPs. Furthermore, the peaks are indexed according to JCPDS file No. 04-0784 for the observed sharp peaks as the lattice planes (111), (200) and (220) of the face-centered cubic (FCC) crystal structure of AuNPs.57,58
θ = nλ (where d is the interplanar distance, θ is Bragg's angle and λ is the X-ray wavelength (1.5406 Å)). The value of d was estimated for the present AuNPs and found to be in the range of 0.02–0.03 nm. The broad peak confirmed the amorphous nature of red gum polymer, while the sharp peaks proved the presence of some crystalline aggregations of AuNPs. Furthermore, the peaks are indexed according to JCPDS file No. 04-0784 for the observed sharp peaks as the lattice planes (111), (200) and (220) of the face-centered cubic (FCC) crystal structure of AuNPs.57,58![[thin space (1/6-em)]](https://www.rsc.org/images/entities/char_2009.gif) cos
cos![[thin space (1/6-em)]](https://www.rsc.org/images/entities/char_2009.gif) (θ); δ = 1/S2; and μ = β/4
(θ); δ = 1/S2; and μ = β/4![[thin space (1/6-em)]](https://www.rsc.org/images/entities/char_2009.gif) tan(θ), where k is the Scherrer constant (0.95 Å) and β is full width at half maximum height of the (111) peak diffraction. The calculated value of S, δ and μ was found to be 15.4 nm, 4.2 × 10⁻³ nm−3 and 7.11 × 10⁻³, respectively. The value of the average crystallite size obtained by XRD is in good agreement with the results obtained from the TEM image presented in Fig. 3C and D.
tan(θ), where k is the Scherrer constant (0.95 Å) and β is full width at half maximum height of the (111) peak diffraction. The calculated value of S, δ and μ was found to be 15.4 nm, 4.2 × 10⁻³ nm−3 and 7.11 × 10⁻³, respectively. The value of the average crystallite size obtained by XRD is in good agreement with the results obtained from the TEM image presented in Fig. 3C and D.


