
 Open Access Article
 This Open Access Article is licensed under a Creative Commons Attribution-Non Commercial 3.0 Unported Licence
Centrifugal microfluidic system for colorimetric sample-to-answer detection of viral pathogens†
Matthias
Geissler‡
 a,
Daniel
Brassard‡
a,
Nadine
Adam
b,
Neda
Nasheri
bc,
Ana Victoria C.
Pilar
b,
Kyle
Tapp
b,
Liviu
Clime
a,
Caroline
Miville-Godin
a,
Maxence
Mounier
a,
Christina
Nassif
a,
Ljuboje
Lukic
a,
Lidija
Malic
a,
Nathalie
Corneau
*b and
Teodor
Veres
*a
a,
Daniel
Brassard‡
a,
Nadine
Adam
b,
Neda
Nasheri
bc,
Ana Victoria C.
Pilar
b,
Kyle
Tapp
b,
Liviu
Clime
a,
Caroline
Miville-Godin
a,
Maxence
Mounier
a,
Christina
Nassif
a,
Ljuboje
Lukic
a,
Lidija
Malic
a,
Nathalie
Corneau
*b and
Teodor
Veres
*a
aLife Sciences Division, National Research Council of Canada, 75 de Mortagne Boulevard, Boucherville, QC J4B 6Y4, Canada. E-mail: teodor.veres@cnrc-nrc.gc.ca
bBureau of Microbial Hazards, Health Canada, 251 Sir Frederick Banting Driveway, Ottawa, ON K1A 0K9, Canada. E-mail: nathalie.corneau@hc-sc.gc.ca
cDepartment of Biochemistry, Microbiology and Immunology, Faculty of Medicine, University of Ottawa, 451 Smyth Road, Ottawa, ON K1H 8M5, Canada
First published on 4th January 2024
Abstract
We describe a microfluidic system for conducting thermal lysis, polymerase chain reaction (PCR) amplification, hybridization, and colorimetric detection of foodborne viral organisms in a sample-to-answer format. The on-chip protocol entails 24 steps which are conducted by a centrifugal platform that allows for actuating liquids pneumatically during rotation and so facilitates automation of the workflow. The microfluidic cartridge is fabricated from transparent thermoplastic polymers and accommodates assay components along with an embedded micropillar array for detection and read-out. A panel of oligonucleotide primers and probes has been developed to perform PCR and hybridization assays that allows for identification of five different viruses, including pathogens such as norovirus and hepatitis A virus (HAV) in a multiplexed format using digoxigenin-labelled amplicons and immunoenzymatic conversion of a chromogenic substrate. Using endpoint detection, we demonstrate that the system can accurately and repetitively (n = 3) discriminate positive and negative signals for HAV at 350 genome copies per μL. As part of the characterization and optimization process, we show that the implementation of multiple (e.g., seven) micropillar arrays in a narrow fluidic pathway can lead to variation (up to 50% or more) in the distribution of colorimetric signal deriving from the assay. Numerical modeling of flow behaviour was used to substantiate these findings. The technology—by virtue of automation—can provide a pathway toward rapid detection of viral pathogens, shortening response time in food safety surveillance, compliance, and enforcement as well as outbreak investigations.
1 Introduction
Foodborne viruses such as noroviruses (NoV) and hepatitis A virus (HAV) are responsible for sporadic and pandemic outbreaks which continue to be a considerable burden for public health agencies in both developing and industrialized countries.1,2 These viruses typically have low infectious doses,3,4 are shed at high numbers by infected individuals,5,6 and remain infectious in food and the environment for weeks.7,8NoV is a single-stranded RNA virus that belongs to the Caliciviridae family.9 Noroviruses are classified into 10 genogroups (GI–GX),10 with GI and GII being the dominant genotypes involved in NoV outbreaks.10–12 Symptoms include vomiting, diarrhea, cramps, and abdominal pain, which manifest between 12 to 48 h after ingestion of contaminated food or contact with infected individuals.12 According to the World Health Organization (WHO), an estimated 685 million NoV infections occur annually worldwide, resulting in about 200![[thin space (1/6-em)]](https://www.rsc.org/images/entities/char_2009.gif) 000 fatalities.13 Due to the lack of a routine and robust cell culture system for NoV, culturable viruses such as murine norovirus (MNV) and feline calicivirus (FCV), which also belong to the Caliciviridae family, have been used as surrogates to examine NoV survival and inactivation in food and the environment.14 HAV15 is a single-stranded RNA virus of the Picornaviridae family that causes hepatitis—liver inflammation with symptoms such as fever, fatigue, nausea, and abdominal pain appearing within 2 weeks and up to 6 months after infection. Despite the availability of an effective vaccine, massive outbreaks and sporadic cases of hepatitis continue to be reported.16 The WHO estimated 159 million infections caused by HAV globally in 2019, resulting in 39000 deaths.17 Most infections occurred in low- and middle-income countries with inadequate hygiene conditions.17
000 fatalities.13 Due to the lack of a routine and robust cell culture system for NoV, culturable viruses such as murine norovirus (MNV) and feline calicivirus (FCV), which also belong to the Caliciviridae family, have been used as surrogates to examine NoV survival and inactivation in food and the environment.14 HAV15 is a single-stranded RNA virus of the Picornaviridae family that causes hepatitis—liver inflammation with symptoms such as fever, fatigue, nausea, and abdominal pain appearing within 2 weeks and up to 6 months after infection. Despite the availability of an effective vaccine, massive outbreaks and sporadic cases of hepatitis continue to be reported.16 The WHO estimated 159 million infections caused by HAV globally in 2019, resulting in 39000 deaths.17 Most infections occurred in low- and middle-income countries with inadequate hygiene conditions.17
Early and efficient detection of foodborne viruses allows for timely intervention to mitigate and control further viral transmission, thereby protecting individuals and communities from potential outbreaks and sporadic illnesses. Identifying foodborne viruses at an early stage enables public health officials to implement adequate countermeasures, which include recalls of contaminated food products, issuing public health alerts and advisories, investigating the source of the virus, and enforcing sanitation and hygiene practices to prevent further spread. The standard method for detecting viral pathogens is reverse transcription polymerase chain reaction (RT-PCR) in conjunction with molecular assays that allow for sensitive, quantitative confirmation in real-time.18 Challenges associated with RT-PCR include i) elaborate sample preparation processes for producing nucleic acid extracts free of inhibitors that could affect downstream detection, and ii) the limited ability to perform analysis in a multiplexed format, often requiring considerable optimization.
Microfluidics offers a compelling alternative to conventional laboratory techniques by enabling the integration of sample preparation and analytical processes into a compact, chip-based format.19–23 The level of control provided over fluid manipulation steps facilitates the development of miniaturized, sample-to-answer platforms that offer improved sensitivity, while reducing sample and reagent consumption as well as hands-on engagement and associated risk of errors or contamination. Furthermore, microfluidic integration promotes portability and automation, which are prerequisites for both routine monitoring and field deployment. Advances in microfluidic technology have made viral pathogen detection a prospective application in medical diagnostics,24 food safety inspections,25 and environmental monitoring.26 Sample-to-answer workflows have been attempted using several fluid actuation schemes, ranging from paper26,27 and capillary-based devices28 to electrowetting-on-dielectric,29 gravity-driven30 and pressure-mediated flow,31 as well as centrifugal systems.32,33 Among these, centrifugal platforms stand out due to the relative simplicity and ease at which microfluidic operations such as liquid transfer, mixing and metering can be implemented, scaled and standardized using a convenient disk or cartridge format.22,34–36 The angular speed of the rotor can be programmed such that liquids are manipulated according to the requirements of a particular assay. The centrifugal force field also provides several unique opportunities since it i) pushes all reagents and buffers to precise locations within the fluidic circuit, ii) reduces dead volumes to negligible levels, and iii) eliminates unwanted air bubbles from the system. Moreover, it facilitates sedimentation of cellular debris from lysates. A number of studies exist where centrifugal approaches have been pursued to develop automated systems for bacterial testing in food safety applications.37–42 However, despite the numerous advantages of the technology exemplified by these studies, centrifugal systems have not yet made a breakthrough in the detection of foodborne viruses.
Herein, we present a fully automated sample-to-answer system for colorimetric detection of viral pathogens implemented on a microfluidic cartridge that is operated using a previously developed platform35 combining centrifugation and pneumatic actuation. The cartridge contains buffers and reagents for viral lysis, PCR amplification, hybridization, and development. The diagnostic workflow (Fig. 1a) uses a multiplex PCR assay—described here for the first time—to amplify RNA marker genes for five viral pathogens (e.g., FCV, HAV, MNV, NoV GI, and NoV GII) conjugated with a detectable digoxigenin (DIG) label. Hybridization is performed on an embedded micropillar array using target-specific oligonucleotide capture probes, and is revealed through an immunoenzymatic process involving horseradish peroxidase (HRP)-conjugated anti-DIG antibody (Ab) and conversion of 3,3′,5,5′-tetramethylbenzidine (TMB). The centrifugal platform (Fig. S1†) is equipped with i) a programmable pumping and pressure control system to mediate fluid displacements on the cartridge, ii) thermoelectric modules integrated into the rotating stage for programmable, on-chip heating and cooling, and iii) a stroboscopic imaging system for real-time visualization and recording of the on-chip procedure.33,35,42,43 The integrated process is conducted through a timed sequence of centrifugation and pneumatic actuation steps which empowers assay automation.
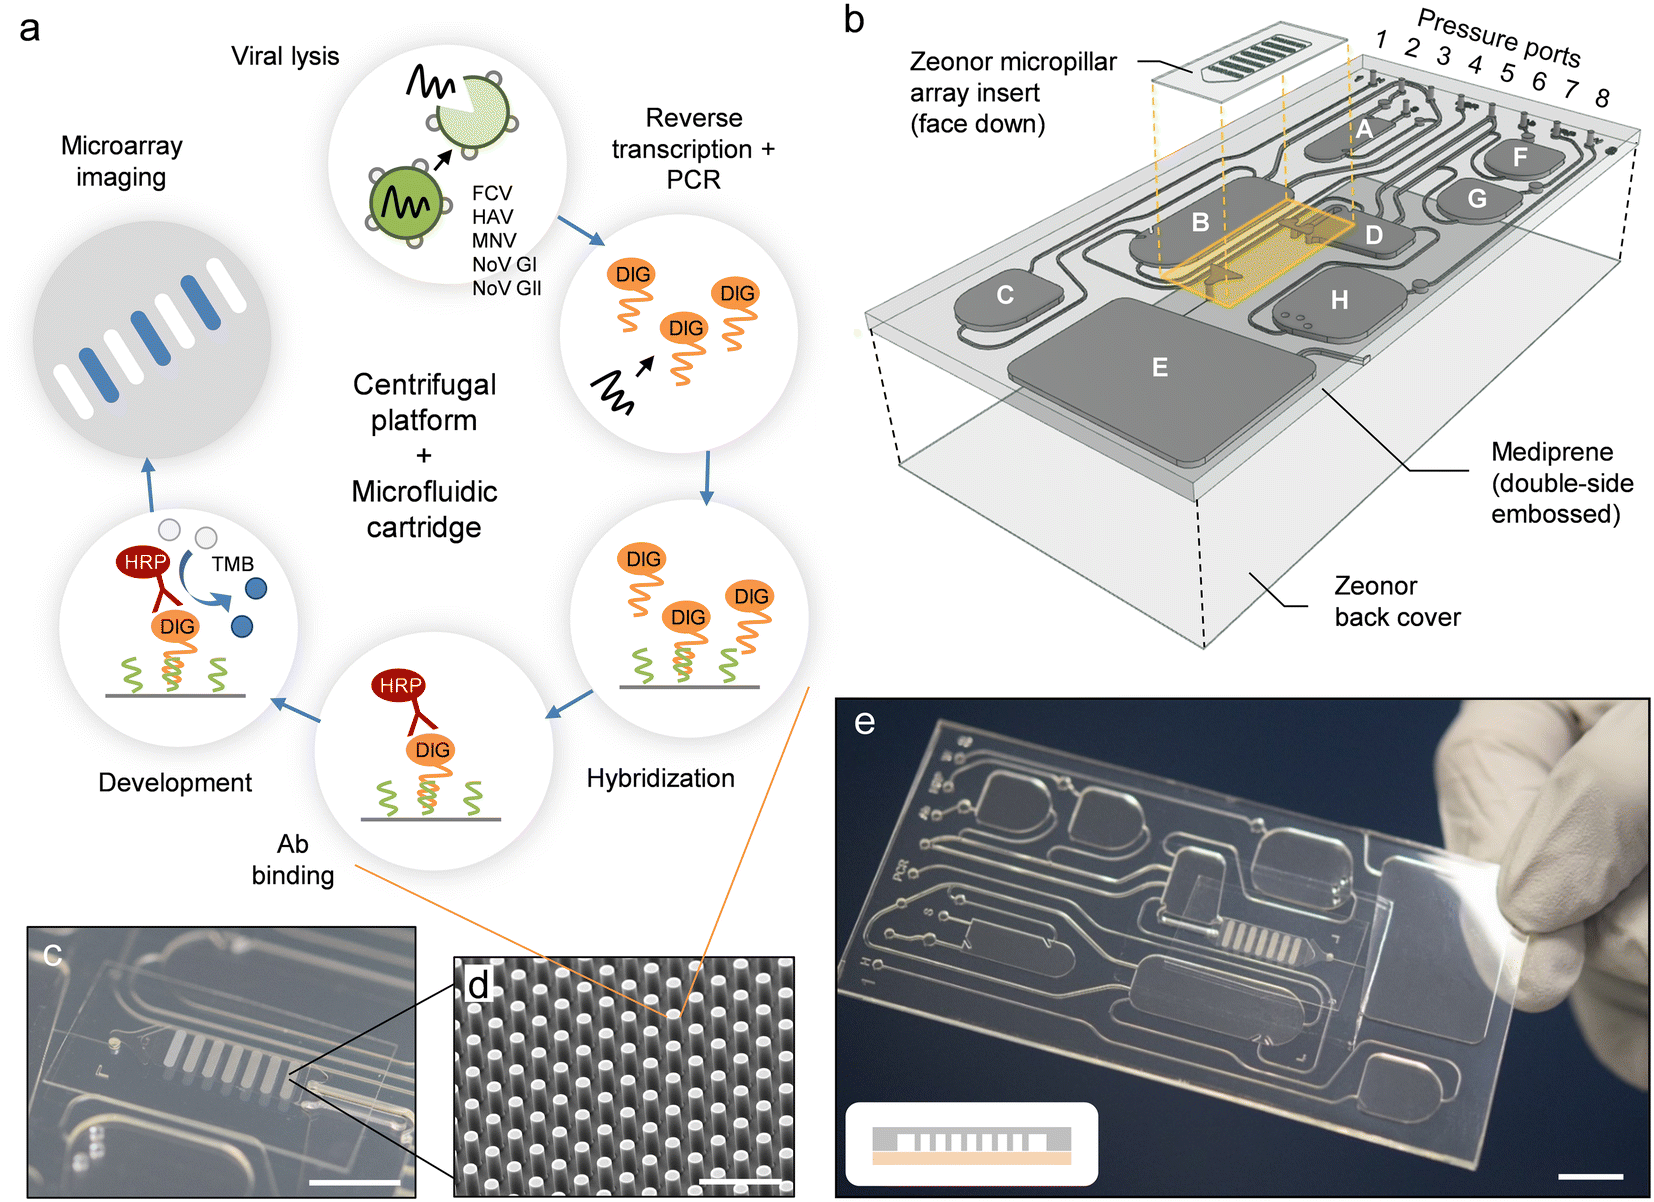 | ||
| Fig. 1 Implementation of the automated sample-to-answer detection process. (a) The analytical workflow uses purified viral stock as a sample input. Lysis, PCR amplification, hybridization, and colorimetric detection (along with intermediate wash steps) are performed on-chip in a fully automated fashion. (b) Configuration of the microfluidic cartridge (expanded view). Reservoirs are assigned as detailed in Table S1.† The cartridge measures 50 mm in width, 100 mm in length and 2 mm in thickness. A polymer micropillar array substrate is used as a template for hybridization and colorimetric detection. The template (comprising oligonucleotide capture probes) is placed on top of the cartridge in the form of an insert. Dedicated inlet and outlet ports are fitted with through-holes and connect the micropillar array insert to transfer reservoir D and waste reservoir E. The PC top layer has been omitted for clarity. (c) Photograph of a micropillar array embedded on the cartridge. Scale bar: 1 cm. (d) SEM image of micropillars produced in Zeonor. Scale bar: 100 μm. (e) Photograph of an assembled cartridge (reservoirs not filled). Scale bar: 1 cm. The scheme in the inset depicts a cross-sectional view of the micropillar array implementation (not drawn to scale). Zeonor micropillar array template (gray); TPE layer (light red). | ||
2 Experimental section
2.1 Cartridge fabrication
Microfluidic cartridges were fabricated following previously established procedures.42 Double-sided embossing of Mediprene OF 400M (Hexpol TPE, Åmål, Sweden) was performed in the presence of a thin (125 μm) polycarbonate (PC) film (AGC, Tokyo, Japan) with a rectangular cut-out section to implement the micropillar array insert during assembly. Micropillar arrays were produced in Zeonor ZF14-188 (Zeon Specialty Materials, San Jose, CA) as described elsewhere.44,452.2 Surface modification and spotting
Surface modification and spotting of micropillar array substrates was done using published procedures.44 Oligonucleotide probes (Table 1) were purchased from Integrated DNA Technologies (Coralville, IA) and dissolved in deionized (DI) water to obtain concentrations of 200 or 100 μM.| Virus | Probe name | Probe sequence (5′ → 3′) | Length (bp) |
|---|---|---|---|
| a Amino-modified at the 5′ position (in conjunction with an internal hexa-ethylene glycol spacer) to mediate covalent attachment to an activated Zeonor surface. | |||
| NoV GI | NoV GI | TTC TTC GAC AGC AGT CGC GAC TGC TGG ACA AGT TAA TCC TAT TGA TCC CT | 50 |
| NoV GII | COG2-v2 | AGC ACG TGG GAG GGC GAT CGC AAT CTK GCT CCC | 33 |
| HAV | HAV1 | GAA TGT GGT CTC CAA AAC GCT TTT TAG AAA GAG TCC CAT TTA TCA TCA CA | 50 |
| FCV | FCV2 | TGG ATC ATC ACA TTA ACC GCA ATA ATG GAG CTA TAC AAC ATC ACC GAA TG | 50 |
| MNV | MNV | AGA TCC ATC TAC GGT TTT CAG GAC ACC ATC CCT GAA TAC AAC GAT GGG CT | 50 |
| (IPC) | IPC | CGC GAG ATA CAC TGC CAG AAA TCC GCG TGA TTA CGA GTC GTG GTA AAT TTA ATC TGG CTG TGG TC | 65 |
2.3 Preparation of viral samples
Viral stocks of HAV (strain HM-175; ATCC, Manassas, VA), FCV (ATCC), and MNV were prepared according to previously published procedures.82.4 Multiplex PCR assay and gel electrophoresis
For multiplex PCR assay development and optimization, viral RNA from HAV, FCV, and MNV stock was extracted using a QIAamp Viral RNA Mini Kit (QIAGEN, Hilden, Germany) according to the instructions provided by the manufacturer. Due to the difficulty related to collecting NoV positive samples, synthetic RNA of genogroups GI and GII obtained from ATCC comprising ORF1 (encoding RNA-dependent RNA polymerase) and ORF2 fragments (encoding viral capsid protein) was also used for assay development and validation. Primer sequences for NoV GI, NoV GII and HAV were adapted from published works.46–48 Primers for FCV and MNV were designed in-house at Health Canada (Ottawa, ON). A synthetic DNA template serving as an internal positive control (IPC)49 was incorporated into the assay with its corresponding primer set to confirm successful PCR amplification. Oligonucleotide primers (Table 2) used in the multiplex PCR assay were synthesized by Integrated DNA Technologies. For simplicity, a 10× concentrated primer mix was prepared containing all six primer sets. Master mix for the multiplex RT-PCR reaction consisted of 10 μL OneStep RT-PCR buffer (QIAGEN), 2 μL OneStep RT-PCR Enzyme Mix (QIAGEN), 2 μL of 10 mM dNTP mix (QIAGEN), 5 μL of 10× primer mix, 0.5 μL of 1 mM DIG-11-dUTP (Roche, Basel, Switzerland), and 1.25 μL of 20 mg mL−1 bovine serum albumin (MilliporeSigma, Darmstadt, Germany). Viral RNA samples were added as 1 μL aliquots each. The mixture was combined with RT-PCR Grade Water (Invitrogen, Waltham, MA) to reach a final reaction volume of 50 μL. Off-chip RT-PCR was performed in 0.2 mL tubes (Eppendorf, Hamburg, Germany) using a Nexus GSX1 thermocycler (Eppendorf). The thermal cycling profile was as follows: reverse transcription at 50 °C for 30 min; initial denaturation at 95 °C for 15 min; 45 cycles of denaturation at 95 °C for 30 s, annealing at 50 °C for 30 s, and extension at 72 °C for 1 min; and final extension at 72 °C for 10 min. Conditions for on-chip amplification (Table 3) were kept identical, except that cycle durations were prolonged to ensure equilibration of temperature inside the cartridge. PCR products were visualized by gel electrophoresis in 4% agarose stained with SYBR Safe DNA Gel Stain (Invitrogen).| Virus | Primer name | Forward (F) and reverse (R) primer sequences (5′ → 3′) | Final concentration (μM) | Amplicon size (bp) | Reference |
|---|---|---|---|---|---|
| NoV GI | G1SK | F: CTG CCC GAA TTY GTA AAT GA | 0.5 | 330 | Kojima et al.46 |
| R: CCA ACC CAR CCA TTR TAC A | |||||
| NoV GII | COG2 | F: CAR GAR BCN ATG TTY AGR TGG ATG AG | 0.5 | 98 | Trujillo et al.47 |
| R: TCG ACG CCA TCT TCA TTC ACA | |||||
| HAV | SH-Poly | F: GAR TTT ACT CAG TGT TCA ATG AAT GT | 0.4 | 107 | Guévremont et al.48 |
| R: GGC ATA GCT GCA GGA AAA TT | |||||
| FCV | FCVT | F: GGG CTT GTA AAA CCC CTG AA | 0.3 | 204 | This work |
| R: GAA CAG CGC CTT AAC ACA AC | |||||
| MNV | MNV-CO | F: CCG AGA CCA CCA AGA CTG GAG | 0.1 | 367 | This work |
| R: GAC GCG AAC CAG GAG ACA AAC TC | |||||
| (IPC) | IPC | F: CGC GAG ATA CAC TGC CAG AA | 0.3 | 65 | Kavlick49 |
| R: GAC CAC AGC CAG ATT AAA TTT ACC A |
| Step | Operation | Run time (min:s) | Active ports | Applied pressurea (psi) | Number of pressure pulses|duration (s) | T (°C) | Rotation speed (rpm) |
|---|---|---|---|---|---|---|---|
| a Relative to atmospheric pressure. b Run time composed of 15 min initial denaturation, 225 min thermal cycling (90 s annealing, 120 s elongation, and 90 s denaturation; 45 times each), 1 min final annealing, and 10 min final extension. | |||||||
| 1 | Initiation | 0:30 | — | — | — | — | 800 |
| 2 | Thermal lysis | 15:00 | — | — | — | 95 | 800 |
| 3 | Cooling | 3:00 | — | — | — | — | 800 |
| 4 | Transfer of lysate to PCR chamber | 0:02 | 2 | 3.0 | 1|1 | — | 800 |
| 5 | Mixing of solutions in PCR chamber | 0:02 | 4 | 3.5 | 2|0.2 | — | 800 |
| 6 | RT reaction | 30:00 | — | — | — | 50 | 800 |
| 7 | PCR thermal cycling | 251:00b | — | — | — | 95, 50, 72 | 800 |
| 8 | Final denaturation | 5:00 | — | — | — | 95 | 800 |
| 9 | Rapid cooling | 1:00 | — | — | — | 5 | 800 |
| 10 | Transfer of HS to PCR chamber | 0:10 | 1 | 4.0 | 1|1 | — | 500 |
| 11 | Mixing of solutions in PCR chamber | 0:02 | 4 | 3.5 | 2|0.2 | — | 800 |
| 12 | Transfer of amplicon solution to micropillar array | 0:10 | 1, 2, 3 | 3.8 | 1|7 | 45 | 700 |
| 13 | Hybridization | 10:00 | — | — | — | 45 | 350 |
| 14 | Drying of micropillar array | 1:00 | — | — | — | 45 | 800 |
| 15 | Wash 1 | 2:00 | 8 | 2.6 | 1|0.2 | — | 800 |
| 16 | Wash 2 | 2:00 | 8 | 2.8 | 1|0.3 | — | 800 |
| 17 | Transfer of Ab solution to micropillar array | 0:10 | 6 | 3.0 | 1|0.2 | — | 800 |
| 18 | Incubation with Ab | 10:00 | — | — | — | — | 350 |
| 19 | Drying of micropillar array | 1:00 | — | — | — | — | 800 |
| 20 | Wash 3 | 2:00 | 8 | 3.0 | 1|0.4 | — | 800 |
| 21 | Wash 4 | 2:00 | 8 | 3.5 | 1|0.5 | — | 800 |
| 22 | Transfer of TMB to micropillar array | 0:10 | 7 | 3.0 | 1|0.2 | — | 500 |
| 23 | Incubation with TMB | 10:00 | — | — | — | — | 450 |
| 24 | Drying of micropillar array | 1:00 | — | — | — | — | 800 |
2.5 Off-chip colorimetric testing
Optimization of colorimetric detection was initially performed off-chip by incubating PCR products with the micropillar array substrate. Following RT-PCR, the amplicons (50 μL) were denatured in a tube by heating at 100 °C for 10 min, snap-chilled on ice, and mixed with 250 μL ice-cold 1× hybridization solution (HS) containing 50% (v/v) formamide.50 The mixture was pipetted onto the micropillar substrate and incubated at 45 °C for 20–30 min. The substrate was rinsed with PBST (0.01 M phosphate-buffered saline, pH 7.2, containing 0.05% (v/v) Tween 20; Sigma Aldrich, Oakville, ON), dried with a stream of nitrogen gas, and incubated with anti-DIG Fab fragments–peroxidase conjugate (sheep anti-DIG-conjugated with HRP; Roche Diagnostics) for 20 min at room temperature. The Ab conjugate was prepared at 1:500 (v/v) in PBST-B (PBST containing 0.5% (w/v) protein blocking reagent; Bio-Rad, Mississauga, ON). After washing with PBST and drying, the template was saturated with TMB membrane peroxidase substrate (Kirkegaard and Perry Laboratories, Gaithersburg, MD) and incubated at room temperature for up to 30 min.
2.6 On-chip sample-to-answer assay
A full sample-to-answer demonstration was conducted by filling the respective reservoirs on the cartridge (Fig. 1b and Table S1†) with 30 μL of RT-PCR master mix, 50 μL 2× HS50 containing 4 M urea (Sigma-Aldrich) instead of formamide, 50 μL of anti-DIG Fab fragments–peroxidase conjugate diluted 1:1000 (v/v) in PBST-B, 50 μL of TMB membrane peroxidase substrate (SeraCare, Milford, MA), and 130 μL of PBST. Solutions were inserted through the pressure ports associated with each reservoir using manual pipetting. Finally, 30 μL of HAV sample spiked with IPC DNA was added to the lysis chamber through a dedicated filling port, which was subsequently sealed with transparent tape. The input sample was prepared at concentrations such that the 20 μL of lysate transferred to the PCR chamber contained ∼7000 genome copies of HAV and 2000 copies of IPC DNA sequence. The cartridge was connected to the pneumatic interface and secured on the rotating stage. PC99 Thermal Pad (t-Global Technology, Lutterworth, UK) was used as a thermal interface for efficient heat transfer from the thermoelectric elements to the cartridge during lysis and PCR amplification steps. The platform is operated through a LabVIEW interface (National Instruments, Austin, TX) and can execute the microfluidic protocol (Table 3) in a fully automated fashion.
2.7 Imaging
Scanning electron microscopy (SEM) images of micropillar arrays were recorded using a Tabletop Microscope TM3030Plus (Hitachi High-Technologies, Mississauga, ON) operated at a voltage of 15 kV. Substrates were coated with a thin (e.g., ∼12 nm) layer of Pt using an EM ACE600 sputter coater (Leica Microsystems, Wetzlar, Germany) to prevent charging of the fine polymer structures. Fluorescence imaging of particle stream lines was performed using an Eclipse Ti-E inverted microscope from Nikon Instruments (Melville, NY) connected to an iXon Ultra CCD camera (Andor Technology, Belfast, UK). An X-Cite 120 LED illumination system (Excelitas Technologies, Waltham, MA) was used for excitation. Flow of a diluted aqueous suspension containing ∼0.2% (w/v) of Fluoresbrite YO carboxylate microspheres (1.75 μm in diameter; Polysciences, Warrington, PA) was mediated using a syringe pump from KD Scientific (Holliston, MA). Dynabeads M-270 (Thermo Fisher Scientific, Waltham, MA) were counted using a Countess 3 Automated Cell Counter (Thermo Fisher Scientific). Aliquots of 10 μL were inserted into a Countess chamber slide. Image analysis was performed using ImageJ software (National Institutes of Health, Bethesda, MD).2.8 Numerical simulations
Finite element numerical simulations were conducted using Multiphysics software (Version 3.4; COMSOL, Burlington, MA) operated using a Hewlett-Packard Z820 workstation (see ESI† for details).3 Results and discussion
3.1 Microfluidic cartridge
The microfluidic cartridge (Fig. 1b–e and 2a) is fabricated from transparent, thermoplastic polymers in the form of a hybrid, three-layer stack with rectangular geometry, as described in previous work.42 Top and bottom parts consist of hard thermoplastic polymers (i.e., PC and Zeonor, respectively) to provide mechanical stability, while the center part incorporating the fluidic circuitry is made of a thermoplastic elastomer (TPE) (i.e., Mediprene). The possibility of using thermoforming techniques such as hot embossing or injection molding makes TPE suitable for prototyping and large-scale manufacturing of microfluidic devices.42,51–54 Another advantage of TPE is its ability to conform and provide intimate contact with another surface, allowing for effective sealing of the microfluidic conduit. The contact force between the hard and the soft thermoplastic polymer—consolidated over the course of several hours—enables safe, leak-proof manipulation of fluids using pressure-driven flow.42,54The microfluidic circuit adopts a configuration that is suitable for conducting the analytical protocol in a reliable, fully-automated fashion.42 One of the advantages of using a pressure-mediated actuation scheme on a rotating platform is the possibility of inducing bidirectional flow by pumping liquid against the centrifugal force field.35 In conventional centrifugal systems where unidirectional flow (away from the center of rotation) prevails, it is often necessary to locate storage compartments close to the center of rotation. The pressure-mediated actuation scheme of the platform used here provides the freedom to accommodate reservoirs at any location on the cartridge. Reservoirs A–C and F–H are all equipped with exit channels designed to confine liquid until needed. Pressure ports (connected to the manifold lid) are used to push liquid toward the exit channel. Downstream transfer occurs once the applied pneumatic pressure is high enough to displace the fluid front in the downstream channel or reservoir. Channels for moving fluid in and out of reservoirs are relatively large (e.g., 300 and 500 μm) to ensure that liquid is transferred promptly and efficiently. A narrow channel (e.g., 50 μm) connects the micropillar array and the waste reservoir E, resulting in higher resistance to flow, which makes it possible to fill transfer reservoir D completely and control the incubation time for the micropillar array. Chambers for performing sample lysis (A) and PCR (B) are both aligned with thermoelectric heating elements on the platform to allow for adjusting and maintaining the temperature within these reservoirs.42
An embedded polymer micropillar array template (Fig. 1c and d) is used for hybridization and detection. We have previously shown that such arrays can enhance colorimetric signal compared to planar (non-structured) substrates, while also facilitating confinement of probe molecules through wicking.44 The micropillar array is placed on top of the cartridge, with the structured side facing the TPE layer. The template features seven arrays in the form of elongated bars with identical configuration: micropillars within each array have a diameter d = 18 μm, and are arranged in the form of a diagonal square lattice with a translation vector a = 40 μm. Once placed on the cartridge, the micropillar array provides a flow-through chamber for which the depth is determined by the pillar height h (i.e., h = 37 μm for experiments conducted here). Bars are oriented perpendicular to the direction of flow to maximize interaction between pillars and the liquid phase. The proximity of the thermoelectric heater underneath the micropillar array allows for adjusting the temperature (i.e., to 45 °C) during hybridization.
3.2 Microfluidic operations
Table 3 details the different steps of the integrated protocol along with the parameters used to operate the platform. Images of the cartridge (Fig. 2b and c) further illustrate the displacement of fluid during the assay. Once the platform starts rotating (step 1), liquids are pushed to the bottom of their respective reservoirs by the centrifugal force. To perform thermal lysis, the thermoelectric heater is activated to incubate the viral sample at 95 °C in reservoir A (step 2). Rotation of the platform helps evacuate air bubbles emerging from the liquid and bring down condensation from the upper portions of the chamber. Once completed, the heater is turned off and the lysate is allowed to cool to room temperature (step 3) before a metered aliquot of 20 μL is transferred to the PCR chamber (B) containing master mix (step 4). The exit channel on reservoir A is so positioned that the metered aliquot is cleaned from particles sedimenting at the bottom of the lysis chamber (Fig. S2 and associated text in the ESI†), making the process compatible with bead-based extraction methods for viral pathogens.55,56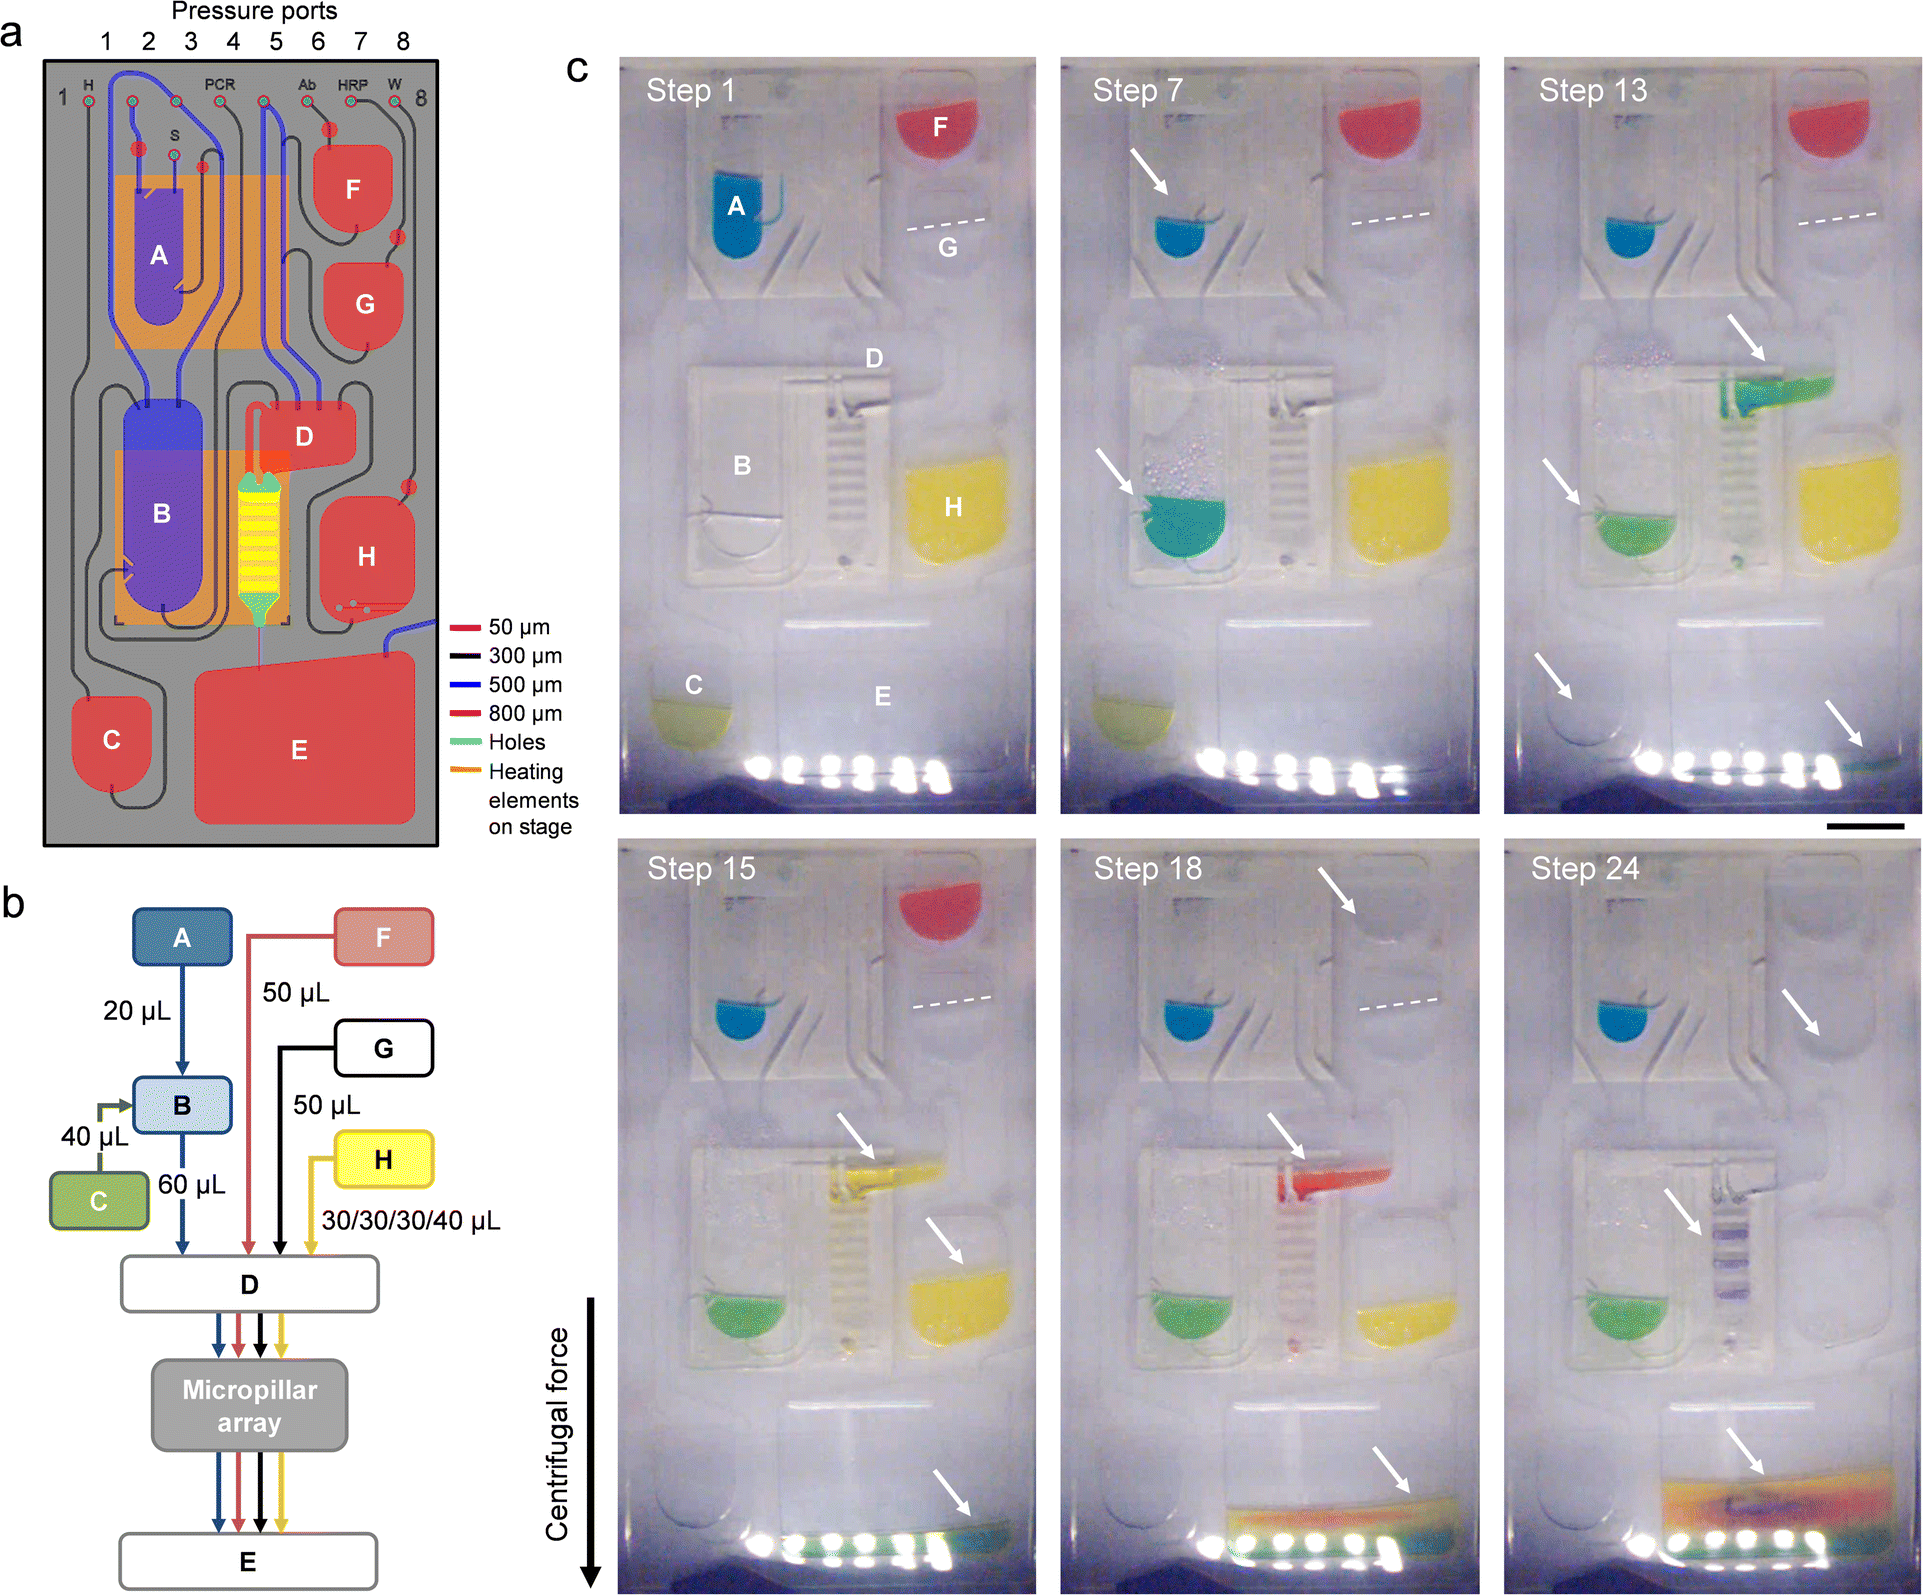 | ||
| Fig. 2 Operation and functioning of the microfluidic cartridge. (a) Design of the microfluidic circuit. Color coding is used to represent the depth of reservoirs and channels as specified in the legend. Posts have been implemented in reservoirs A, B, and H to guide liquid away from the respective exit channels during filling. Lysis and PCR chambers (A and B) as well as the micropillar array are aligned with heating elements on the rotating stage below. (b) Simplified flow chart detailing the relocation of assay components on the cartridge. Sample (blue); HS (green); wash buffer (yellow); Ab conjugate (red); and TMB (black). (c) Stroboscopic images of the cartridge at selected stages of the process. (Step 1) Initial rotation. (Step 7) Thermal cycling in the PCR chamber (B). Condensation of liquid is visible within the upper part of the reservoir. (Step 13) Hybridization. Solution is collected in waste reservoir E once it passed through the micropillar array. (Step 15) The micropillar array is rinsed with wash buffer. (Step 18) Ab conjugate is flowing across the micropillar array. (Step 24) The micropillar array is dried following incubation with TMB. Arrows are used as visual guides for fluid displacements. Operational parameters are detailed in Table 3. Food color dye has been added to several solutions to enhance contrast. Scale bar: 1 cm. | ||
Lysate and PCR reagents are mixed (step 5) by generating a stream of air bubbles rising from the bottom of reservoir B. Bubble-induced convection has been shown as an effective means for agitating solutions in centrifugal microfluidics.35,43 The equilibrated mixture is then subjected to thermal cycling (steps 6–9). Cartridge design and thermal interface are both optimized to ensure efficient heat transfer for PCR thermal cycling. A detailed description of theoretical and practical implications related to temperature management on the centrifugal platform is provided elsewhere.42 Upon adding HS and mixing (steps 10 and 11), the combined solution is transferred to reservoir D (step 12) from where it flows across the micropillar array (step 13). The platform is rotated at moderate speed (i.e., 350 rpm) to maintain hybridization for ∼10 min. Once passed, amplicon solution is collected in waste reservoir E. The micropillar array is then dried (step 14) and rinsed twice with wash buffer engaged from reservoir H (steps 15 and 16) to remove amplicons non-specifically adsorbed on the surface. Note that the platform is able to transfer wash buffer in several aliquots by pressurizing reservoir H for a short duration. Ab conjugate is then transferred from reservoir F and incubated with the micropillar array for 10 min (steps 17 and 18). Following drying and washing of the micropillar array (steps 19–21), TMB is engaged from reservoir G (step 22). Once the assay is developed (step 23), a final drying step is applied (step 24). Blue-colored bands indicate successful hybridization between probes and their complementary DIG-labeled amplicons, revealing the presence of viral targets.
3.3 Assay validation
Several combinations of primers were tested at various concentrations to design a multiplex PCR assay that simultaneously detects all five target viruses with negligible off-target effects as well as the ability to distinguish between amplified products based on their size. Assay development and optimization further included the selection of an RT-PCR amplification kit, the addition of an RNase inhibitor, and the thermal profile of the PCR cycles (data not shown). Amplification of IPC was efficient regardless of other nucleic acid templates present within the reaction. When viral RNA from all five target viruses and IPC DNA are amplified simultaneously, the optimized multiplex RT-PCR reaction produces six distinct amplicon bands, with band positions corresponding to the expected amplicon sizes (Fig. S3†). The intensities of bands for PCR products deriving from on-chip amplification and benchtop instrumentation are comparable for most single-plex and multiplex assays, indicating that efficient on-chip amplification can be achieved, with slightly adjusted cycle times compared to the benchtop method. In the absence of target RNA, only the IPC sequence is amplified.We identify amplicons on micropillar array substrates using a panel of oligonucleotide probes (Table 1) that allow for detection of five viral pathogens in a multiplex format. The result of the colorimetric assay is a qualitative “yes/no” answer where blue bands count as positives and non-colored ones as negatives. Off-chip detection of amplicons (Fig. 3) is demonstrated both individually (single target) and in combination (i.e., 1–5 targets + IPC). Cross-reactivity occurring in the presence of sequence similarities can lead to false positive signals in multiplex hybridization assays. Hybridization with single-plex amplicons is conducted to test for the specificity of each probe/target system. With the probe design being optimized for promoting specificity, we did not observe cross-reactivity between probes and non-target amplicons. Hybridizations with multiplex amplicons yield the anticipated patterns of reactivity for all combinations tested here. The results obtained by both single-plex and multiplex hybridizations are consistent with the bands produced by gel electrophoresis (Fig. S4†). The intensity of colorimetric signal can vary slightly for some probe/target systems—a finding that is not surprising insofar as surface-bound hybridizations are known to exhibit complex dependencies on multiple parameters, including the probe grafting density,57 the formation of secondary structures between strands,58 as well as amplicon charge and concentration in solution.59 Furthermore, kinetic effects along with re-association of complementary strands can destabilize the probe/target duplex when amplicons with relatively long overhanging ends are used.60,61
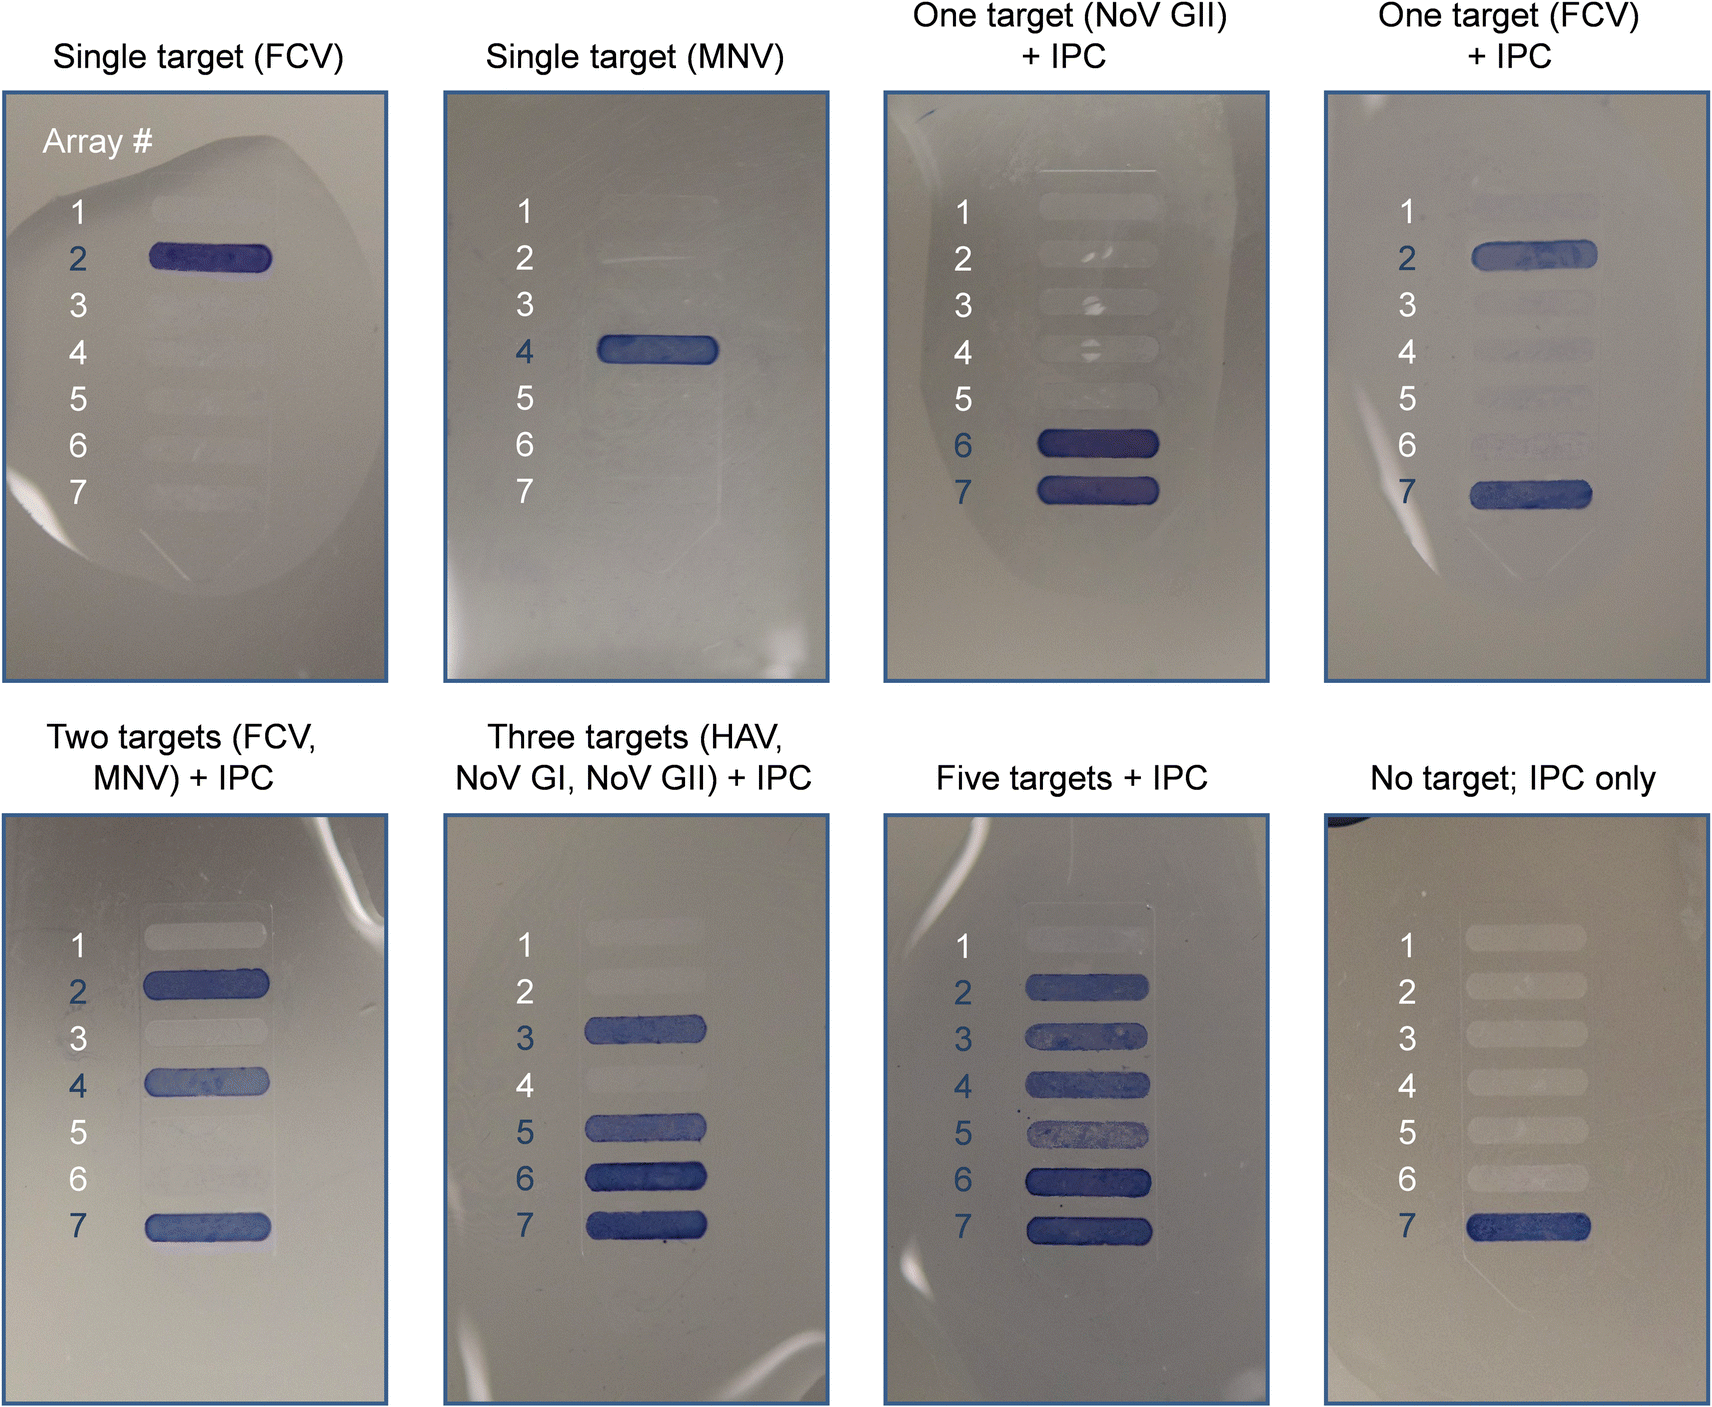 | ||
| Fig. 3 Photographs of representative Zeonor micropillar array substrates used in colorimetric virus detection assays performed off-chip by passive incubation. The configuration of the micropillar array is as follows: (#1) empty; (#2) FCV2; (#3) HAV1; (#4) MNV; (#5) NoV GI; (#6) COG2-v2; and (#7) IPC. Amplicons were produced in tubes using benchtop PCR. | ||
We performed a full sample-to-answer demonstration by executing the protocol in Table 3 using HAV viral stock and spiked-in IPC DNA. As a result of the analytical process, two blue-colored bands are visible on the micropillar array insert (Fig. 4a), confirming the presence of HAV and IPC in the original sample. Endpoint detection based on image analysis allows for discriminating signal intensities for both positive and negative bands (Fig. 4b). Using the stroboscopic imaging system on the platform, it is also possible to monitor and record colorimetric response in real-time (Fig. 4c), as demonstrated in prior work.33 The appearance of colorimetric signal related to HAV and IPC can be observed within seconds once the TMB is transferred onto the micropillar array. As color pigments precipitate at the polymer surface, the initially bright color tone of the respective micropillar arrays gradually becomes darker. Accumulation of color pigments at the surface enhances the difference in contrast over time, while signal recorded for negative bands largely remains unchanged. The demonstration confirms that the automated microfluidic system is capable of detecting viral RNA in a reliable fashion using the imaging equipment on the platform for read-out. A notable observation deriving from these sample-to-answer tests is that colorimetric signal has the tendency to be unevenly distributed within positive bands, which we attempt to investigate below.
 | ||
| Fig. 4 Sample-to-answer demonstration. (a) Photograph of the cartridge upon completion of the analytical workflow. The sample was comprised of HAV stock and spiked-in IPC DNA. The configuration of the micropillar array (outlined in white) is as follows: (#1) empty; (#2) FCV2; (#3) HAV1; (#4) MNV; (#5) NoV GI; (#6) COG2-v2; and (#7) IPC. Scale bar: 1 cm. (b) Scatter plot of colorimetric signal (background corrected) for each array. The data was obtained from three independent tests (n = 3). (c) Signal evolution recorded by the stroboscopic imaging system (video acquisition rate: 450 frames per minute). | ||
3.4 Color distribution and flow across the micropillar array
On a macroscopic scale, the color distribution patterns typically observed for assays performed on-chip (Fig. 5a) share two common characteristics. First, leading and trailing arrays display higher signal intensities, on average, than arrays in the middle of the chamber (Fig. 5b). This finding is consistent with the trend for the number of color pigments nCP(i) (Fig. 5c) predicted by numerical simulation (Fig. S5–S7, Table S2 and associated text in the ESI†) for micropillar arrays defined in terms of permeability κ and porosity ε. As a result of the chamber layout, leading and trailing arrays (e.g., #1 and #7) positioned near the inlet and the outlet are exposed to diverging and converging streamlines, respectively (Fig. S6a†). Thus, more liquid is flowing through the upper and lower arrays than through those in the middle (e.g., #2 to #6) where streamlines are propagating in parallel. This finding is confirmed through numerical simulations comparing flow in the presence of micropillar arrays with higher and lower permeability (Fig. S6b and c,† respectively), which both display inherent variation of the velocity field across the chamber (Fig. S7†). The simulation revealed no significant contributions from the centrifugal and Coriolis forces to this effect. It is also apparent from the simulation, that flow rates are up to ∼5 times higher at the periphery than inside the structured area for arrays used here. The difference in velocity between outer and inner regions amounts to a volume partition ratio of 4:6 (considering flow on both sides combined) as determined by integration of the calculated flow profiles. The results of the simulation are consistent with real-time observation of flow using fluorescent microparticles (Fig. 5d and e), where the density of peripheric stream lines is significantly higher than those inside arrays. Extending arrays to the chamber wall provides a plausible solution to prevent liquid from bypassing the structured area. This option has been tested, but was not considered practical (Fig. S8 and associated text in the ESI†).
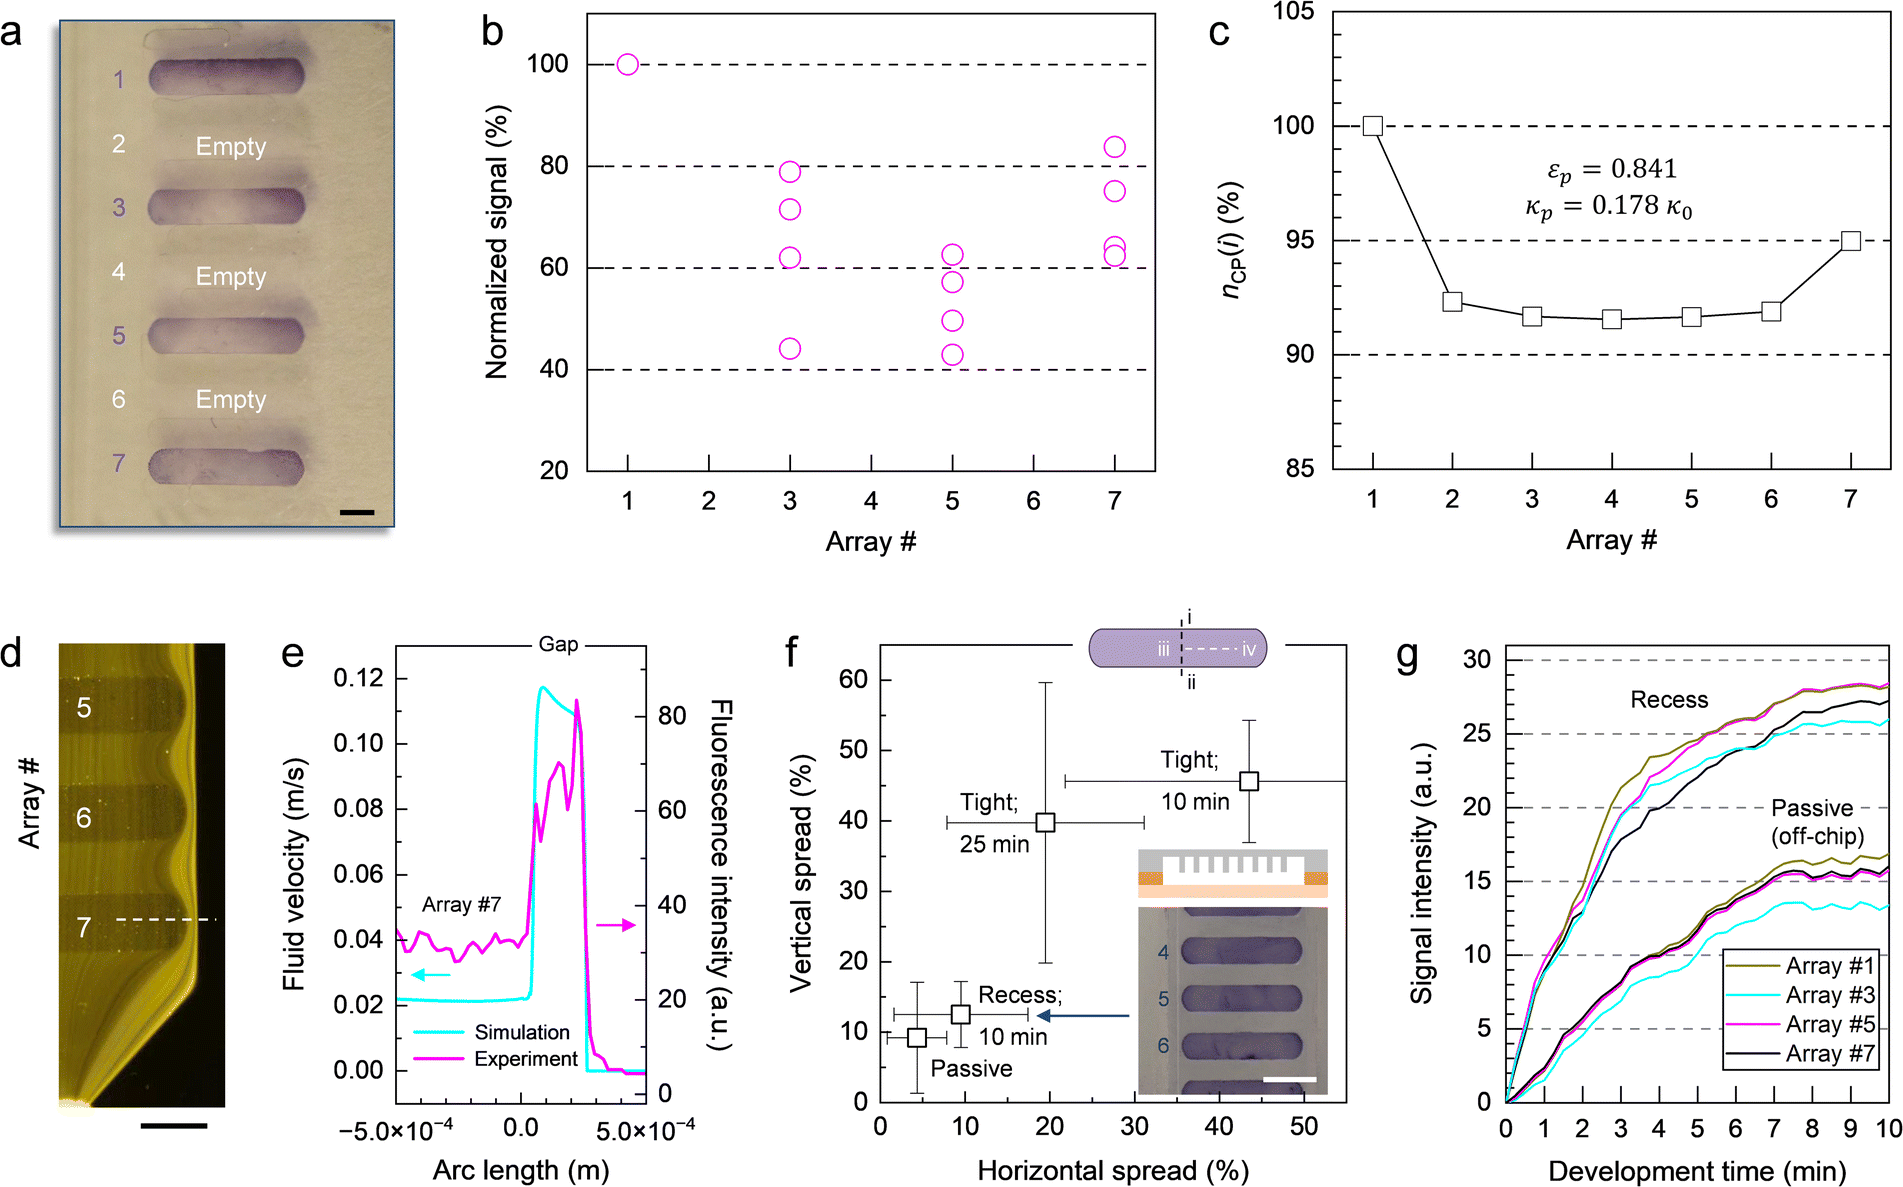 | ||
| Fig. 5 Distribution of colorimetric. (a) Photograph of a micropillar array obtained under conditions of flow. Arrays with odd numbers were spotted with IPC probe; arrays with even numbers were intentionally left empty. The passage of assay components across the micropillar array was timed over a period of 10 min. Scale bar: 1 mm. (b) Plot of colorimetric response as a function of array position. The data was obtained from four independent tests (n = 4). (c) Plot showing the normalized number of color pigments for each micropillar array determined by numerical simulation. (d) Fluorescence micrograph depicting flow within the micropillar array. Stream lines were visualized using internally dyed polymer microspheres. Scale bar: 1 mm. (e) Plot of the simulated velocity vector and the experimentally observed fluorescence intensity profile taken along the white line traced in (d). (f) Plot of color distribution resulting from different process conditions and micropillar array implementations. The passage of amplicon and Ab solutions was timed by adjusting the rotation speed of the platform. The data was established by considering three arrays or more (n ≥ 3) spotted with IPC. Positions (i) and (ii) in the sketch denote the upper and lower edges of the micropillar array; (iii) and (iv) refer to the center and the periphery. Intensities at these locations were used to calculate vertical and horizontal spread. The inset shows the result of a colorimetric assay using a micropillar array with recess configuration (200 μm deep). Arrays were spotted with IPC probe. Scale bar: 2 mm. The scheme depicts a cross-sectional view of the micropillar array on the cartridge (with the raised features around the chamber indicated in orange). (g) Plot of signal evolution for a recess (200 μm) micropillar array implementation in comparison to passive incubation. The data was recorded using the stroboscopic imaging system of the platform (acquisition rate: four images per minute). Arrays were spotted with IPC probe. | ||
A second characteristic of the color distribution pattern is that signal within each array gradually decreases from the upper to the lower edge, and from the outer ends toward the center. We determined color distribution in terms of vertical and horizontal spread (Fig. 5f), accounting for differences between upper (i) and lower edge (ii) as well as center (iii) and periphery (iv) on the left and right-hand side, respectively. The spread resulting from a tight micropillar array implementation (that is, the top of the pillars is in contact with the opposite polymer surface) and a flow-through time of 10 min for amplicon and Ab solutions can be large (e.g., more than 50%) in both directions. Prolonging the incubation time from 10 to 25 min resulted in only marginal improvement. Using the template with a deeper chamber where micropillars are fully submerged in liquid medium (i.e., recess configuration), on the other hand, proved helpful in enhancing signal uniformity. Colorimetric response obtained in this way is comparable to the results derived from passive incubation (off-chip) where signal is ultimately determined by the distribution of probe molecules achieved during spotting rather than by predetermined patterns of flow. For such arrays, spread is typically below 20% in each direction. These observations are confirmed in experiments where signal evolution was recorded in real-time (Fig. 5g). For recess micropillar array configuration, variation in colorimetric response between bands is low (e.g., 8.5%), irrespective of their position, making it the most reliable implementation tested here.
4 Conclusions
Herein, we describe an integrated sample-to-answer system for detection and identification of viral pathogens using a polymer-based microfluidic cartridge and a centrifugal platform with pneumatic actuation. The analytical workflow comprises on-chip thermal lysis of pre-purified viral stock, multiplexed amplification of target-specific RNA gene markers, and hybridization in conjunction with a colorimetric assay to generate visual clues on micropillar arrays that indicate the presence of target viral content in the sample. We demonstrate that the system can accurately distinguish positive from negative samples through hybridization of PCR-amplified marker genes against a panel of target-specific oligonucleotide capture probes implemented on an embedded polymer micropillar array. Obtaining colorimetric signal in a sample-to-answer format also testifies to the fact that sensitive reagents involved in the assay (e.g., peroxidase-labelled Ab and TMB) remain active inside their respective reservoirs and are not adversely affected by exposure to light (i.e., from the stroboscopic imaging system) and elevated temperatures (to which the cartridge is subjected during lysis and PCR thermal cycling). We note that viral load used for demonstration purposes (e.g., 350 genome copies per μL) is of practical relevance for recovery, detection and quantification of HAV (and other viral pathogens) from contaminated food.62 While lower levels of starting material were not tested here, limits of detection could be assessed as future work with this technology. Packaging and shelf life of cartridges, which both constitute key requirements in the transitioning of the technology for further validation and commercial uptake, remain to be investigated. Preliminary observations suggest that micropillar arrays preserve their functionality for several months when stored at ambient conditions. If combined with adequate data processing software, the real-time acquisition capabilities of the stroboscopic imaging system allow for identification of positive and negative signals early in the color development process. The relatively high level of integration shown here minimizes the need for off-chip sample preparation steps and related instrumentation, making the set-up suitable for potential deployment in areas where laboratory-grade infrastructure is unavailable. The fact that the assay is entirely conducted within a microfluidic cartridge further renders the system easy to use, with minimal training required for operation and data analysis.Author contributions
M. G., D. B., N. N., N. C. and T. V. conceptualized the work. N. C. and T. V. acquired funding and supervised the project. C. M.-G., M. M. and L. L. fabricated microfluidic cartridges. N. N., N. A., A. V. C. P. and K. T. developed RT-PCR and hybridization assays. M. G., D. B., N. A. and C. N. performed testing and validation. M. G. and D. B. analyzed the data. L. C. performed numerical simulations. M. G., N. N., L. C. and L. M. wrote the manuscript with input from all authors.Conflicts of interest
There are no conflicts to declare.Acknowledgements
This work was supported by the National Research Council (NRC) and Health Canada. We acknowledge Dr. Herbert W. Virgin (Washington University School of Medicine, St. Louis, MO) for generously providing us with MNV stock. We thank our colleagues Karine Turcotte, Lucas Poncelet, Mojra Janta-Polczynski, Gaétan Veilleux, Keith J. Morton, Jamal Daoud, François Normandin, Aaron Bessoff, and Simon Geissbuehler (all at NRC, Boucherville, QC), Adam Classen, Devon Wagner, Natalie Fava, and Jennifer Harlow (all at Health Canada, Ottawa, ON), and Burton W. Blais (Canadian Food Inspection Agency, Ottawa, ON) for useful discussion and technical assistance. We are grateful to Robert DiRaddo (NRC, Boucherville, QC) for his continuous support.References
- R. M. Callejón, M. I. Rodríguez-Naranjo, C. Ubeda, R. Hornedo-Ortega, M. C. Garcia-Parrilla and A. M. Troncoso, Foodborne Pathog. Dis., 2015, 12, 32–38 CrossRef
.
- B. A. Lopman, D. Steele, C. D. Kirkwood and U. D. Parashar, PLoS Med., 2016, 13, e1001999 CrossRef
- R. H. Purcell, D. C. Wong and M. Shapiro, J. Infect. Dis., 2002, 185, 1668–1671 CrossRef PubMed
- P. F. Teunis, C. L. Moe, P. Liu, S. E. Miller, L. Lindesmith, R. S. Baric, J. Le Pendu and R. L. Calderon, J. Med. Virol., 2008, 80, 1468–1476 CrossRef
- G. M. Tjon, R. A. Coutinho, A. van den Hoek, S. Esman, C. J. Wijkmans, C. J. Hoebe, B. Wolters, C. Swaan, R. B. Geskus, N. Dukers and S. M. Bruisten, J. Med. Virol., 2006, 78, 1398–1405 CrossRef CAS PubMed
- P. F. Teunis, F. H. Sukhrie, H. Vennema, J. Bogerman, M. F. Beersma and M. P. Koopmans, Epidemiol. Infect., 2015, 143, 1710–1717 CrossRef CAS
- A. Rzezutka and N. Cook, FEMS Microbiol. Rev., 2004, 28, 441–453 CrossRef CAS PubMed
- N. Nasheri, J. Harlow, A. Chen, N. Corneau and S. Bidawid, Food Environ. Virol., 2021, 13, 107–116 CrossRef CAS PubMed
-
K. Y. Green, Caliciviridae: The Noroviruses, in Fields Virology, ed. D. M. Knipe and P. M. Howley, Lippincott Williams & Wilkins, Philadelphia, PA, 5th edn, 2007, vol. 1, pp. 949–980 Search PubMed
- P. Chhabra, M. de Graaf, G. I. Parra, M. C.-W. Chan, K. Green, V. Martella, Q. Wang, P. A. White, K. Katayama, H. Vennema, M. P. G. Koopmans and J. Vinjé, J. Gen. Virol., 2019, 100, 1393–1406 CrossRef CAS
- N. Petronella, J. Ronholm, M. Suresh, J. Harlow, O. Mykytczuk, N. Corneau, S. Bidawid and N. Nasheri, BMC Infect. Dis., 2018, 18, 521 CrossRef CAS
- J. A. Kendra, K. Tohma, L. A. Ford-Siltz, C. J. Lepore and G. I. Parra, Proc. Natl. Acad. Sci. U. S. A., 2021, 118, e2015874118 CrossRef CAS
- Immunization, Vaccines and Biologicals: Norovirus, World Health Organization, Geneva, Switzerland, https://www.who.int/teams/immunization-vaccines-and-biologicals/diseases/norovirus, (accessed 5 September 2023).
- K. E. Kniel, Curr. Opin. Virol., 2014, 4, 85–90 CrossRef
-
F. B. Hollinger and S. U. Emerson, Hepatitis A Virus, in Fields Virology, ed. D. M. Knipe and P. M. Howley, Lippincott Williams & Wilkins, Philadelphia, PA, 5th edn, 2007, vol. 1, pp. 911–948 Search PubMed
- S. M. Lemon and C. M. Walker, Cold Spring Harbor Perspect. Med., 2019, 9, a031823 CrossRef
- WHO Position Paper on Hepatitis A Vaccines – October 2022, Weekly Epidemiological Record, 2022, 97, pp. 493–512 Search PubMed.
- Microbiology of the Food Chain – Horizontal Method for Determination of Hepatitis A Virus and Norovirus Using Real-Time RT-PCR – Part 1: Method for Quantification, ISO 15216-1:2017, International Organization for Standardization, Geneva, Switzerland, 2017.
- G. M. Whitesides, Nature, 2006, 442, 368–373 CrossRef CAS
- L. Gervais, N. de Rooij and E. Delamarche, Adv. Mater., 2011, 23, H151–H176 CAS
- A. M. Foudeh, T. F. Didar, T. Veres and M. Tabrizian, Lab Chip, 2012, 12, 3249–3266 RSC
- O. Strohmeier, M. Keller, F. Schwemmer, S. Zehnle, D. Mark, F. von Stetten, R. Zengerle and N. Paust, Chem. Soc. Rev., 2015, 44, 6187–6229 RSC
- K.-Z. Liu, G. Tian, A. C.-T. Ko, M. Geissler, D. Brassard and T. Veres, Biomed. Microdevices, 2020, 22, 29 CrossRef
- H. Zhu, Z. Fohlerová, J. Pekárek, E. Basova and P. Neužil, Biosens. Bioelectron., 2020, 153, 112041 CrossRef CAS
- W. Su, D. Liang and M. Tan, Trends Food Sci. Technol., 2021, 113, 97–109 CrossRef CAS
- S. Chung, L. E. Breshears, S. Perea, C. M. Morrison, W. Q. Betancourt, K. A. Reynolds and J.-Y. Yoon, ACS Omega, 2019, 4, 11180–11188 CrossRef CAS
- X. Ye, J. Xu, L. Lu, X. Li, X. Fang and J. Kong, Anal. Chim. Acta, 2018, 1018, 78–85 CrossRef CAS
- M. El-Tholoth, H. Bai, M. G. Mauk, L. Saif and H. H. Bau, Lab Chip, 2021, 21, 1118–1130 RSC
- S. Anderson, B. Hadwen and C. Brown, Lab Chip, 2021, 21, 962–975 RSC
- Y. Zai, C. Min, Z. Wang, Y. Ding, H. Zhao, E. Su and N. He, Lab Chip, 2022, 22, 3436–3452 RSC
- R. Chand and S. Neethirajan, Biosens. Bioelectron., 2017, 98, 47–53 CrossRef CAS PubMed
- F. Stumpf, F. Schwemmer, T. Hutzenlaub, D. Baumann, O. Strohmeier, G. Dingemanns, G. Simons, C. Sager, L. Plobner, F. von Stetten, R. Zengerle and D. Mark, Lab Chip, 2016, 16, 199–207 RSC
- L. Malic, D. Brassard, D. Da Fonte, C. Nassif, M. Mounier, A. Ponton, M. Geissler, M. Shiu, K. J. Morton and T. Veres, Lab Chip, 2022, 22, 3157–3171 RSC
- R. Gorkin, J. Park, J. Siegrist, M. Amasia, B. S. Lee, J.-M. Park, J. Kim, H. Kim, M. Madou and Y.-K. Cho, Lab Chip, 2010, 10, 1758–1773 RSC
- L. Clime, D. Brassard, M. Geissler and T. Veres, Lab Chip, 2015, 15, 2400–2411 RSC
- L. Clime, J. Daoud, D. Brassard, L. Malic, M. Geissler and T. Veres, Microfluid. Nanofluid., 2019, 23, 29 CrossRef
- G. Czilwik, T. Messinger, O. Strohmeier, S. Wadle, F. von Stetten, N. Paust, G. Roth, R. Zengerle, P. Saarinen, J. Niittymäki, K. McAllister, O. Sheils, J. O'Leary and D. Mark, Lab Chip, 2015, 15, 3749–3759 RSC
- M. Geissler, L. Clime, X. D. Hoa, K. J. Morton, H. Hébert, L. Poncelet, M. Mounier, M. Deschênes, M. E. Gauthier, G. Huszczynski, N. Corneau, B. W. Blais and T. Veres, Anal. Chem., 2015, 87, 10565–10572 CrossRef CAS PubMed
- B. H. Park, S. J. Oh, J. H. Jung, G. Choi, J. H. Seo, E. Y. Lee and T. S. Seo, Biosens. Bioelectron., 2017, 91, 334–340 CrossRef CAS
- T. N. D. Trinh and N. Y. Lee, Lab Chip, 2018, 18, 2369–2377 RSC
- S. J. Oh and T. S. Seo, Analyst, 2019, 144, 5766–5774 RSC
- M. Geissler, D. Brassard, L. Clime, A. V. C. Pilar, L. Malic, J. Daoud, V. Barrère, C. Luebbert, B. W. Blais, N. Corneau and T. Veres, Analyst, 2020, 145, 6831–6845 RSC
- D. Brassard, M. Geissler, M. Descarreaux, D. Tremblay, J. Daoud, L. Clime, M. Mounier, D. Charlebois and T. Veres, Lab Chip, 2019, 19, 1941–1952 RSC
- M. Geissler, L. Malic, K. J. Morton, L. Clime, J. Daoud, J. A. Hernández-Castro, N. Corneau, B. W. Blais and T. Veres, Anal. Chem., 2020, 92, 7738–7745 CrossRef CAS
- M. Geissler, A. Ponton, C. Nassif, L. Malic, K. Turcotte, L. Lukic, K. J. Morton and T. Veres, ACS Appl. Polym. Mater., 2022, 4, 5287–5297 CrossRef
- S. Kojima, T. Kageyama, S. Fukushi, F. B. Hoshino, M. Shinohara, K. Uchida, K. Natori, N. Takeda and K. Katayama, J. Virol. Methods, 2002, 100, 107–114 CrossRef CAS
- A. A. Trujillo, K. A. McCaustland, D.-P. Zheng, L. A. Hadley, G. Vaughn, S. M. Adams, T. Ando, R. I. Glass and S. S. Monroe, J. Clin. Microbiol., 2006, 44, 1405–1412 CrossRef CAS
- E. Guévremont, J. Brassard, A. Houde, C. Simard and Y.-L. Trottier, J. Virol. Methods, 2006, 134, 130–135 CrossRef PubMed
- M. F. Kavlick, BioTechniques, 2018, 65, 275–280 CrossRef CAS
- A. Martinez-Perez and B. W. Blais, Food Control, 2010, 21, 1354–1359 CrossRef CAS
- E. Roy, M. Geissler, J.-C. Galas and T. Veres, Microfluid. Nanofluid., 2011, 11, 235–244 CrossRef CAS
- L. Clime, X. D. Hoa, N. Corneau, K. J. Morton, C. Luebbert, M. Mounier, D. Brassard, M. Geissler, S. Bidawid, J. Farber and T. Veres, Biomed. Microdevices, 2015, 17, 17 CrossRef
- L. Malic, J. Daoud, M. Geissler, A. Boutin, L. Lukic, M. Janta, A. Elmanzalawy and T. Veres, Analyst, 2019, 144, 6541–6553 RSC
- L. Poncelet, L. Malic, L. Clime, M. Geissler, K. J. Morton, C. Nassif, D. Da Fonte, G. Veilleux and T. Veres, Analyst, 2021, 146, 7491–7502 RSC
- M. Suresh, J. Harlow and N. Nasheri, Food Microbiol., 2019, 84, 103254 CrossRef CAS
- N. Nasheri, J. Harlow, A. Chen, N. Corneau and S. Bidawid, J. Food Prot., 2020, 83, 388–396 CrossRef CAS PubMed
- J. C. Traeger and D. K. Schwartz, J. Colloid Interface Sci., 2020, 566, 369–374 CrossRef CAS PubMed
- C. Chen, W. Wang, J. Ge and X. S. Zhao, Nucleic Acids Res., 2009, 37, 3756–3765 CrossRef CAS PubMed
- P. Gong and R. Levicky, Proc. Natl. Acad. Sci. U. S. A., 2008, 105, 5301–5306 CrossRef CAS
- R. Peytavi, L.-Y. Tang, F. R. Raymond, K. Boissinot, L. Bissonnette, M. Boissinot, F. J. Picard, A. Huletsky, M. Ouellette and M. G. Bergeron, BioTechniques, 2005, 39, 89–96 CrossRef CAS
- K. Boissinot, R. Peytavi, S. Chapdelaine, M. Geissler, M. Boissinot, E. A. Martel, D. Béliveau-Viel, J.-F. Gravel, L. Malic, T. Veres, D. Boudreau and M. G. Bergeron, Analyst, 2021, 146, 4226–4234 RSC
- C. Hennechart-Collette, O. Dehan, M. Laurentie, A. Fraisse, S. Martin-Latil and S. Perelle, Int. J. Food Microbiol., 2021, 337, 108931 CrossRef CAS
Footnotes |
| † Electronic supplementary information (ESI) available. See DOI: https://doi.org/10.1039/d3lc00904a |
| ‡ These authors contributed equally to this work. |
| This journal is © The Royal Society of Chemistry 2024 |