
 Open Access Article
 This Open Access Article is licensed under a Creative Commons Attribution-Non Commercial 3.0 Unported Licence
Sustainable iron production via highly efficient low-temperature electrolysis of 3D conductive colloidal electrodes†
Panya
Thanwisai‡
a,
Zeyi
Yao‡
a,
Muntasir
Shahabuddin
b,
Jiahui
Hou
 a,
Jinzhao
Fu
a,
Adam C.
Powell IV
a and
Yan
Wang
*a
a,
Jinzhao
Fu
a,
Adam C.
Powell IV
a and
Yan
Wang
*a
aDepartment of Mechanical and Materials Engineering, Worcester Polytechnic Institute, Worcester, MA 01609, USA. E-mail: yanwang@wpi.edu
bDepartment of Chemical Engineering, Worcester Polytechnic Institute, Worcester, MA 01609, USA
First published on 5th July 2024
Abstract
Towards decarbonizing the carbothermic reduction of iron and steelmaking, which produces around 5% of global CO2 emissions, we herein propose a low-temperature electrolysis (100 °C) with 3D electrically–ionically conductive colloidal Fe2O3 electrodes as a novel and sustainable alternative. With the designed electrodes that offer a 3D conductive network to facilitate the electrochemical reduction of Fe2O3 at such a low temperature, high-purity Fe powder (>95%) can be produced with high current efficiency (>95%) and no direct CO2 emission. In addition to Fe, we also demonstrate the production of metal and alloy powders such as Cu, Ag, and an FeNi alloy using the proposed method. A techno-economic assessment of the process is performed to evaluate industrial feasibility as well as CO2 emission analysis. Altogether, this alternative process is green, environmentally friendly, and energy efficient, showing great potential for revolutionizing the conventional process that has had a significant environmental impact for decades.
Introduction
Currently, iron (Fe) is manufactured by carbothermic reduction in which iron oxide ores (Fe2O3) are reduced by carbon coke at a high temperature of >2000 °C in a blast furnace using the blast furnace/basic oxygen furnace route (BF–BOF) and the electric arc furnace route (EAF).1 In accordance with the reduction reaction shown in eqn (1), liquid crude Fe is produced while CO2 is also emitted as a by-product. Moreover, the use of fossil fuels to generate such a high-temperature environment, coke production, and other energy-intensive processes related to iron and steelmaking further contribute to carbon emissions.2 As reported in the Energy Agency and EDGAR 4.3 databases, approximately 2 tons of CO2 are emitted per ton of crude Fe produced, accounting for 5% of global CO2 emissions,3 which are considered some of the most difficult emissions to eliminate. With the goal of net-zero carbon emissions from iron and steelmaking, radical and transformational technologies for cleaner Fe production are therefore urgently required. In recent years, several alternatives have been extensively utilized to produce Fe with limited direct carbon emissions such as molten oxide electrolysis (MOE),4–13 hydrogen flash smelting (HFS),14–17 and low-temperature electrolysis (LTE).2,18–26 Among these, the LTE method has attracted much attention due to its intriguing advantages. For example, LTE is conducted at a significantly lower temperature (∼100 °C) compared to the carbothermic reduction (>2000 °C), MOE (>500 °C), and HFS processes (>1000 °C). Unlike the MOE process, it does not require a stable anode for such a high-temperature operation and avoids the use of H2 as a reducing agent, which is cost-prohibitive for the commercialization of the HFS process. These benefits endow the LTE process with less energy-consumptive, simpler, and less expensive iron manufacturing, which has great potential for industrialization.In fact, LTE for iron production towards zero CO2 emission has been examined for many years.5,17,18 Generally, different Fe2O3 electrodes such as Fe2O3 ores, Fe2O3 pellets, or Fe2O3 particles suspended in a highly concentrated alkaline solution electrolyte (50 wt% NaOH) are reduced to metallic Fe by applying electricity to the electrochemical cells. The targeted Fe product is produced at the cathode; meanwhile, O2 gas is solely generated at the anode without any CO2 emission. The typical cathodic and anodic reactions are shown in eqn (2) and (3).
Carbothermic reduction reaction at 2000 °C:
| 2Fe2O3 + 3C → 4Fe + 3CO2 | (1) |
Electrolysis reaction at ∼100 °C:
Cathode:
| Fe2O3 + 3H2O + 6e− → 2Fe + 6OH− | (2) |
Anode:
| 6OH− → 3/2O2 + 3H2O + 6e− | (3) |
Nevertheless, there are some challenges associated with the LTE designs that prevent them from being adopted on a large scale. Firstly, Fe2O3 intrinsically possesses low electrical conductivity, and thus, charge transfer during the electroreduction and the electrochemical reaction rate are limited, resulting in low energy efficiency. Moreover, palletization and high-temperature sintering steps lead to excessive energy usage and complexity in large-scale production. Secondly, in a system of Fe2O3 particles suspended in an alkaline electrolyte, Fe2O3 particles need to diffuse to the cathode substrate surface to be involved in the electrochemical reaction. As a result, the conductive areas are limited by the substrate; meanwhile, the sluggish diffusion of Fe2O3 impedes the fast reaction rate.
Herein, we report a novel and sustainable method of Fe production via low-temperature electrolysis of electrically–ionically conductive Fe2O3/carbon (C) colloidal electrodes with porous Ni foam substrates. The proposed LTE process is depicted in Fig. 1a in which the flowable Fe2O3/C colloids are electrolyzed at a low temperature of 100 °C with a constant cell voltage of −1.7 V in a 50 wt% NaOH electrolyte solution. The final product is high-purity Fe powder while only O2 gas is generated as a by-product, which is collectible. In our LTE design, the colloidal electrodes contain Fe2O3/C composite powders suspended in a highly concentrated NaOH solution, which is different from the reported Fe2O3 suspension systems. Here, C acts as an electrically conductive network improving the electrical conductivity of Fe2O3, while the NaOH solution serves as an ionic conductive network facilitating ion diffusion during the electrochemical reaction. Thus, a 3D conductive percolation network is formed, as shown in Fig. 1b. Fig. 1c depicts the reduction mechanism of suspensions of Fe2O3 particles in NaOH solution with and without the C conductive network. In the conventional Fe2O3 suspension (with no C), Fe2O3 particles need to diffuse to the surface of the Ni foam current collector to be reduced. Due to their sluggish diffusivity in NaOH and intrinsically poor electrical conductivity, most Fe2O3 particles are reduced to Fe3O4 with some Fe depositing on Ni foam surfaces. In contrast, in the designed Fe2O3 suspension with C, Fe2O3 particles can be directly reduced to Fe without diffusion owing to the formation of the C conductive network. Furthermore, C on Fe2O3 particles also serves as a conductive medium, so Fe2O3 particles do not directly come into contact with the Ni foam surface, alleviating the deposition of Fe powder on the electrode surface. This unique function in turn improves production yield and facilitates product collection. More importantly, as the colloidal electrode is flowable, it can potentially be used in a flow electrolysis design that allows continuous production and facilitates product collection and separation steps. Altogether, utilizing the LTE of Fe2O3 colloidal electrodes can resolve the aforementioned limitations of the LTE process. In addition, it is worth mentioning that the electrolysis design can also be applied to produce other metal and alloy powders such as Cu, Ag, and an FeNi alloy and shows great potential for use as an alternative method of metal/alloy powder production.
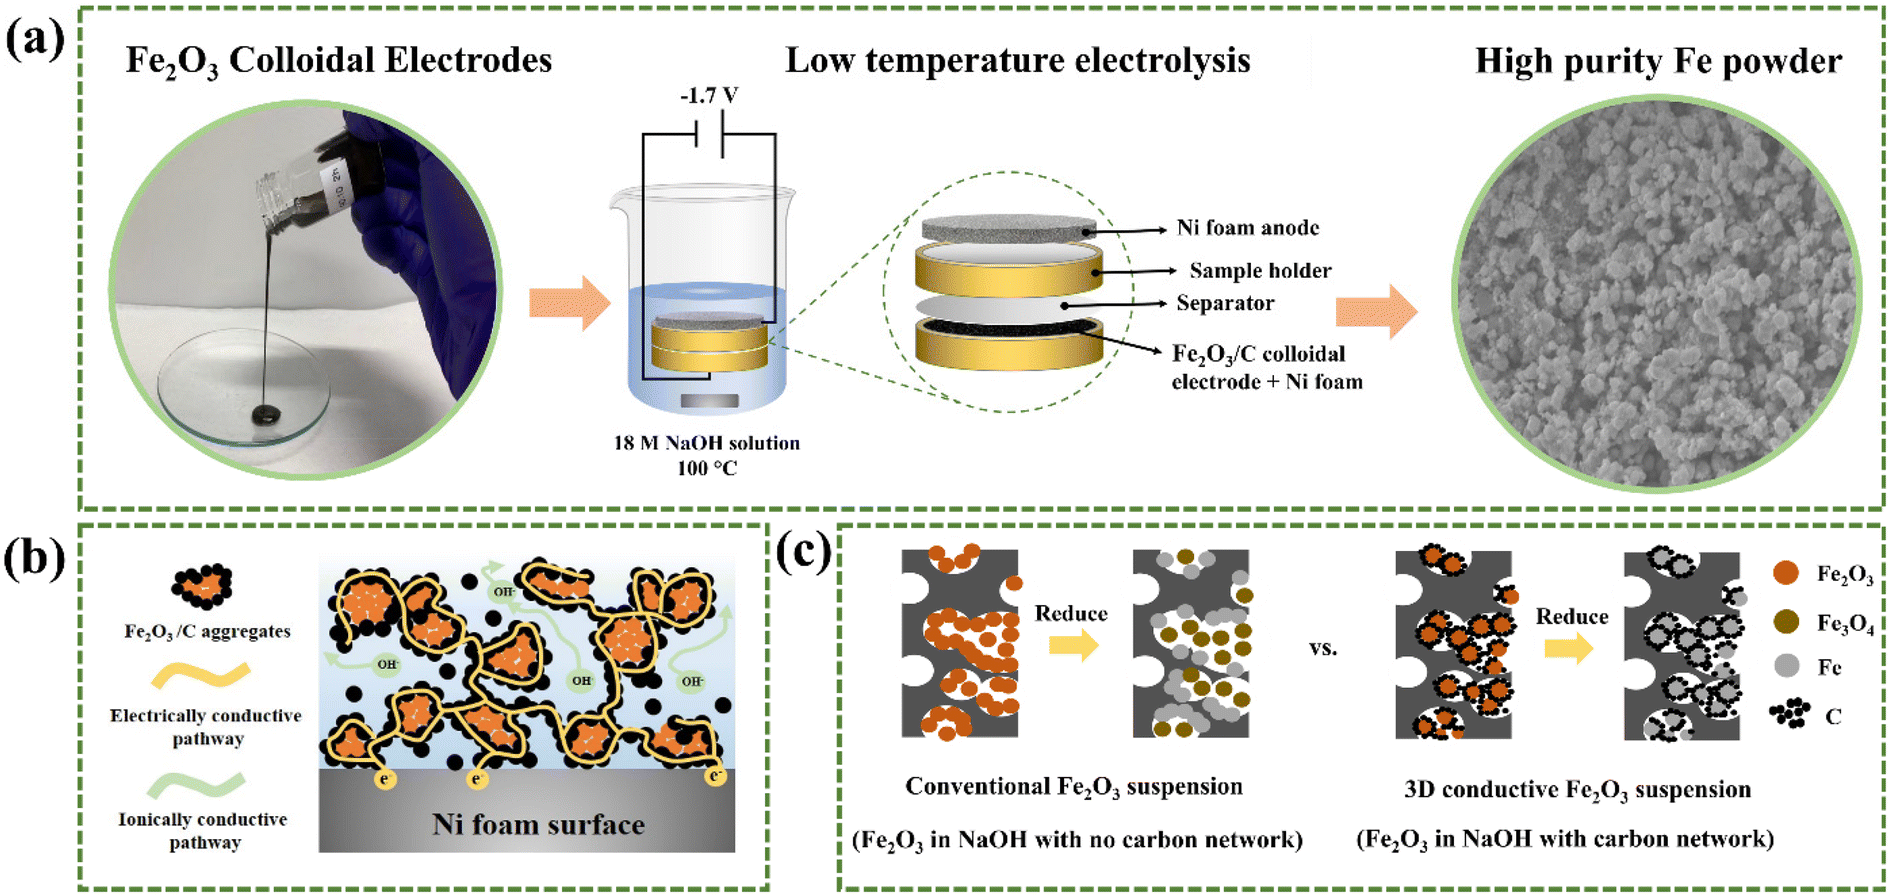 | ||
| Fig. 1 (a) Schematic illustration of the low-temperature electrolysis of Fe2O3 colloidal electrodes. (b) Illustration of an electronically and ionically conductive network of Fe2O3 colloidal electrodes. (c) Illustration showing the electrochemical reduction of Fe2O3 colloidal electrodes with and without C networks on a Ni foam substrate. | ||
Results and discussion
Formation of Fe2O3/C colloidal electrodes
Prior to the electrochemical reduction process, Fe2O3 colloidal electrodes were prepared as described in the experimental details in the ESI.†Fig. 2a and b show the morphologies of Fe2O3/C aggregates with particle sizes ranging from 1 μm to >10 μm, revealed by scanning electron microscopy (SEM). The corresponding elemental mappings of the aggregates obtained from energy dispersive X-ray spectroscopy (EDS) in Fig. 2c show a uniform distribution of C powders on Fe2O3 particles confirming the successful formation of Fe2O3/C aggregates. It is worth noting that the structure is necessary for the reduction reaction since the formation of the Fe2O3/C network sufficiently provides electrically conductive pathways to the colloidal electrodes, which helps increase the electrical conductivity of Fe2O3. The BET surface areas of Fe2O3 and Fe2O3/C aggregates are reported in Table S1.† C nanopowders provide extra reactive surface areas, facilitating the reduction reaction. In addition to the electrically conductive network provided by C powders, the added NaOH solution imparts ionic conductivity to the colloidal electrode. Hence, a 3D conductive Fe2O3 percolation network was fabricated. Moreover, organic and inorganic additives were added to the colloids to aid in suppressing H2 evolution and promoting the reduction reaction, according to our previous findings.2,26,27 It should be noted that the Fe2O3/C colloids still maintain good flowability, as reflected by the trivial change in viscosity compared to the colloid with no carbon added, as can be seen from the viscosity test in Fig. 2d. The slight decrease in the viscosity of the colloid with C results from larger sizes of aggregates compared to Fe2O3 nanopowders, indicating that the colloidal electrode design can be applied in a flow electrolysis system, facilitating continuous production and ease of product collection. In addition, the electrical conductivity of the Fe2O3/C slurry was greatly improved due to the formation of the conductive carbon network, as can also be seen in Fig. 2e. The testing details are described in the ESI and Fig. S1.†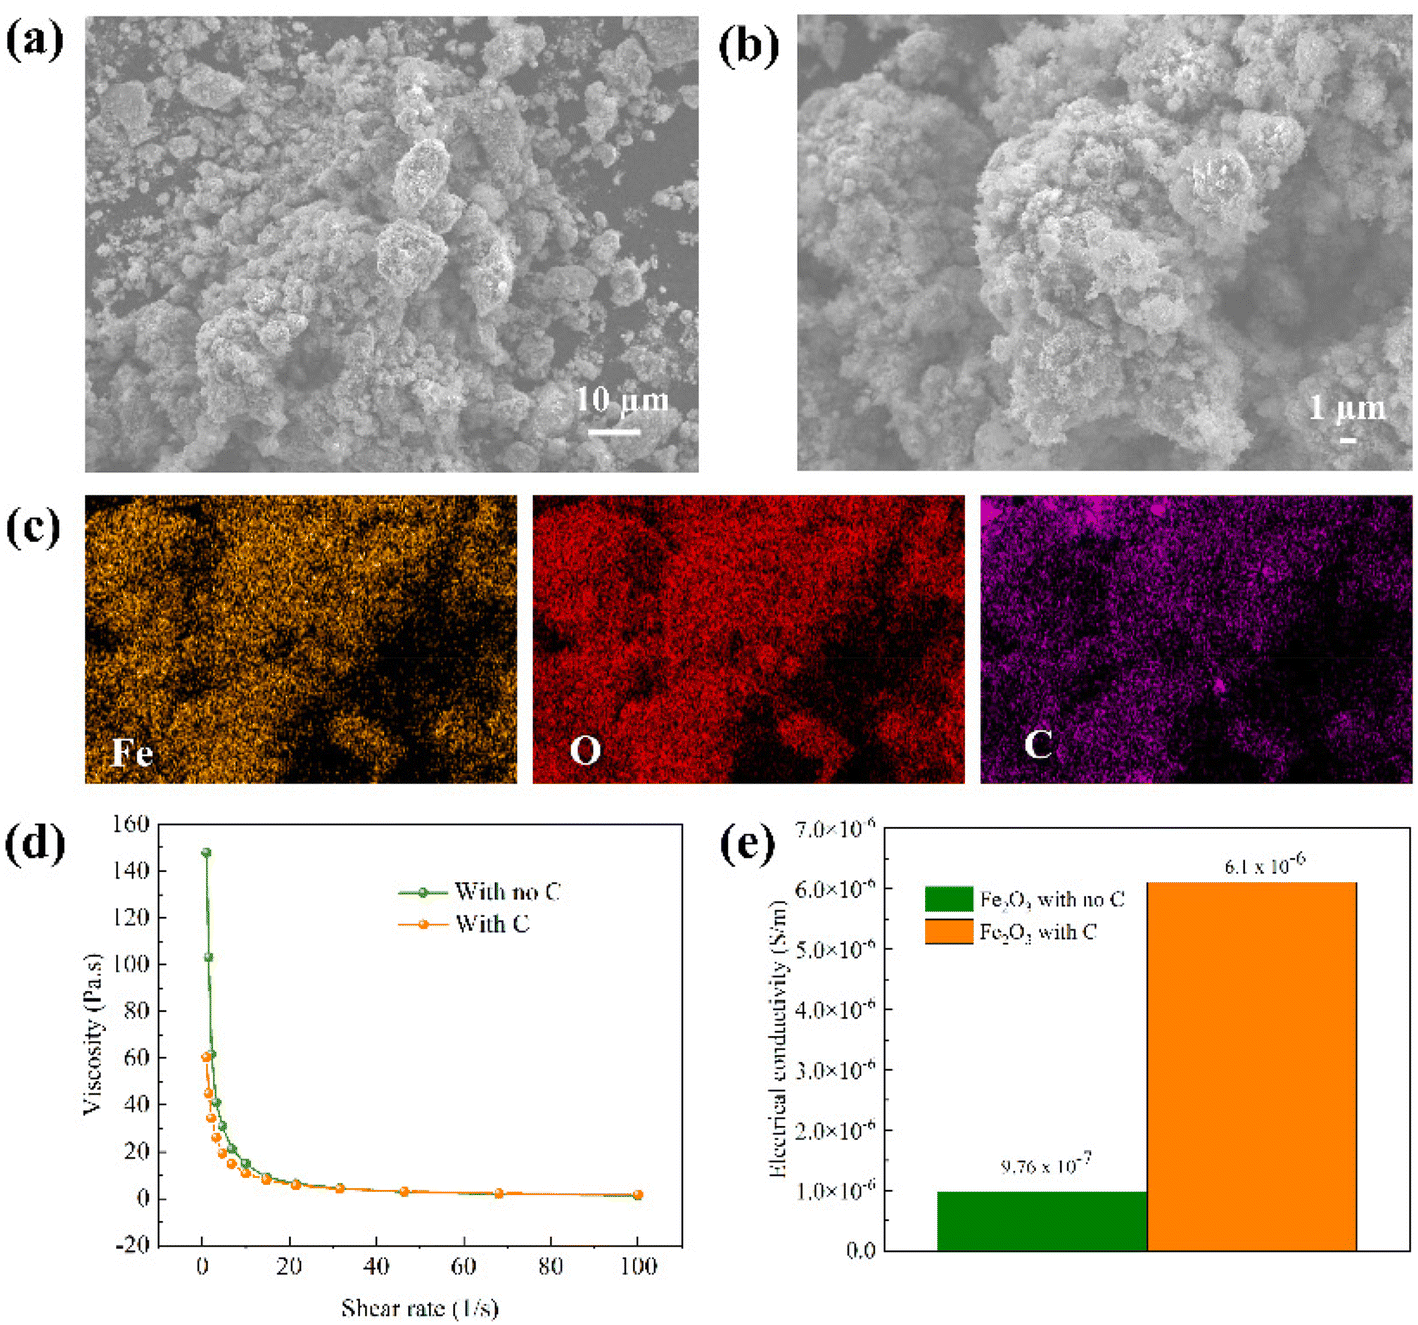 | ||
| Fig. 2 (a and b) SEM images of Fe2O3/C micro-aggregates formed by ball milling at different magnifications. (c) EDS mappings of the prepared aggregates. (d) Viscosity test and (e) electrical conductivity of Fe2O3 colloidal electrodes with and without C. | ||
Electrolysis of Fe2O3/C colloidal electrodes
In the electrochemical reduction of the Fe2O3 colloidal electrode, a negative voltage of 1.7 V was applied to the two-electrode electrolysis cell, and the reaction was prolonged until reaching the theoretical capacity calculated based on Faraday's law, as shown in eqn (S1) in the ESI.†In the electrolysis experiments, we used porous Ni foam sheets as a cathode substrate and an anode electrode. We demonstrated that the utilization of 3D porous Ni foam as a substrate can improve the electrolysis efficiency and Fe purity over using 2D Ti foil as a cathode substrate and Pt foil as an anode, as reported in our previous works.2,26 This is because the 3D porous structure of Ni foam can sufficiently distribute charge for reducing Fe2O3 to Fe effectively, resulting in a higher current and a shorter reaction time than those of 2D conductive areas of Ti foil, as can be seen in Fig. S2a.† A cartoon showing the different functions of Ti foil and Ni foam as substrates is illustrated in Fig. S2b.† More importantly, Ni foam is much cheaper than both Ti foil and noble-metallic Pt foil and is more feasible for large-scale and industrial production.
Fig. 3a shows the relationship between the reduction current and reaction time of Fe2O3 colloidal electrodes with and without C. Of note, the current produced from bare Ni foam is relatively small compared to that from Ni foam with the colloids (Fig. S2c†), contributing to negligible current. At a glance, there are main reduction kinetics observed during the electrolysis reaction that can be used to predict the Fe2O3 reduction mechanisms as follows.2 In the first 5 min of the reaction, there is a rapid electrochemical reaction at the Fe2O3/electrolyte interface resulting in the production of a high current, similarly observed in both colloidal electrodes. During 20 min of the reaction, in the colloid without C, Fe2O3 particles are gradually reduced to Fe3O4 and Fe. Then, after 20 min, the current plateau can be observed implying the sluggish reduction of Fe3O4 accompanied by H2 evolution until the end of the reaction. In contrast, after 5 min of the reaction in the colloidal electrode with C, there is a continuous increase in the current until 36 min of the reaction implying that Fe2O3 is continuously reduced to Fe throughout the reaction period. In the final 4 min of the reaction, the current decreases, indicative of the end of the reaction. It is noticeable that the current produced by the electrolysis of the Fe2O3/C colloid is higher than that of the colloid without C for the entire reaction period. In addition, the reaction time is shorter, which takes around 40 min to complete the reaction corresponding to 1× the theoretical capacity applied, while the colloid with no C takes 55 min. This enhancement benefits from the designed colloidal electrode that provides electrically conductive pathways for rapid charge transfer between Fe2O3 particles and Ni foam substrate surfaces during the electrochemical reduction. The X-ray powder diffraction (XRD) patterns shown in Fig. 3b reveal the resulting products obtained from electrolyzing the colloidal electrodes with and without C. For the conventional Fe2O3 electrode, the majority of the electrolyzed product is Fe3O4 with a small amount of Fe. According to peak intensity analysis, the purity of Fe is only 6% while that of Fe3O4 is 94%. Calculated based on the capacity applied and the purity of produced Fe, the electrolysis efficiency of the electrode without C is around 16%. It was reported that Fe3O4 is the intermediate phase of Fe2O3 reduction according to eqn (4) and (5).26 This intermediate phase is sluggish for the electrochemical reaction to be further reduced to Fe.2 Hence, it is difficult to reduce all Fe2O3 to Fe in the conventional colloid that has poor electrical conductivity, bringing about low purity of Fe and low current efficiency in this process.
| 3Fe2O3 + 2H+ + 2e− → 2Fe3O4 + H2O | (4) |
| Fe3O4 + 8H+ + 8e− → 3Fe + 4H2O | (5) |
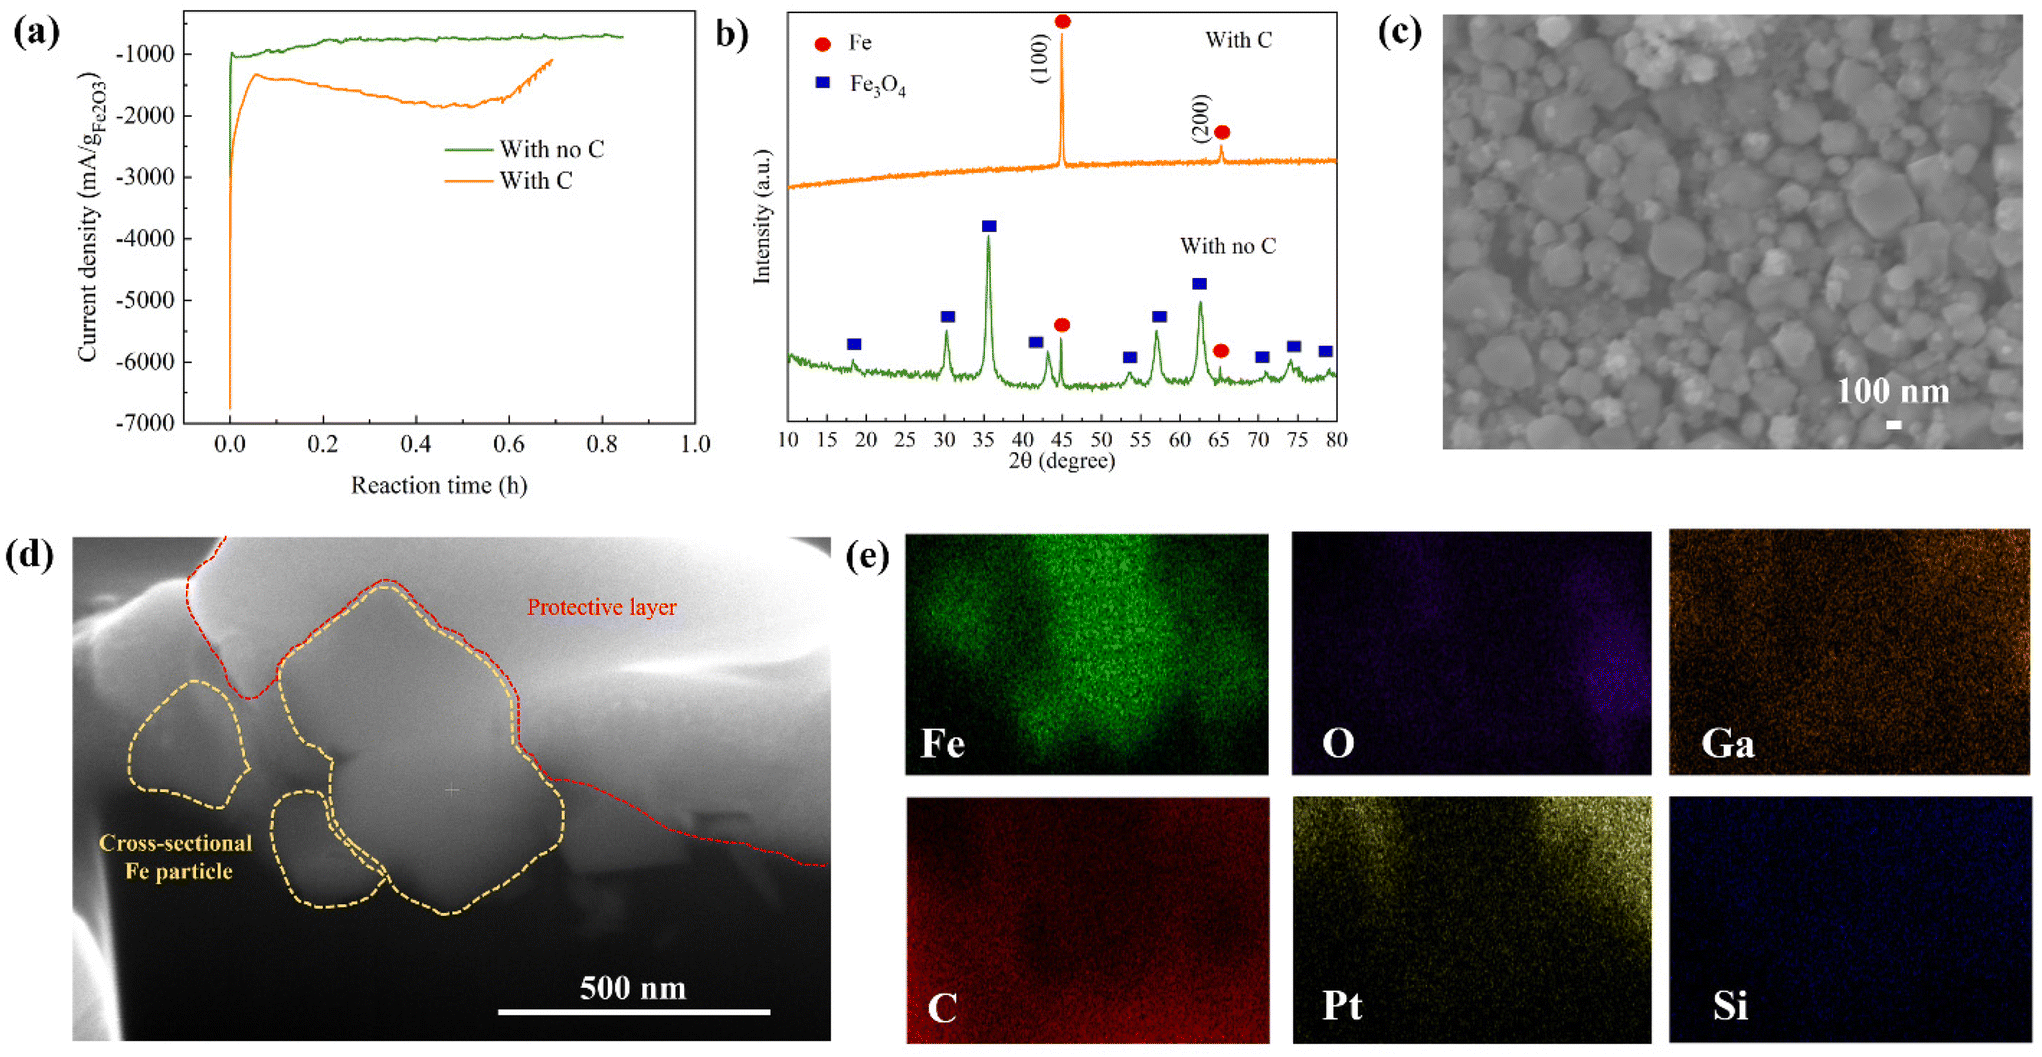 | ||
| Fig. 3 (a) Electrolysis current vs. reaction time plot and (b) XRD patterns of the electrolyzed product for Fe2O3 colloidal electrodes with and without C. (c) SEM image of electrolyzed Fe after magnetic separation. (d) Cross-sectional FIB-SEM image and (e) EDS mappings of electrolyzed Fe particles. | ||
In sharp contrast to the conventional suspension, the electrolyzed product of Fe2O3/C colloidal electrodes shows almost no Fe3O4 phases according to the XRD pattern shown in Fig. 3b. Over 95% of Fe can be obtained with an insignificant amount of Fe3O4. This small amount of impurity may come from unreacted Fe3O4 remaining on the wall of the sample holder made of polypropylene (a non-conductive material), which lacks the coverage of the conductive properties. Of note, the high-purity Fe powder can be reproduced, as shown in Fig. S3.† According to such a high purity of Fe, the calculated current efficiency is 95.6% which is higher than those of other electrolysis methods reported in Table S2,† to the best of our knowledge. The high purity of Fe and high current efficiency stem from the effectiveness of the LTE process with a 3D conductive colloidal electrode design. Compared to those reported LTE and MOE processes, our approach provides comparable or even higher current efficiency and allows bypassing the use of energy-consuming steps, high temperature, and complicated processes leading to more energy and cost savings.
It is worth noting that the presence of the Fe3O4 intermediate phase suggests that the electroreduction mechanism of most Fe2O3 suspended particles involves the solid-state reduction of Fe2O3 particles to Fe3O4 and then Fe.20,22,26 In addition, it was found that there are some Fe particles deposited on the Ni foam surface, as shown in Fig. S4a and b.† The deposited Fe particles show a dendritic morphology. Owing to the absence of C layers on Fe2O3 particles, the electrodeposited Fe is more obvious in the conventional Fe2O3 colloidal electrodes. Conversely, C powders, forming a conductive layer on Fe2O3 particles, promote the solid-state reduction of Fe2O3 particles, resulting in less deposited Fe on the Ni foam surface. Hence, the formation of Fe in the colloidal electrode design involves dominant solid-state Fe2O3 electrolysis. It is also worth mentioning that, in the practical production of Fe, the deposited Fe on Ni foam can be problematic as it can lead to Fe mass loss. Possible solutions to prevent the deposition and quantification of Fe deposition on Ni foam as well as comments on the issues are provided in Table S3.† Hence, it is suggested that technological advancements in preventing Fe deposition on such a metal porous substrate as well as Fe product separation from the substrate are also needed to improve this technology. Moreover, concerning the reusability of Ni foam, it is shown that Ni foam can be reused without any effects on the resistance or purity of Fe, as seen in Fig. S5a and b.†
Characterization of electrolyzed Fe powders
After the electrolysis, the electrolyzed Fe was subjected to a magnetic separation step to further enhance the purity and dispose of C remnants, as described in the ESI.† XRD, SEM/EDS, and focused ion beam scanning electron microscopy (FIB-SEM) for cross-sectional images were also utilized to further characterize the electrolyzed Fe powder before and after separation. Fig. S6a† shows the SEM/EDS mappings of electrolyzed Fe before separation. It can be observed that the Fe particles were covered by C powder and the signal of C from EDS mapping is relatively high. After the magnetic separation, the amount of C was greatly reduced, as reflected by the low signal of C in the EDS mappings (Fig. S6b†), indicating the effective magnetic separation method. The high purity of the obtained Fe powders is also confirmed by inductively coupled plasma optical emission spectroscopy (ICP-OES) (Table S4†). The XRD result of separated carbon is shown in Fig. S6c,† indicating the mixture of nanosized carbon powder and unreacted Fe2O3 and Fe3O4. It should be noted that the carbon powder can possibly be reused after an appropriate separation process, and those iron oxides can also be reduced in further electrolysis reactions. A photograph of separated C powder and Fe powder is also shown in Fig. S6d.† In accordance with the SEM image in Fig. 3c, the Fe particles separated from C powder are of spherical-like nanosizes with an average particle size of around 200 nm. To further investigate the elemental compositions inside the electrolyzed Fe particles, cross-sectional FIB-SEM with line-scanning elemental mapping was accomplished. Fig. 3d illustrates the cross-sectional SEM image of the electrolyzed Fe particles of approximately 200 nm. The cut Fe particles are shown by yellow-dashed areas while the area marked with a red dashed line is a protective layer used in the FIB-SEM process. EDS mapping was conducted to reveal the elemental compositions inside the bulk Fe particles. As shown in Fig. 3e and Fig. S7a,† the signal of Fe is strong throughout the bulk particle with a negligible O signal, confirming that Fe2O3 is reduced to Fe completely. It should be noted that C, Pt, Ga, and Si signals are from the background and the protective layer. Moreover, no S and Na signals that are from the Na2S additive and NaOH electrolyte can be detected inside the bulk Fe particle. The EDS mapping is consistent with the line-scanning elemental mapping shown in Fig. S7b† in which the high Fe signal is consistent throughout the whole particle. These confirm the successful reduction of Fe2O3 to Fe through the proposed LTE of the colloidal electrode.In addition to nano-sized Fe, we also demonstrated that the method can be applied with a micro-sized Fe2O3 precursor. The LTE of micro-sized Fe2O3 provides high-purity Fe powder (>90%) with high current efficiency (>90%) (Fig. S8†). Interestingly, the morphology of Fe from the micro-sized Fe2O3 source is different from electrolyzed Fe produced by using nano-sized Fe2O3 as a precursor. Prism-like Fe particles were obtained, as revealed in Fig. S8c.† The morphology is similar to a needle-like or dendritic crystal of Fe grown on a Ni grid, as reported by Lopes et al.28 This suggests that using different sizes of Fe2O3 can produce Fe powders with different morphologies. However, the purity of electrolyzed Fe from micro-sized Fe2O3 is slightly lower than that obtained using nano-sized Fe2O3 sources. This is due to the difference in the particle sizes of Fe2O3 and nano-C powder leading to non-homogeneous mixing, as can be observed from the phase separation in the Fe2O3/C suspension shown in Fig. S9a.† In contrast, in Fig. S9b,† the mixture is more homogeneous for the nanosized Fe2O3/C slurry due to their similar particle sizes. It should be noted that the morphology of Fe can alter its physical and chemical properties resulting in the utilization of Fe in a wide range of applications. Therefore, this illustrates that our LTE process can produce Fe with different morphologies by modifying the size of the Fe2O3 inputs, which is an alternative way to produce nano-Fe or micro-Fe.
Other metal/alloy powder production
Impressively, in addition to Fe powder production, the proposed LTE with the colloidal electrode design can also be applied to produce other metal/alloy powders such as Ag, Cu, and FeNi alloy powders, as shown in Fig. 4a–c and Fig. S10.† The experimental details of each are described in the ESI. According to the XRD pattern and SEM image of electrolyzed Ag shown in Fig. 4a, Ag can be produced without any detectable impurity signals by electrolyzing AgO/NaOH colloidal electrodes without the addition of C. The ease of electrolyzing AgO stems from the excellent electrical conductivity of Ag, hence facilitating such an electrochemical reduction process. CuO reduction was also conducted using the LTE method. The preparation of CuO/C aggregates and colloidal electrodes was identical to iron production. The XRD pattern in Fig. 4b shows that 87% Cu can be obtained through the electrolysis process. It was found that the electrochemical reduction involves the reduction of CuO to the Cu2O intermediate phase and then Cu. This was similarly observed in CuO reduction in KCl media.29,30 In addition to single metal powders, bimetallic FeNi alloy powders can be produced by the electrolysis of NiFe2O4 for the first time. Due to the higher electron transfer involved in the reduction reaction, the concentration of the NaOH electrolyte was increased to 65 wt% and the optimized theoretical capacity required is 4 times. As shown in the XRD pattern (Fig. 4c), roughly 78% of FeNi alloy phases can be obtained from the LTE process. Interestingly, the FeNi alloy produced from this LTE method possesses two different phases, BCC-FeNi (Fe-rich phase) and FCC-FeNi (Fe-rich phase). These two phases of FeNi were also observed in the reduction of NiFe2O4 involving H2 reduction at >1000 °C.31,32 The SEM image in Fig. 4c shows that cubic-like FeNi particles are produced. Moreover, based on thermodynamic analysis, not only for the production of Fe, Ag, Cu, and the FeNi alloy, but the LTE process can also be applied to produce the elements highlighted in green in Fig. 4d as well as other metal alloy powders. In order to obtain higher purity and current efficiency, nonetheless, electrode fabrications and electrolysis conditions of these metals and alloys need to be optimized.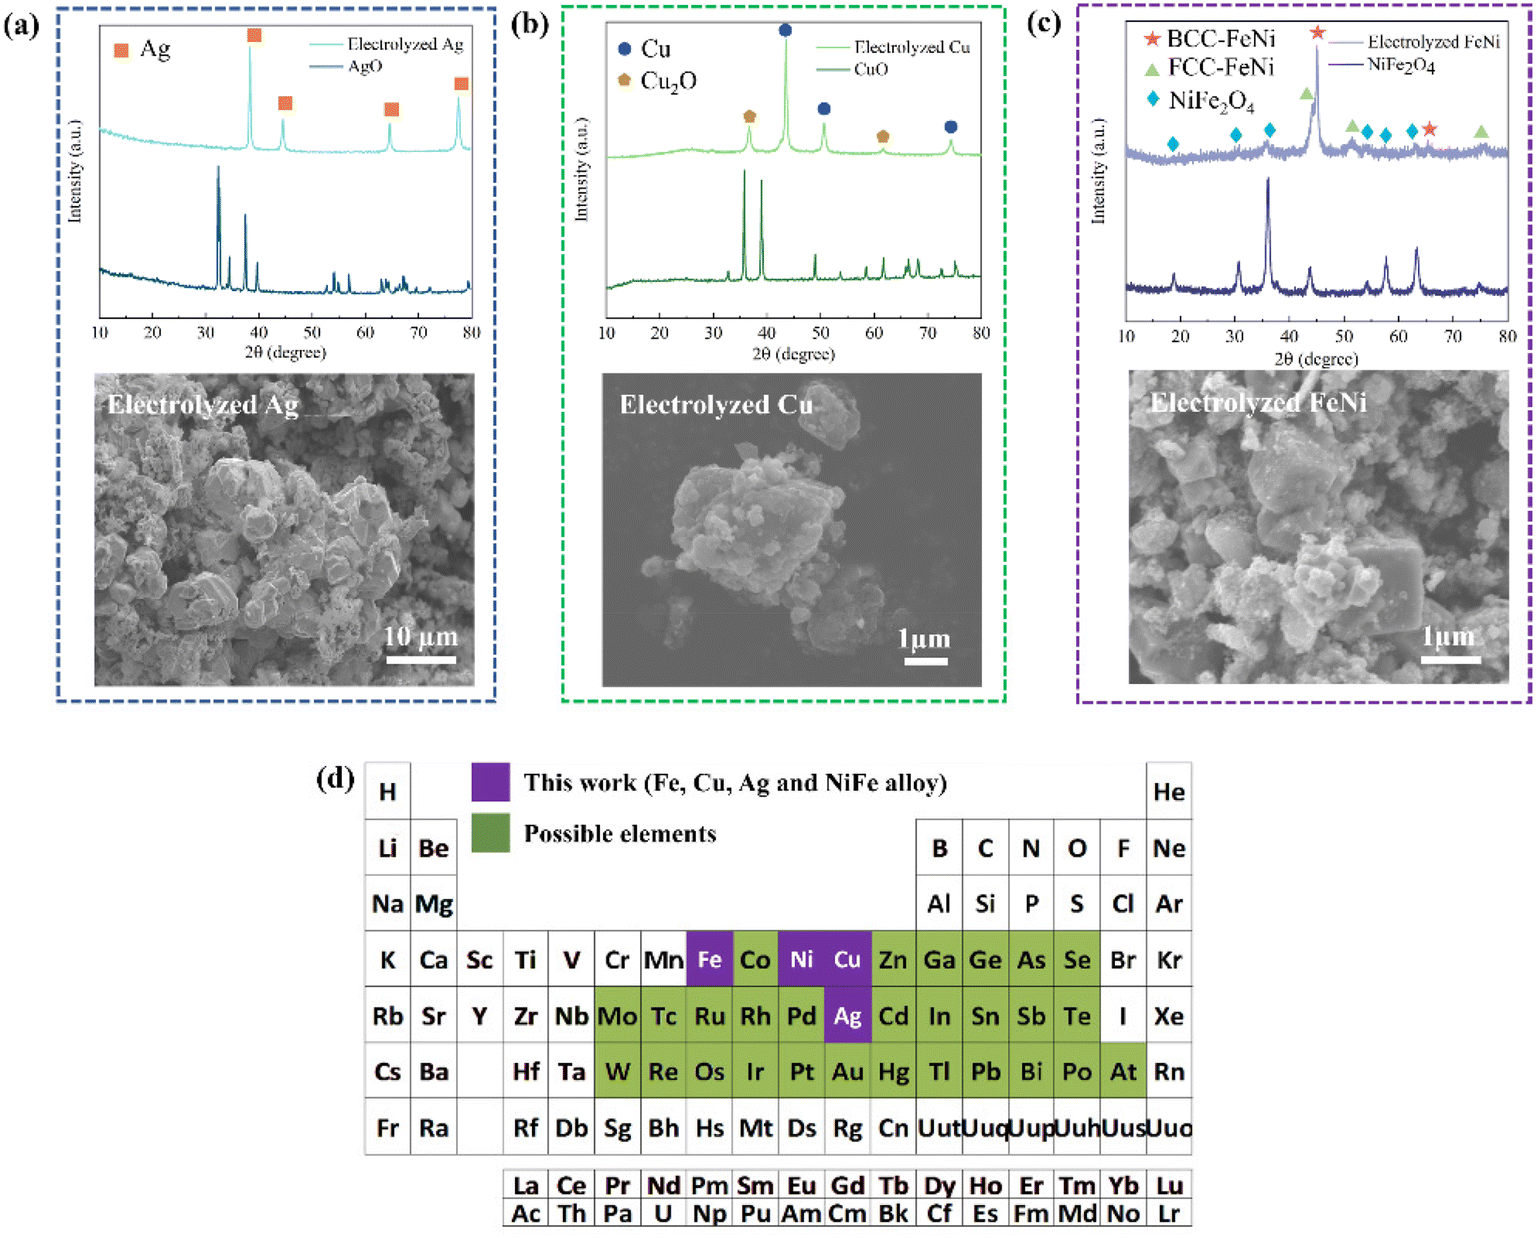 | ||
| Fig. 4 XRD patterns and SEM images of electrolyzed products using the proposed electrolysis process: (a) Ag, (b) Cu, and (c) FeNi alloy. (d) Possible elements that can be produced by low-temperature electrolysis, based on thermodynamics analysis. | ||
Techno-economic, energy and CO2 emission analyses
Inspired by the successful production of Fe via LTE on the laboratory scale, the process shows promising potential to be scaled up. Also, we propose a design of closed-loop production of the LTE process. The diagram illustrating the designed electrolysis process is shown in Fig. 5. Overall, the flow process of proposed Fe production consists of four major parts: (I) colloidal mixing, (II) electrolysis system, (III) magnetic separation of electrolyzed iron, and (IV) waste recycling and reuse. In the first part, iron ore powders, C powders, NaOH, water and additives are fed into the colloid mixing tank followed by feeding the colloidal mixture to the electrochemical cell. The electrochemical reduction of the colloidal mixture takes place in the second part. The O2 by-product in the scaled process is fed out of the process, which can be stored for further utilization. After the electrolysis reaction, the products comprising electrolyzed Fe powders, C powders, NaOH solution and unreacted oxides are fed out from the electrochemical cell for magnetic separation in the third part, where Fe powders will be separated from other components through a magnetic separator. Thereafter, in the final part, bowl centrifuges are used to separate NaOH solution and unreacted powders. NaOH solution and C powders will be recycled and unreacted remnants will be fed out.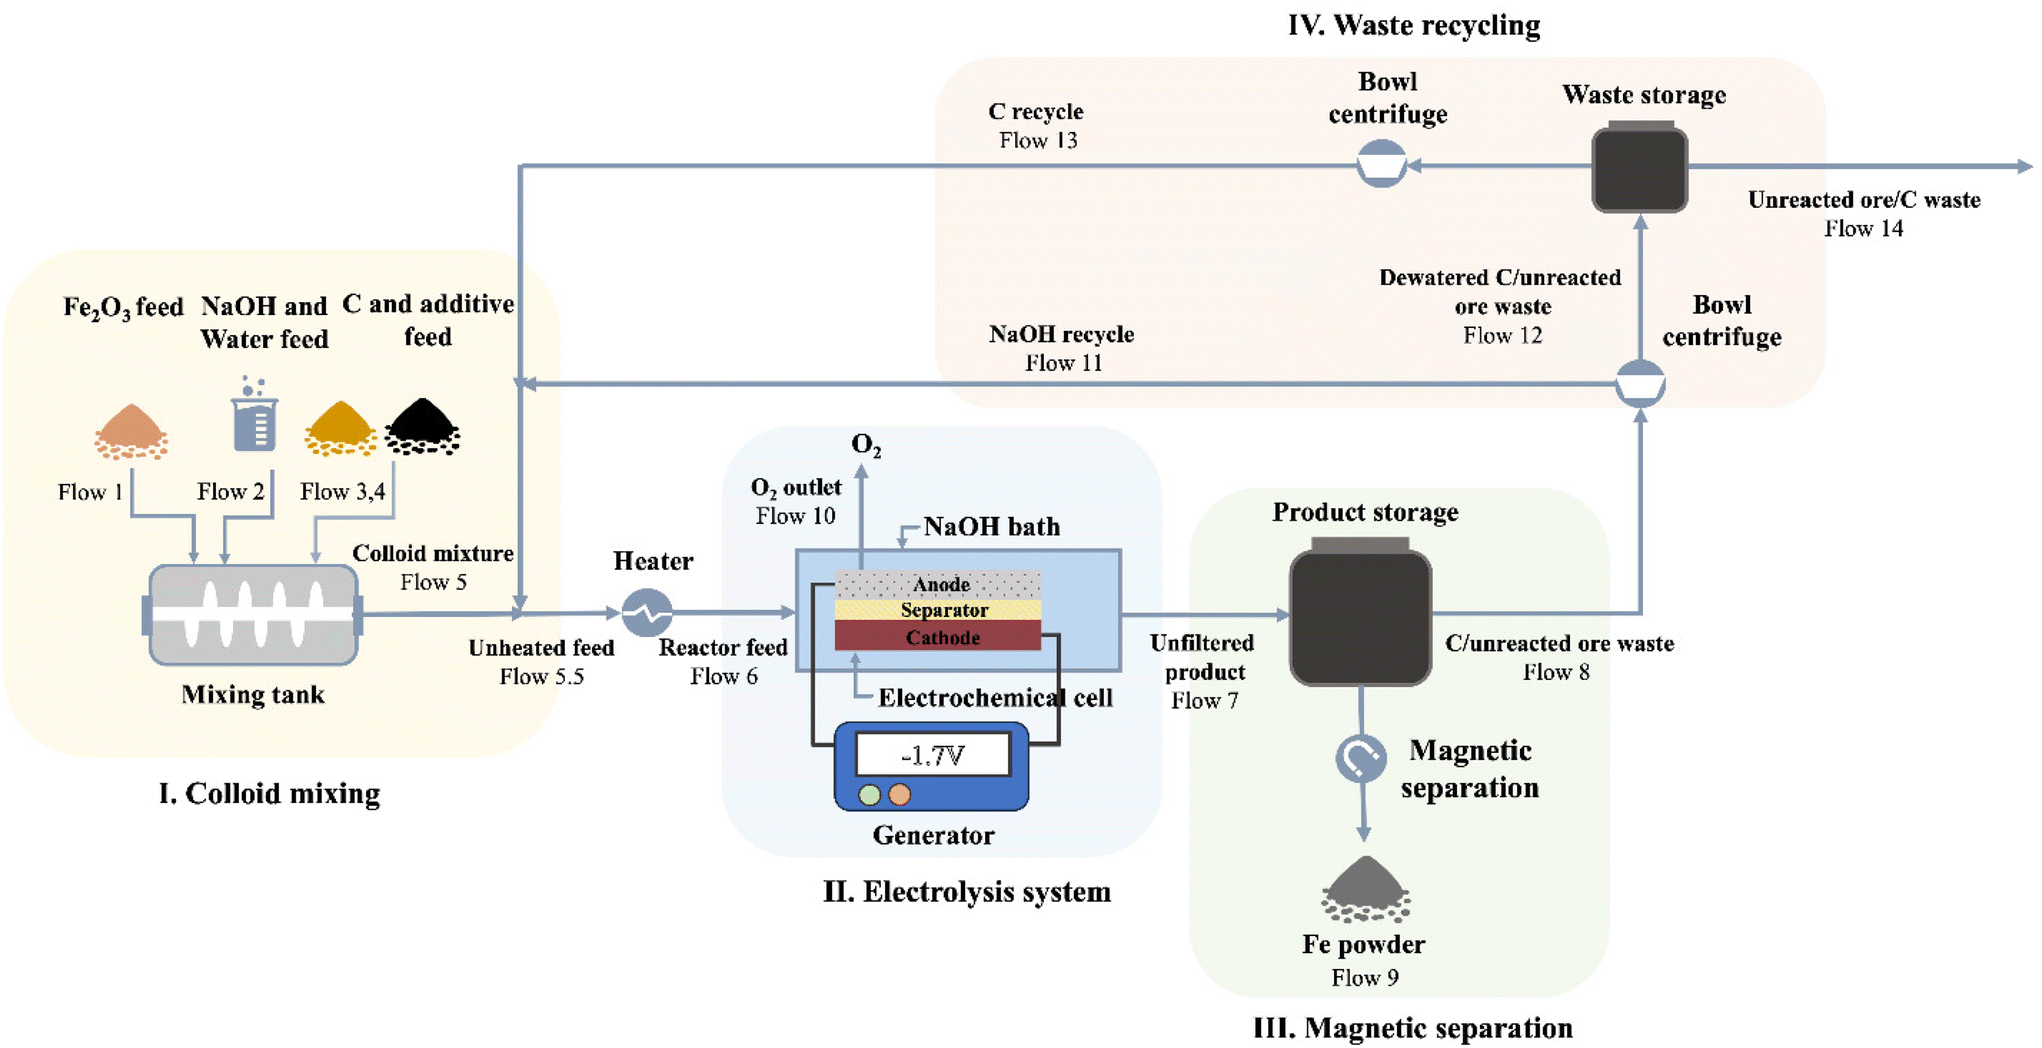 | ||
| Fig. 5 Schematic illustration showing the flow diagram of iron production via the LTE method. | ||
To evaluate the economic value of the process, we performed a techno-economic assessment of the LTE process of Fe production. The economic modelling of Fe production via the LTE process developed by Shahabuddin et al. was adopted to estimate the costs of the process in this work.33 We adopt the study's process scale of 100![[thin space (1/6-em)]](https://www.rsc.org/images/entities/char_2009.gif) 000 tons per year of iron oxide to best leverage economies of scale. The base case scenario used in the analysis is based on the current experimental results in this work, provided in Table S5.† The product cost breakdown is shown in Fig. 6a, and the details are summarized in Table S6.† Considering variable operating costs (VOC), it appears that the cost of iron oxide ore makes up the largest portion of all the costs accounting for 48% as the expenditure of high-Fe2O3-content feedstock has a significant cost in comparison with lower value waste feeds. Meanwhile, the price of electricity also occupies a large proportion, which accounts for 31%. This suggests that the cost of the Fe product produced by the electricity-based process is highly dependent on the costs of iron oxide ore and electricity. As the price of iron ore varies with the Fe2O3 content of the sources, it is the most sensitive parameter to determine the cost of Fe. On one hand, using a high-Fe2O3-content feedstock provides high quality Fe powder in spite of its high cost. On the other hand, there may be a tradeoff between the feedstock cost and purity of Fe powders, if using low-Fe2O3 content ores. In addition, the effects of electrochemically active/inactive impurities on colloid compositions and electrochemical reduction are supposed to be considered for low-grade ore feedstocks. This suggests that, alternatively, utilizing secondary sources that contain a high Fe2O3 content such as Cu tailings or red mud can be a promising remedy to lower the cost of feedstock. Electricity prices can potentially be lowered by managing the operating hours. Other variable costs such as additives, NaOH and C black contribute to only 7% of the product cost since these components can be recycled in the closed-loop process. However, the efficacy of the recycling process may influence the cost of these compositions. Hence, technological advancements in C and NaOH recycling are still needed to achieve the highest efficacy since there is not yet a commercially available carbon recycling process. An appropriate product storage system such as an inert N2 gas or airtight system is supposed to be considered for such large-scale production to prevent fine Fe powder from undesired exposure. In addition, fixed operating costs (FOC) composed of insurance, maintenance, and labor/overhead account for 15% of the production cost.
000 tons per year of iron oxide to best leverage economies of scale. The base case scenario used in the analysis is based on the current experimental results in this work, provided in Table S5.† The product cost breakdown is shown in Fig. 6a, and the details are summarized in Table S6.† Considering variable operating costs (VOC), it appears that the cost of iron oxide ore makes up the largest portion of all the costs accounting for 48% as the expenditure of high-Fe2O3-content feedstock has a significant cost in comparison with lower value waste feeds. Meanwhile, the price of electricity also occupies a large proportion, which accounts for 31%. This suggests that the cost of the Fe product produced by the electricity-based process is highly dependent on the costs of iron oxide ore and electricity. As the price of iron ore varies with the Fe2O3 content of the sources, it is the most sensitive parameter to determine the cost of Fe. On one hand, using a high-Fe2O3-content feedstock provides high quality Fe powder in spite of its high cost. On the other hand, there may be a tradeoff between the feedstock cost and purity of Fe powders, if using low-Fe2O3 content ores. In addition, the effects of electrochemically active/inactive impurities on colloid compositions and electrochemical reduction are supposed to be considered for low-grade ore feedstocks. This suggests that, alternatively, utilizing secondary sources that contain a high Fe2O3 content such as Cu tailings or red mud can be a promising remedy to lower the cost of feedstock. Electricity prices can potentially be lowered by managing the operating hours. Other variable costs such as additives, NaOH and C black contribute to only 7% of the product cost since these components can be recycled in the closed-loop process. However, the efficacy of the recycling process may influence the cost of these compositions. Hence, technological advancements in C and NaOH recycling are still needed to achieve the highest efficacy since there is not yet a commercially available carbon recycling process. An appropriate product storage system such as an inert N2 gas or airtight system is supposed to be considered for such large-scale production to prevent fine Fe powder from undesired exposure. In addition, fixed operating costs (FOC) composed of insurance, maintenance, and labor/overhead account for 15% of the production cost.
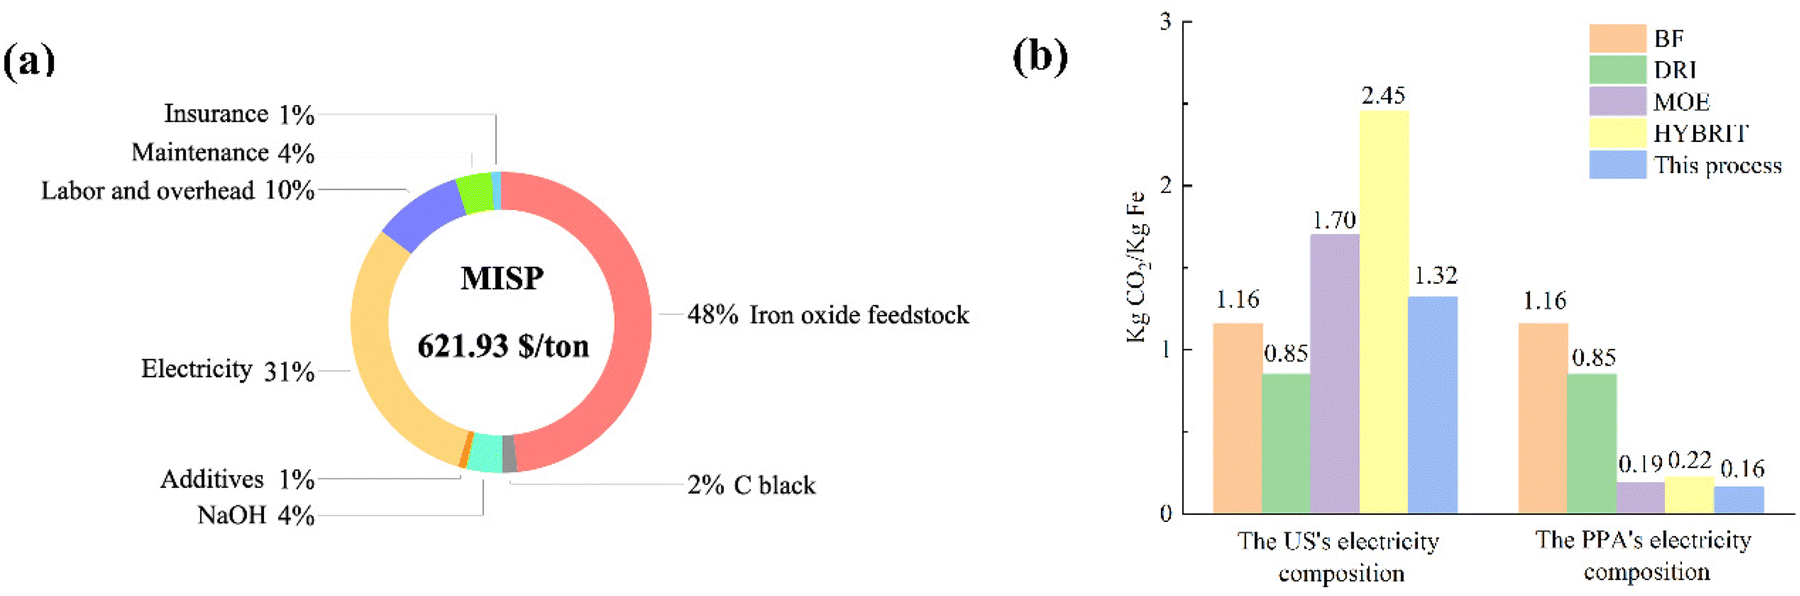 | ||
| Fig. 6 (a) Cost breakdown with MISP. (b) CO2 emission of the proposed LTE process compared to other technologies. | ||
The respective minimum iron selling price (MISP) or the levelized cost is calculated to be 621.93 $ per ton, based on the base case scenario. The price produced by this LTE is comparable to that of hydrogen-based steel production, ranging from 582.18 $ per ton to 722 $ per ton.34,35 Seemingly, the price of Fe powder produced via this process is higher than the market prices of bulk pig iron, which are in the range of $500 to $600.33 Although the price of electrolyzed Fe powder is higher than that of the bulk iron produced by conventional pathways, high purity Fe powder with predictable particle sizes and morphologies could be suitable for markets of additive manufacturing and powder metallurgy.33,36
In terms of energy utilization, the proposed LTE process has an energy loss through cell leads of only 0.104 kW h per kg of Fe produced, which can be determined via the Wiedemann–Franz law using eqn (S10) in the ESI.† The LTE has 9-times lower energy loss through cell leads compared to the high-temperature MOE process, which is also an alternative to iron production with no direct CO2.33 In addition, the LTE does not require a startup heating process like the MOE process. The energy requirement in this developed process is calculated to be 3.19 kW h per kg of Fe produced, which is lower than that of our previously reported LTE of red mud sources (4.76 kW h per kg of Fe produced) and 4.16 kW h per kg of Fe produced for the MOE.33 It should be noted that the energy requirement of the process in this work is based on utilizing higher Fe2O3 contents, higher electrolysis efficiency, and higher separation performance, resulting in less energy consumption, compared to the LTE of red mud colloidal electrodes.
CO2 emission analysis of this technology is also performed by comparison with other current steelmaking technologies such as Fe production using a blast furnace (BF), direct reduction of iron (DRI) using natural gas or H2 gas, molten oxide electrolysis (MOE) and H2 reduction (HYBRIT). The analysis is performed by analyzing the emissions associated with material production and electricity sources (Tables S7 and S8†). The base case scenarios for this analysis are based on a constant operation hour with two different electricity conditions: the reported US's electricity mix and power purchasing agreement (PPA). The US's electricity source is composed of 39.8% natural gas, 19.5% coal, 18.2% nuclear, 10.2% wind, 6.3% hydroelectric, 3.4% solar, 1.3% biomass, 0.9% petroleum, and 0.4% geothermal sources.37 The PPA's electricity is based on 100% electricity from renewable sources that are 50% wind and 50% solar.33 The estimated CO2 emissions from BF and DRI are around 1.16 and 0.85 kg CO2 per kg Fe, respectively.33,38,39 According to Fig. 6b, considering the utilization of a conventional electricity mixture, the electricity-dependent processes (the proposed process, MOE and HYBRIT) emit a slightly larger amount of CO2 compared to the blast furnace and DRI processes. It is worth noting that, however, further purification of pig iron and utilization of fossil fuels in the blast furnace can emit additional CO2, which may result in a higher emission rate in the conventional process. When using the PPA's electricity, all the alternatives see a significant reduction in CO2 emission, which is relatively lower than those of the BF and DRI processes. The proposed LTE technology shows the least CO2 emission, 0.16 kg CO2 per kg Fe. It should be noted that the emissions from MOE and HYBRIT are estimated using only direct CO2 emission and electricity usage in the two processes, while CO2 emissions from other productions such as molten salts and hydrogen sources are not included. Hence, the emissions from the two alternatives could possibly be higher. This analysis suggests that the proposed LTE for Fe production combined with utilizing clean electricity is more environmentally friendly compared to other processes.
Conclusions
In summary, we have demonstrated that the LTE process with a 3D electrically–ionically conductive electrode design can be successfully used to produce high-purity Fe powder (>95%) with high current efficiency (>95%) at a low temperature of 100 °C with no carbon emissions. The utilization of C conductive networks and 3D porous conductive Ni foam as a substrate in this novel LTE process can facilitate the fast reaction rate by increasing the reactive areas and evenly distributing charges on the substrate for the Fe2O3 reduction process. It was also found that the morphology and particle sizes of electrolyzed Fe rely on the sizes of the initial Fe2O3 precursors. The economic analysis of the process reveals that the price of the Fe product highly depends on the costs of Fe2O3 feedstock and electricity. The calculated MISP is 621.93 $ per ton which is comparable to the prices of steels produced by the hydrogen-based method. Moreover, CO2 emission analysis reveals that the process of utilizing clean electricity from renewable sources emits only 0.16 kg CO2 per kg Fe produced, which is much lower than the emissions from the conventional and alternative processes. In addition to Fe, we also demonstrated that this LTE can be used to produce high-purity Ag, Cu, and FeNi alloy powders from their oxides. Altogether, this cleaner and more energy-saving LTE process is a promising technology for metal and alloy production that can potentially be used to replace the conventional process.Data availability
The data supporting this article have been included as part of the ESI.†Conflicts of interest
Parts of the experimental results are under a patent application.Acknowledgements
This work is financially supported by the U.S. Army Research Laboratory through their award #W911NF-22-2-0040. We gratefully appreciate the aid from Prof. Qi Wen at the Department of Physics, Worcester Polytechnic Institute, to conduct the viscosity test.References
- U. D. O. T. Interior, Minerals Yearbook, 2007, V. 3, Area Reports, International, Asia and the Pacific, Government Printing Office, 2010 Search PubMed.
- Q. Wang, Y. Zhu, Q. Wu, E. Gratz and Y. Wang, RSC Adv., 2015, 5, 5501–5507 RSC.
- S. J. Davis, N. S. Lewis, M. Shaner, S. Aggarwal, D. Arent, I. L. Azevedo, S. M. Benson, T. Bradley, J. Brouwer, Y. M. Chiang, C. T. M. Clack, A. Cohen, S. Doig, J. Edmonds, P. Fennell, C. B. Field, B. Hannegan, B. M. Hodge, M. I. Hoffert, E. Ingersoll, P. Jaramillo, K. S. Lackner, K. J. Mach, M. Mastrandrea, J. Ogden, P. F. Peterson, D. L. Sanchez, D. Sperling, J. Stagner, J. E. Trancik, C. J. Yang and K. Caldeira, Science, 2018, 360, eaas9793 CrossRef PubMed.
- D. Wang, A. J. Gmitter and D. R. Sadoway, J. Electrochem. Soc., 2011, 158, E51 CrossRef.
- D. R. Sadoway, J. Mater. Res., 1995, 10, 487–492 CrossRef CAS.
- H. Kim, J. Paramore, A. Allanore and D. R. Sadoway, J. Electrochem. Soc., 2011, 158, E101 CrossRef CAS.
- H. Kim, J. D. Paramore, A. Allanore and D. R. Sadoway, ECS Trans., 2010, 33, 219 CrossRef CAS.
- A. Allanore, L. Yin and D. R. Sadoway, Nature, 2013, 497, 353–356 CrossRef CAS PubMed.
- J. Wiencke, H. Lavelaine, P.-J. Panteix, C. Petitjean and C. Rapin, J. Appl. Electrochem., 2018, 48, 115–126 CrossRef CAS.
- A. Cox and D. J. Fray, J. Appl. Electrochem., 2008, 38, 1401–1407 CrossRef.
- D. Tian, H. Jiao, J. Xiao, M. Wang and S. Jiao, J. Alloys Compd., 2018, 769, 977–982 CrossRef.
- D. Tang, H. Yin, W. Xiao, H. Zhu, X. Mao and D. Wang, J. Electroanal. Chem., 2013, 689, 109–116 CrossRef.
- H. Yin, D. Tang, H. Zhu, Y. Zhang and D. Wang, Electrochem. Commun., 2011, 13, 1521–1524 CrossRef.
- H. Wang and H. Sohn, Metall. Mater. Trans. B, 2013, 44, 133–145 CrossRef.
- H. K. Pinegar, M. S. Moats and H. Y. Sohn, Steel Res. Int., 2011, 82, 951–963 CrossRef.
- M. Choi and H. Sohn, Ironmaking Steelmaking, 2010, 37, 81–88 CrossRef.
- H. Sohn, M. E. Choi, Y. Zhang and J. E. Ramos, Ironmaking Steelmaking, 2009, 6, 158–165 Search PubMed.
- A. Allanore, H. Lavelaine, G. Valentin, J. Birat and F. Lapicque, J. Electrochem. Soc., 2007, 154, E187 CrossRef.
- A. Allanore, H. Lavelaine, G. Valentin, J. Birat and F. Lapicque, J. Electrochem. Soc., 2008, 155, E125 CrossRef.
- A. Allanore, H. Lavelaine, G. Valentin, J. Birat, P. Delcroix and F. Lapicque, Electrochim. Acta, 2010, 55, 4007–4013 CrossRef.
- B. Yuan and G. M. Haarberg, ECS Trans., 2009, 16, 31 CrossRef.
- Y. A. Ivanova, J. Monteiro, L. Teixeira, N. Vitorino, A. Kovalevsky and J. Frade, Mater. Des., 2017, 122, 307–314 CrossRef.
- V. Feynerol, H. Lavelaine, P. Marlier, M.-N. Pons and F. Lapicque, J. Appl. Electrochem., 2017, 47, 1339–1350 CrossRef.
- J. Monteiro, Y. A. Ivanova, A. Kovalevsky, D. Ivanou and J. Frade, Electrochim. Acta, 2016, 193, 284–292 CrossRef.
- M. Tokushige, O. E. Kongstein and G. M. Haarberg, ECS Trans., 2013, 50, 103 CrossRef.
- Q. Wang, B. Fu and Y. Wang, J. Electrochem. Soc., 2017, 164, E428–E433 CrossRef.
- Q. Wang and Y. Wang, ACS Appl. Mater. Interfaces, 2016, 8, 10334–10342 CrossRef.
- D. V. Lopes, A. Kovalevsky, M. Quina and J. Frade, J. Electrochem. Soc., 2020, 167, 102508 Search PubMed.
- Q. Wang and Y. Wang, J. Electrochem. Soc., 2018, 165, A2439–A2445 CrossRef.
- Y. Y. Su and M. Marek, J. Electrochem. Soc., 1994, 141, 940 CrossRef.
- D. Yu, M. Zhu, T. A. Utigard and M. Barati, Miner. Eng., 2013, 54, 32–38 CrossRef.
- M. Bahgat, M.-K. Paek and J.-J. Pak, Mater. Trans., 2007, 48, 3132–3139 CrossRef.
- M. Shahabuddin, A. C. Powell IV and Y. Wang, J. Sustain. Metall., 2022, 8, 900–912 CrossRef.
- A. Bhaskar, R. Abhishek, M. Assadi and H. N. Somehesaraei, J. Cleaner Prod., 2022, 350, 131339 CrossRef CAS.
- F. Rosner, D. Papadias, K. Brooks, K. Yoro, R. Ahluwalia, T. Autrey and H. Breunig, Energy Environ. Sci., 2023, 16, 4121–4134 RSC.
- A. Simchi, Metall. Mater. Trans. B, 2004, 35, 937–948 CrossRef.
- EIA , Electricity in the United States, https://www.eia.gov/energyexplained/electricity/electricity-in-the-us.php, (accessed 1/27, 2024).
- P. Renzulli, B. Notarnicola, G. Tassielli, G. Arcese and R. Di Capua, Sustainability, 2016, 8, 719 CrossRef.
- C. Ramakgala and G. Danha, Procedia Manuf., 2019, 35, 242–245 CrossRef.
Footnotes |
| † Electronic supplementary information (ESI) available. See DOI: https://doi.org/10.1039/d4gc00698d |
| ‡ These authors contributed equally to this work. |
| This journal is © The Royal Society of Chemistry 2024 |