 Open Access Article
Creative Commons Attribution 3.0 Unported Licence
Techno-economic analysis of solid oxide fuel cell-based energy systems for decarbonising residential power and heat in the United Kingdom
Dibyendu
Roy†
,
Samiran
Samanta†
,
Sumit
Roy
 *,
Andrew
Smallbone
and
Anthony Paul
Roskilly
Department of Engineering, Durham University, Durham, DH1 3LE, UK. E-mail: sumit.roy@durham.ac.uk
First published on 15th February 2024
Abstract
This study examines the feasibility of using hydrogen as a clean energy source for residential consumers in the UK through a low-carbon energy hub. Two cases were compared: a solid oxide fuel cell (SOFC) integrated combined heat and power (CHP) system fuelled by natural gas and hydrogen; and a SOFC–heat pump (HP) integrated CHP system fuelled by natural gas and hydrogen. The study used the actual electricity and heating demands of a UK cluster to model the CHP systems. The results indicate that the SOFC-based CHP system with hydrogen as fuel is more energy-efficient than the natural gas-fuelled system, with energetic efficiencies of 92.12% and 66.98%, respectively. The study also found that the system incorporating a heat pump is more economically viable, regardless of the fuel source, with the hydrogen-powered system equipped with a heat pump having a levelised cost of energy (LCOE) of 0.2984 £ per kW h. The study also evaluated the environmental impact of the natural gas-powered SOFC and SOFC–HP systems, with estimated levelised CO2 emissions of 0.308 kg per kW h and 0.213 kg per kW h, respectively. The study's findings provide insights into the potential of hydrogen as a cleaner energy source for residential consumers in the UK and highlight the importance of exploring low-carbon energy alternatives.
1 Introduction
The United Kingdom's government has made a firm commitment to achieve complete decarbonisation of the power system by 2035. Furthermore, it aims to transition to low-carbon energy sources for heating appliances in both residential and commercial buildings.1 In an impressive effort to combat climate change, the UK government has enacted legislation to reach a state of net zero greenhouse gas emissions by 2050.2 This remarkable commitment surpasses previous goals of 80% reduction from 1990 levels.2 To further support this endeavour, the UK government released the Hydrogen Strategy on August 17, 2021,3 followed by the publication of the Heat and Buildings Strategy and Net Zero Strategy on October 19, 2021.4 The Hydrogen Strategy encompasses various key elements, including targets for hydrogen production, consultations regarding hydrogen's role in different sectors, and plans for conducting trials in heating systems, as well as the development of low-carbon hydrogen utilisation in industrial clusters. In line with this, the UK government has also unveiled the Hydrogen Net Zero Investment Roadmap,5 which provides a comprehensive overview of the government's hydrogen policies and the investment opportunities available. This roadmap serves as a showcase for the UK's hydrogen potential, highlighting the nation's ambitious aspirations for the hydrogen economy in achieving net zero emissions. It emphasizes the wide range of investment prospects throughout the hydrogen value chain, spanning from production and transmission to storage, with a particular focus on the diverse applications encompassing power generation, transportation, and heating. Within a Net Zero framework, hydrogen will be generated through two distinct processes. The first involves the production of hydrogen alongside carbon dioxide emissions, which are subsequently captured and stored permanently, known as “blue hydrogen.” The second method entails utilising renewable energy sources to power the electrolysis of water, resulting in the production of hydrogen, termed “green hydrogen”.6In scientific literature, hydrogen production methods are mainly categorised by distinct colours—gray, green, blue, and turquoise.7 For example, gray hydrogen, sourced from steam methane reforming, without the use of carbon capture.8 In contrast, green hydrogen, generated through water electrolysis powered by renewable energy sources, stands out for its sustainability.9 Blue hydrogen strikes a balance by incorporating steam methane reforming with carbon capture and utilisation/storage (CCUS).8 On the other hand, turquoise represents production of hydrogen through methane pyrolysis and solid CO2 storage.7,10
According to 2019 estimates, the heating sector in the UK accounts for one-third of the country's yearly carbon footprint, with buildings accounting for 17% of heating emissions.11 Currently, most homes in the United Kingdom have natural gas boilers for heating. It will be an uphill task to completely replace these natural gas boilers with new hydrogen boilers. Furthermore, there is currently no agreement on the pricing of green hydrogen, as it varies in cost across different geographical locations. The cheapest green hydrogen, for example, is currently available in some Middle Eastern countries. However, at present green hydrogen is significantly more expensive in the United Kingdom than in countries such as Qatar, Saudi Arabia, and the United Arab Emirates.12 So, unless the cost of green hydrogen falls, the affordability of hydrogen boilers will be a concern. The role of green hydrogen will be critical in this energy transition. In this regard, the UK government has pledged a 5 GW low-carbon hydrogen production capacity, which may save 41 MtCO2e in total emissions between 2023 and 2032.1 The cost of green hydrogen in the UK will undoubtedly drop as production capacity for green hydrogen increases. In this scenario, implementing an integrated energy system powered by hydrogen to deliver electricity and heat for the UK community may be an attractive prospect.
Furthermore, in addition to the use of hydrogen, heat networks and heat pump installations will play an essential role in decarbonising heating in UK households.11 Heat pumps are significantly more electrically efficient for heat generation compared to traditional electrical heaters.13 There are two main types of heat pumps: air source14 and ground source.15 Each category of heat pumps includes an outdoor unit housing the compressor and heat exchanger, as well as an indoor unit containing the evaporator and fan. The potential for achieving 100% efficiency in heat pumps is constrained by the fundamental principles of thermodynamics. In heat pump systems, the performance is commonly expressed through the Coefficient of Performance (COP) rather than a direct percentage. For instance, air source heat pumps typically have a COP ranging from 2 to 4, while ground source heat pumps have a COP ranging from 3 to 5.13 This makes heat pumps a much more efficient option for electric heating compared to conventional electric heaters. The capital costs of a heat pump fluctuate based on the specific type and the house size. The average cost for an air source heat pump for a three-bedroom house in the UK is £10![[thin space (1/6-em)]](https://www.rsc.org/images/entities/char_2009.gif) 000.16 Opting for geothermal options comes at a higher price, with a ground source heat pump typically amounting to £24
000.16 Opting for geothermal options comes at a higher price, with a ground source heat pump typically amounting to £24![[thin space (1/6-em)]](https://www.rsc.org/images/entities/char_2009.gif) 000 for horizontal installation or £49
000 for horizontal installation or £49![[thin space (1/6-em)]](https://www.rsc.org/images/entities/char_2009.gif) 000 for a vertical installation with boreholes.16 At present currently, about 35
000 for a vertical installation with boreholes.16 At present currently, about 35![[thin space (1/6-em)]](https://www.rsc.org/images/entities/char_2009.gif) 000 heat pump installations occur annually in the UK,17 mainly among early adopters. Achieving the government's target of 600
000 heat pump installations occur annually in the UK,17 mainly among early adopters. Achieving the government's target of 600![[thin space (1/6-em)]](https://www.rsc.org/images/entities/char_2009.gif) 000 yearly installations by 2028
000 yearly installations by 2028![[thin space (1/6-em)]](https://www.rsc.org/images/entities/char_2009.gif) 17 requires a broader approach. However, the high initial costs of new heat pump systems deter consumers, despite intermittent government grants18 that often don't cover the full system cost. Furthermore, it's crucial to acknowledge that electricity is necessary to operate heat pumps. Unless the electricity powering the heat pumps is sourced from renewable and low-carbon energy technologies, the use of heat pumps for heating is not effective. This is where green hydrogen plays a vital role. If electricity is derived from hydrogen-based technologies, such as fuel cells, heat pump installations for heating will gain much greater significance.
17 requires a broader approach. However, the high initial costs of new heat pump systems deter consumers, despite intermittent government grants18 that often don't cover the full system cost. Furthermore, it's crucial to acknowledge that electricity is necessary to operate heat pumps. Unless the electricity powering the heat pumps is sourced from renewable and low-carbon energy technologies, the use of heat pumps for heating is not effective. This is where green hydrogen plays a vital role. If electricity is derived from hydrogen-based technologies, such as fuel cells, heat pump installations for heating will gain much greater significance.
Fuel cells are electrochemical device and have currently emerged as a prominent hydrogen-based technology, offering superior performance compared to heat engines, primarily due to their salient features like high electrical efficiency. This is partly attributed to the fact that these electrochemical devices bypass the limitations imposed by Carnot efficiency.19 Among fuel cell technologies, solid oxide fuel cells (SOFCs) are distinguished by their operation at high temperatures (500–800 °C),20 making them well-suited for stationary power generation.21 In fact, standalone SOFC applications can achieve impressive efficiencies exceeding 50%.21 Moreover, the high-temperature gas discharged from the SOFC presents an opportunity for waste heat recovery through bottoming cycles, effectively maximizing energy efficiency.
Integrated energy systems-based concepts were previously investigated by many researchers in various parts of the world. For example, Jimenez-Navarro et al.22 investigated the role of centralised combined heat and power (CHP) plants and district heat in the European decarbonised power system and suggested that thermal storage permits the flexible operation of CHP, enhancing overall efficiency. Tahir et al.23 investigated an exergy hub approach to model integrated energy system (IES) to provide electricity, district heating and individual heating facilities in China. Gas turbine, steam turbine, solar-PV, heat pumps and wind turbine-based arrangements were analysed.
Solid oxide fuel cell (SOFC), operating at high temperatures,24 is a very effective energy conversion tool that can transform fuel's chemical energy directly into electrical energy. Due to its high operating temperature, SOFC also produces high-quality heat that may be successfully employed in bottoming cycles to provide useable heat for district heating applications. Many recent studies integrated with SOFC integrated system can be found in the literature. For example, Tan et al.25 reviewed various kinds of SOFC based systems for building applications. They further propose that utilising renewable energy sources or switching to biomass gaseous fuels may improve the outlook for SOFC systems used in buildings.
In another study, Ma et al.26 investigated a CHP system integrating SOFC for supplying electricity and hot water. The energy efficiency of the CHP system was reported to be over 60%. Mei et al.27 proposed a cogeneration system integrating SOFC and thermoelectric generator for electricity production, and absorption heat pump for hot water production. The system was investigated only using energy analysis and system efficiency was reported over 100%. System overall efficiency could reach over 100% if the outputs of the systems are of different quality. Dealing with heat and power together, the exergy analysis might be a superior technique for assessing the system's performance. Zhu et al.28 proposed a combined cooling, heating and power system based on SOFC fuelled by biomass. They reported that the trigeneration system achieved the electrical and overall energy efficiencies of 52% and 75%, respectively. In a separate study, Marocco et al.36 developed SOFC-based cogeneration systems for commercial properties and carried out a thorough techno-economic analysis of the system. The investment cost of SOFC determines the proposed system's profitability. Their research indicates that the SOFC investment cost must be around 1200 € per kW in order for this technology to be profitable with spark spread equal to −0.05 € per kW. Höber et al.37 experimentally investigated diesel fuelled SOFC integrated CHP system and reported that the system could achieve energy efficiency of 42.5%. Li et al.38 investigated SOFC-engine and organic Rankine cycle (ORC) integrated hybrid system with methanol fuel for a marine application and reported exergy efficiency of 58.06% and LCOE of 0.2458 $ per kW h. In a separate study, Zhao et al.39 proposed a hybrid system integrating SOFC, proton exchange membrane electrolyser, ORC and supercritical CO2 cycle employing thermodynamic analysis. They reported the round-trip thermal efficiency and round-trip exergy efficiency of the integrated system of 54.29% and 49.12%, respectively.
There has been some progress in research related to heat pumps and heat networks. For example, Gillich et al.40 investigated performance analysis of a 5th generation heat network in UK context, at two buildings on the London South Bank University campus where high temperature heat pumps were retrofitted to an existing gas boiler and matched 79 °C output temperature to maintain a high coefficient of performance (COP).
Table 1 summaries the SOFC integrated recent previous studies. Previous simulation-based studies shows that SOFC based systems yield higher efficiency. However, a thorough economic study is necessary to compare SOFC integrated cogeneration with other competing technologies and to implement such systems in the future. Additionally, the operation of an SOFC-integrated system with the actual electricity and heating demands of a community has not been previously investigated. This study pushes the boundaries of conventional energy solutions by examining the feasibility of utilising hydrogen as a source of heat and electricity for residential end-users in the United Kingdom through the implementation of a low-carbon energy hub. The paper's focus is on the comparison of the techno-economic performance of hydrogen-based SOFC systems to traditional natural gas-based configurations. This study is innovative in its approach as it investigates two different case studies using a techno-economic analysis, and real electricity and heating demand data from a cluster in the UK. The first case study evaluates an SOFC integrated CHP system fuelled by either natural gas or hydrogen. The second case study investigates an SOFC–heat pump integrated CHP system fuelled by either natural gas or hydrogen. Furthermore, this study provides a comprehensive evaluation of the environmental viability of natural gas-fuelled SOFC and SOFC–heat pump systems. The SOFC based CHP systems were run based on a cluster's monthly power and heating usage in the United Kingdom. To the best of the authors’ knowledge, this is the first study of its kind based on the actual electricity and heating demands of a locality in the UK. This study stands out as unique in its exploration of the potential of hydrogen as a source of clean energy and its practicality in a real-world setting.
| Ref. | System | Product | Methods | Important findings |
|---|---|---|---|---|
| 26 | Biogas fuelled SOFC-system | Power | Energy analysis | Overall energy efficiency archives over 60% |
| 27 | NG fuelled SOFC-TEG-absorption HP integrated system | Power and heat | Energy analysis | Heat-to-power ratio ranging from 0.89–5.18 |
| 28 | Biomass based SOFC-HCCI engine-absorption chiller integrated system | Electricity, heat and cooling | Energy, exergy and economic analyses | Maximum overall efficiency = 75% |
| Maximum net electrical efficiency = 52% | ||||
| Minimum total annual cost = 410 k$ | ||||
| 29 | Biogas fuelled SOFC based CHP system | Power and heat | Energy analysis | Overall electrical efficiency: 55.6% |
| Overall energy efficiency: 85% | ||||
| 30 | SOFC based CHP system fuelled by different fuels | Power and heat | Energy analysis | Maximum net electrical efficiency was for methane (58.1%), followed by diesel (57.6%), and ammonia (55.1%) |
| 31 | Methane fuelled SOFC-water heater-absorption chiller | Power, heat, cooling | Exergy and economic analyses | Exergy efficiency: 37.8% |
Unit price of electricity: 29![[thin space (1/6-em)]](https://www.rsc.org/images/entities/char_2009.gif) 665 $ per GJ 665 $ per GJ |
||||
| 32 | Biomass and green hydrogen fuelled SOFC CHP system | Power and heat | Thermodynamic analysis and dynamic simulation | 30% hydrogen injection to syngas lead 58% reduction could CO2 emission be achieved |
| 33 | Photovoltaic panel with SOFC | Power | Technoeconomic analysis | Minimum LCOE: $0.11 per kW h |
| 34 | Biomass fuelled SOFC coupled with ground source heat pump | Power and heat | Energy and exergy analyses | Maximum thermal efficiency = 67.3% and exergy efficiency = 29.2% |
| 35 | Biomass based SOFC coupled with externally fired gas turbine and HRSG | Power and heat | Exergy and economic analyses | Maximum exergy efficiency = 46.58%, minimum LCOE: 0.0454 $ per kW h |
2 Materials and methods
2.1 Energy demand of a cluster
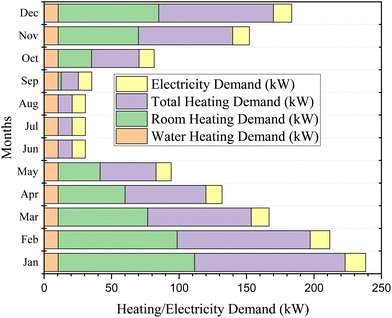
To decarbonise the power and heating in the UK, a cluster with 36 number of houses were chosen. The electrical and heating demands of the residential houses are derived from a report65 by the Department for Energy Security and Net Zero and Department for Business, Energy & Industrial Strategy, United Kingdom, and are scaled accordingly. Fig. 1 shows the total heat demand, water heating demand, room heating demand, and electricity demand separately for the proposed cluster for each individual month throughout the whole year. It can be seen from Fig. 1 that there was no requirement for room heating demand for the months of June, July, and August. This also commensurate well with the general trend of the UK's normal public lifestyle. For those three months, the total heat demand is assumed to be the heating demand other than the room heating, predominantly the water heating demand, and others. The room heating demand for the other months of the year has been estimated by subtracting the average total heat demand of June, July, and August from the total heat demand of each individual month. Thus, once the required room heating demand and the water heating demand and electricity demand of the proposed cluster for each individual month have been estimated with suitable assumptions, these data have been utilised for the sizing of the proposed CHP system. We have considered an additional 15% energy requirement for the cluster contemplating extreme weather days throughout the year.2.2 Case studies
Two case studies were investigated as a low-carbon energy hub to decarbonise the chosen cluster's heating and electricity requirements:(1) SOFC CHP system fuelled by (a) natural gas and (b) hydrogen,
(2) SOFC–HP CHP system fuelled by (a) natural gas and (b) hydrogen.
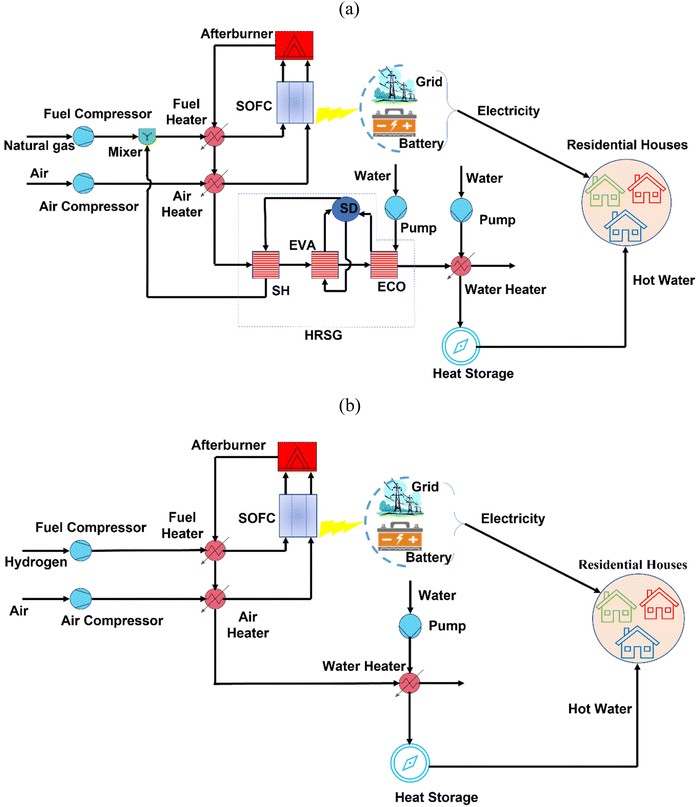
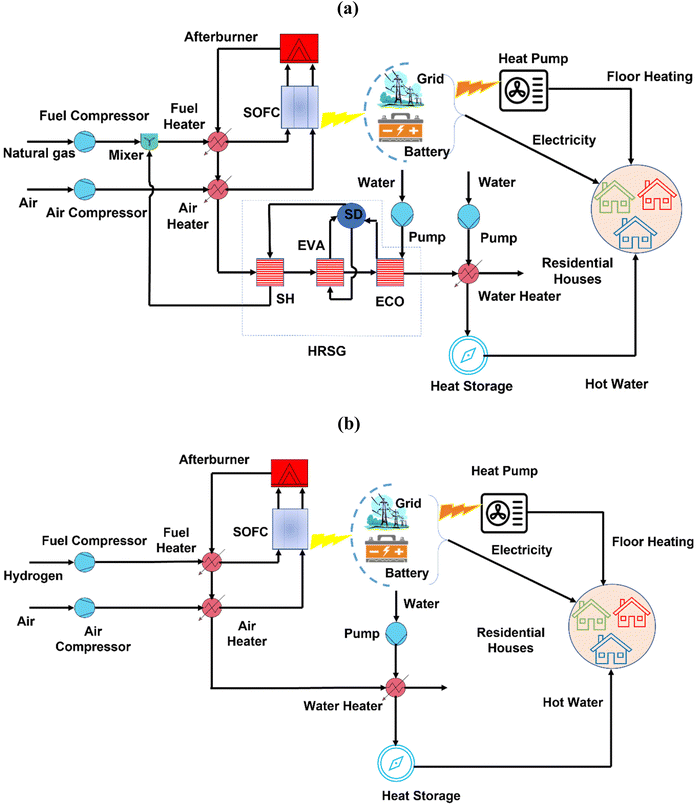
The schematics for these proposed systems are depicted in Fig. 2 and 3. The schematic in Fig. 2(a) depicts the configuration of the natural gas-fuelled cogeneration system that integrates SOFC module in the topping cycle for power production, a heat recovery steam generator (HRSG) for the required steam production for the reforming reaction in the fuel cell, and a water heater for the hot water production in the bottoming cycle. The hot water is produced using the waste heat from the SOFC module and then supplied to the district heating network. The hot water supply temperature is set at 80 °C, and the return temperature is set to 25 °C. In this study, a SOFC model with an internal reforming type was considered. The internal SOFC model takes the following chemical reactions into consideration:41
| CH4 + H2O → CO + 3H2 ΔH = +206.0 kJ mol−1 | (1) |
| CO + H2O → CO2 + H2 ΔH = −41 kJ mol−1 | (2) |
| H2 + 0.5O2 → H2O ΔH = −242.0 kJ mol−1. | (3) |
 | ||
| Fig. 3 Schematic of SOFC and heat pump integrated CHP system fuelled by (a) natural gas and (b) hydrogen. | ||
Fig. 2(b) depicts the hydrogen-fuelled SOFC CHP system. Unlike the previous system, the hydrogen SOFC does not require fuel reforming. Therefore, the hydrogen-based system does not need steam in the SOFC, and only the HRSG component is not integrated. The functioning of the hydrogen-based SOFC CHP system is identical to that of the NG-fuelled system; the only difference is that HRSG was not incorporated.
Similarly, the schematic of the proposed NG based CHP system combining SOFC, heat pump (HP), HRSG, and a water heater is shown in Fig. 3(a). It is important to note that the heat pumps are considered to be installed in the houses, and the required electricity to drive the heat pumps is supplied by the SOFC. It is considered that the heat pumps supply the heat required for the space heating, and the hot water that is supplied to the houses is provided by the water heating facility integrated with the bottoming cycle in the CHP system. Similar to Fig. 2(a), the SOFC requires steam for internal reforming operations, thus HRSG is integrated with the system. A hydrogen-fuelled SOFC–HP system is depicted in Fig. 3(b). The operation of the hydrogen-based configuration is like that of the NG-fuelled system; only HRSG was not integrated.
2.3 Solid oxide fuel cell
A solid oxide fuel cell operates at high temperatures ranging from 700–1100 °C. Various types of fuel, viz., methane, syngas, NH3, biogas, etc., can be used as fuel in SOFC. In this work, SOFC was operated with both natural gas and hydrogen separately.The current flow through SOFC can be estimated as follows:42
 | (4) |
However, only a part of the fuel is transformed at the fuel cell. The fuel utilisation factor (UF) is defined by the relation provided below:
 | (5) |
The following equation may be used to calculate the SOFC voltage:43
 | (6) |
The following equation is used to calculate how much power the SOFC stack produces.
| ẆSOFC = NSOFC × j × ASOFC × VSOFC × ηinv | (7) |
The results of the current SOFC model were validated using the experimental findings of Singhal.44 with hydrogen as fuel. Fig. 4a indicates that with a maximum error of 3.7%, the SOFC model findings fit the experimental data44 satisfactorily. Furthermore, the results of the present SOFC model are also compared and presented in Fig. 4b, alongside the numerical model by Chitgar et al.45 and experimental data from Tao et al.,46 all using CH4 as the fuel. The maximum errors are estimated to be 1.45% and 5%, respectively, when compared to the numerical model by Chitgar et al.45 and the experimental data by Tao et al.46
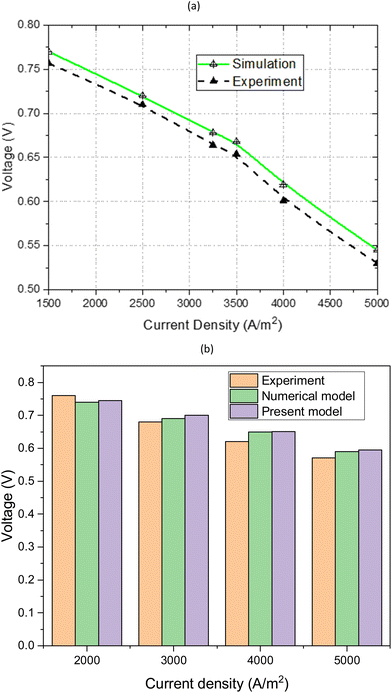 | ||
| Fig. 4 (a) Comparison of model and experimental data for a single cell of SOFC fuel cell using 1000 °C with 89% H2 and 11% H2O as fuel. (b) Comparison of present model, numerical model45 and experimental data,46 with CH4 as fuel. | ||
2.4 Exergy analysis
Exergy analysis is an effective tool to estimate efficiency of a system, considering irreversibilities that occur within the system.47 As shown below, it is considered that the exergy (Ex) value of each stream is the summation of its physical and chemical exergy48| Ex = Exphy + Exche | (8) |
 | (9) |
![[h with combining macron]](https://www.rsc.org/images/entities/i_char_0068_0304.gif) , and
, and ![[s with combining macron]](https://www.rsc.org/images/entities/i_char_0073_0304.gif) represent molar flowrate, specific enthalpy, and specific entropy, respectively. The subscript 0 indicates the reference state (T0 = 25 °C and P0 = 101.325 kPa).
represent molar flowrate, specific enthalpy, and specific entropy, respectively. The subscript 0 indicates the reference state (T0 = 25 °C and P0 = 101.325 kPa). | (10) |
 , and yj are universal gas constant, standard chemical exergy, and molar fraction of the jth composition of the gas mixture, respectively.
2.5 Economic analysis
Table 2 shows the primary input data needed for the economic analysis.| Parameter | Value | Unit | Ref. |
|---|---|---|---|
| Years of operation (yr) | 30 | years | 49 |
| Yearly hours of operation (H) | 8000 | hours | 50 |
| Capital utilisation (UCCAP) | 85 | % | 51 |
| Cost of natural gas (CNG) | 7.21 | p per kW h | 52 |
| Cost of hydrogen (Chydrogen) | 17.57 | $ per kg | 12 |
| Annual interest rate (in) | 3 | % | 53 and 54 |
| Multiplication factor for total overnight cost (MFTOC) | 20.20 | % | 55 |
| Multiplication factor for total plant cost (MFTPC) | 52.5 | % | 55 |
| Multiplication factor for procurement, construction, and engineering cost (MFPC) | 9 | % | 55 |
Yearly expenditure (YE) is estimated by the following relation.
| YE = TACC + O&M + YRC + ACF | (11) |
The total annual capital cost (TACC) is estimated by the following relation55
| TACC = NCAC × (1 + MFPC) × (1 + MFTPC) × (1 + MFTOC) × CRF | (12) |
The net capital cost (NCAC) is calculated by summing the capital costs of all the proposed system's components, as shown below.56
 | (13) |
The capital recovery factor (CRF) is determined by the equation provided below.57
 | (14) |
Table 3 provides the cost functions of various components. Chemical Engineering Plant Cost Index (CEPCI) was used to update the equipment cost functions. The equipment cost of its ith component was updated using the equation below.60
 | (15) |
| Component | Cost function | CEPCI (ref. year) | Ref. |
|---|---|---|---|
| SOFC | CAPSOFC = ASOFC(2.96Tcell − 1907) | 395.6 (2002) | 58 |
| SOFC inverter |

|
395.6 (2002) | 58 |
| Afterburner |

|
368.1 (1994) | 58 |
| Air compressor | CAPAC = 1516.5 × (WAC)0.67 | 402.3 (2003) | 59 |
| Fuel compressor | CAPFC = 1516.5 × (WFC)0.67 | 402.3 (2003) | 59 |
| Heat exchanger | CAPHEX = 3 × 130 × (area/0.093)0.78 | 468.2 (2005) | 58 |
| HRSG |

|
376.8 (1996) | 60 |
| Pump |

|
394.1 (2000) | 61 |
| f n = 1 + (0.2/(1 − η)) |
2.6 Performance indicators
The overall energy efficiency of the system is estimated by the following equation: | (16) |
![[Q with combining dot above]](https://www.rsc.org/images/entities/i_char_0051_0307.gif) net represent the overall power output and heat production of the system, respectively. The lower heating value of the fuel and input fuel flow rate are denoted as LHVfuel and ṁfuel, respectively.
net represent the overall power output and heat production of the system, respectively. The lower heating value of the fuel and input fuel flow rate are denoted as LHVfuel and ṁfuel, respectively.
The electrical efficiency of the system is estimated as
 | (17) |
The system's exergy efficiency is estimated by the following equation.
 | (18) |
The levelised cost of energy was calculated using the equation shown below.62
 | (19) |
3 Results and discussion
3.1 Case study 1
The monthly analysis of the SOFC-based CHP system fuelled by natural gas, as depicted in Fig. 5(a), provides insightful data on its energy efficiency, electrical efficiency, heating efficiency, and exergy efficiency. Notably, the month of January emerges as a period of exceptional performance. Achieving a maximum energy efficiency of 66.98%, exergy efficiency of 45.27%, and electrical efficiency of 44.38%, this particular month sets an impressive benchmark for the system's capabilities. Moreover, the heating efficiency remains consistent at 22.6% throughout the entire year, as evidenced by the data in Fig. 5(a).The monthly performances of energy efficiency, exergy efficiency, electrical efficiency, and heating efficiency of the SOFC-based CHP system operating on hydrogen are estimated and depicted in Fig. 5(b). The study also reveals that the maximum energy efficiency, exergy efficiency, and electrical efficiency were obtained at 92.12%, 61.38%, and 56.49%, respectively, in the month of January. Moreover, the heating efficiency remains at an impressive 35.6% throughout the entire year, as observed in Fig. 5(b). These results underscore the system's outstanding capabilities and its competitive edge in the field.
The capacity utilisation of the proposed SOFC–natural gas driven system is meticulously analysed on a monthly basis and presented in Fig. 6(a), considering the electrical and heating requirements of the cluster. January emerges as the month of peak demand for electricity and heating, as evident from Fig. 6(a) showcasing the system's ability to effectively meet these needs. Remarkably, the capacity utilisation for heating and electricity reaches maximum values of 86.96% and 86.66% respectively in January, demonstrating the system's optimal performance during this period. Conversely, during the months of June to August, the system operates at minimum capacity utilisation, with values as low as 8.12% for heating and 7.62% for electricity. These findings exemplify the system's ability to adapt to varying demands throughout the year, showcasing its competitiveness in managing the cluster's energy requirements.
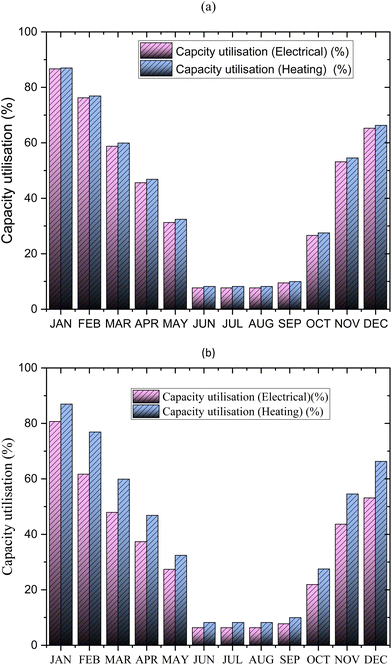 | ||
| Fig. 6 Capacity utilisation of the proposed SOFC-based system on monthly basis fuelled by (a) NG, (b) hydrogen. | ||
Similarly, for the hydrogen-fuelled configuration, Fig. 6(b) presents the monthly capacity utilisation of the cluster for electrical and heating requirements. Once again, January stands out as the month with the highest demand, highlighting the system's exceptional capabilities. Achieving a maximum capacity utilisation of 86.95% for heating and 80.70% for electricity, this configuration proves its efficiency and competitiveness. On the other hand, the months of June to August witness the lowest capacity utilisation, with values as low as 8.11% for heating and 6.25% for electricity. These results underscore the system's adaptability and effectiveness in addressing the cluster's energy needs throughout the year.
Furthermore, considering the power and heating demand requirements, the sizing of a crucial system component, the SOFC, is meticulously conducted for both the natural gas and hydrogen-fuelled systems. Fig. 7(a) illustrates the total area requirement of the SOFC module for the natural gas-based system, with an estimated value of 211.5 m2. In January, the system achieves 100% utilisation of the SOFC module's area, while the area requirement varies in other months depending on the cluster's power demand. In practice, certain stacks of the SOFC module may be deactivated to reduce the area occupied by the module. The power-to-area ratio for the natural gas-based system remains consistent at 1.52 kW m−2 throughout the year.
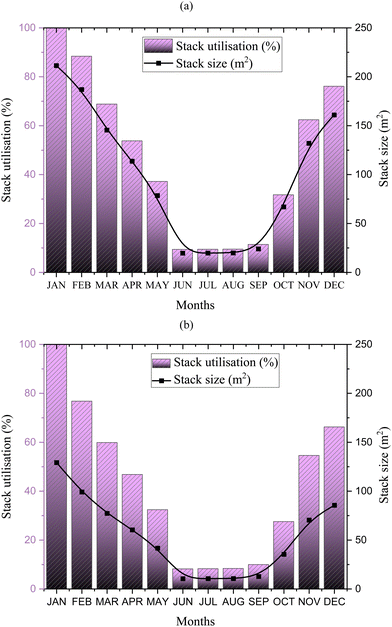 | ||
| Fig. 7 SOFC stack utilisation based on monthly requirement for (a) NG based system (b) H2 based system. | ||
For the hydrogen-fuelled system, Fig. 7(b) reveals a total area requirement of 129.2 m2 for the SOFC module. Similar to the previous system, the area utilisation of the hydrogen-fuelled SOFC module reaches 100% in January, with variations in other months based on power demand. The power-to-area ratio for the hydrogen-based configuration remains relatively constant at 2.12 kW m−2 throughout the year. These results provide valuable insights into the sizing and efficiency of the SOFC module, showcasing the competitiveness and suitability of both the natural gas and hydrogen-fuelled systems for the cluster's power and heating demands.
Fig. 8 presents a highly informative comparison between the levelised cost of energy (LCOE) for the two scenarios under consideration. Notably, the hydrogen and natural gas systems exhibit distinct disparities in terms of LCOEs, thereby highlighting their competitive landscape. The estimates reveal that the natural gas system boasts an LCOE of 0.167 £ per kW h, while the hydrogen-powered system impressively achieves an LCOE of 0.527 £ per kW h.
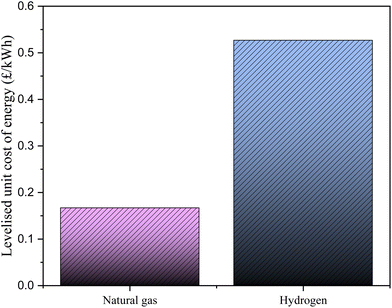 | ||
| Fig. 8 Comparison of LCOE of the SOFC integrated CHP system fuelled by natural gas, and by hydrogen. | ||
Of particular significance is the substantial difference between the two LCOEs, with the hydrogen system exceeding three times the cost of its natural gas counterpart. Such findings shed light on the current challenges associated with the integration of green hydrogen into power and heating production. Despite its potential as a sustainable energy source, the relatively high LCOE of the hydrogen system poses a significant hurdle to its widespread adoption.
To ensure the economic viability and competitiveness of green hydrogen, it is imperative for the cost of production to experience a significant reduction in the foreseeable future. Only by attaining a substantial decrease in the cost of green hydrogen can its potential as a viable alternative to natural gas be fully realized in power and heating production. This realisation emphasizes the need for ongoing research, development, and investment in order to unlock the cost-effective and competitive utilisation of green hydrogen in the energy sector.
3.2 Case study 2
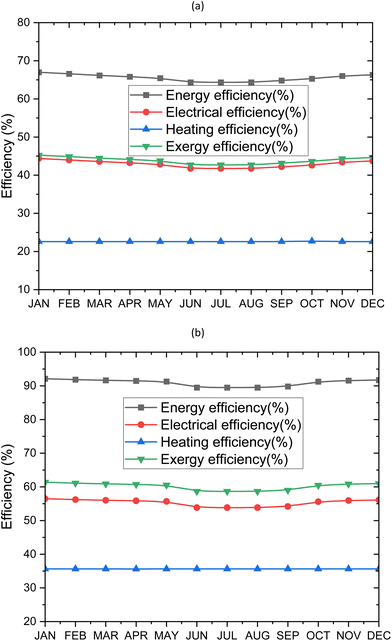
The integration of a heat pump with SOFC-CHP system, powered by natural gas, has been thoroughly evaluated, with the energy efficiency, electrical efficiency, heating efficiency, and exergy efficiency calculated for each month of the year. These insightful results are visually represented in Fig. 9(a), allowing for a comprehensive analysis. Notably, November emerges as a month of exceptional performance, boasting maximum energy efficiency, electrical efficiency, and exergy efficiency values of 65.88%, 43.41%, and 43.28% respectively. Furthermore, the heating efficiency remains consistently reliable, maintaining a steady performance of 22.6% throughout the entire year.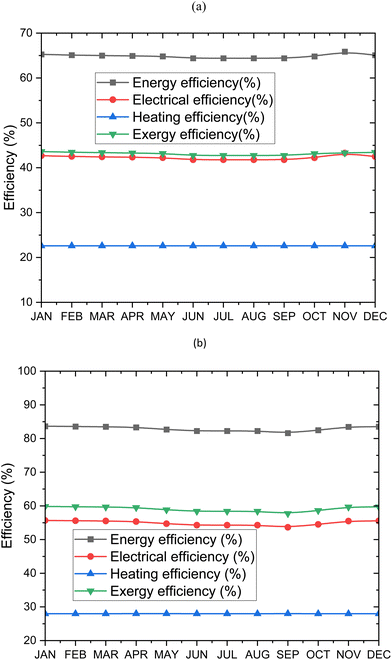 | ||
| Fig. 9 Efficiency of the SOFC–heat pump-based system on monthly basis fuelled by (a) NG (b) hydrogen. | ||
Shifting our focus to the integration of the SOFC with a heat pump CHP system powered by hydrogen, Fig. 9(b) presents a month-by-month estimation of energy efficiency, electrical efficiency, heating efficiency, and exergy efficiency. It can be observed that the system achieved its peak efficiences in January. The month of January showcases highest energy efficiency, electrical efficiency, and exergy efficiency values of 83.65%, 59.83%, and 55.67% respectively, as highlighted in Fig. 9(b). This exceptional display of efficiency reinforces the system's superiority during this specific month. Similar to the natural gas scenario, the heating efficiency remains constant throughout the year, with a reliable performance level of 27.98% as observed in Fig. 9(b). These findings provide valuable insights into the performance of the SOFC integrated with a heat pump CHP system, both for natural gas and hydrogen configurations. The results underscore the system's ability to deliver impressive energy, electrical, and exergy efficiencies, while maintaining consistent heating efficiency.
Fig. 10(a) provides a detailed insight into the monthly fluctuations in capacity utilisation of the proposed SOFC coupled with heat pump CHP system, powered by natural gas. This data is derived from an analysis of the electricity and heating demands of the cluster, ensuring accurate representation. Remarkably, January stands out as the month with the highest electricity and heating demands, as evidenced in Fig. 10(a). During this peak period, the system demonstrates exceptional capacity utilisation, reaching impressive levels of 86.96% for heating and 86.66% for electricity. This exemplifies the system's ability to effectively meet and satisfy the significant energy needs of the cluster during the demanding month of January.
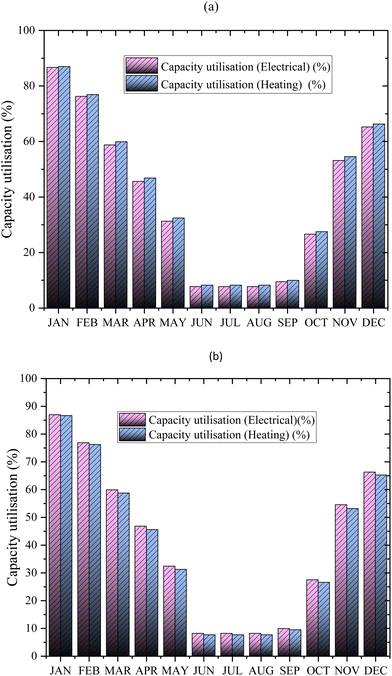 | ||
| Fig. 10 Capacity utilisation of the proposed SOFC–heat pump based system on monthly basis fuelled by (a) NG, (b) hydrogen. | ||
Conversely, the system's capacity utilisation experiences a notable decline during the months of June to August, with minimum levels observed. During this period, the capacity utilisation reaches a minimum of about 8.12% for heating and 7.62% for electricity, as demonstrated in Fig. 10(a). These results underscore the system's flexibility and adaptability, as it efficiently adjusts to the lower energy demands during the summer months.
Similarly, for the hydrogen-fuelled configuration, Fig. 10(b) showcases the variation in capacity utilisation of the cluster for electrical and heating requirements. Once again, January emerges as the month with the highest energy demands, and the system excels in addressing these needs. The capacity utilisation for heating and electricity reaches maximum levels of approximately 86.66% and 86.96% respectively, highlighting the system's remarkable performance during this critical period.
During the months of June to August, characterised by reduced energy demands, the capacity utilisation experiences a decline. The minimum capacity utilisation values are observed to be around 7.62% for heating and 8.12% for electricity, as illustrated in Fig. 10(b). This showcases the system's ability to efficiently adapt to lower energy requirements, ensuring optimal resource allocation and maintaining competitive efficiency levels.
These findings emphasise the system's versatility and its competitive advantage in meeting the dynamic energy demands of the cluster. The ability to achieve high-capacity utilisation during peak demand periods and efficiently scale down during low-demand periods highlights the system's effectiveness in managing energy needs while maintaining competitiveness throughout the year.
Based on the requirements of power and heating demands, the sizing of the important component of the system, SOFC, has been done for both NG and hydrogen fuelled SOFC coupled with a heat pump CHP system. For NG fuelled system, the total maximum area requirement of the SOFC module is estimated to be 64 m2, to satisfy the highest demand (both electricity and heat) in the month of January. As shown in Fig. 11(a) in the month of January, the system utilises 100% of the area of the SOFC module, and in other months, the area requirement of the SOFC decreases, depending upon the power and heat energy demands of the cluster. In practice, it has been projected that some stacks of the SOFC module will not be operated to decrease the area of the SOFC module. Sizing of the SOFC module in terms of power to area ratio for the twelve months also done. It is found that for NG based system, the highest power to area ratio is estimated to be 1.54 kW m−2, in the month of January and that remains the same for the rest of the months of the calendar year. Only the requirements of the SOFC stack area varies with the variation in the energy demand of the different months. For hydrogen-based system, the total area requirement of the SOFC module is estimated to be 40.6 m2, to satisfy the highest demand (both electricity and heat) in the month of January. As shown in Fig. 11(b) in the month of January, the system utilises 100% of the area of the SOFC module, and in other months, the area requirement of the SOFC decreases, depending upon the power and heat energy demands of the cluster. It is found that the power to area ratio for hydrogen-based configuration remained same at 2.12 kW m−2 throughout the year.
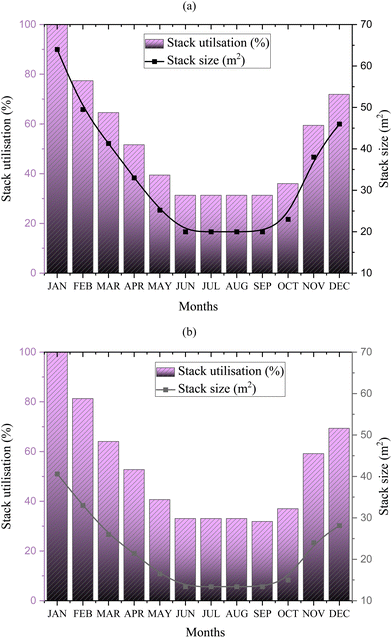 | ||
| Fig. 11 SOFC stack utilisation based on monthly requirement for SOFC–heat pump fuelled by (a) NG (b) H2. | ||
Fig. 12 presents a comprehensive comparison of the LCOE for the SOFC coupled with heat pump CHP system, considering both natural gas and hydrogen fuel sources. The calculations reveal significant disparities in the LCOE values between the two systems, highlighting their competitive dynamics. The LCOE for the natural gas-powered system is estimated to be 0.099 £ per kW h, while the hydrogen-powered system exhibits a substantially higher LCOE of 0.2984 £ per kW h. It is important to note that the LCOE of the hydrogen system surpasses three times or more that of the natural gas-powered system, as depicted in Fig. 12. This considerable cost differential emphasises the challenges associated with the widespread adoption of green hydrogen in power and heating production. The current cost of green hydrogen remains a significant barrier, hindering its economic feasibility and competitiveness. To fully harness the potential of green hydrogen in power and heating production, it is imperative for the cost of producing green hydrogen to undergo a substantial reduction in the near future. Only with a significant cost decrease can green hydrogen become a viable and competitive alternative to natural gas. This underscores the urgent need for continued research, development, and investment in green hydrogen technologies to drive down costs and pave the way for its widespread adoption.
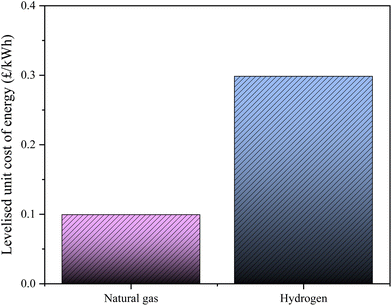 | ||
| Fig. 12 Comparison of LCOE of the SOFC–heat pump integrated CHP system fuelled by natural gas, and by hydrogen. | ||
While green hydrogen presents immense potential as a clean energy source, its current cost challenges necessitate ongoing efforts to enhance its economic viability. By striving to reduce the cost of green hydrogen, we can unlock its competitive advantage, thereby fostering its integration into power and heating production and realising the environmental benefits it offers.
3.3 Environmental performance assessment
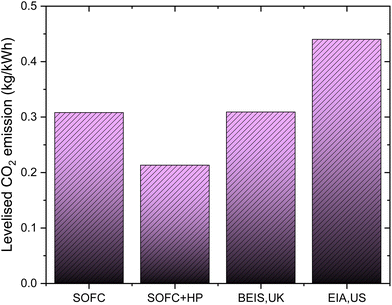
It is crucial to compare the emission performance of the natural gas systems with existing literature. Fig. 13 compares the levelised CO2 emissions from natural gas-fuelled SOFC and SOFC–HP systems with available literature. The UK's Department for Business, Energy, and Industrial Strategy (BEIS) reports that CO2 emissions from home energy usage are 0.309 kg per kW h.63 Meanwhile, the US Energy Information Administration (EIA) states that CO2 emissions from natural gas-based electricity production are 0.44 kg per kW h.64 The estimated levelised CO2 emissions for a natural gas fuelled SOFC system are 0.308 kg per kW h, while those for an SOFC system with a heat pump are 0.213 kg per kW h. The results of the investigation indicate that the natural gas-fuelled systems have lower emissions compared to the emissions reported by BEIS and EIA.4 Conclusion
This study explores the potential of green hydrogen in achieving the United Kingdom's ambitious goal of net-zero emissions by 2050. The research focuses on assessing the feasibility of employing green hydrogen for heat and electricity provision at a local scale in the UK, with a particular emphasis on techno-economic evaluations of hydrogen-based solid oxide fuel cell (SOFC) systems. These evaluations aim to compare the performance of these systems to conventional natural gas-based configurations.Two distinct case studies were undertaken using technoeconomic analysis. The first case involved SOFC-integrated combined heat and power (CHP) systems fuelled by both natural gas and hydrogen, while the second case examined SOFC–Heat Pump (HP) integrated CHP systems with the same fuel options. Additionally, the environmental viability of natural gas-fuelled SOFC and SOFC–HP systems was studied.
To model the SOFC-based cogeneration systems, the actual electricity and heating demand of a UK cluster were incorporated. The findings from the two case studies are as follows:
SOFC-based CHP system:
• In January, the hydrogen-fuelled system demonstrated its highest efficiencies, with energy efficiency, exergy efficiency, and electrical efficiency improving by 25.14%, 16.11%, and 12.11%, respectively, compared to the natural gas-fuelled system.
• Capacity utilisation for heating and electricity was highest in January, reaching 86.96% and 86.66% respectively for the natural gas system, and 86.95% and 80.70% respectively for the hydrogen system.
• The levelised cost of energy (LCOE) was estimated at 0.167 £ per kW h for the natural gas system and 0.527 £ per kW h for the hydrogen system.
• The estimated levelised CO2 emissions from the natural gas fuelled SOFC system were 0.308 kg per kW h.
SOFC–HP CHP system:
• The hydrogen-fuelled systems demonstrated their highest efficiencies in January, showing improvements of 17.77%, 16.42%, and 12.39% in energy efficiency, exergy efficiency, and electrical efficiency, respectively, compared to natural gas-based systems.
• Capacity utilisation for heating and electricity was highest in January, reaching 86.96% and 86.66% respectively for the natural gas system, and 86.66% and 86.96% respectively for the hydrogen system.
• The LCOE was estimated at 0.2984 £ per kW h for the hydrogen gas system and 0.099 £ per kW h for the natural system.
• The estimated levelised CO2 emissions from the natural gas-fuelled SOFC–HP system were 0.213 kg per kW h.
These findings provide valuable insights for policymakers and energy sector stakeholders as they contemplate the implementation of hydrogen-based systems in the journey towards a net-zero future. However, it is important to acknowledge that further research and development of hydrogen technology is necessary to enhance the commercial viability and cost-effectiveness of these systems in the long run.
Conflicts of interest
There are no conflicts to declare.Acknowledgements
This research work was funded by the Engineering and Physical Science Research Council of UK (grant numbers: EP/T022949/1).References
- BEIS, Net Zero Strategy: Build Back Greener, 2021.
- Department for Business EIS, UK, UK becomes first major economy to pass net zero emissions law, 2019.
- UK Hydrogen Strategy, in Majesty EISbCoH, editor, 2022.
- Heat and Buildings Strategy, in Majesty EaISbCoH, editor, 2021.
- Hydrogen net zero investment roadmap: Leading the way to net zero, in Trade DfESaNZaDfBa, editor, 2023.
- The role of hydrogen in achieving Net Zero, in Science and Technology Committee HoC, editor, 2022.
- J. Incer-Valverde, A. Korayem, G. Tsatsaronis and T. Morosuk, “Colors” of hydrogen: Definitions and carbon intensity, Energy Convers. Manage., 2023, 291, 117294 CrossRef CAS.
- S.-Y. Ahn, K.-J. Kim, B.-J. Kim, G.-R. Hong, W.-J. Jang and J. W. Bae, et al., From gray to blue hydrogen: Trends and forecasts of catalysts and sorbents for unit process, Renewable Sustainable Energy Rev., 2023, 186, 113635 CrossRef CAS.
- G. K. Karayel and I. Dincer, Green hydrogen production potential of Canada with solar energy, Renewable Energy, 2024, 221, 119766 CrossRef CAS.
- N. Grid, The hydrogen colour spectrum, 2023.
- BEIS, Decarbonising heat in homes (2022), Seventh Report of Session 2021–22, 2022.
- Platts hydrogen price wall, in Inc. SPG, editor, 2022.
- Y. Wang, J. Wang and W. He, Development of efficient, flexible and affordable heat pumps for supporting heat and power decarbonisation in the UK and beyond: Review and perspectives, Renewable Sustainable Energy Rev., 2022, 154, 111747 CrossRef CAS.
- A. V. Olympios, P. Sapin, J. Freeman, C. Olkis and C. N. Markides, Operational optimisation of an air-source heat pump system with thermal energy storage for domestic applications, Energy Convers. Manage., 2022, 273, 116426 CrossRef.
- H. M. Maghrabie, M. M. Abdeltwab and M. H. M. Tawfik, Ground-source heat pumps (GSHPs): Materials, models, applications, and sustainability, Energy Build., 2023, 299, 113560 CrossRef.
- T. E. Experts, Heat Pump Costs UK 2024, 2024.
- GOV.UK, What impact can heat pumps have in domestic heating today, and how might that change over time as technology improves?, 2023.
- GOV.UK, Boiler Upgrade Scheme, 2022.
- A. S. Mehr, A. Lanzini, M. Santarelli and M. A. Rosen, Polygeneration systems based on high temperature fuel cell (MCFC and SOFC) technology: System design, fuel types, modeling and analysis approaches, Energy, 2021, 228, 120613 CrossRef.
- S. Campanari, L. Mastropasqua, M. Gazzani, P. Chiesa and M. C. Romano, Predicting the ultimate potential of natural gas SOFC power cycles with CO2 capture – Part A: Methodology and reference cases, J. Power Sources, 2016, 324, 598–614 CrossRef CAS.
- K. Selvam, Y. Komatsu, A. Sciazko, S. Kaneko and N. Shikazono, Thermodynamic analysis of 100% system fuel utilization solid oxide fuel cell (SOFC) system fueled with ammonia, Energy Convers. Manage., 2021, 249, 114839 CrossRef CAS.
- J.-P. Jimenez-Navarro, K. Kavvadias, F. Filippidou, M. Pavičević and S. Quoilin, Coupling the heating and power sectors: The role of centralised combined heat and power plants and district heat in a European decarbonised power system, Appl. Energy, 2020, 270, 115134 CrossRef.
- M. F. Tahir, C. Haoyong and H. Guangze, Exergy hub based modelling and performance evaluation of integrated energy system, J. Energy Storage, 2021, 41, 102912 CrossRef.
- T. Tanaka, H. Kamiko, K. Akiba, S. Ito, H. Osaki and M. Yashiro, et al., Energetic analyses of installing SOFC co-generation systems with EV charging equipment in Japanese cafeteria, Energy Convers. Manage., 2017, 153, 435–445 CrossRef.
- L. Tan, X. Dong, C. Chen, Z. Gong and M. Wang, Diverse system layouts promising fine performance demonstration: A comprehensive review on present designs of SOFC-based energy systems for building applications, Energy Convers. Manage., 2021, 245, 114539 CrossRef.
- S. Ma, G. Loreti, L. Wang, F. Maréchal, J. Van herle and C. Dong, Comparison and optimization of different fuel processing options for biogas-fed solid-oxide fuel cell plants, Int. J. Hydrogen Energy, 2022, 47, 551–564 CrossRef CAS.
- S. Mei, X. Lu, Y. Zhu and S. Wang, Thermodynamic assessment of a system configuration strategy for a cogeneration system combining SOFC, thermoelectric generator, and absorption heat pump, Appl. Energy, 2021, 302, 117573 CrossRef.
- P. Zhu, Z. Wu, L. Guo, J. Yao, M. Dai and J. Ren, et al., Achieving high-efficiency conversion and poly-generation of cooling, heating, and power based on biomass-fueled SOFC hybrid system: Performance assessment and multi-objective optimization, Energy Convers. Manage., 2021, 240, 114245 CrossRef CAS.
- Y. Wang, L. Wehrle, A. Banerjee, Y. Shi and O. Deutschmann, Analysis of a biogas-fed SOFC CHP system based on multi-scale hierarchical modeling, Renewable Energy, 2021, 163, 78–87 CrossRef CAS.
- B. N. van Veldhuizen, L. van Biert, A. Amladi, T. Woudstra, K. Visser and P. V. Aravind, The effects of fuel type and cathode off-gas recirculation on combined heat and power generation of marine SOFC systems, Energy Convers. Manage., 2023, 276, 116498 CrossRef CAS.
- R. Zahedi, M. M. Forootan, R. Ahmadi and M. Keshavarzzadeh, Exergy-economic assessment of a hybrid power, cooling and heating generation system based on SOFC, Heliyon, 2023, 9, e16164 CrossRef PubMed.
- A. S. Mehr, M. Ilkhani, S. Sabernia, S. Nooshmand, E. Gholamian and E. Assareh, Thermodynamics assessment and dynamic simulation of a low-carbon syngas-fueled SOFC system using a green hydrogen blend, Int. J. Hydrogen Energy, 2023, 51, 1354–1373 CrossRef.
- K. Al-Khori, Y. Bicer and M. Koç, Comparative techno-economic assessment of integrated PV-SOFC and PV-Battery hybrid system for natural gas processing plants, Energy, 2021, 222, 119923 CrossRef.
- H. Li, F. Liang, P. Guo, C. He, S. Li and S. Zhou, et al., Study on the biomass-based SOFC and ground source heat pump coupling cogeneration system, Appl. Therm. Eng., 2020, 165, 114527 CrossRef CAS.
- D. Roy, S. Samanta and S. Ghosh, Performance optimization through response surface methodology of an integrated biomass gasification based combined heat and power plant employing solid oxide fuel cell and externally fired gas turbine, Energy Convers. Manage., 2020, 222, 113182 CrossRef CAS.
- P. Marocco, M. Gandiglio and M. Santarelli, When SOFC-based cogeneration systems become convenient? A cost-optimal analysis, Energy Rep., 2022, 8, 8709–8721 CrossRef.
- M. Höber, B. Königshofer, P. Boškoski, C. Hochenauer and V. Subotić, Diesel operated combined heat and power SOFC system: SOFC characterization and proof of concept, J. Power Sources, 2023, 585, 233635 CrossRef.
- C. Li, Z. Wang, H. Liu, F. Guo, C. Li and X. Xiu, et al., Exergetic and exergoeconomic evaluation of an SOFC-Engine-ORC hybrid power generation system with methanol for ship application, Fuel, 2024, 357, 129944 CrossRef CAS.
- H. Zhao, H. Du, Z. Peng and T. Zhang, Thermodynamic performance analysis of a novel energy storage system consist of asymmetric PEMEC and SOFC combined cycle, Energy Convers. Manage., 2023, 286, 117077 CrossRef CAS.
- A. Gillich, J. Godefroy, A. Ford, M. Hewitt and J. L'Hostis, Performance analysis for the UK's first 5th generation heat network – The BEN case study at LSBU, Energy, 2022, 243, 122843 CrossRef.
- Z. Wu, Z. Zhang and M. Ni, Modeling of a novel SOFC-PEMFC hybrid system coupled with thermal swing adsorption for H2 purification: Parametric and exergy analyses, Energy Convers. Manage., 2018, 174, 802–813 CrossRef CAS.
- A. Thallam Thattai, V. Oldenbroek, L. Schoenmakers, T. Woudstra and P. V. Aravind, Towards retrofitting integrated gasification combined cycle (IGCC) power plants with solid oxide fuel cells (SOFC) and CO2 capture – A thermodynamic case study, Appl. Therm. Eng., 2017, 114, 170–185 CrossRef CAS.
- Z. Wu, P. Tan, P. Zhu, W. Cai, B. Chen and F. Yang, et al., Performance analysis of a novel SOFC-HCCI engine hybrid system coupled with metal hydride reactor for H2 addition by waste heat recovery, Energy Convers. Manage., 2019, 191, 119–131 CrossRef CAS.
- S. C. Singhal, Advances in solid oxide fuel cell technology, Solid State Ionics, 2000, 135, 305–313 CrossRef CAS.
- N. Chitgar, M. A. Emadi, A. Chitsaz and M. A. Rosen, Investigation of a novel multigeneration system driven by a SOFC for electricity and fresh water production, Energy Convers. Manage., 2019, 196, 296–310 CrossRef CAS.
- G. Tao, T. Armstrong and A. Virkar, Intermediate temperature solid oxide fuel cell (IT-SOFC) research and development activities at MSRI, Nineteenth annual ACERC & ICES conference: Provo, UT, 2005.
- A. Xu, L. Yang, W. Huang, Y. Zhang, H. Long and Z. Liu, et al., Exergy, economic, exergoeconomic and environmental (4E) analyses and multi-objective optimization of a PEMFC system for coalbed methane recovery, Energy Convers. Manage., 2023, 297, 117734 CrossRef CAS.
- D. Roy, S. Samanta, S. Roy, A. Smallbone and A. Paul Roskilly, Fuel cell integrated carbon negative power generation from biomass, Appl. Energy, 2023, 331, 120449 CrossRef CAS.
- P. Mondal and S. Ghosh, Exergo-economic analysis of a 1-MW biomass-based combined cycle plant with externally fired gas turbine cycle and supercritical organic Rankine cycle, Clean Technol. Environ. Policy, 2017, 19, 1475–1486 CrossRef.
- S. Khanmohammadi, K. Atashkari and R. Kouhikamali, Exergoeconomic multi-objective optimization of an externally fired gas turbine integrated with a biomass gasifier, Appl. Therm. Eng., 2015, 91, 848–859 CrossRef CAS.
- D. Roy, S. Samanta and S. Ghosh, Performance assessment of a biomass-fuelled distributed hybrid energy system integrating molten carbonate fuel cell, externally fired gas turbine and supercritical carbon dioxide cycle, Energy Convers. Manage., 2020, 211, 112740 CrossRef CAS.
- Energy Tariff, 2022.
- D. Burrin, S. Roy, A. P. Roskilly and A. Smallbone, A combined heat and green hydrogen (CHH) generator integrated with a heat network, Energy Convers. Manage., 2021, 246, 114686 CrossRef CAS.
- M. Patel, S. Roy, A. P. Roskilly and A. Smallbone, The techno-economics potential of hydrogen interconnectors for electrical energy transmission and storage, J. Cleaner Prod., 2022, 335, 130045 CrossRef CAS.
- F. Curletti, M. Gandiglio, A. Lanzini, M. Santarelli and F. Maréchal, Large size biogas-fed Solid Oxide Fuel Cell power plants with carbon dioxide management: Technical and economic optimization, J. Power Sources, 2015, 294, 669–690 CrossRef CAS.
- D. Roy and S. Samanta, Development and multiobjective optimization of a novel trigeneration system based on biomass energy, Energy Convers. Manage., 2021, 240, 114248 CrossRef CAS.
- A. Habibollahzade, E. Gholamian, E. Houshfar and A. Behzadi, Multi-objective optimization of biomass-based solid oxide fuel cell integrated with Stirling engine and electrolyzer, Energy Convers. Manage., 2018, 171, 1116–1133 CrossRef CAS.
- M. Bahari, A. Entezari, F. Esmaeilion and A. Ahmadi, Systematic analysis and multi-objective optimization of an integrated power and freshwater production cycle, Int. J. Hydrogen Energy, 2022, 47, 18831–18856 CrossRef CAS.
- A. Hasanzadeh, A. Chitsaz, P. Mojaver and A. Ghasemi, Stand-alone gas turbine and hybrid MCFC and SOFC-gas turbine systems: Comparative life cycle cost, environmental, and energy assessments, Energy Rep., 2021, 7, 4659–4680 CrossRef.
- J. Hosseinpour, A. Chitsaz, L. Liu and Y. Gao, Simulation of eco-friendly and affordable energy production via solid oxide fuel cell integrated with biomass gasification plant using various gasification agents, Renewable Energy, 2020, 145, 757–771 CrossRef CAS.
- A. Chitsaz, A. S. Mehr and S. M. S. Mahmoudi, Exergoeconomic analysis of a trigeneration system driven by a solid oxide fuel cell, Energy Convers. Manage., 2015, 106, 921–931 CrossRef.
- P. Behnam, A. Arefi and M. B. Shafii, Exergetic and thermoeconomic analysis of a trigeneration system producing electricity, hot water, and fresh water driven by low-temperature geothermal sources, Energy Convers. Manage., 2018, 157, 266–276 CrossRef.
- C. Independent, Emissions from home energy use, 2022.
- EIA, How much carbon dioxide is produced per kilowatt hour of U.S. electricity generation?, 2022.
- BEIS, Energy Follow Up Survey: Household Energy Consumption & Affordability, 2021.
Footnote |
| † These authors contributed equally. |
| This journal is © The Royal Society of Chemistry 2024 |

