 Open Access Article
Soy protein hydrogels with filler emulsion particles coated by hydrolyzed protein
Guijiang
Liang
ab,
Wenpu
Chen
ab,
Maomao
Zeng
 ab,
Zhiyong
He
 ab,
Jie
Chen
 ab and
Zhaojun
Wang
 *ab
*ab
aSchool of Food Science and Technology, Jiangnan University, Wuxi 214122, China. E-mail: zhaojun.wang@jiangnan.edu.cn; Fax: +86-510-85919065; Tel: +86-510-85329032
bState Key Laboratory of Food Science and Resources, Jiangnan University, Wuxi 214122, China
First published on 20th February 2024
Abstract
The growing consumer preference for plant-based foods in recent years has spurred research efforts to enhance the structural attributes of plant proteins, addressing the limitations associated with animal-source proteins in terms of sustainability. This includes endeavors to improve the gelling and emulsifying properties of plant proteins. The selective enzymatic hydrolysis of soy protein isolate using pepsin and papain resulted in distinct alterations in the hydrolysate compositions. NSPI (native soy protein isolate) encompassed all β-conglycinin and glycinin subunits as a baseline for the comparison. SPHPe (soy proteins hydrolyzed by pepsin) exhibited low molecular weight peptides and β-conglycinin, while SPHPa (soy proteins hydrolyzed by papain) primarily featured peptides below 20 kDa. SPHPe, characterized by a higher β-conglycinin ratio, demonstrated excellent emulsifying activity and stability compared to SPHPa, which displayed weaker performance. Emulsion-filled gels with SPHPe exhibited the highest gel strength and water-holding capacity, forming denser gels primarily influenced by hydrophobic interactions. Thus, exploring active emulsion-filled gels via enzymatic digestion presents a promising avenue for developing meat substitutes and animal-free food alternatives, offering innovative applications for plant proteins across diverse food products.
Sustainability spotlightThis study highlights that soy protein with pepsin-derived hydrolysis (SPHPe) enhances its emulsifying properties, and gels filled with SPHPe emulsion exhibit a significant increase in gel strength and water-holding capacity. This not only helps contribute to sustainable, eco-conscious food production, aligning with the promise of developing meat substitutes and environment-friendly food options but also offers health advantages to consumers. |
1. Introduction
Numerous food systems fall within the category of emulsion-filled gels, such as fat-rich puddings, cheeses, and frankfurters.1,2 Protein has been used as an emulsifier in oil-in-water emulsions due to its excellent surface activity at the interface and its capacity to form a protective layer, preventing coalescence and separation of dispersed phases.3 Moreover, emulsified oil droplets can enhance the dynamic rheological properties of protein gel networks and strengthen the mechanical properties of protein hydrogels when used as fillers in protein matrices.4Recent years have witnessed an upsurge in research focused on expanding the functionality of plant protein, in response to sustainability concerns associated with animal proteins and the growing consumer preference for plant-based foods. This includes efforts to improve their structure-forming properties, such as gelling and emulsifying properties.5 For example, animal fat in processed meat was substituted with unsaturated vegetable oil emulsified with pea protein, aiming for a more nutritionally balanced gel system.6 However, the majority of research on pure plant-based protein emulsion gels has focused on encapsulating functional ingredients rather than exploring them as alternatives to meat proteins.7,8 Consequently, limited research has been directed towards creating meat protein alternatives using plant protein emulsification systems. Soy protein isolate (SPI) stands out as an ideal substitute for animal protein, given its rich nutritional profile and excellent functional properties, including emulsifying, gelation, solubility, and foaming.9 SPI-based emulsion gel can diminish the reliance on animal protein in food systems, aligning with the growing demand for plant-based dietary options.10 However, the less adaptable biological structure of intact soy protein exhibits limitations on its techno-functionality. For example, when creating oil–water emulsions, the structural limitations notably restrict the surface activity of soy protein.11 Therefore, structural modification technology is necessary for designing and developing novel plant-based protein foods to meet the needs of various applications.12
Protein modification through proteolysis holds extensive potential in tailoring protein functionality for distinct applications. The impact of proteolysis depends on factors like protease specificity, degree of hydrolysis (DH), and substrate traits.13 By manipulating enzymatic hydrolysis, the composition of hydrolysates can be optimized. Numerous studies indicated that the enzymatic hydrolysis of SPI improved its functional properties, including solubility, emulsifying and foaming characteristics, by adjusting SPI subunits.14,15 Soy protein subunits exhibited diverse interfacial properties due to their inherent structure and amino acid composition. For instance, β-conglycinin (7S) shows better foaming and emulsifying properties compared to glycinin (11S) due to the high proportion of hydrophobic amino acids in its β-subunit, such as alanine, valine, leucine and phenylalanine, which have a preference to be adsorbed on the fat surface.16,17 Ice cream containing the highest relative composition of β-subunits through pepsin-driven hydrolysis showed good emulsion stability, while pepsin-driven hydrolysis ice cream exhibited comparable functionality to Skim milk powder in rheological and meltdown properties.18
Despite extensive research on the properties of SPI hydrolysates, there is still a gap in understanding the characteristics and interactions within the composite protein gel network containing active emulsion droplets coated by structurally hydrolyzed proteins. This research employed pepsin and papain to modify soy protein isolate into various hydrolysates and investigated their impact on soy protein emulsions and gel properties. This included analyzing polypeptide profiles, molecular weight distribution, emulsifying activity index (EAI), emulsion stability index (ESI), and emulsion microstructure, as well as rheological analysis, texture attributes, water-holding capacity, and gel microstructure. The study aims to elucidate the action mechanism and application effects of modified soy protein as filler emulsion particles, providing a theoretical foundation for the development of high-performance soy protein emulsion-filled gel systems.
2. Materials and methods
2.1 Materials
Soybeans were sourced from the local market in Wuxi, China. Pepsin (3000 U mg−1) was procured from Sangon Biotech in Shanghai, China, and papain (2000 U mg−1) was obtained from Regal, Co, Ltd, also in Shanghai, China. Trinitro-benzene-sulfonic acid (TNBS) solution and β-mercaptoethanol (βMe) were purchased from Sigma-Aldrich (St, Louis, USA). All other chemicals used were of analytical grade.2.2 Preparation of soy protein hydrolysates
Native soy protein isolate (NSPI) was prepared following the procedure given by Diftis and Kiosseoglou.19 Defatted soy protein powder was dispersed in a 9-fold weight of distilled water at 25 °C. The slurry was adjusted to pH 8.0 with 2 M NaOH, stirred for 120 min and centrifuged (10![[thin space (1/6-em)]](https://www.rsc.org/images/entities/char_2009.gif) 000×g, 20 min, 25 °C) to remove the insoluble portion. The supernatant was adjusted to pH 4.5 with 2 M HCl. The resulting curd was collected by centrifugation (3300×g, 10 min, 25 °C) and divided into three portions. The first portion of curd was diluted with 4-fold water weight and neutralized to pH 7.0 with 2 M NaOH before freeze drying.
000×g, 20 min, 25 °C) to remove the insoluble portion. The supernatant was adjusted to pH 4.5 with 2 M HCl. The resulting curd was collected by centrifugation (3300×g, 10 min, 25 °C) and divided into three portions. The first portion of curd was diluted with 4-fold water weight and neutralized to pH 7.0 with 2 M NaOH before freeze drying.
The second portion of curd was used to prepare soy proteins hydrolyzed by pepsin (SPHPe). The curd was dispersed in water to the final protein concentration of 7% (w/v) at 40 °C, and pH was adjusted to 2.0 with 2 M HCl. With stirring, pepsin was added to the SPI dispersion (7%, w/v) with an enzyme-to-SPI ratio of 0.3 wt%. The slurry was incubated at 40 °C for 2 h and terminated with heat treatment using an automatic electrically heated steam generator (Yangnuo Boiler Manufacturing Co., Shanghai, China) at 120 °C for 15 s. Then the mixture was neutralized to pH 7.0 with 2 M NaOH and centrifuged (10![[thin space (1/6-em)]](https://www.rsc.org/images/entities/char_2009.gif) 000×g, 10 min, 25 °C) for the supernatant before freeze drying.
000×g, 10 min, 25 °C) for the supernatant before freeze drying.
The third portion of curd was used to prepare soy proteins hydrolyzed by papain (SPHPa). The curd was dispersed in water to the final protein concentration of 7% (w/v) and adjusted to pH 7.0 with NaOH. With stirring, papain was added with an enzyme-to-SPI ratio of 0.5 wt%, followed by incubation for 30 min at 50 °C, and the papain-induced hydrolysis was terminated with heat treatment at 120 °C for 15 s. Then the mixture was centrifuged (10![[thin space (1/6-em)]](https://www.rsc.org/images/entities/char_2009.gif) 000×g, 10 min, 25 °C) for the supernatant before freeze drying.
000×g, 10 min, 25 °C) for the supernatant before freeze drying.
The degrees of hydrolysis (DH) of SPI, SPSHe, and SPHPa were 0%, 4.78%, and 15.69%, respectively, determined using the TNBS method outlined by Liang et al.20
2.3 Sodium dodecyl sulphate polyacrylamide gel electrophoresis (SDS-PAGE)
The polypeptide profiles of SPI and its hydrolysates were determined by SDS-PAGE according to the procedure by Li et al.,21 with slight modification. All samples were centrifuged at 3000×g for 30 min to obtain soluble portions. A mini-protein electrophoresis system (Bio-Rad Laboratories, Hercules, CA, U.S.A.) was used for analysis. SPI and its hydrolysates were dissolved in the buffer (0.0625 M of Tris–HCl, 10% glycerin, 2% SDS, and 0.0025% bromophenol blue) to prepare a 1 mg per mL protein solution with and without βMe (5%, v/v). After heating for 3 min in boiling water, aliquots (20 μL) of the prepared samples were loaded onto the gels. Coomassie brilliant blue (G-250) was used to stain the gel. A computing densitometer scanned all gels and Image Lab software (Bio-Rad, U.S.A.) was used to integrate band intensities. All insoluble and soluble samples were measured.2.4 Molecular weight distribution by HPLC
The molecular weight distribution of samples was measured by HPLC equipped with a gel permeation chromatographic (GPC) column (Shodex Protein KW-804 column; 8 mm I.D × 30 cm, Shodex Co., Tokyo, Japan) and a waters 2487 dual λ absorbance detector (Waters Co., USA). The elution buffer consisted of 50 mM phosphate (pH 7.0) with 0.3 M NaCl (flow rate: 1.0 mL min−1). Bovine thyroglobulin (669 kDa), amylase (200 kDa), alcohol dehydrogenase (150 kDa), albumin (66 kDa), carbonic anhydrase (29 kDa) and cytochrome c (12 kDa) were used as markers.2.5 Emulsifying properties
The emulsifying activity index (EAI) and emulsion stability index (ESI) of the samples were determined following the method described by Guo et al.22 Emulsions were prepared with 5 mL soy oil and 15 mL of 1% specific soy protein solution (w/v) through a disperser (T 18 basic ULTRA-TURRAX@, IKA Corp, Staufen, Germany) at 13![[thin space (1/6-em)]](https://www.rsc.org/images/entities/char_2009.gif) 500 rpm for 2 min at 25 °C. All emulsions were transferred into 25 mL beakers, and 20 μL was pipetted into 5 mL of 0.1% sodium dodecyl sulfate (SDS). Absorbance was measured at 500 nm at 0 (A0) and 30 (A30) min after emulsion formation. EAI and ESI were calculated with the following equations:
500 rpm for 2 min at 25 °C. All emulsions were transferred into 25 mL beakers, and 20 μL was pipetted into 5 mL of 0.1% sodium dodecyl sulfate (SDS). Absorbance was measured at 500 nm at 0 (A0) and 30 (A30) min after emulsion formation. EAI and ESI were calculated with the following equations:| EAI (m2 g−1) = 4.606 × N × A0/(C × ϕ × 104) |
where A30 and A0 represent the absorbance at 30 and 0 min, respectively, the dilution factor (N) is 251, C is the initial concentration of protein (g mL−1), and ϕ is the oil volume fraction of emulsion (0.2).
2.6 Emulsion preparation
Untreated SPI, SPHPe, and SPHPa samples were used for O/W emulsion preparation. Briefly, a mixture of SPI suspension (8% protein, w/v, pH 7.0) and soybean oil at a final ratio of 6![[thin space (1/6-em)]](https://www.rsc.org/images/entities/char_2009.gif) :
:![[thin space (1/6-em)]](https://www.rsc.org/images/entities/char_2009.gif) 4 (v/v) was homogenized with a Model Ultra-Turrax18 homogenizer (I.K.A. Works GmbH & Co., Staufen, Germany) at 13
4 (v/v) was homogenized with a Model Ultra-Turrax18 homogenizer (I.K.A. Works GmbH & Co., Staufen, Germany) at 13![[thin space (1/6-em)]](https://www.rsc.org/images/entities/char_2009.gif) 500 rpm for 2 min, followed by homogenization through a homogenizer (AH-BASIC, ATS Engineering Inc., Canada) at 40 MPa for one pass.
500 rpm for 2 min, followed by homogenization through a homogenizer (AH-BASIC, ATS Engineering Inc., Canada) at 40 MPa for one pass.
2.7 Confocal laser scanning microscopy (CLSM)
Samples were prepared on single concave slides (Sail Brand, Jinliu Instrument Co., Ltd, Nanjing, China) coated with nail oil to prevent water evaporation. Fluorescence dyes, FITC and Nile red were employed for protein (green-colored) and oil (red-colored) phases (0.05 mL of 0.1 wt% fluorescence dye + 5 mL of stock emulsion) with excitation wavelengths at 488 and 552 nm. The gelation process was carried out as previously mentioned. CLSM images were obtained by a sequential scan (TCS SP8, Leica Microsystems Inc., Heidelberg, Germany) with a 10× magnification lens.2.8 Preparation of SPI-emulsion composite sols
Predetermined amounts of fresh emulsions (Section 2.6, NSPI, SPHPa, SPHPe) were gently stirred into native SPI suspensions using a glass rod, respectively, to produce composite sols with a final protein concentration of 16% (w/v) and oil content of 10% (v/v).7 The composite sols were adjusted to pH 7.0 and thoroughly stirred for subsequent gelation tests.2.9 Dynamic rheological measurement
The formation of emulsion gels and their rheological properties were measured using a controlled-stress rheometer (HAAKEMARS III, Thermo Fisher Scientific, Karlsruhe, Germany) with parallel plates (d = 35.002 mm), and the gap between the two plates was set to 1 mm. The protein solution was transferred to the button plate of the rheometer. Low-viscosity silicon oil was used to prevent water loss during measurement. The gels were oscillated at 1% strain (within the linear viscoelastic region, LVR) and at a frequency of 1 Hz. The temperature was increased from 25 °C to 95 °C at 5 °C per minute, followed by incubation at 95 °C for 30 min before cooling to 25 °C at 5 °C per minute (controlled by an electrical temperature module). The storage modulus (G′) and loss modulus (G′′) were recorded.2.10 Gel properties
![[thin space (1/6-em)]](https://www.rsc.org/images/entities/char_2009.gif) 000×g for 15 min at 4 °C. The ratio of the pellet weight to the original gel weight multiplied by 100 was defined as the WHC (%).
000×g for 15 min at 4 °C. The ratio of the pellet weight to the original gel weight multiplied by 100 was defined as the WHC (%).
2.11 Gel microstructure scanning electron microscopy (SEM)
Small blocks (approximately 5 × 5 × 5 mm) were excised from intact gel samples and immersed in a 2.5% glutaraldehyde fixing solution for 12 h. The samples were quickly frozen in liquid nitrogen and then lyophilized. Dry samples were stored in a desiccator. The microstructure of gold-sputtered samples was observed under a SU8100 electron microscope (Hitachi, Tokyo, Japan) at an acceleration voltage of 3 kV.252.12 Chemical forces in the composite gels
To determine the chemical forces involved in emulsion-filled SPI composite gels, 2 g of gel samples were blended with 18 mL of dissolving solutions using a Model Ultra-Turrax18 homogenizer (I.K.A. Works GmbH & Co., Staufen, Germany). The dissolving solutions were 8 M urea, 50 mM sodium phosphate (pH 7.0); 0.5% SDS, 50 mM sodium phosphate (pH 7.0); and 0.25% βME, 50 mM sodium phosphate (pH 7.0).The blended solutions were chilled to room temperature for 4 h, and centrifuged at 5000×g for 30 min. The amount of extracted protein after different dissolving buffer treatments was used to indicate the leading forces in the gels.26
2.13 Statistical analysis
The experiments and measurements were conducted in triplicate. Statistical analysis was carried out using a two-way ANOVA (p < 0.05) via Statistics 9.0 (Statistix, Tallahassee, FL, USA).3 Results and discussion
3.1 Composition of SPI and SPI hydrolysates
The protein profiles of SPI and its hydrolysates were analyzed by SDS-PAGES under non-reducing and reducing conditions (Fig. 1A and B). The intact protein profile of NSPI, including β-conglycinin subunits (α, α′ and β) and glycinin (acidic and basic subunits), was observed, consistent with previous research findings.9 In SPHPe, the main subunits were β-conglycinin, aligning with studies indicating the preference of pepsin for glycinin degradation and limited impact on β-conglycinin.27 SPHPa exhibited complete hydrolysis of all subunits from glycinin and β-conglycinin, with only peptides below 20 kDa identified. Under non-reducing conditions, protein aggregates were observed in the stacking gel well (Fig. 1A), while reducing conditions revealed corresponding subunits, such as the acidic subunit and basic subunit in NSPI.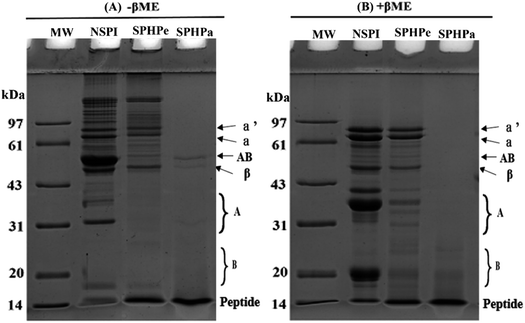 | ||
| Fig. 1 Sodium dodecyl sulfate-polyarylamide gel electrophoresis (SDS-PAGE) patterns of the hydrolysates (A) without β-mercaptoethanol (B) with β-mercaptoethanol. | ||
3.2 Molecule weight distribution of SPI and its hydrolysates
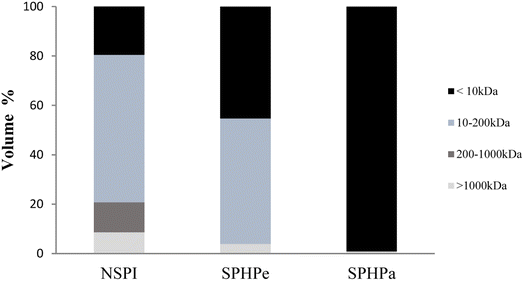
Size exclusion chromatography was utilized to ascertain the molecular weight distribution of SPI and its hydrolysates. Fig. 2 illustrates the shift in the molecular weight profile (MW) of SPI with the enzymatic treatment. Four fractions (<10 kDa, 10–200 kDa, 200–1000 kDa, and >1000 kDa) depicted the molecular weight distribution of SPI and its hydrolysates. They corresponded to small MW polypeptides with <10 kDa, β-conglycinin and glycinin subunits with MW in the range of 10 kDa to 200 kDa, β-conglycinin and glycinin subunits with MW in the range of 200 kDa to 1000 kDa, and aggregates with MW > 1000 kDa. The main protein fraction in NSPI and SPHPe was evident in the 10–200 kDa range, indicating the prevalence of peptides and subunits. SPHPa, due to complete hydrolysis, exhibited a major fraction with a MW less than 10 kDa. The relative proportion of hydrolysate in the 10–200 kDa range decreased with further hydrolysis, from 71.78% in NSPI to 0.0% in SPHPa.3.3 Emulsifying properties
The emulsifying properties of all samples were investigated via formulating oil-in-water emulsions at pH 7.0, as shown in Fig. 3. The EAI of SPHPe increased compared to NSPI, indicating improved surface characteristics and functionality. The elevated molecular flexibility and increased exposed hydrophobic sites resulting from enzymatic hydrolysis contributed to the enhanced emulsifying ability. The residual constituent (β-conglycinin) could play an essential role in the emulsifying ability in the neutral pH ranges. The β-Conglycinin rich SPI fraction had better emulsifying properties than the glycinin-rich SPI fraction in the neutral pH region.21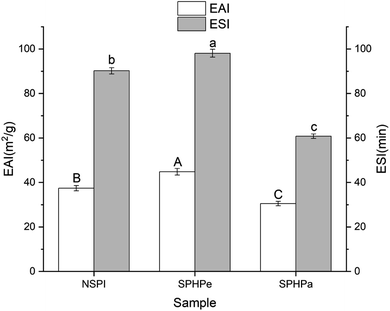 | ||
| Fig. 3 Emulsifying activity index (EAI) and emulsion stability index (ESI) of soy protein isolate and its hydrolysates. *Superscripts (A–C, a–c) represent significant differences at p < 0.05 level. | ||
SPHPe exhibited the highest ESI, while SPHPa displayed the lowest ESI among all samples (Fig. 3). The stability of emulsions is linked to the electrical charge of the droplet and the properties of the adsorbed protein film.28 The observed variations in stability were associated with the molecular weight distribution among peptides generated during hydrolysis. The consistent decrease in molecular weight facilitated better alignment at the oil–water interface, enhancing emulsifying properties. However, excessive hydrolysis led to a decline in emulsifying properties due to the creation of more hydrophilic peptides. Severin and Xia29 suggested that this decline might be attributed to the creation of more hydrophilic peptides that are weakly associated with the oil–water interface. Additionally, the inadequacy of the viscoelastic film formed at the interface with the smaller peptides failed to resist the coalescence of adjacent droplets and led to the formation of large fat globules. The percentage of molecules larger than 10 kDa in SPHPe was higher than that in SPHPa (Fig. 2). As a result, a strong viscoelastic layer was formed on the fat globule surface and prevented fat globule coalescence. Once adsorbed on the fat surface, they provided more protection to fat globules and achieved higher emulsion stability than SPHPa. However, for SPHPa, too many small peptides cannot provide a sufficiently strong layer against the destabilization of fat globules. Hence, the ESI of SPHPa was the lowest among all samples.
3.4 Confocal laser scanning microscopy (CLSM)
The images of CLSM provided detailed insights into the stabilized emulsion by SPI and its hydrolysates. Red fluorescence represented the oil phase, while green fluorescence represented the protein component. SPI-stabilized emulsion exhibited larger oil droplets, indicating lower emulsifying capability and stability (Fig. 4). NSPI is prone to flocculation and droplet aggregation.30 SPHPe stabilized emulsion displayed tiny, uniformly distributed droplets, consistent with its excellent EAI and ESI (Fig. 3). The presence of β-conglycinin elucidated these observations. SPHPa stabilized emulsion formed tiny droplets with pronounced aggregation, indicative of a weaker layer and the most uneven distribution.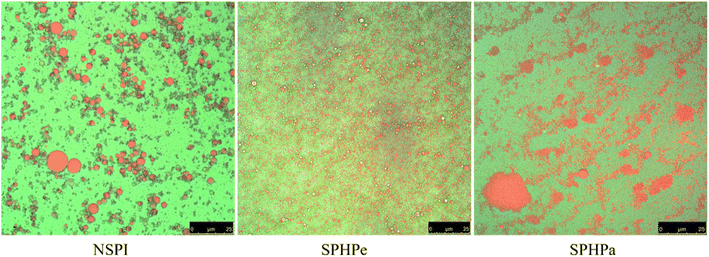 | ||
| Fig. 4 CLSM of emulsion-filled SPI composite gels. Emulsions were prepared with SPI, SPHPe, and SPHPa. | ||
3.5 Dynamic rheological properties
Fig. 5 illustrates the storage modulus (G′) of emulsion sols stabilized by NPSI, SPHPe and SPHPa, revealing temporal and temperature-related changes during dynamic oscillation cycles. A consistent pattern emerged across all samples, indicating a notable increase in G′ at 65 °C, suggesting the initiation of gel network formation. The G′ of SPHPe demonstrated accelerated gel network formation compared to NSPI, while excessive hydrolysis in SPHPa delayed gel formation due to fewer molecular interactions.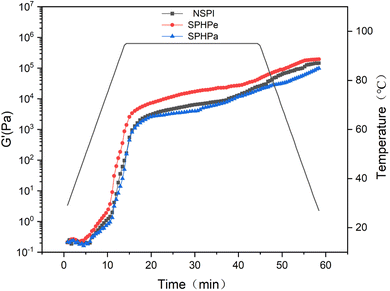 | ||
| Fig. 5 Dynamic changes in storage modulus (G′) of emulsion-filled SPI composites during thermal gelation. The inclusion emulsions were prepared with NSPI, SPHPe, SPHPa. | ||
Table 1 provides a comparison of endpoint G′ and gelation temperatures. The SPHPe-filled emulsion gel exhibited a decreased gelation temperature and a significantly higher G′ value compared to the NSPI-filled gel (p < 0.05). This difference is likely attributed to the hydrophobic interactions induced by β-conglycinin. The G′ value of the SPHPa-filled emulsion gel significantly differs, being lower than those of both NSPI and SPHPe (p < 0.05), which suggests that small molecular weight peptides cannot contribute to a robust gel structure. The enhanced emulsifying properties of SPHPe, resulting in smaller fat globule sizes, could enhance gel strength by reducing the distance between fat droplets.31 As a result, the reduction in oil droplet size heightened the likelihood of their interaction, thereby bolstering the gel strength.32,33 However, the weak layer formed by SPHPa resulted in reduced interactions among fat globules, weakening the gel strength.
| Sample | T gel (°C) | Final G′ (Pa) |
|---|---|---|
| a The temperature at which G′ started to increase over 0.5 Pa K−1 was defined as the gelation temperature.38 Different letters (a, b, and c ) used in the table indicate significant differences (p < 0.05). | ||
| SPI | 80.39 ± 0.62b | 145![[thin space (1/6-em)]](https://www.rsc.org/images/entities/char_2009.gif) 182.58 ± 4756.24b 182.58 ± 4756.24b |
| SPHPe | 77.87 ± 0.74c | 195![[thin space (1/6-em)]](https://www.rsc.org/images/entities/char_2009.gif) 127.39 ± 5 845.35a 127.39 ± 5 845.35a |
| SPHPa | 82.59 ± 0.45a | 98![[thin space (1/6-em)]](https://www.rsc.org/images/entities/char_2009.gif) 465.24 ± 2589.59c 465.24 ± 2589.59c |
3.6 Gel microstructure
The SEM images of gels offer insights into the overall structural integrity of samples undergoing hydrolysis (Fig. 6). Gels filled with NSPI emulsions exhibited larger pores, while those formed with SPHPe emulsions appeared denser, promoting improved cohesion between protein molecules. Gels filled with SPHPa exhibited the largest structural voids, aligning with the observed outcomes in the protein-emulsifying properties (Fig. 3). | ||
| Fig. 6 SEM of emulsion-filled SPI composite gels. Emulsions were prepared with SPI, SPHPe, and SPHPa. The scale bar was 25 μm in the images. | ||
3.7 Gel hardness and WHC
Consistent with rheological performance, gels filled with SPHPe emulsion showed the highest hardness value, while gels filled with SPHPa emulsion displayed the weakest gel strength (Fig. 7). WHC signifies the gel capacity to bind water.34 A consistent polymer network size and a sturdy framework contribute to bolstering gel strength and preserving adequate water retention. This results in stronger and more abundant cross-links, enhancing the stability of the network and consequently elevating both gel strength and WHC.35 A denser structure, as indicated by SEM, provides an increased surface area for water retention, enhancing WHC.36 This enhanced cohesion effectively prevents water from escaping, further improving water retention properties. Among the samples, the gel-filled with SPHPe emulsion exhibited the highest gel strength and superior WHC compared to the gel-filled with NSPI emulsion.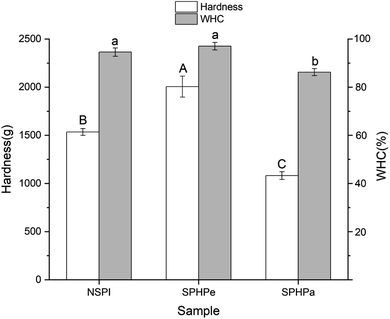 | ||
| Fig. 7 Gel hardness and WHC of emulsion-filled SPI composite gels. Emulsions were prepared with SPI, SPHPe, and SPHPa. Means (n = 3) without a common letter across differ significantly (p < 0.05). | ||
3.8 Molecular forces involved in SPI composite gels
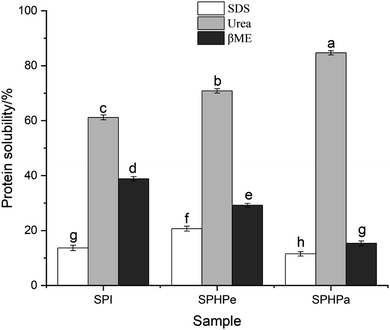
The physicochemical bonds responsible for gel structure formation were evaluated by treating gels with different disruptive solvents (Fig. 8). Elevated urea concentrations can disrupt hydrogen bonds and weaken hydrophobic interactions, SDS functions by disrupting hydrophobic interactions, and βME acts by breaking disulfide bonds.37 SPHPe displayed heightened hydrophobic interactions due to pepsin-induced SPI hydrolysis, exposing more hydrophobic groups and significantly increasing hydrophobicity. Conversely, SPHPa showcased reduced hydrophobic interactions due to excessive hydrolysis, causing aggregation and precipitation of hydrophobic groups. The Urea treatment indicated that intermolecular hydrogen bonds were a dominant force for strengthening gel filled with NSPI emulsion, as evidenced by the highest protein solubility among all treatments for NSPI (61%).Among all emulsion-filled gels, SPHPa exhibited the strongest hydrogen bonding forces due to the higher quantity of small molecular weight peptides, while SPHPe showed fewer disulfide bond interactions. As 11S undergoes hydrolysis, the soluble protein released by βME decreased with increasing hydrolysis degree, reflecting the weakening of disulfide bond interactions in SPHPe. SPHPa primarily consists of small peptides, exhibiting the fewest disulfide bond interactions.
4. Conclusion
The selective enzymatic hydrolysis of SPI by pepsin and papain resulted in distinct compositional changes within the hydrolysates. SPHPe exhibited the emergence of low molecular weight peptides alongside β-conglycinin, while SPHPa exclusively featured peptides with molecular weights below 20 kDa. Notably, SPHPe, characterized by a higher β-conglycinin ratio, demonstrated superior emulsifying activity and stability, while SPHPa displayed weakened emulsifying properties. The variation in emulsifying capacity influenced emulsion fat globular size, impacting the strength and nature of intermolecular interactions. Gels filled with SPHPe emulsion exhibited the highest gel strength and WHC, forming denser gels. Hydrophobic interactions emerged as the primary force governing intermolecular interactions crucial for robust water retention and gel strength. While hydrogen bonding contributes to protein molecular interactions, it may not be the dominant force influencing the strength and WHC of gels. In conclusion, the exploration of enzymatically digested active emulsion-filled gels holds significant promise for developing meat substitutes and animal-free food alternatives. This model introduces an innovative approach to expanding the applications of plant proteins across diverse food products.Author contributions
Guijiang Liang: investigation, data curation, formal analysis, visualization, writing – original draft. Wenpu Chen: writing – original draft. Zhiyong He: resources. Maomao Zeng: resources. Jie Chen: methodology, conceptualization. Zhaojun Wang: funding acquisition, writing – review & editing, supervision.Conflicts of interest
The authors report no conflicts of interest relevant to this article.Acknowledgements
This project is supported by the National Natural Science Foundation of China (32202081).References
- T. Farjami and A. Madadlou, Trends Food Sci. Technol., 2019, 86, 85–94 CrossRef CAS.
- E. Guzmán, S. Llamas, A. Maestro, L. Fernández-Peña, A. Akanno, R. Miller, F. Ortega and R. G. Rubio, Adv. Colloid Interface Sci., 2016, 233, 38–64 CrossRef PubMed.
- D. J. McClements, Langmuir, 2005, 21, 9777–9785 CrossRef CAS PubMed.
- J. S. Chen and E. Dickinson, J. Agric. Food Chem., 1998, 46, 91–97 CrossRef CAS PubMed.
- L. Grossmann and J. Weiss, Annu. Rev. Food Sci. Technol., 2021, 12, 93–117 CrossRef CAS PubMed.
- J. Jiang and Y. L. L. Xiong, Meat Sci., 2015, 109, 56–65 CrossRef CAS PubMed.
- Q. L. Wang, J. Jiang and Y. L. L. Xiong, J. Agric. Food Chem., 2019, 67, 12895–12903 CrossRef CAS PubMed.
- X. Y. Zhang, S. Zhang, M. M. Zhong, B. K. Qi and Y. Li, Food Chem., 2022, 380, 132212 CrossRef CAS PubMed.
- K. Nishinari, Y. Fang, S. Guo and G. O. Phillips, Food Hydrocolloids, 2014, 39, 301–318 CrossRef CAS.
- C. D. Paglarini, S. Martini and M. A. R. Pollonio, LWT–Food Sci. Technol., 2019, 99, 453–459 CrossRef CAS.
- J. R. Wagner and J. Guéguen, J. Agric. Food Chem., 1999, 47, 2181–2187 CrossRef CAS PubMed.
- F. U. Akharume, R. E. Aluko and A. A. Adedeji, Compr. Rev. Food Sci. Food Saf., 2021, 20, 198–224 CrossRef CAS PubMed.
- O. L. Tavano, J. Mol. Catal. B: Enzym., 2013, 90, 1–11 CrossRef CAS.
- S. E. M. Ortiz and J. R. Wagner, Food Res. Int., 2002, 35, 511–518 CrossRef.
- K. Tsumura, T. Saito, W. Kugimiya and K. Inouye, J. Food Sci., 2004, 69, C363–C367 CrossRef CAS.
- V. P. Ruíz-Henestrosa, C. C. Sánchez, M. D. Yust, J. Pedroche, F. Millán and J. M. R. Patino, J. Agric. Food Chem., 2007, 55, 1536–1545 CrossRef PubMed.
- R. S. H. Lam and M. T. Nickerson, Food Chem., 2013, 141, 975–984 CrossRef CAS PubMed.
- W. P. Chen, G. J. Liang, X. Li, Z. Y. He, M. M. Zeng, D. M. Gao, F. Qin, H. D. Goff and J. Chen, Food Hydrocoll., 2019, 94, 279–286 CrossRef CAS.
- N. Diftis and V. Kiosseoglou, Food Hydrocoll., 2006, 20, 787–792 CrossRef CAS.
- G. Liang, W. Chen, X. Qie, M. Zeng, F. Qin, Z. He and J. J. F. H. Chen, Food Hydrocoll., 2020, 105, 105764 CrossRef.
- W. Li, Y. Wang, H. Zhao, Z. He, M. Zeng, F. Qin and J. J. F. H. Chen, Food Hydrocoll., 2016, 60, 453–460 CrossRef CAS.
- F. Guo, Y. L. Xiong, F. Qin, H. Jian, X. Huang and J. Chen, J. Food Sci., 2015, 80, C279–C287 CAS.
- X. Wang, J. Shan, S. Han, J. Zhao and Y. Zhang, Anal. Lett., 2019, 52, 1845–1859 CrossRef CAS.
- M. G. Wu, Y. L. Xiong, J. Chen, X. Y. Tang and G. H. Zhou, J. Food Sci., 2009, 74, E207–E217 CAS.
- X. M. Wu, L. Black, G. Santacana-Laffitte and C. W. Patrick, J. Biomed. Mater. Res., Part A, 2007, 81, 59–65 CrossRef PubMed.
- J. Jiang and Y. L. L. Xiong, Meat Sci., 2013, 93, 469–476 CrossRef CAS PubMed.
- C. Cui, M. M. Zhao, B. E. Yuan, Y. H. Zhang and J. Y. Ren, J. Food Sci., 2013, 78, C1871–C1877 CrossRef CAS PubMed.
- D. Guzey and D. J. McClements, Adv. Colloid Interface Sci., 2006, 128, 227–248 CrossRef PubMed.
- S. Severin and W. S. Xia, J. Food Biochem., 2006, 30, 77–97 CrossRef CAS.
- L. Chen, J. S. Chen, J. Y. Ren and M. M. Zhao, J. Agric. Food Chem., 2011, 59, 2600–2609 CrossRef CAS PubMed.
- O. Torres, B. Murray and A. Sarkar, Trends Food Sci. Technol., 2016, 55, 98–108 CrossRef CAS.
- M. G. Wu, Y. L. L. Xiong and J. Chen, J. Food Eng., 2011, 106, 318–324 CrossRef CAS.
- B. Ozturk and D. J. McClements, Curr. Opin. Food Sci., 2016, 7, 1–6 CrossRef.
- K. Liu, Q. M. Li, X. Q. Zha, L. H. Pan, L. J. Bao, H. L. Zhang and J. P. Luo, Food Hydrocoll., 2019, 87, 629–636 CrossRef CAS.
- M. Y. He, M. Zhang, T. Gao, L. Chen, Y. Liu, Y. Y. Huang, F. Teng and Y. Li, Food Chem., 2024, 175, 113726 Search PubMed.
- C. H. Bi, T. Zhou, Z. Y. Wu and Z. G. Huang, Foods, 2023, 12, 1754 CrossRef CAS PubMed.
- A. J. Baldwin, Dairy Sci. Technol., 2010, 90, 169–179 CrossRef CAS.
- J.-z. Zhou, H. Zhang, L. Gao, L. Wang and H.-F. Qian, Food Bioprod. Process., 2015, 96, 27–34 CrossRef CAS.
| This journal is © The Royal Society of Chemistry 2024 |


