Rapid detection of caffeic acid in food beverages using a non-enzymatic electrochemical sensor based on a Bi2S3/CNF nanocomposite
Received
14th January 2024
, Accepted 3rd March 2024
First published on 25th March 2024
Abstract
Caffeic acid (CA), a naturally occurring polyphenol abundantly found in various plants, has garnered significant attention in recent years due to its diverse pharmacological properties and potential health benefits. Additionally, caffeic acid is used in a range of applications, including in the food industry, disease diagnostics, and environmental monitoring, underscoring the significance of its detection. In this investigation, Bi2S3/CNF nanocomposites were prepared by a simple ultrasonication method. The successful formation of the Bi2S3/CNF nanocomposites was validated through X-ray diffraction (XRD), field emission scanning electron microscopy (FE-SEM), high resolution transmission electron microscopy (HR-TEM), energy dispersive electron microscopy (EDX), elemental mapping, Brunauer–Emmett–Teller (BET) studies and X-ray photoelectron microscopy (XPS). Furthermore, the electrochemical behaviour of CA on the resulting electrode was investigated through cyclic voltammetry (CV) and differential pulse voltammetry (DPV). Based on above findings, the non-enzymatic electrochemical sensor has good performance for the electrochemical detection of CA under tailored conditions; the wide linear range of CA concentrations detectable by the modified GCE was 0.1–500 μM, and the LOD was 108 nM, with the sensitivity of the modified GCE calculated to be 2.56 μA μM−1 cm−2 and good selectivity, repeatability, reproducibility and stability. Additionally, the Bi2S3/CNF/GCE nanocomposite electrode material was used to detect CA in real samples, such as apple and grape juice, and acceptable results were achieved showing good practical applicability. Ultimately, this study demonstrated that the suggested sensor has enhanced the ability to determine CA in food industry and health care field.
Sustainability spotlight
Caffeic acid (CA) is a natural compound found in various plants, including coffee beans, fruits, and vegetables. Antioxidant properties: CA has antioxidant properties, which means that it can help neutralize free radicals in the body. Flavor enhancement: CA, being naturally present in certain foods, can contribute to the overall flavor profile. Food manufacturers might use it as a flavor enhancer to improve the taste of products. Color stabilization: CA can also play a role in stabilizing the color of certain foods. It can help prevent the degradation of pigments responsible for the color of fruits, vegetables, and other food items. Preservative effects: due to its antimicrobial properties, caffeic acid may have preservative effects, inhibiting the growth of some microorganisms. This can contribute to extending the shelf life of certain food products. On the basis of the above information, we have concluded that our research team is able to detect CA in food samples. Bi2S3/CNF/GCE nanocomposites have been synthesized and tested for detecting CA in real samples, such as apple juice and grape juice using electrochemical techniques, thus demonstrating good practical applicability in the food industry.
|
Introduction
Nowadays, phenolic compounds supply flavour to and stabilize plant-derived alcoholic and non-alcoholic beverages such as wine, beer, and fruits juices.1,2 Caffeic acid (3,4-dihydroxycinnamic acid) is a significant compound in the category of phenolic acids, and it has been widely used for several pharmacological functions,3 such as anti-inflammatory,3 antibacterial,4 antioxidant,5 immune-modulatory and anticancer.6 The German national nutrition survey (NVS) reported that an appropriate phenolic acid intake level is important to sustain a healthy diet,7 and the average intake level of CA is 206 (mg dL−1);8 hence, it is important to develop simple and effective platforms for monitoring the concentration of CA. To date, numerous traditional methods have been utilized for the determination of CA, such as gas chromatography (GC-MS),9 liquid chromatography (LC-MS),10 ultra-performance liquid chromatography (UPLC),11 mass spectroscopy, electrophoresis12 and electrochemical detection methods.13 Nevertheless, compared to electrochemical techniques, which offer a simple and rapid response along with extremely sensitive detection, these analytical approaches are typically more time-consuming and expensive.14
In recent years, with advancements in nanomaterials, electrochemical sensors have been developed and utilized for detecting various food additives. In particular, metal sulfides such as Bi2S3,15 CoS2,16 MoS2,17 WS2,18 SnS2,19 and Cu2S20 have gained widespread attention. Remarkably, Bi2S3 nanoparticles exhibit excellent exotic, optical, magnetic, and electrical properties. They have been synthesized using various techniques, including photochemical synthesis, microwave-assisted methods, ultrasonic methods, thermal decomposition, solvothermal processes, and hydrothermal methods.21 However, Bi2S3 nanoparticles have low intrinsic conductivity, and their electrochemical detection is limited in practical use by their low sensitivity and limited linear range. So far, various approaches have been proposed to enhance the electrochemical properties of the orthorhombic structure of Bi2S3.22 For instance, Yan et al. synthesized Bi2S3/rGO nanocomposites employing thioacetamide as a sulfur source, and these nanocomposites were then employed as the active layer in a dopamine sensor, resulting in significant enhancements in selectivity and sensitivity.23 Conversely, carbon-based materials are widely used in electrochemical sensor applications,24 such as graphitic carbon nitrate (g-C3N4),25 reduced graphene oxide (rGO),26 carbon nanotubes (CNTs),27 single walled carbon nanotubes (SWCNT),28 multi-walled carbon nanotubes (MWCNTs)29 and carbon nano fibres (CNFs).30 For instance, Mehmandoust et al. displayed the use of nanostructured materials by developing metal–carbon nanocomposites and a nanometal-based electrochemical sensor for use in pharmaceutical and organic waste detection,31,32 in which very low detection limits were obtained in the concentration range of micromolar to nanomolar.33 Furthermore, according to previous reports, carbon nano fibre (CNF) materials are widely used in electrochemical sensing applications due to these materials exhibiting a high surface area, and the high electrical conductivity of CNFs can be used to increase the rate of electron transfer and detection limit of food analytes.34
In the present investigation, we report the successful formation of Bi2S3/CNF nanocomposites that were synthesized by a simple ultrasonication method. The as-prepared Bi2S3/CNF nanocomposites were used to modify a GCE for the electrochemical sensing of CA, which was investigated in detail. The Bi2S3/CNF nanocomposite demonstrated superior electrocatalytic behaviour towards CA. The fabricated Bi2S3/CNF/GCE nanocomposites as a CA sensor displayed good sensitivity, a wide linear range, practical applicability and high selectivity in the presence of different interfering analytes in an aqueous PBS (pH 7.0) solution. This study offers a future approach for enhancing the electrocatalytic properties of Bi2S3/CNF/GCE nanocomposites and increasing their applications in the field of electrochemical sensing applications.
Materials and methods
Chemicals and reagents
Bismuth nitrate hexahydrate [Bi (NO3)3·5H2O, 98%], sodium thiosulphate pentahydrate [Na2S2O3·5H2O, 99%], sulphuric acid (H2SO4), disodium hydrogen phosphate [NaH2PO4·2H2O, 99.0–100.5%], dihydrogen sodium phosphate [Na2H2PO4·2H2O, 99.0–100.5%], potassium ferricyanide [K3/K4 (Fe (CN)6), 98.0%], potassium hydroxide pellets [KOH, ≥85%], caffeic acid (≥98%), and ethanol (CH3CH2OH) (95.0%) were obtained from Tokyo Chemical Industry Co., Ltd (Tokyo, Japan). Propyl gallate (≥98%), sodium nitrate (NaNO3) (≥99.0%) and acetone (CH3COCH3) were purchased from Sigma-Aldrich, Taiwan and all other chemicals and regents were used without further purification.
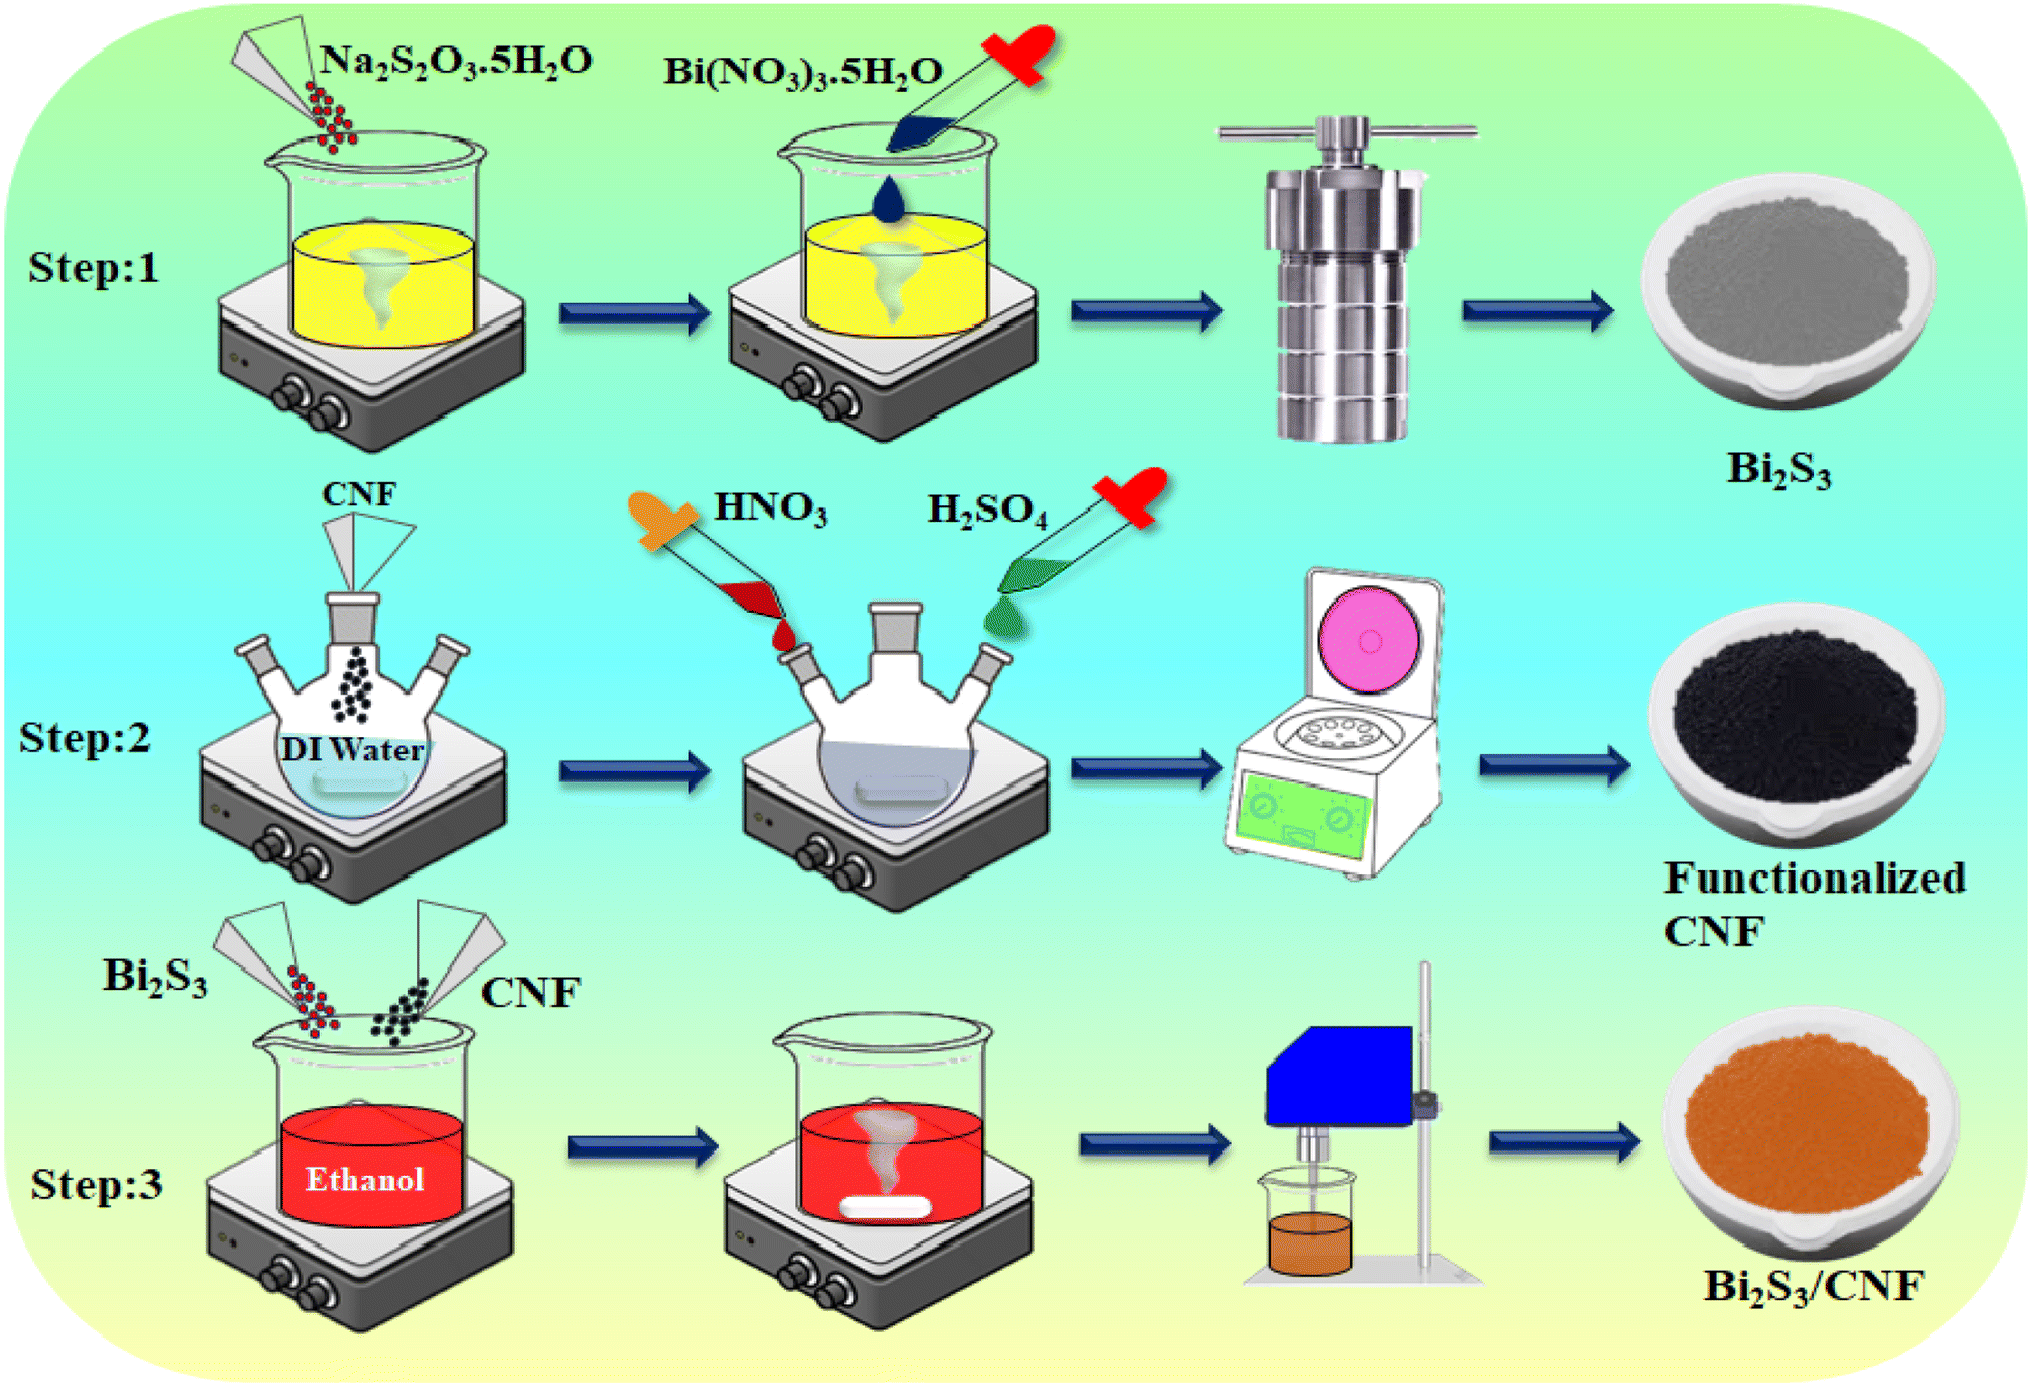
Preparation of Bi2S3
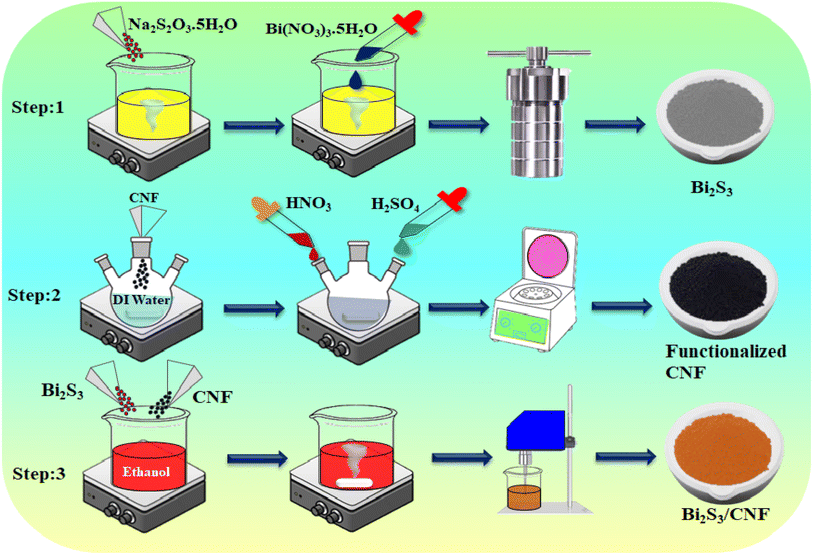
The Bi2S3 nanoparticles were synthesized by using a simple one step hydrothermal method. In a typical experiment, 6 g of sodium thiosulphate [Na2S2O3·5H2O] was dissolved in 60 mL of deionized water (DDW), followed by continuous stirring, and 1.5 g of bismuth nitrate [Bi (NO3)3·5H2O] was added dropwise to the above precursor solution; after 30 min of stirring, the mixed solution was moved to a 100 mL Teflon-lined stainless autoclave, and the temperature was kept at around 180 °C overnight in a hot air oven, before cooling to room temperature. The black colour precipitate was collected and washed several times with DDW and ethanol. Finally, the dark gray sample was dried at 80 °C for 8 h.
Preparation of CNFs
Han et al.'s approach,35 which involved acid treatment, resulted in the functionalization of pure CNFs with –OH, –C![[double bond, length as m-dash]](https://www.rsc.org/images/entities/char_e001.gif) O and –COOH groups. Initially, 1 g of bare CNFs was transferred into a three-neck round-bottomed flask, and 75 mL of HNO3 and H2SO4 acid were added. The acid-refluxed CNFs were washed with deionized water, and the pH was adjusted to above 6. Finally, the obtained colloidal solution was dried at 80 °C for 12 h in a vacuum oven.
O and –COOH groups. Initially, 1 g of bare CNFs was transferred into a three-neck round-bottomed flask, and 75 mL of HNO3 and H2SO4 acid were added. The acid-refluxed CNFs were washed with deionized water, and the pH was adjusted to above 6. Finally, the obtained colloidal solution was dried at 80 °C for 12 h in a vacuum oven.
Preparation of the Bi2S3/CNF nanocomposites
The Bi2S3/CNF nanocomposites were prepared through the ultrasonication method. In brief, 2 mg of CNFs and 3 mg of Bi2S3 nanoparticles were dispersed in 5 mL of ethanol and probe sonicated for 30 minutes at room temperature; after that, these materials can be used for further physiochemical characterization and sensing applications (Scheme 1).
 |
| | Scheme 1 | |
Material characterization
The as-prepared Bi2S3/CNF nanocomposites have been studied utilizing several analytical techniques. X-ray diffraction (Rigaku smart lab diffractometer) was used to analyze the crystalline nature and structure of the prepared samples using monochromatic CuK radiation (λ = 1.540 Å). The morphologies of all the prepared samples were observed by scanning electron microscopy (FE-SEM, JEOL JSM 6480, Oxford Instrument). Moreover, the Bi2S3/CNF nanocomposites were examined using transmission electron microscopy (HR-TEM, JOEL JEM 2001). An X-ray photoelectron spectrometer (Scientific Multilab 200 XPS) was used to determine the chemical composition of the as prepared nanocomposite. Furthermore, using cyclic voltammetry (CV) and differential voltammetry (DPV), the electrochemical sensor performance of nanocomposite modified electrodes was evaluated. All electrochemical experiments were performed using a CHI 211B electrochemical workstation (CH Instruments Co., Austin, TX, USA). A three-electrode system with an Ag/AgCl reference electrode, a platinum wire a counter electrode, and a GCE as the working electrode was used to carry out voltammetry studies. A Suntex pH meter was utilized to determine pH parameters during electrochemical investigations, which were carried out at room temperature.
Fabrication of the modified electrode
The glassy carbon electrode (GCE) (working surface area = 0.07 cm2) was carefully polished with alumina powder (0.05 microns, 99.99%) and washed with DDI water before surface modification. The Bi2S3/CNF nanocomposites were initially suspended in ethanol and subjected to 30 minutes of ultrasonic treatment. Afterwards, the suspension was drop-cast onto a GCE electrode using a 5 μM solution. The electrode was subsequently dried at 50 °C for 5 minutes before proceeding with further experiments, following the same procedure as described above.
Real sample analysis
The electrochemical performance of the Bi2S3/CNF/GCE nanocomposites was evaluated using two food samples: grape juice and apple juice. Prior to analysis, both juices were centrifuged at 3000 rpm for 10 minutes and filtered. The filtered solutions were then directly employed for the analysis as real samples.
Results and discussion
Phase analysis
The XRD patterns of the as-prepared Bi2S3, CNF, and Bi2S3/CNF nanocomposites were analysed using an XRD diffractometer, and the results obtained are shown in Fig. 1. The bare Bi2S3 diffraction peaks at 15.6°, 17°, 20.9°, 22.5°, 25.5°, 28.5°, 33°, 34.3°, 46.4° and 52.5° corresponding to (2 0 0), (1 2 0), (2 2 0), (3 1 0), (2 1 1), (2 2 1), (3 1 1), (4 3 0), (4 4 0) and (3 1 2) hkl planes were in agreement with standard JCPDS card no (65-2435).36 The bare CNF diffraction peak located at 25.61° corresponds to the (0 0 2) plane.37 The presence of these planes demonstrates that the Bi2S3 and CNFs are well crystallized, and the presence of no other crystalline phases demonstrates their high purity. We observed, from the XRD image, a slight decrease in the peak intensity of the spectra of the Bi2S3/CNF nanocomposites due to the addition of CNFs. The Debye–Scherrer formula was used to determine that the average crystallite sizes of the Bi2S3, CNFs and Bi2S3/CNF nanocomposites are 30.1 nm, 35 nm and 23.05 nm, corresponding to the planes of (2 2 1), (0 0 2), and (2 1 1), respectively. This result indicates that the CNFs reduce the crystalline size of the Bi2S3 nanoparticles in the composite system, and the reduction in crystalline size is reflected via the reduction in the peak intensity and broadening of the diffraction peaks. Therefore, the XRD pattern obtained confirms the presence of the composite material Bi2S3/CNF, demonstrating good crystallinity.
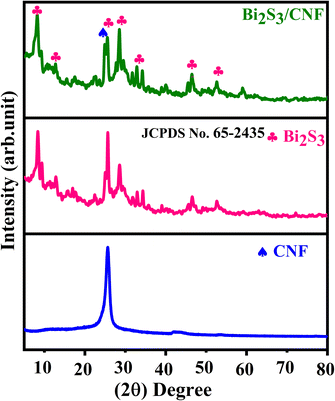 |
| | Fig. 1 XRD patterns of the as-prepared samples. | |
Morphology analysis
FE-SEM analysis.
The surface morphology of the pure Bi2S3, CNFs, and Bi2S3/CNF nanocomposites were investigated by FE-SEM analysis. The micrographs of Bi2S3 (Fig. 2(a and b)) reveal the formation of irregular shapes with smooth, arranged surfaces. Fig. 2(c and d) illustrate the morphology of the carbon nanofibers, displaying a consistent interconnected network of fibres with an average diameter of 123 ± 52.8 nm. Even after carbonization, the CNFs retained their length and structural continuity, resulting in a significant aspect ratio and moderate interconnectivity among the fibres. Fig. 2(e and f) depict the Bi2S3/CNF nanocomposites, confirming the emergence of interconnected fibres resembling the structure of Bi2S3 on the surface of the CNFs. To understand the elemental distribution and chemical composition, the as-prepared samples were subjected to elemental mapping and EDX analysis, as shown in Fig. 2(g–j) and (k), which clearly shows the existence and even distribution of all corresponding elements in the as-synthesized Bi2S3/CNF nanocomposites. In contrast, the Bi2S3/CNF nanocomposites show Bi, S, and C elements. It is worth noticing that no impurities are identified in EDX spectra, which indicates that the sample contains a high purity of the composite material.
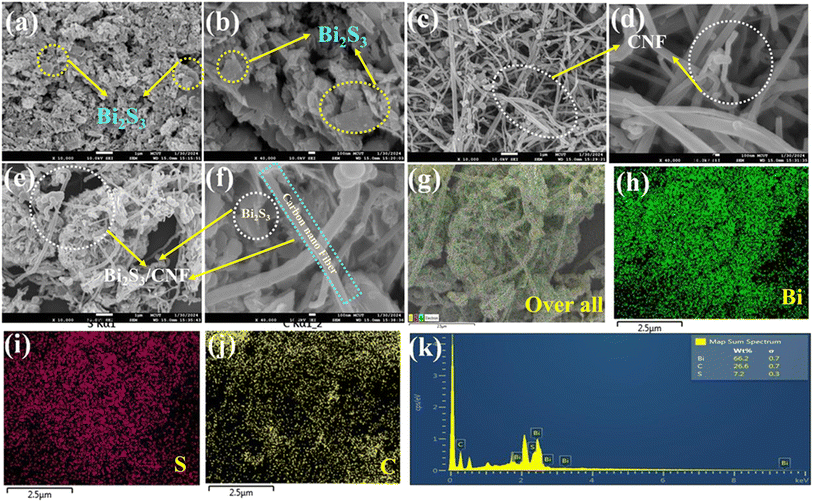 |
| | Fig. 2 FE-SEM images of the (a and b) Bi2S3, (c and d) CNFs, and (e and f) Bi2S3/CNF nanocomposites, (g–j) mapping images and (k) EDAX spectrum with the weight and atomic distribution of the Bi2S3/CNF nanocomposites. | |
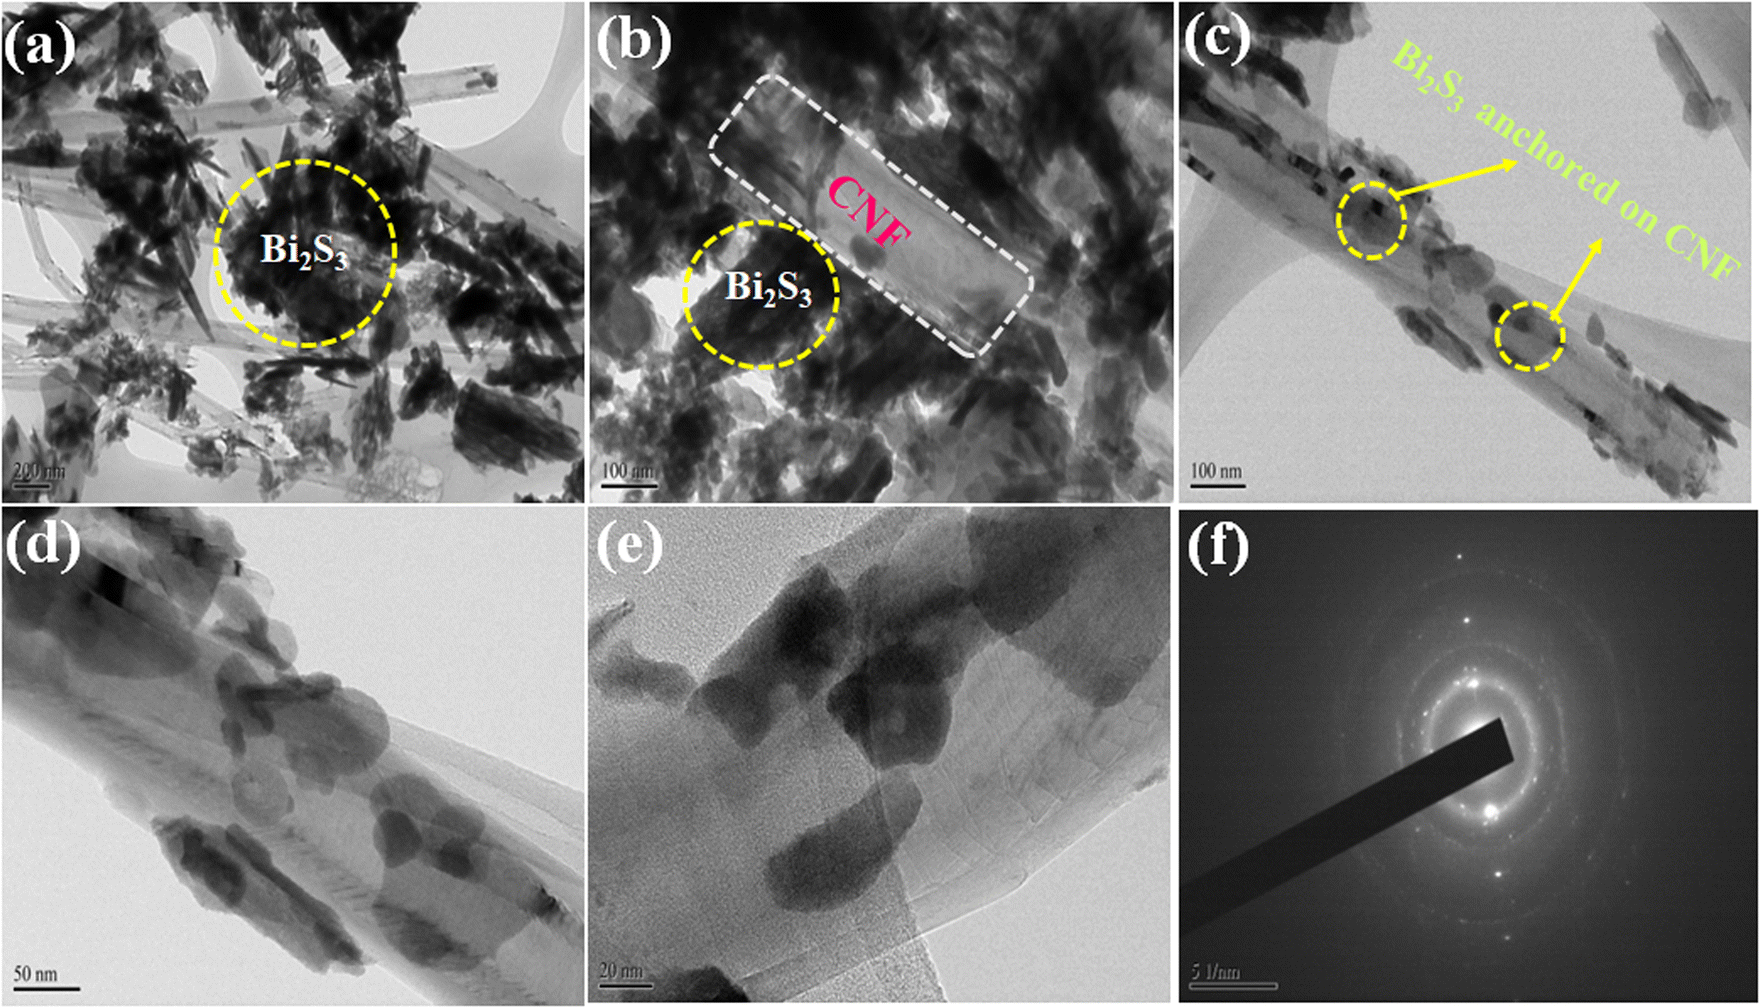
HR-TEM analysis.
The surface morphologies of the as-prepared Bi2S3/CNF nanocomposites were investigated through HR-TEM analysis. Fig. 3(a–e) show the HR-TEM images of the Bi2S3/CNF nanocomposites at different magnifications. The simple ultrasonication technique is used to successfully incorporate Bi2S3 nanoparticles onto the graphene layer. Furthermore, according to the morphology study, the Bi2S3 nanoparticles are strongly entrapped on the surface of the CNFs, which may improve the conductivity by offering a large number of active sites, accelerating the ion diffusion pathway, offering electron and ion transport and enhancing electron conductive channels. The SAED pattern of the Bi2S3/CNF nanocomposites in Fig. 3(f) suggests the polycrystalline nature of the sample. Based on above findings, the Bi2S3/CNF nanocomposites enhanced electrochemical oxidation properties, and it is evidenced that the Bi2S3/CNF nanocomposites show heterojunction formation.
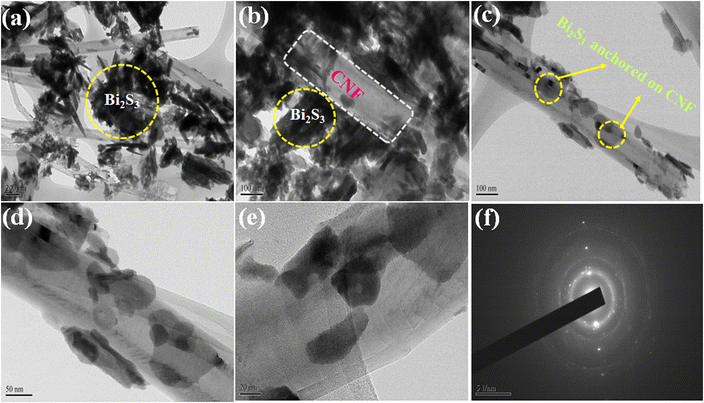 |
| | Fig. 3 (a–e) HR-TEM image and (f) SAED pattern of the Bi2S3/CNF nanocomposites. | |
Surface composition analysis
The as-prepared Bi2S3/CNF nanocomposites were analysed through XPS analysis. To analyse the electronic structure and surface elemental composition, Fig. 4(a) shows the XPS survey spectrum of the Bi2S3/CNF nanocomposite, from which the presence of Bi, S and C elements can be identified. XPS analysis was performed for each identified element, and the resulting spectra were deconvoluted and are shown in Fig. 4(b–d). Fig. 4(b) shows two strong peaks at 158.5 and 164.1 eV, which correspond to the spin orbital peaks of Bi 4f7/2 and Bi 4f5/2, respectively.38 In Fig. 4(c), peaks presented at 162.2 and 163.1 eV are attributed to S 2p3/2 and S 2p1/2.39Fig. 4(d) shows the carbon spectrum, with peaks attributed to C–O (283.5 eV) and CO (290 eV), respectively.40 Finally, all of the observed deconvoluted spectra show the presence of Bi2S3 and CNF phases, which strongly supports the formation of Bi2S3/CNF nanocomposites.
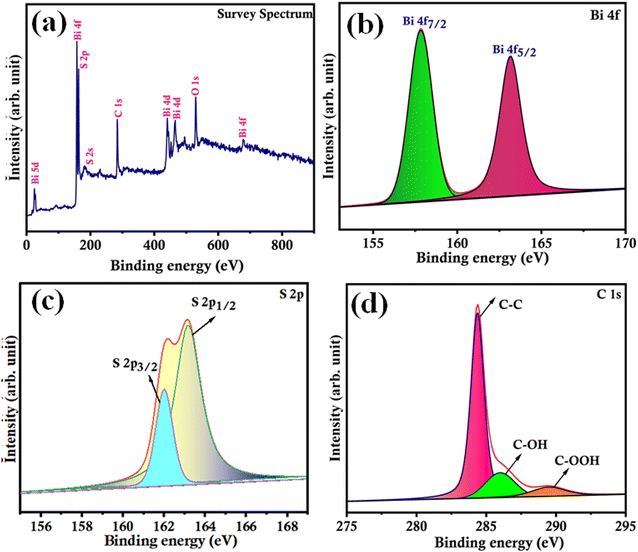 |
| | Fig. 4 (a) Survey spectrum, and high resolution spectra of (b) Bi 4f, (c) S 2p and (d) C 1s. | |
BET analysis.
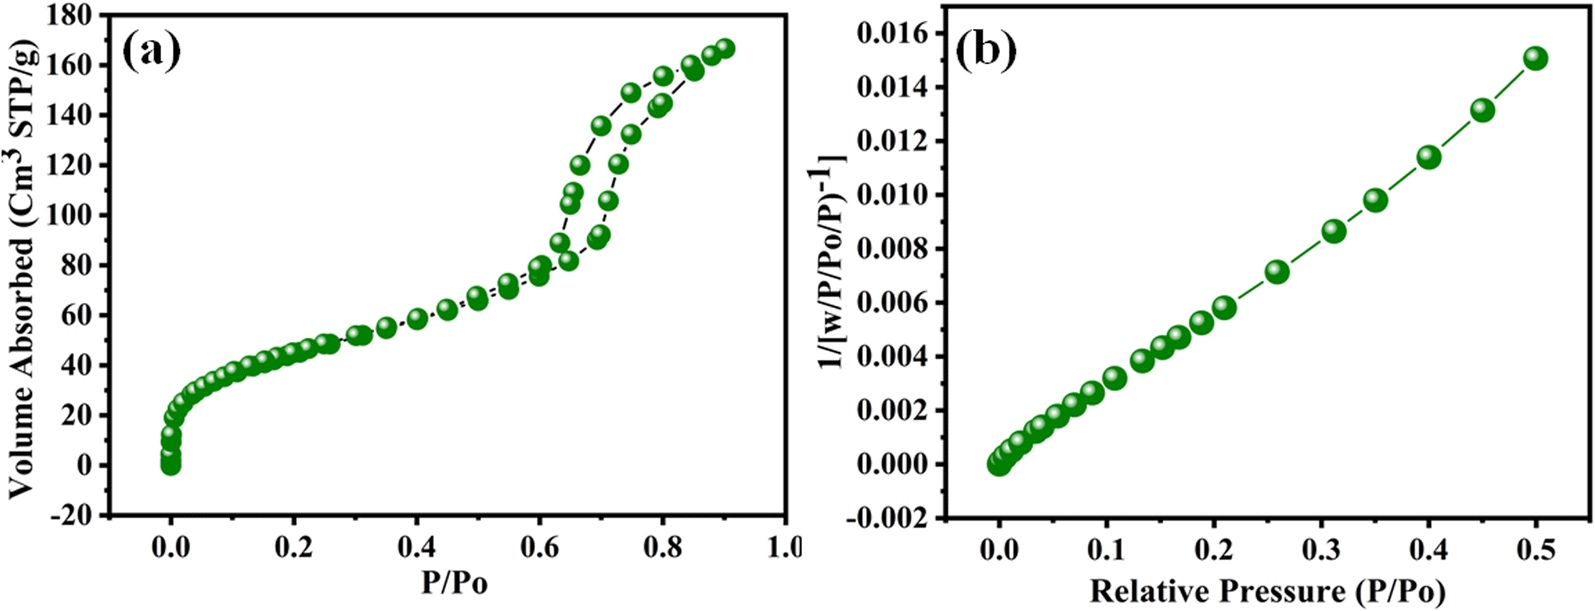
The specific surface area plays a crucial role in applications such as electrochemical biosensing applications. The specific surface area, pore volume, and porosity of the composite were analyzed by conducting nitrogen adsorption/desorption tests using BET analysis (Fig. 5(a and b)). The Bi2S3/CNF nanocomposite exhibited a specific surface area, pore volume, and pore diameter of 170.48 m2 g−1, 0.2852 cc g−1, and 5.4875 nm, respectively. The pore diameter of the prepared composites closely resembles a mesoporous structure. The nitrogen adsorption isotherm shape indicates the preservation of the structure and existence of microspores in electrocatalysts. The substantial surface area of the electrocatalysts facilitates improved interaction between the electrocatalysts and analyte, thereby enhancing the electrocatalytic activity.
 |
| | Fig. 5 (a) Adsorption and desorption isotherm and (b) BJH pore diameter analysis of the Bi2S3/CNF nanocomposites. | |
Electrochemical sensor
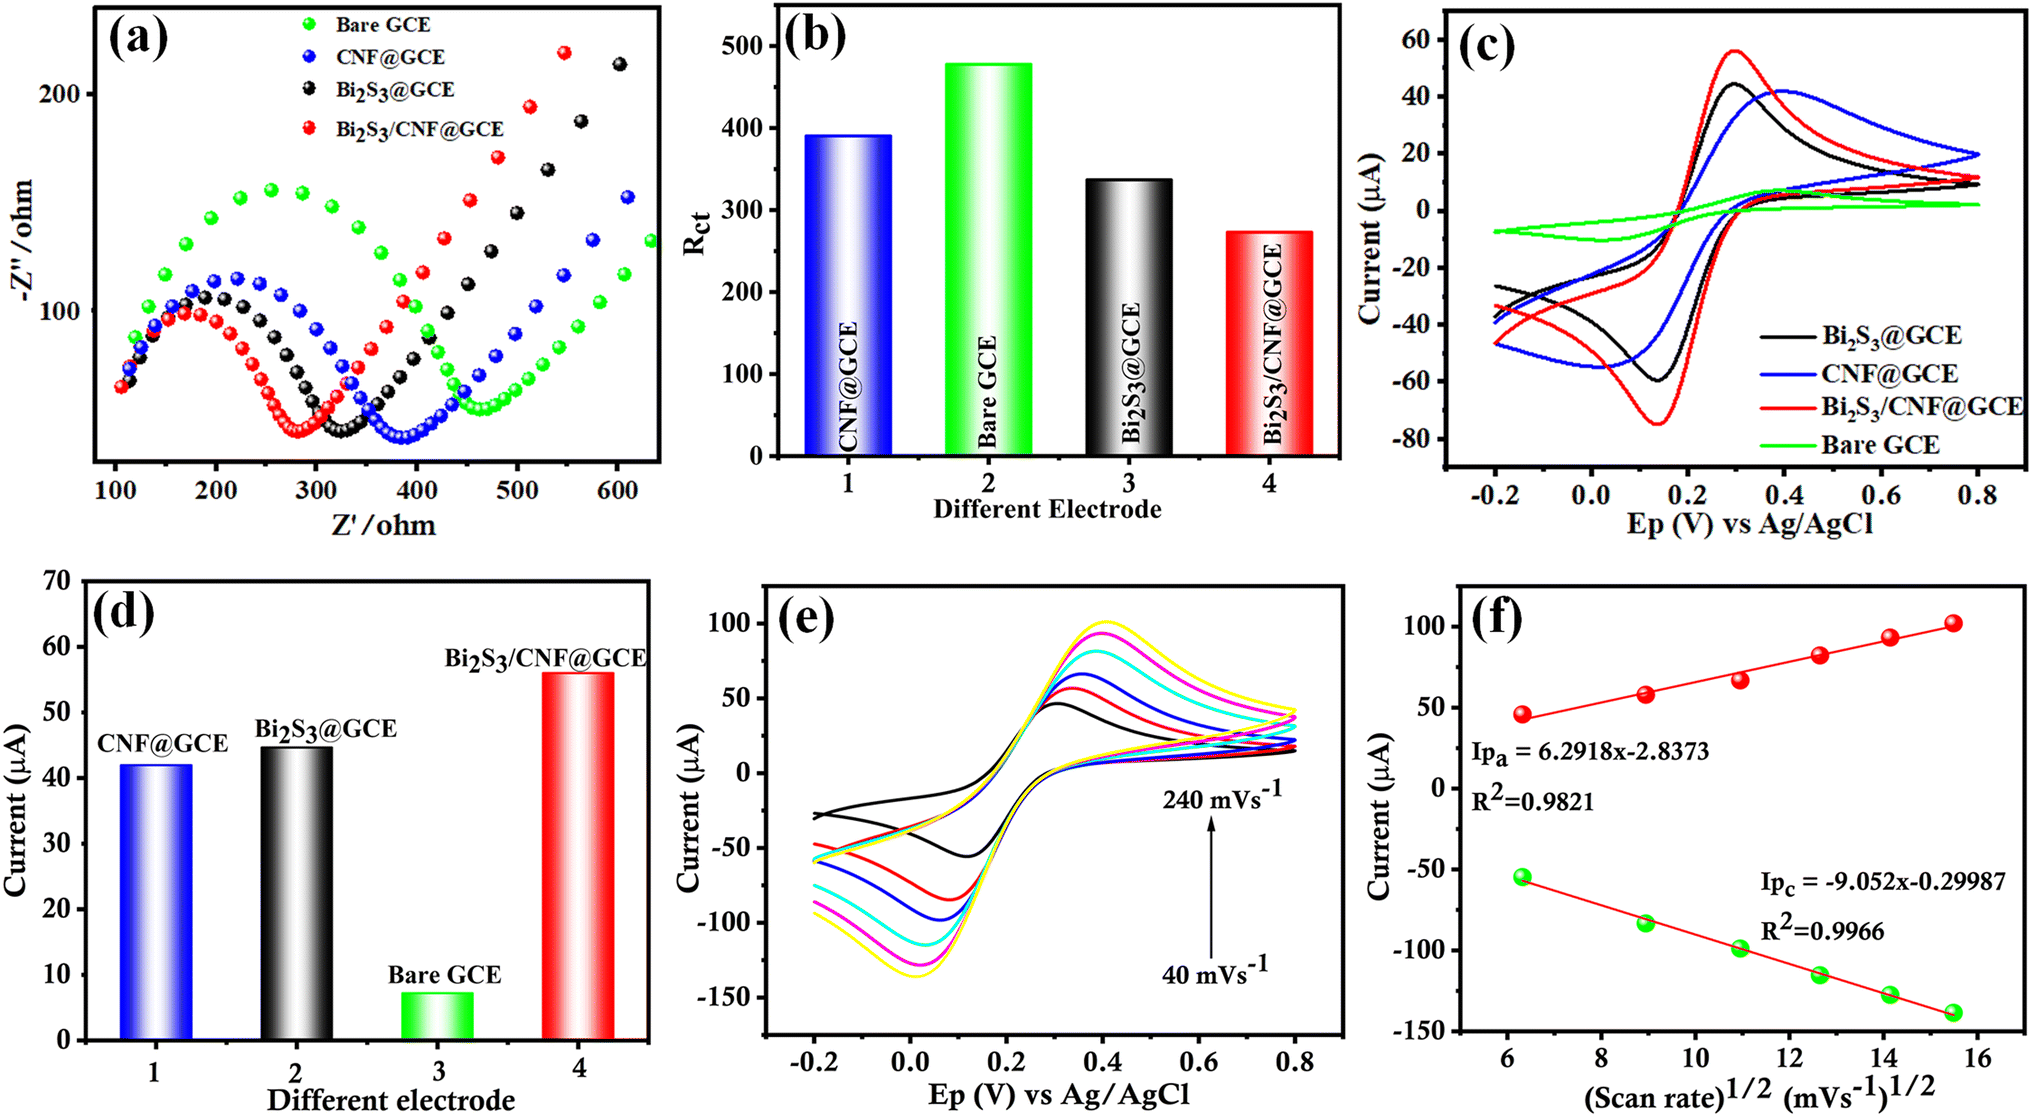
Electrochemical impedance spectroscopy (EIS) analysis is used to determine charge transfer resistance (Rct) values between the electrolyte and electrode. Fig. 6(a) shows the EIS Nyquist plots of the modified and unmodified electrodes, including bare GCE, Bi2S3/GCE, CNF/GCE and Bi2S3/CNF/GCE, in 5 mM [Fe(CN)6]3−/4− with 0.1 M KCl electrolyte, which were used to measure the Rct values in the frequency range from 0.1 to 100 kHz. The measured Rct values for the bare GCE, Bi2S3/GCE, CNF/GCE and Bi2S3/CNF/GCE are 477.5, 390.45, 336.69 and 295.95 Ω, respectively. Therefore, the recorded Rct values, particularly those for the Bi2S3/CNF/GCE with smaller values, suggest enhanced electron transfer kinetics, indicative of superior electrochemical activity. This is mainly due to the synergetic effect arising from the interaction among Bi2S3 and CNF. Fig. 6(b) shows the corresponding histogram of the Rct values. The cyclic voltammetry (CV) characteristics of the pure GCE, Bi2S3/GCE, CNF/GCE and Bi2S3/CNF/GCE were explored in 5 mM [Fe(CN)6]3−/4− with 0.1 M KCl electrolyte solution. Fig. 6(c) shows well-defined CV curves, revealing the reversible redox reaction of [Fe(CN)6]3−/4− on the surface of the GCE working electrode. The anodic peak current of the Bi2S3/CNF/GCE significantly increased compared to the bare GCE, Bi2S3/GCE and CNF/GCE, which indicates that the Bi2S3/CNF nanocomposite has a good electrocatalytic activity and enhanced the electron transfer ratio of potassium ferricyanide on the working electrode surface. Fig. 6(d) shows the equivalent histogram of the current response of the as-prepared samples, pure GCE, Bi2S3/GCE, CNF/GCE and Bi2S3/CNF/GCE, which was measured to be 7.2, 41.96, 44.67 and 56.01 μA, respectively. Conversely, the electrochemical active surface area of the modified and unmodified electrodes was calculated by using the Randles–Sevcik equation.41 The calculated electrochemical active surface area of the as prepared Bi2S3/CNF/GCE is 0.055 cm2. Fig. 6(e) shows the CV curves of the Bi2S3/CNF/GCE at a potential window ranging from −0.2 V to 0.8 V at different scan rates ranging from 40 to 240 mV s−1. The CV curves exhibited higher anodic and cathodic peak currents with perfect linearity. The corresponding linearity plot between the peak currents of the anodic and cathodic peaks, and scan rate is shown in Fig. 6(f), plotted for oxidation-reduction current versus square root of scan rate with coefficient (R2) values of 0.9821 and 0.9966, and the calculated regression equation is Ipa = 6.2918v1/2 (mV s−1) + 2.8373 and Ipc = −9.052v1/2 (mV s−1) + 0.29987, respectively.
 |
| | Fig. 6 (a) Nyquist plot of the different modified and unmodified electrodes, (b) corresponding bar chart between the Rct values and electrodes, (c) CV curves of the modified and unmodified electrodes in [Fe(CN)6]3−/4− at 50 mV s −1, (d) corresponding bar diagram between the oxidation peak current and various electrodes, (e) CV curve of the Bi2S3/CNF/GCE in [Fe(CN)6]3−/4− at different scan rates (40 mV s−1 to 240 mV s−1) and (f) corresponding linear fit. | |
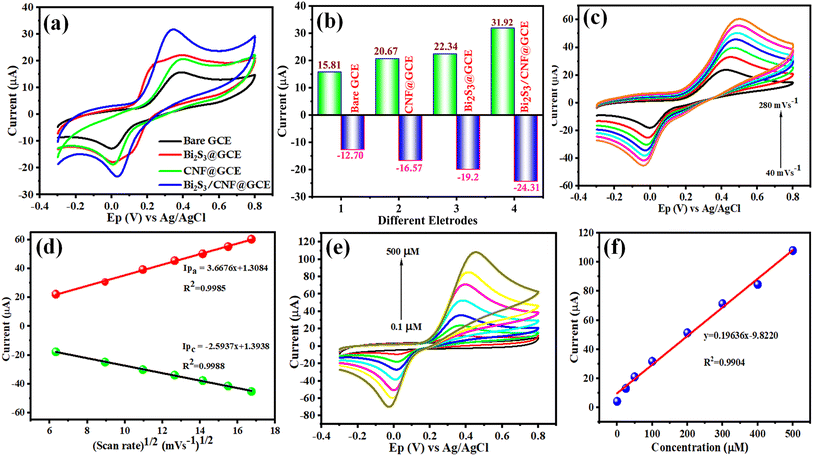
Analyte detection
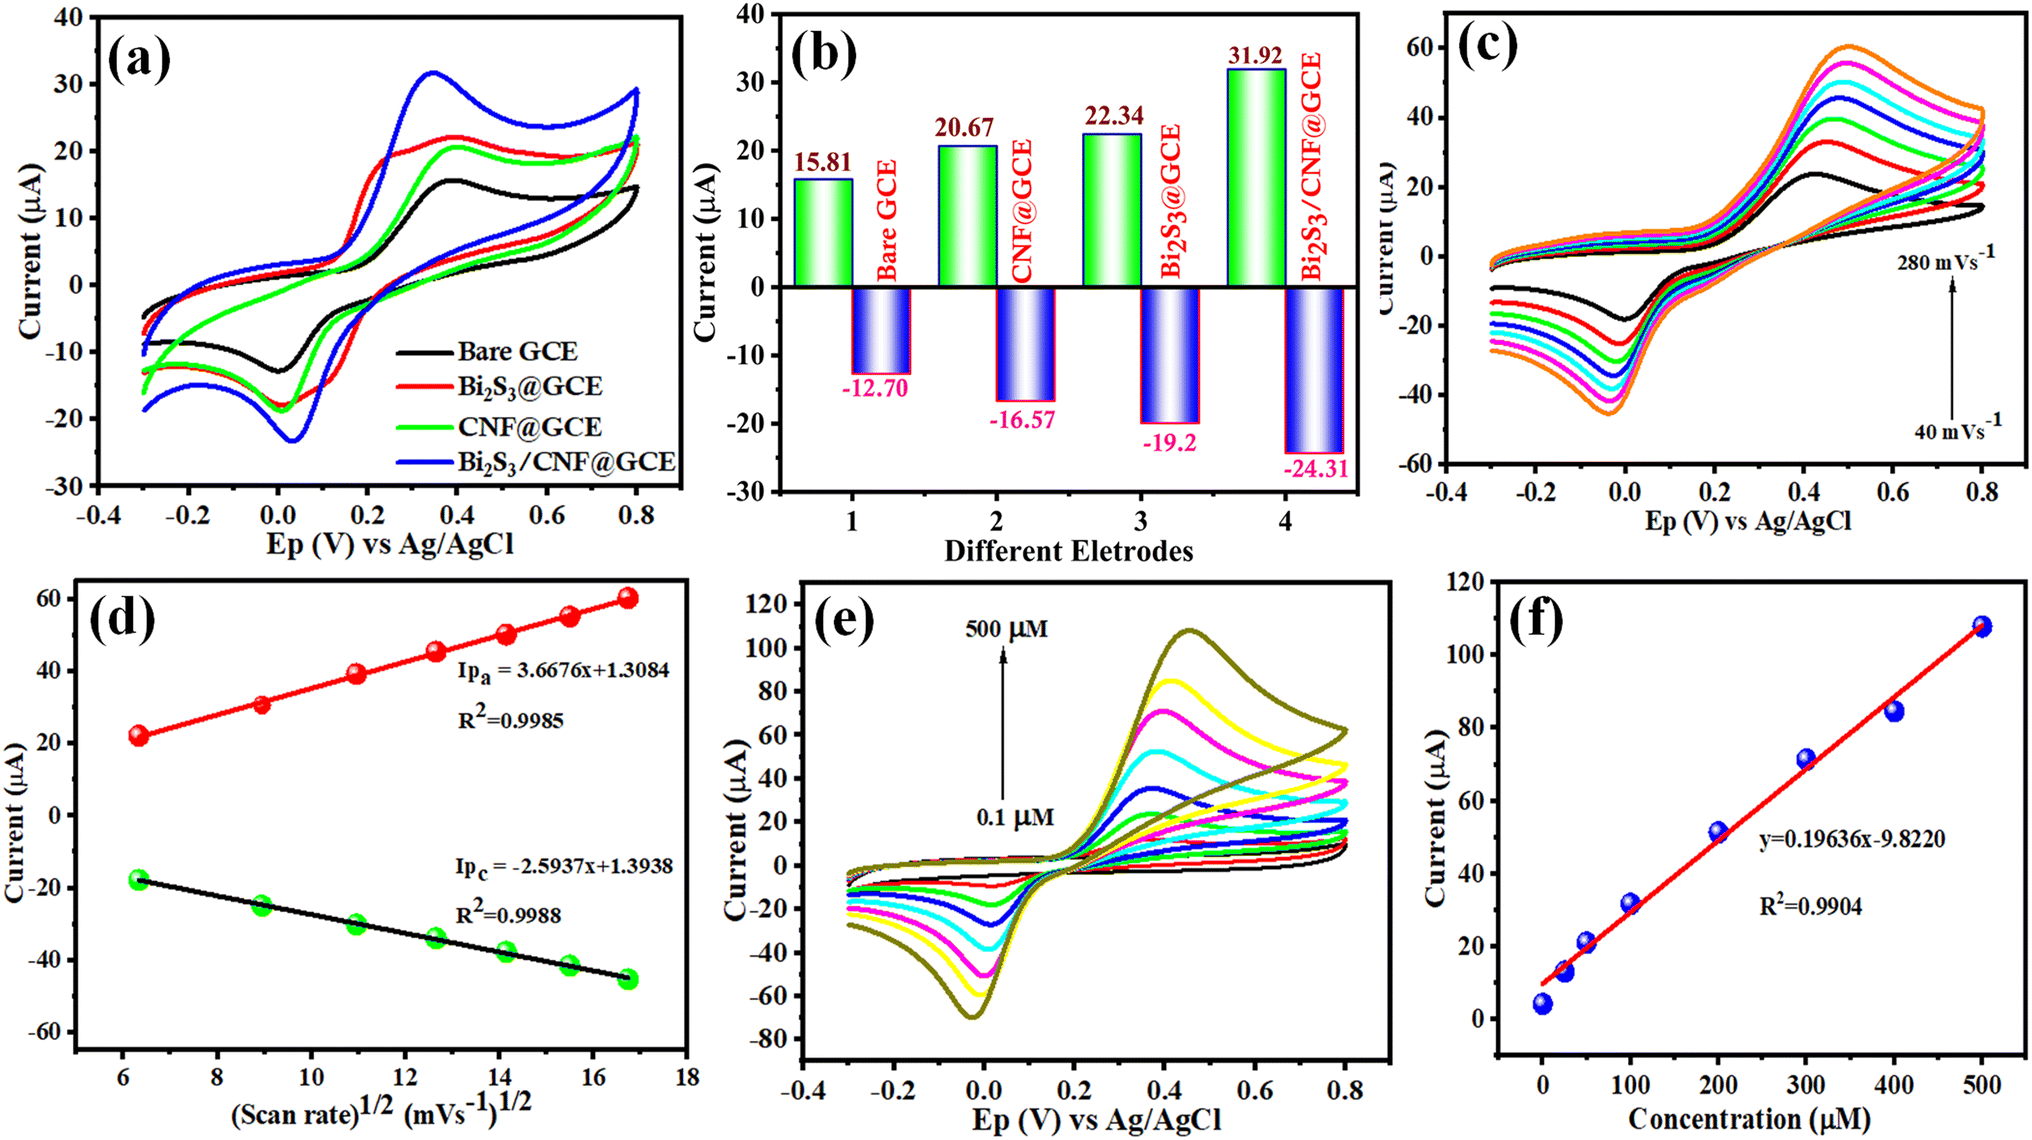
Under ideal conditions, the Bi2S3/CNF/GCE nanocomposites were examined with the bare GCE. Fig. 7(a) displays the CV curves of the bare GCE, Bi2S3/GCE, CNF/GCE and Bi2S3/CNF/GCE for the oxidation and reduction of CA (100 μM), which indicates that the Bi2S3/CNF/GCE reveals a high oxidation peak current (Ipa = 31.92) compared to the Bi2S3/GCE (Ipa = 22.34), CNF/GCE (Ipa = 20.67), and bare GCE (Ipa = 15.81). Fig. 7(b) shows the corresponding histogram of peak current. In comparison to the bare GCE, Bi2S3/GCE, and CNF/GCE samples, the increase in the oxidation response illustrates the electrochemical activity of the Bi2S3/CNF/GCE towards the detection of CA. Based on above findings, the Bi2S3/CNF/GCE has enhanced ability to detect CA. To examine electrochemical reaction kinetics, the electrocatalytic behaviour of CA was studied by performing a scan rate study in 0.1 M PBS (pH 7.0) solution. Fig. 7(c) shows the CV response of the Bi2S3/CNF/GCE at different scan rates. The oxidation and reduction current of CA increases linearly with an increase in the scan rate from 40 to 280 mV s−1, a perfect linear correlation was attained among the anodic current (Ipa) and cathodic current (Ipc), and the scan rate as displayed in Fig. 7(d). The linear regression curve of the equation can be denoted as Ipa = 3.6676x + 1.3084 and Ipc = −2.5937x + 1.3938 with a correlation co-efficient (R2) = 0.9985 and 0.9988, respectively. The above results indicate that the electrochemical oxidation of CA is observed by a surface-controlled process at the Bi2S3/CNF/GCE.
 |
| | Fig. 7 (a) CV curves of the modified and unmodified electrodes in the presence of PBS (pH 7.0) with 100 μM of CA at 50 mV s−1, (b) corresponding bar diagram of the oxidation peak current and cathodic peak current for the different electrodes, (c) CV curve of the Bi2S3/CNF/GCE in PBS (pH 7.0) at different scan rates (40 mV s −1 to 240 m V s−1), (d) corresponding linear fit, (e) CV curve of the Bi2S3/CNF/GCE modified electrode in the presence of PBS (pH 7.0) at different concentrations (0.1 μM to 500 μM) at 50 mV s−1, and (f) corresponding linear fit. | |
The electrochemical oxidation behaviour of CA was further analysed in 0.1 M PBS (pH 7.0) at a scan rate of 50 m Vs−1 under various concentrations. Fig. 7(e) clearly shows that the absence of the CA molecule produced no apparent peak, whereas the addition of 0.1 μM CA resulted in an individual reaction. In the concentration range between 0.1 μM and 500 μM, the peak current for the oxidation and reduction of CA increased linearly with each successive addition. The anodic peak and cathodic peak current values obtained from the CVs were plotted against the different concentrations of CA in Fig. 7(f). The calibration curve shows good linearity within the calibration range, with the linear regression equation of Ipa = 0.1963x – 9.8220 and R2 = 0.9904. Finally, the above results indicate that the Bi2S3/CNF/GCE has enhanced electrocatalytic oxidation behaviour towards CA.
pH effect
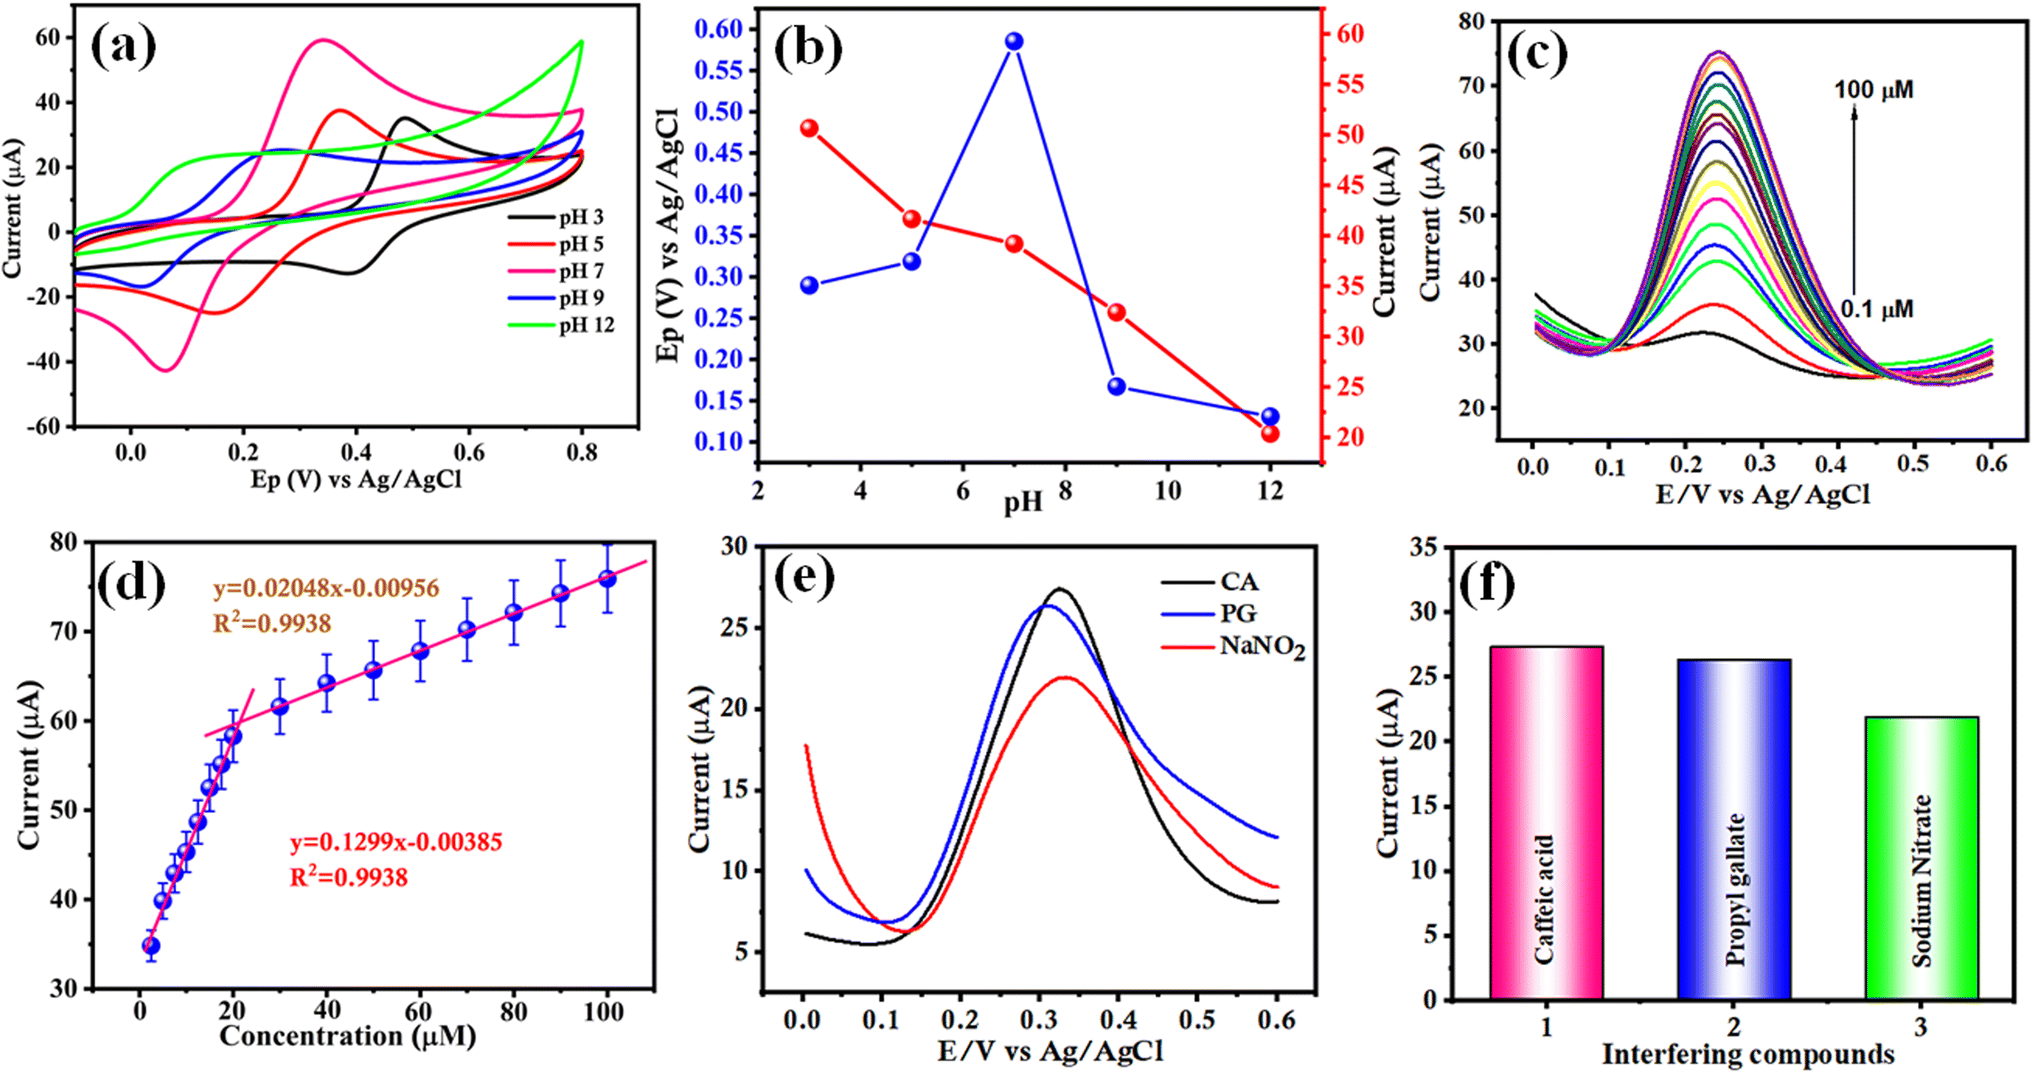
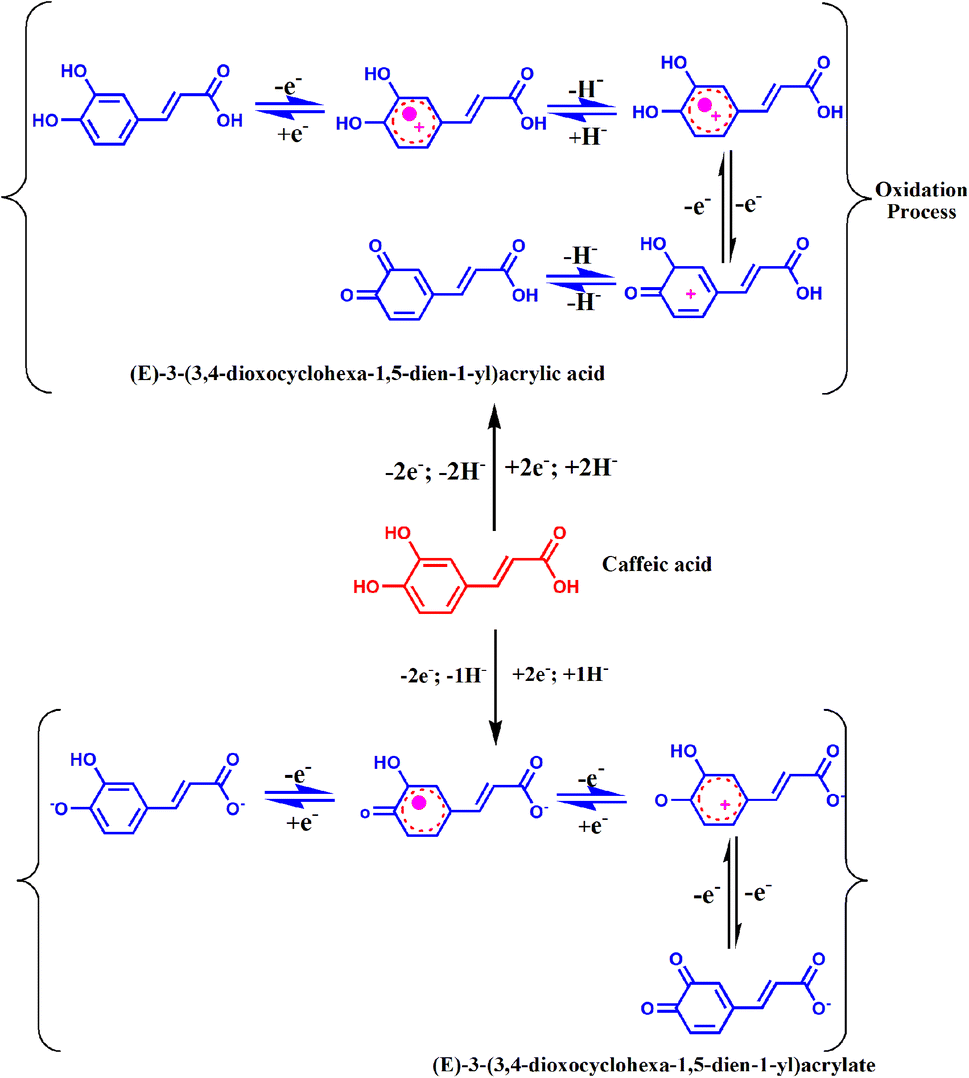
The hydrogen potential (pH) of the electrolyte solution significantly influences the electrochemical oxidation behaviour of CA, and thus, the response was obtained at different pH values (3.0 to 12.0) in the presence of 100 μM CA. Fig. 8(a) shows that the pH revealed the maximum peak current with the variation of the anodic peak current with different pHs. Furthermore, the Bi2S3/CNF/GCE shows cathodic and anodic peak potentials shifted in both directions. Moreover, the anodic peak current did not reach its maximum within the pH range of 3 to 12, so analytical evaluations and assessment of the sensor performance were conducted in aqueous solutions at pH 7, the pH value commonly preferred for analyzing food additive samples. Consequently, a linear correlation co-efficient was observed between the anodic peak potential and various pHs of the PBS solution with a calculated slope of Epa (V) − 236.4 mV pH−1 derived from the regression fitting equation displayed in Fig. 8(b). The slope value found for CA oxidation is close to the optimized value, suggesting that equal numbers of protons and electrons are involved in the CA oxidation based on the Nernst equation, and the reaction mechanism is displayed in Scheme 2. Based on above findings, in this investigation, pH 7.0 was found to be the optimum pH for electrochemical sensing of CA.42
 |
| | Fig. 8 (a) CV response of the Bi2S3/CNF/GCE in 100 μM CA solution at various pHs (3, 5, 7, 9, and 12) at a scan rate of 50 mV s−1, (b) corresponding calibration plot of pH (3–12) vs. oxidation and current response (Ipa) of CA over the Bi2S3/CNF/GCE, (c) DPV response of CA at the Bi2S3/CNF/GCE (0.1 μM to 100 μM) in the presence of 0.1 M of PBS (pH 7.0), (d) calibration plot of the oxidation peak current vs. various concentrations, (e) DPV response of CA oxidation in the presence of anti-interference compounds, CA, PG and NaNO2 and (f) corresponding bar diagram between of current vs. various compounds. | |
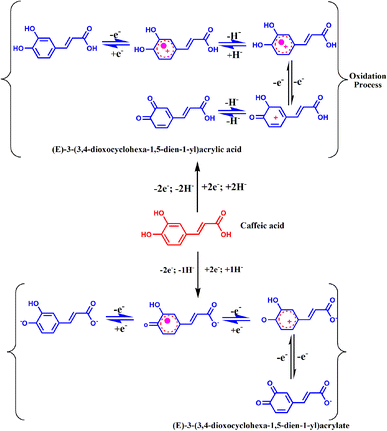 |
| | Scheme 2 Possible electrocatalytic mechanism of caffeic acid on the Bi2S3/CNF/GCE. | |
The CV technique clearly demonstrates the superior electrocatalytic performance of the prepared Bi2S3/CNF/GCE in catalyzing the oxidation of CA. In contrast, the differential pulse voltammetry (DPV) technique was used due to its high accuracy, simplicity, biocompatibility, increased sensitivity, ease of optimization and smaller background current. The DPV technique was used to record the response of the as-prepared Bi2S3/CNF/GCE to different concentrations of CA in 0.1 M of PBS (pH 7.0) as shown in Fig. 8(c). The DPV response acquired from the electrochemical oxidation of CA revealed a linear increase with respect to the increase of concentration, ranging from 0.1 μM to 100 μM. Fig. 8(d) shows the linear regression equation between the concentration (μM) and current response (Ipa) for the electrochemical oxidation behaviour of CA in the concentration range from 0.1 μM to 100 μM, and the anodic peak current Ipa = 0.1193x + 34.13 and Ipa = 0.12998 x +32.57. The calibration plot gave 0.9959 and 0.9938, respectively. The limit of detection (LOD) was calculated from the below equation.
| LOD = 3 × standard deviation (σ)/S |
where
σ = standard deviation of the three empty measurements and
S = slope of the calibration curve. The LOD was measured to be 108 nM using the above formula, and conversely, the limit of quantification (LOQ) has a significantly important role in electrochemical sensing applications. The LOQ was measured using the below equation, and the LOQ was obtained to be 0.361 μM.
Therefore, the Bi2S3/CNF/GCE shows superior electrocatalytic activity towards CA, a suitable electrode for electrochemical sensing applications.
Selectivity
Selectivity plays an essential role in enzymatic and non-enzymatic electrochemical biosensor applications. To examine the selectivity of CA on the Bi2S3/CNF/GCE, a number of possible interfering substances, such as propyl gallate and sodium nitrate, were investigated. Fig. 8(e) reveals the results of anti-interference studies of the Bi2S3/CNF/GCE using the DPV method with 100 μM CA, and after that, the effect of these interferents was evaluated in PBS (7.0) in the potential window of 0 to 0.6 V. Fig. 8(f) shows that biological species such as CA, PG, and SN did not interfere with CA detection (100 μM). Thus, the obtained results indicate the good selectivity of the Bi2S3/CNF/GCE towards CA. The comparison table (Table 1) is elaborated below, detailing several validation parameters and various methods as reported in the literature survey.
Table 1 Comparison of a few validation parameters of studied and previous methods for CA detection
| S. No. |
Electrode materials and analyte |
Methods |
Linear range (μM and nM) |
LOD (μM and nM) |
Real sample |
Ref. |
|
Sulphate based materials
|
| 1 |
PG/GCE (CA) |
SWVN |
4–400 μM |
0.12 μM |
Red wine |
43
|
| 2 |
GC/PEDOT-AuNPs-SV |
DPV |
10 μM to 1 mM |
4.25 μM |
Peach juice |
44
|
| 3 |
WS2/GCE (UA) |
DPV |
5 μM-1mM |
1.2 μM |
Blood serum |
45
|
![[thin space (1/6-em)]](https://www.rsc.org/images/entities/char_2009.gif) |
|
Carbon based materials
|
| 1 |
Glassy polymeric carbon (CA) |
DPV |
0.1–96.5 μM |
0.29 μM |
Red wine |
46
|
| 2 |
Poly (glutamic acid)/GCE (CA) |
DPV |
4.0–30 μM |
3.91 μM |
Red wine |
47
|
| 3 |
Molecularly imprinted siloxanes (CA) |
DPV |
0.5–60 μM |
0.15 μM |
Wine |
48
|
| 4 |
Bi2S3/CNF/GCE (CA) |
DPV |
0.1–500 μM |
108 nM |
Grape and apple juice |
This work |
Repeatability, reproducibility and stability
The repeatability of the as-prepared Bi2S3/CNF/GCE was examined using the DPV technique towards CA as shown in Fig. 9(a). The repeatability test was conducted for 4 consecutive measurements in the presence of 100 μM of CA, with a relative standard deviation (RSD) of 0.96%. Thus, the results suggest that the Bi2S3/CNF/GCE has good repeatability. Besides that, to study the reproducibility of the as-prepared Bi2S3/CNF/GCE for determining CA, an RSD of 1.24% was measured, which showed a good reproducibility (Fig. 9(b)). The stability of the Bi2S3/CNF/GCE was analysed for CA detection (100 μM) on various days (up to 7 days), and after 7 days, the oxidation peak current values decreased by 1.05% of their initial current response (Fig. 9(c)). Based on above findings, the Bi2S3/CNF nanocomposite is an effective electrocatalyst material for sensing applications.
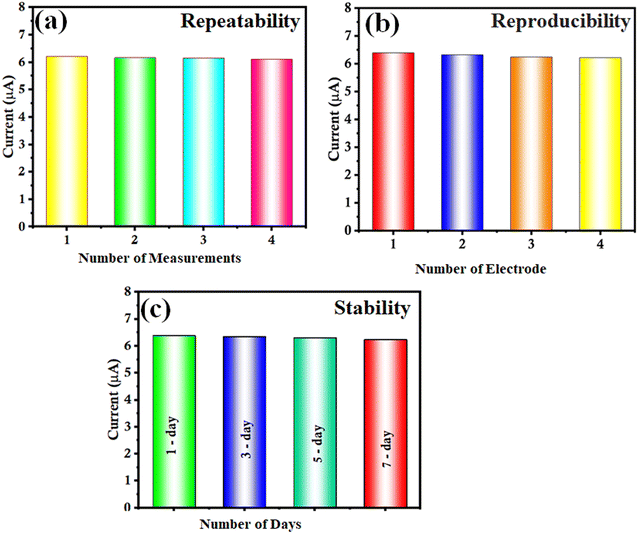 |
| | Fig. 9 (a) DPV response of 5 repeated measurements, (b) DPV response of 5 different electrodes under same conditions and (c) DPV response of electrode stability over 7 days. | |
Real sample analysis
The ability of the electrochemical sensor to detect CA in samples of grape juice and apple juice was investigated to assess its practical applicability. The grape and apple juice samples were purchased from the local market in Taoyuan, Taiwan. The samples were prepared by appropriately diluting them with distilled water and later adding a specified quantity of caffeic acid. The CA in the real samples was determined under same experimental conditions as revealed in Table 2. The results revealed the excellent efficiency of the designed sensor to detect CA in real samples, with an excellent recovery rate ranging from 84.8% to 97.5%. Thus, the overall results, including the real-time analysis, establish the potential use of the proposed sensor in CA detection.
Table 2 Comparison table for real sample analysis
| Real sample |
Added (μM) |
Found (μM) |
Recovery (%) |
RSD |
| Grape juice |
5 |
4.71 |
94.2 |
2.1 |
| 10 |
9.32 |
93.2 |
2.6 |
| 15 |
12.72 |
84.8 |
3.1 |
| Apple juice |
5 |
4.78 |
95.6 |
2.8 |
| 10 |
9.67 |
97.5 |
3.2 |
| 15 |
14.61 |
96.7 |
3 |
Conclusion
In summary, we have synthesized a Bi2S3/CNF nanocomposite via a simple one step ultrasonication method. The as prepared sample was characterized by different analytical techniques, such as XRD, FE-SEM, EDX, HR-TEM, and XPS. The as-synthesized Bi2S3 nanoparticles were successfully decorated on the CNFs, and this results in superior electrocatalytic properties towards CA using the CV and DPV techniques. The electrochemical studies revealed that the as-prepared Bi2S3/CNF/GCE demonstrated an excellent analytical performance towards the identification of CA. In a similar manner, the electrochemical analysis demonstrates that the Bi2S3/CNF/GCE revealed a smaller LOD, a wide linear range, good stability, and excellent repeatability and reproducibility. Additionally, the Bi2S3/CNF/GCE revealed superior selectivity, even in the presence of a similar structure of interfering analytes. In addition, the practical ability of CA detection in real sample analysis was evaluated in apple and grape juice samples with good recovery results. These overall results indicate that the Bi2S3/CNF/GCE nanocomposite could serve as an alternate electrode material for the simple sensitive and selective detection of CA in food beverages. Hence, the Bi2S3/CNF/GCE nanocomposite can be used as a competent electrode material for electrochemical sensing applications.
Author contributions
Balaji Parasuraman: conceptualization; investigation; writing – original draft; Sathishkumar Chinnapayan; data curation; formal analysis; Hariprasath Rangaraju: methodology; data curation; visualization; Paramasivam Shanmugam: visualization; investigation formal analysis; Sangaraju Sambasivam: data curation; conceptualization; Pazhanivel Thangavelu: investigation; supervision; visualization; Chi-Hsien Huang; project administration; validation; formal analysis.
Conflicts of interest
There are no conflicts to declare.
Acknowledgements
The authors would like to thank the Ministry of Education (NSTC 111-2221-E-131-017-MY2 and NSTC 112-2811-E-131-003) for the financial support and providing facilities for this study.
References
- M. Kuznowicz, T. Rębiś, A. Jędrzak, G. Nowaczyk, M. Szybowicz and T. Jesionowski, Microchim. Acta, 2022, 189, 159 CrossRef CAS PubMed.
- G. A. Mohammadi, I. Sheikhshoaie, H. Beitollahi, M. R. Aflatoonian and S. Tajik, Int. J. Environ. Anal. Chem., 2023, 103, 6526–6538 CrossRef CAS.
- K. M. M. Espíndola, R. G. Ferreira, L. E. M. Narvaez, A. C. R. Silva Rosario, A. H. M. da Silva, A. G. B. Silva, A. P. O. Vieira and M. C. Monteiro, Front. Oncol., 2019, 9, 541 CrossRef PubMed.
- E. Pinho, G. Soares and M. Henriques, J. Microencapsulation, 2015, 32, 804–810 CrossRef CAS PubMed.
- I. Gulcin, Toxicology, 2006, 217, 213–220 CrossRef PubMed.
- M. Alam, S. Ahmed, A. M. Elasbali, M. Adnan, S. Alam, Md. I. Hassan and V. R. Pasupuleti, Front. Oncol., 2022, 12, 860508 CrossRef CAS PubMed.
- H. Beitollahi, S. Tajik, F. G. Nejad, M. B. Askari and P. Salarizadeh, Int. J. Environ. Anal. Chem., 2023, 103, 7647–7665 CrossRef CAS.
- R. M. Costa, I. W. L. Bezerra, A. M. Souza, K. G. Torres, G. S. Pereira, C. M. M. Morais and A. G. Oliveira, Nutrients, 2023, 15, 3009 CrossRef CAS PubMed.
- M. I. Razboršek, M. Ivanović and M. Kolar, Molecules, 2021, 26, 2475 CrossRef PubMed.
- X. Wang, W. Li, X. Ma, Y. Chu, S. Li, J. Guo, Y. Jia, S. Zhou, Y. Zhu and C. Liu, Biomed. Chromatogr., 2015, 29, 552–559 CrossRef CAS PubMed.
- W. Zhou, J. Shan, S. Wang, W. Ju, M. Meng, B. Cai and L. Di, J. Chromatogr. B, 2014, 949–950, 7–15 CrossRef CAS PubMed.
- Q. Duan, J. Cao and J. Zhang, Anal. Methods, 2012, 4, 3027 RSC.
- S. Kogularasu, Y.-Y. Lee, G.-P. Chang-Chien, M. Govindasamy and J.-K. Sheu, J. Electrochem. Soc., 2023, 170, 077514 CrossRef.
- R. Razavi, F. Garkani Nejad, S. A. Ahmadi and H. Beitollahi, Electrochem. Commun., 2024, 159, 107639 CrossRef CAS.
- R. Nehru, Y.-F. Hsu, S.-F. Wang, C.-W. Chen and C.-D. Dong, ACS Appl. Bio Mater., 2021, 4, 7497–7508 CrossRef CAS PubMed.
- R. Sakthivel, A. Geetha and J. Dineshkumar, J. Mater. Sci. Mater. Electron., 2023, 34, 1495 CrossRef CAS.
- N. R. Barveen, S. Chinnapaiyan, T.-J. Wang and C.-H. Huang, Chemosphere, 2024, 346, 140677 CrossRef CAS PubMed.
- V. S. Haritha, S. R. Sarath Kumar and R. B. Rakhi, ACS Omega, 2023, 8, 8695–8702 CrossRef CAS PubMed.
- S. Velmurugan, S. Palanisamy and T. C.-K. Yang, Sens. Actuators, B, 2020, 316, 128106 CrossRef CAS.
- A. Santhan and K.-Y. Hwa, Sensors, 2023, 23, 8849 CrossRef CAS PubMed.
- J. Lu, Q. Han, X. Yang, L. Lu and X. Wang, Mater. Lett., 2007, 61, 3425–3428 CrossRef CAS.
- B. Parasuraman, V. Vasudevan, B. Kandasamy, H. Rangaraju and P. Thangavelu, Environ. Sci. Pollut. Res., 2023 DOI:10.1007/s11356-023-26627-9.
- X. Yan, Y. Gu, C. Li, B. Zheng, Y. Li, T. Zhang, Z. Zhang and M. Yang, Sens. Actuators, B, 2018, 257, 936–943 CrossRef CAS.
- S. Tajik, H. Beitollahi, F. G. Nejad, M. Safaei, K. Zhang, Q. Van Le, R. S. Varma, H. W. Jang and M. Shokouhimehr, RSC Adv., 2020, 10, 21561–21581 RSC.
- J. Zou, S. Wu, Y. Liu, Y. Sun, Y. Cao, J.-P. Hsu, A. T. Shen Wee and J. Jiang, Carbon, 2018, 130, 652–663 CrossRef CAS.
- J. Gaidukevic, R. Aukstakojyte, J. Barkauskas, G. Niaura, T. Murauskas and R. Pauliukaite, Appl. Surf. Sci., 2022, 592, 153257 CrossRef CAS.
- K. Gong, Y. Dong, S. Xiong, Y. Chen and L. Mao, Biosens. Bioelectron., 2004, 20, 253–259 CrossRef CAS PubMed.
- C. Yang, Microchim. Acta, 2004, 148, 87–92 CrossRef CAS.
- T. Oliveira and S. Morais, Appl. Sci., 2018, 8, 1925 CrossRef.
- Y. Niu, H. Xie, G. Luo, W. Weng, C. Ruan, G. Li and W. Sun, RSC Adv., 2019, 9, 4480–4487 RSC.
- S. Tajik, H. Beitollahi, S. Shahsavari and F. G. Nejad, Chemosphere, 2022, 291, 132736 CrossRef CAS PubMed.
- S. Tajik, H. Beitollahi, H. W. Jang and M. Shokouhimehr, Talanta, 2021, 232, 122379 CrossRef CAS PubMed.
- M. Mehmandoust, N. Erk, C. Karaman and O. Karaman, Chemosphere, 2022, 291, 132807 CrossRef CAS PubMed.
- F. Garkani Nejad, S. Tajik, H. Beitollahi and I. Sheikhshoaie, Talanta, 2021, 228, 122075 CrossRef CAS PubMed.
- Y. Han, R. Li, C. Brückner and T. Vadas, C, 2018, 4, 40 Search PubMed.
- B. Parasuraman, V. Vasudevan, B. Kandasamy, H. Rangaraju and P. Thangavelu, Environ. Sci. Pollut. Res., 2023 DOI:10.1007/s11356-023-26627-9.
- Q. Yao, B. Fan, Y. Xiong, C. Jin, Q. Sun and C. Sheng, Sci. Rep., 2017, 7, 45914 CrossRef CAS PubMed.
- J. Hou, S. Jiao, H. Zhu and R. V. Kumar, CrystEngComm, 2011, 13, 4735 RSC.
- R. Cao, H. Yang, X. Deng, S. Zhang and X. Xu, Sci. Rep., 2017, 7, 15001 CrossRef PubMed.
- M. Ayiania, M. Smith, A. J. R. Hensley, L. Scudiero, J.-S. McEwen and M. Garcia-Perez, Carbon, 2020, 162, 528–544 CrossRef CAS.
- M. J. Gira, K. P. Tkacz and J. R. Hampton, Nano Convergence, 2016, 3, 6 CrossRef PubMed.
- A. Masek, E. Chrzescijanska and M. Latos, Int. J. Electrochem. Sci., 2016, 11, 10644–10658 CrossRef CAS.
- D. P. Santos, M. F. Bergamini, A. G. Fogg and M. V. B. Zanoni, Microchim. Acta, 2005, 151, 127–134 CrossRef CAS.
- D. Bottari, L. Pigani, C. Zanardi, F. Terzi, S. V. Paţurcă, S. D. Grigorescu, C. Matei, C. Lete and S. Lupu, Chemosensors, 2019, 7, 65 CrossRef CAS.
- L. Durai, C. Y. Kong and S. Badhulika, Mater. Sci. Eng. Carbon, 2020, 107, 110217 CrossRef CAS PubMed.
- L. F. da Silva, N. Ramos Stradiotto and H. P. Oliveira, Electroanalysis, 2008, 20, 1252–1258 CrossRef CAS.
- D. P. Santos, M. F. Bergamini, A. G. Fogg and M. V. B. Zanoni, Microchim. Acta, 2005, 151, 127–134 CrossRef CAS.
- F. R. F. Leite, W. d. J. R. Santos and L. T. Kubota, Sens. Actuators, B, 2014, 193, 238–246 CrossRef CAS.
|
| This journal is © The Royal Society of Chemistry 2024 |
Click here to see how this site uses Cookies. View our privacy policy here. 
 Open Access Article
 This Open Access Article is licensed under a Creative Commons Attribution-Non Commercial 3.0 Unported Licence
 d,
Pazhanivel
Thangavelu
d,
Pazhanivel
Thangavelu