Computational modeling for the enhancement of thermosonicated Sohphie (Myrica esculenta) fruit juice quality using artificial neural networks (ANN) coupled with a genetic algorithm†
Received
3rd January 2024
, Accepted 4th April 2024
First published on 18th April 2024
Abstract
This study investigated the impact of thermosonication on enhancing the nutritional characteristics of juice derived from Sohphie (Myrica esculenta) fruits. This investigation introduces an innovative approach utilizing artificial neural networks (ANNs) for the multifaceted optimization of the juice extraction process. Specifically, we focused on determining the most effective extraction parameters for thermosonication, including amplitude (30%, 40%, and 50%), treatment time (15, 30, 45, and 60 min) and temperature (30 °C, 40 °C, and 50 °C). The primary objective of this approach was to augment the nutritional and microbiological properties of Sohphie juice by improving its quality attributes such as ascorbic acid (AA) content, anti-oxidant activity (AOA), total anthocyanin content (TAC), total carotenoid content (TCC), total flavonoid content (TFC), total phenolic content (TPC), total viable count (TVC), and yeast and mould count (YMC). The maximum levels of AA (58.74 ± 3.56 mg/100 mL), AOA (66.11% ± 3.92%), TAC (48.50 ± 4.57 μg mL−1), TCC (133.60 ± 5.17 βCE μg mL−1), TFC (55.49 ± 3.86 mg quercetin equivalents (QE) per mL), TPC (78.94 ± 4.84 mg gallic acid equivalents (GAE) per mL), TVC (2.44 ± 0.23![[thin space (1/6-em)]](https://www.rsc.org/images/entities/char_2009.gif) log CFU mL−1) and YMC (1.01 ± 0.11log CFU mL−1) were obtained in thermosonicated Sohphie juices (TSSJ) under optimal conditions. This study highlights that artificial neural networks (ANNs) coupled with a genetic algorithm (GA) are a beneficial resource for forecasting the extraction efficiency of Sohphie fruit juice (SJ) and suggests that employing thermosonication as a preservation method for SJ can potentially replace traditional thermal pasteurization. This strategy has the potential to reduce or prevent quality deterioration while enhancing the functionality of the juice.
log CFU mL−1) and YMC (1.01 ± 0.11log CFU mL−1) were obtained in thermosonicated Sohphie juices (TSSJ) under optimal conditions. This study highlights that artificial neural networks (ANNs) coupled with a genetic algorithm (GA) are a beneficial resource for forecasting the extraction efficiency of Sohphie fruit juice (SJ) and suggests that employing thermosonication as a preservation method for SJ can potentially replace traditional thermal pasteurization. This strategy has the potential to reduce or prevent quality deterioration while enhancing the functionality of the juice.
Sustainability spotlight
Sohphie fruits are rich in essential vitamins (C and A), carotenoids, flavonoids, and dietary fiber, offering antioxidant properties and digestive benefits. However, preserving their nutritional value presents challenges due to their rapid degradation. Furthermore, traditional thermal treatments can impact their taste and appearance, leading researchers to explore ultrasonication as an eco-friendly alternative. In this case, optimizing ultrasound parameters, such as exposure time, amplitude, and temperature, is crucial for efficient large-scale implementation. Ultrasound technology enhances extraction efficiency, product quality, and processing speed, making it valuable in the food and beverage industry. Artificial neural networks (ANNs) are increasingly used in the food industry to enhance food quality by recognizing complex patterns in data and predicting quality based on parameters such as processing conditions. This capability optimizes processes, ensures consistency, and aids in real-time quality control during processing or storage. ANNs also provide decision support for product development, potentially reducing costs through process optimization and waste reduction. Thermosonication techniques not only provide a competitive market advantage for Sohphie fruit juice but also align with sustainability and environmental consciousness goals.
|
1. Introduction
The escalating food market demand for natural food products is driving the food industry to replace synthetic ingredients. Customers now prefer minimally processed juices without additives that have an adequate shelf life and nutritional value.1,2 Owing to the limited shelf life of certain fruits, they are transformed into various products such as fruit juices. The nutritional composition of juices emphasizes their abundant antioxidants, vitamins, and minerals. Originally, heat treatment (pasteurization) was utilized to reduce the presence of detrimental microorganisms and enzymes and extend the product shelf life. However, this method led to negative effects such as changes in nutrition, color, flavor, properties, and overall quality.2 As a result, researchers have sought alternative techniques to meet the growing demand while enhancing the quality and safety of the fruit juices.3,4
Myrica esculenta, generally known as Sohphie fruit, is an essential species found in the eastern Himalayas. It is a small to medium-sized round fruit, typically about 1–2 inches in diameter. It has a smooth, thin, and edible skin, which is usually green when unripe, turning yellow or orange when ripe. The fruit contains a single large seed and has a sweet, tart flavor. The tree itself is medium to large in size, with dense foliage and small, oval-shaped leaves (as illustrated in Fig. 1). It holds significant socio-economic importance but remains underutilized. This fruit is predominantly found in regions such as Kumaon, Garhwal, Sikkim, Punjab, and Khasi Hills (Meghalaya) in India.5 Sohphie fruit holds significant socio-economic value and is widely distributed across the Himalayan mountains.6 It is renowned for its extensive therapeutic properties as it exhibits therapeutic effects against various conditions, including anemia, ulcers, fever, cough, diarrhea, and infections related to the ear, nose and throat (ENT).7 One of the key bioactive compounds in M. esculenta is myricitrin, which plays a crucial role in its numerous biological activities. Additionally, this fruit contains several other chemical constituents such as minicanal, myricanone, quercetin, castalagin, myriconol, gallic acid, and catechin.7 These compounds contribute to the medicinal characteristics of Sohphie fruit and make it a valuable resource for natural remedies.5 However, this fruit is highly perishable and seasonal, leading to significant losses due to inadequate processing facilities, storage, and transportation.4 Thus, to preserve the bioactive components within Sohphie fruit, a thermal stabilization process is considered suitable, given its vulnerability to degradation when exposed to conventional treatment techniques.8
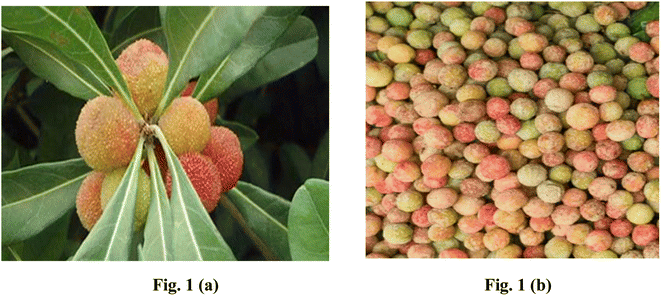 |
| | Fig. 1 Photographs of Soh-shang fruits showing both (a) fresh fruits on a tree and (b) fully ripened fruits. | |
Thermo-sonication (TS), a technique that combines moderate heat treatment and acoustic energy (ultrasound waves), has been found to effectively eliminate microbial loads in juices, while preserving their nutritional content. This method has been proven to be advantageous compared to traditional thermal methods given that it maintains the nutritional integrity of the juices.2,3 The TS process involves the combination of heat and high-frequency sound waves, which generate mechanical energy when ultrasound is applied to the sample. A series of compression and rarefaction takes place inside the molecules of the sample, causing the formation, growth, and implosion of gas bubbles in the fluid. This effect is termed sonolysis, resulting in cell membrane disintegration and mass transfer of intracellular materials into the juice from the matrices. Additionally, TS provides advantages such as high consistency, reduced energy consumption, and improved throughput compared to conventional methods.4,9,10 Moreover, TS treatment has been observed to enhance the bioactive components in several fruit juices, while effectively eliminating harmful microorganisms. This method ensures the safety of juices by reducing their microbial load and elevating their nutritional/functional properties,11 as demonstrated in hog plum,12 star-fruits,13 apple14 fruit juice, and lapsi15 fruit juice.
The structure and operation of the human cerebral cortex serve as the basis for the artificial neural network (ANN), which is a computational learning system. It has the capacity to replicate food processing procedures and anticipate crucial quality characteristics by manipulating various processing variables. This empowers the fine-tuning of processing conditions for the attainment of desired quality features, cost reduction, and waste minimization. ANN has been proven to be a versatile and powerful tool for modeling and optimization in various industries, particularly in the field of food processing. Numerous researchers have utilized artificial neural networks (ANNs) to simulate and enhance process variables in the production of a wide range of fruit juices, including amora16 and pomegranate juice.17 Artificial neural networks (ANNs) provide numerous advantages compared to other commonly used optimization tools such as response surface methodology. These advantages include the absence of prior knowledge requirements, non-linearity, flexibility, robustness, adaptation capabilities, learning and parallel processing, and the ability to generalize.
To date, there are no previously published accounts pertaining to the application of TS in Sohphie fruit juice (SJ) processing. Hence, this investigation endeavored to employ both TS and thermal pasteurization (PS) techniques in the processing of SJ and evaluate their impact on its quality characteristics. Furthermore, an ANN model was constructed to predict the optimization of process parameters, with the objective of enhancing the preservation of nutritional properties, improving the quality of the juice, and increasing the overall efficiency.
2. Materials and methods
2.1 Sohphie (Myrica esculenta) fruit sample
Mature Sohphie fruits, collected from a plantation close to the Shillong Community Market in Meghalaya, were carefully harvested and transported to the Food Engineering and Technology Laboratory at CITK, Kokrajhar in a well-insulated container maintained at 4 °C. Upon arrival, fruits without any visible defects or damage were sorted, their stalks removed, and then they were washed, air-dried, and sliced into small pieces (2–3 cm) before juice extraction.
2.2 Chemicals
The chemicals utilized in this research were obtained from two distinct suppliers, i.e., Sigma Aldrich (located in Bengaluru, India) and HiMedia Chemicals (based in Mumbai, India). Furthermore, the reagents employed for the microbial analysis were procured from Merck, Darmstadt, Germany.
2.3 Juice preparation
Ripe Sohphie fruits with an approximate size of 2–3 cm were carefully crushed utilizing a domestic grinder. To ensure its purity, the juice was filtered using filter paper (Whatman number one) to remove any residual impurities. The juice was categorized into three distinct groups, i.e., raw juice (raw), the pasteurized Sohphie juice (PSSJ), and thermosonicated Sohphie juice (TSSJ). It is worth noting that all the juice samples were processed on the same day they were separated.
2.4 Pasteurization of the juices
SJ underwent thermal treatment in a research facility using a vertical pasteurizer called Mac-Autoclave Vertical (Macro Scientific Works Pvt. Ltd in Delhi, India). The juice was exposed to a temperature of 90 °C for a duration of 60 s.18 After the pasteurization process, the samples underwent a cooling phase in an ice bath. The precise pasteurization conditions were chosen to emulate the conventional industrial approach used in juice processing. Typically, this involved subjecting the juice to temperatures between 90 °C and 95 °C for a period of 15 to 60 s. The primary objective of this thermal treatment was to effectively decrease the microbial load by up to 5log units.18,19
2.5 Thermosonication of the juices
The TS treatments on SJ were carried out utilizing an ultrasonicator (Sonics & Materials, Inc., Newton, CT, USA). The treatments were performed at different temperatures of 30 °C, 40 °C, and 50 °C, using the full power capacity of 750 W.4 The juice samples, totalling 100 mL, underwent treatment at different times of 15, 30, 45, and 60 min. This treatment was conducted at three distinct amplitudes of 30%, 40%, and 50%.20 To prevent any interference with light, the sonication process was carried out in a dark environment. After sonication, SJ was meticulously transferred to sanitized containers and stored at a temperature of 4 °C until further examination.
2.6 Determination of physicochemical properties
2.6.1 pH, total soluble solid and titratable acidity.
The pH levels of both the control and treated SJ were assessed at a temperature of 25 ± 1 °C using a digital pH meter (OAKTON pH Testr3, Cole Parmer India Pvt. Ltd, Mumbai, India).9 The TSS levels of SJ were determined using a refractometer (Master-3M ATAGO, Tokyo), and the findings were expressed as °Brix.3 The titratable acidity (TA) of the control, PSSJ and TSSJ was determined using the AOAC method.21
2.6.2 Cloudiness and browning index.
Both the treated and untreated SJ, in volumes of 5 mL each, underwent centrifugation at room temperature for 10 min at 6000 rpm utilizing a centrifuge (Remi C-24BL, India). Following separation, the liquid portion, known as the supernatant, was used to evaluate the cloudiness (CI) and browning index (BI) of the Sohphie fruit juice (SJ). A UV-Vis spectrophotometer (LAMDA-35 Elmer Perkin, USA) was used to measure the absorbance at 660 nm to determine the extent of cloudiness.1
To calculate the browning index of the juice samples (raw, PSSJ and TSSJ), 5 mL of supernatant and 5 mL of ethanol were measured and thoroughly mixed. Using a UV-Vis spectrophotometer, the absorbance of the mixture was measured at a wavelength of 420 nm (LAMDA-35 Elmer Perkin, USA).14
2.7 Determination of functional properties
2.7.1 Ascorbic acid content.
The iodometry technique was employed to determine the ascorbic acid (AA) content of SJ. Briefly, 0.25 g of dissolved starch was measured and mixed in 50 mL water that was almost boiling in a 100 mL conical flask. After cooling, the mixture was stirred to completely dissolve the starch. Then, 2 g of potassium iodide and 1.3 g of iodine were mixed in a 100 mL beaker. Iodine was completely dissolved after adding a few millilitres of distilled water and swirling it. Subsequently, the iodine solution was gently moved to a 1 L volumetric flask, making sure to rinse the flask with distilled water to remove any remaining solution. To attain the necessary volume, distilled water was supplemented in the 1 L volumetric flask. Then, a 20 mL portion of the sample solution (raw, PSSJ, and TSSJ) was transferred to a 250 mL conical flask. Then, 150 mL of distilled water and 1 mL of starch indicator solution were put into this flask. An iodine solution containing 0.005 mol L−1 was used to titrate the sample. The formation of the starch–iodine complex was indicated by the first permanent trace of a dark blue-black colour, which served as the endpoint of the titration. Finally, the amount of ascorbic acid in each 100 mL sample of juice was measured in mg.22
2.7.2 Antioxidant activity.
The antioxidant activity (AOA) levels in SJ were determined by utilizing the DPPH technique.23 Briefly, 2 mL of a DPPH solution (0.2 mM in ethanol) with a measured 2 mL portion of the juice sample was mixed. The resulting mixture was left undisturbed at room temperature (25 ± 1 °C) for 30 min in the dark. The blank was subjected to the same procedure, but instead of using the sample, ethanol was used. A UV spectrophotometer (LAMDA-35 Elmer Perkin, USA) was utilized to measure the absorbance values of the samples and the blank at 517 nm. The percentage (%) scavenging activity of DPPH radical was determined using the following equation.| | | DPPH radical scavenging activity (%) = (A0 − A1)/A0 | (1) |
where A0 = absorbance of the control and A1 = absorbance of the juice.
2.7.3 Total anthocyanin content.
The total anthocyanin content (TAC) of SJ (untreated/treated) was measured by the pH differential method.24 Juice samples totalling two 10 mL portions were taken. A couple of drops of a buffering acid solution (pH 1) was added to one section, while a few drops of an alkaline buffer solution (pH 4.5) was added to the other. The pH of each portion was meticulously measured with a pH metre to make sure it stabilised at the appropriate pH levels. Using a UV-spectrophotometer, the absorbance of the samples was determined at 510 nm and 700 nm (LAMDA-35 Elmer Perkin, USA). The absorbance was calculated as Abs = (A510 nm − A700 nm) pH1.0 − (A510 nm − A700 nm) pH4.5 with the molar extinction coefficient for cyanidin 3-glucoside of 26900.25| | | Anthocyanin concentration (μg mL−1) = ΔA/(ε × L) | (2) |
where ΔA is the calculated difference in absorbance. ε (epsilon) is the molar absorptivity of the specific anthocyanin being analyzed. L is the path length of the cuvette or test tube, which is typically 1 cm.
2.7.4 Total carotenoid content.
A solution consisting of acetone, hexane, and ethanol in a ratio of 1:2:1 was prepared. To each juice sample (0.5 mL), 25 mL of this solution was added. To prevent the oxidation of carotenoids, 0.1% ascorbic acid was also included. Then the mixture was incubated for 30 min at 37 °C, following the previously reported methodology.26 The blend was subjected to centrifugation at a speed of 10000 revolutions per minute (rpm) for a period of 5 min, maintaining a temperature of 4 °C. The total carotenoid content (TAC) was noted at a wavelength of 450 nm using a spectrophotometer (LAMDA-35 Elmer Perkin, USA), with hexane used as a reference, and the findings were presented as the average of three repetitions. The results were expressed as micro-equivalents per mL of β-carotene (βCE μg mL−1) based on the calibration curve established using the identical standard.27
2.7.5 Total phenolic content.
The total phenolic content (TPC) in the SJ (processed and fresh) was determined by following the method suggested by Dars et al., 2019. Folin–Ciocalteu reagent, which was previously diluted three times with distilled water, was thoroughly mixed with 0.1 mL of SJ. 0.3 mL of a solution containing sodium carbonate with a quantity of 20 g L−1 was added to the entire mixture following a 3 min incubation period. A spectrophotometer was used to measure the absorbance of the solution at 760 nm after it had been left to stand for 2 h (LAMDA-35 Elmer Perkin, USA). To establish a calibration curve, gallic acid was used as the standard. The test results were reported as mg of gallic acid equivalents (GAE) per mL.11
2.7.6 Determination of total flavonoid content (TFC).
The total flavonoid content (TFC) was determined using the technique reported by.28 0.2 mL of an amalgamation featuring 5% sodium potassium tartrate and 10% w/v aluminium chloride was added to 6 mL of the SJ sample. 5.6 mL of distilled water was included in this mixture. After 30 min of incubation in the dark, the absorbance of the produced solution at 415 nm was measured with a spectrophotometer (LAMDA-35 Elmer Perkin, USA). To establish a calibration curve, catechin was used as the standard. The results were reported as mg of catechin equivalents (QE) per mL.
2.8 Microbial analysis
Total viable count (TVC) and yeast and mould counts (YMC) were used to assess the growth of bacteria in the juice samples to ensure their quality. The fruit juice samples were distributed evenly on plate count agar, and then kept in an incubator at 37 °C for 48 h to cultivate the total viable count (TVC). Following the incubation duration, the colonies were counted and reported as log CFU mL−1. Similarly, the yeast and mold count (YMC) was determined by spreading the samples on potato dextrose agar and incubating them at 37 °C for 72 h. Subsequently, the colonies were counted, and the results were reported as log CFU mL−1.21
2.9 Experimental framework for optimization
2.9.1 Artificial neural network modelling.
The MATLAB R2020a programme was used to apply mathematical modelling to artificial neural networks. The goal was to create advanced modelling for the evaluation of quality characteristics in the SJ samples that underwent TS treatment. The input parameters together with their appropriate ranges were determined through preliminary investigations. The independent variables included X1 (amplitude of thermosonication): 30%, 40%, and 50%, X2 (thermosonication temperature): 30 °C, 40 °C, and 50 °C, and X3 (treatment time): 15, 30, 45, and 60 min. In this study, various output parameters were analyzed, including pH, TSS, TA, CI, BI, AA, AOA, TAC, TCC, TPC, TFC, TVC, and YMC. To determine the best treatment temperatures, initial trial experimentations were carried out in the temperature range of 30 °C to 50 °C. Prior research that specifically examined the extraction of fruit juices using ultrasonication methods guided the selection of these temperature ranges.16,29 The veracity of the ANN models was assessed through the utilization of evaluation metrics, including the mean absolute error (MAE), the coefficient of determination (R2), and mean squared error (MSE). These metrics were calculated using eqn (1)–(3), respectively.29| | 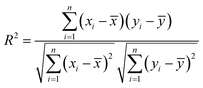 | (3) |
| |  | (4) |
| |  | (5) |
In this scenario, the variables utilized include: xi for the experimental data, yi for the predicted values, x signifying the average value of the experimental data, y representing the average value of the predicted data, and n denoting the overall count of observations.
2.9.2 Genetic algorithm (GA) optimization.
The genetic algorithm (GA) arsenal of MATLAB (versions R2022a, developed by Math Works Inc., USA) was used to optimize the neural networks. The main variables selected for GA optimisation were the TS amplitude (30%, 40% and 50%), temperature (30 °C, 40 °C, and 50 °C), and sonication duration (15, 30, 45, and 60 min). Furthermore, for possible populace, rank, blackjack function, dispersed, and adaptable possible outcomes, the development function, fitness in order expanding function, preference function, overlap function, and alteration function were chosen, respectively. The fitness function (f), which is displayed below, was created to maximize each output response.where Y1, Y2, and Y3 are the actual response values that the ANN predicted, and the negative sign indicates that the function (f) in GA was maximised.30
2.10 Statistical analysis
In this study, the collected information was analyzed using SPSS 16.0. The investigation yielded average values together with their respective standard deviations. To assess the significant differences among the control group and different treatments, a one-way ANOVA post-hoc Duncan test was performed, using the least significant differences method. The significance level was set at p < 0.05 to determine notable variations.
3. Results and discussion
3.1 Impact of processing on physicochemical properties of Sohphie juices
3.1.1 pH, TSS, TA.
In the current study, the values of pH, TSS, and TA of raw Sohphie juice were not found to be significantly different (p < 0.05) from the pasteurized and thermosonicated samples (Tables 1, 2, and 3). Consequently, the pH (ranging from 4.38 ± 0.51 to 3.40 ± 0.41), TSS (varying from 6.07 ± 0.91 to 5.97 ± 0.15 °Brix), and TA (ranging from 3.32 ± 0.82 to 4.21 ± 0.52%) of the treated juices were within the acceptable range for fresh SJ.19 Acidity plays a critical role in ensuring the stability of juice and is contingent upon the inherent characteristics of the fruit. Notably, similar findings of the non-significant impact of TS treatment on the physicochemical attributes of juice have been reported in the case of apple, hog plum, and blood fruits.12,14,31
Table 1 Comparison of the pH levels of raw, pasteurized, and thermosonicated (performed at amplitudes of 30%, 40%, and 50%) Sohphie fruit juicea
|
Values with same superscript small letters in the same row (a) are not significantly different (p < 0.05). Values with same superscript capital letters in the same column (A) are not significantly different (p < 0.05). Results are displayed as mean ± standard deviation of three replicates.
|
| pH |
Raw |
4.38 ± 0.51aA |
| Pasteurized |
3.74 ± 0.15aA |
| Thermosonicated |
| Treatment temperature |
30 °C |
40 °C |
50 °C |
| Treatment time (min) |
15 |
30 |
45 |
60 |
15 |
30 |
45 |
60 |
15 |
30 |
45 |
60 |
| Amplitude 30% |
4.02 ± 0.91aA |
3.95 ± 0.64aA |
3.91 ± 0.56aA |
3.87 ± 0.69aA |
3.97 ± 0.29aA |
3.92 ± 0.72aA |
3.83 ± 1.34aA |
3.85 ± 0.54aA |
3.95 ± 0.38aA |
3.88 ± 0.65aA |
3.80 ± 0.36aA |
3.72 ± 0.60aA |
| Amplitude 40% |
3.72 ± 0.46aA |
3.69 ± 0.95aA |
3.63 ± 0.32aA |
3.59 ± 0.51aA |
3.65 ± 0.51aA |
3.61 ± 0.44aA |
3.56 ± 0.33aA |
3.53 ± 0.32aA |
3.57 ± 0.45aA |
3.50 ± 0.36aA |
3.45 ± 0.97aA |
3.40 ± 1.01aA |
| Amplitude 50% |
3.67 ± 1.21aA |
3.61 ± 0.93aA |
3.50 ± 0.84aA |
3.42 ± 0.65aA |
3.57 ± 0.50aA |
3.40 ± 0.41aA |
3.37 ± 0.92aA |
3.35 ± 0.45aA |
3.48 ± 0.53aA |
3.36 ± 0.77aA |
3.29 ± 0.66aA |
3.22 ± 0.41aA |
Table 2 Comparison of the TSS (total soluble solid) levels of raw, pasteurized, and thermosonicated (performed at amplitudes of 30%, 40%, and 50%) Sohphie fruit juicea
|
Values with same superscript small letters in the same row (a) are not significantly different (p < 0.05). Values with same superscript capital letters in the same column (A) are not significantly different (p < 0.05). Results are displayed as mean ± standard deviation of three replicates.
|
| TSS |
Raw |
6.00 ± 0.17aA |
| Pasteurized |
6.03 ± 0.00aA |
| Thermosonicated |
| Treatment temperature |
30 °C |
30 °C |
30 °C |
| Treatment time (min) |
15 |
15 |
15 |
15 |
15 |
15 |
15 |
15 |
15 |
15 |
15 |
15 |
| Amplitude 30% |
5.97 ± 0.15aA |
5.97 ± 0.15aA |
5.97 ± 0.15aA |
5.97 ± 0.15aA |
5.97 ± 0.15aA |
5.97 ± 0.15aA |
5.97 ± 0.15aA |
5.97 ± 0.15aA |
5.97 ± 0.15aA |
5.97 ± 0.15aA |
5.97 ± 0.15aA |
5.97 ± 0.15aA |
| Amplitude 40% |
6.03 ± 0.25aA |
6.03 ± 0.25aA |
6.03 ± 0.25aA |
6.03 ± 0.25aA |
6.03 ± 0.25aA |
6.03 ± 0.25aA |
6.03 ± 0.25aA |
6.03 ± 0.25aA |
6.03 ± 0.25aA |
6.03 ± 0.25aA |
6.03 ± 0.25aA |
6.03 ± 0.25aA |
| Amplitude 50% |
6.07 ± 0.91aA |
6.07 ± 0.91aA |
6.07 ± 0.91aA |
6.07 ± 0.91aA |
6.07 ± 0.91aA |
6.07 ± 0.91aA |
6.07 ± 0.91aA |
6.07 ± 0.91aA |
6.07 ± 0.91aA |
6.07 ± 0.91aA |
6.07 ± 0.91aA |
6.07 ± 0.91aA |
Table 3 Comparison of the titratable acidity (TA) solid levels of raw, pasteurized, and thermosonicated (performed at amplitudes of 30%, 40%, and 50%) Sohphie fruit juicea
|
Values with same superscript small letters in the same row (a) are not significantly different (p < 0.05). Values with same superscript capital letters in the same column (A) are not significantly different (p < 0.05). Results are displayed as mean ± standard deviation of three replicates.
|
| TA |
Raw |
3.32 ± 0.82aA |
| Pasteurized |
3.94 ± 0.25aA |
| Thermosonicated |
| Treatment temperature |
30 °C |
30 °C |
30 °C |
| Treatment time (min) |
15 |
15 |
15 |
15 |
15 |
15 |
15 |
15 |
15 |
15 |
15 |
15 |
| Amplitude 30% |
3.49 ± 0.50aA |
3.57 ± 0.21aA |
3.61 ± 0.08aA |
3.64 ± 0.79aA |
3.55 ± 0.29aA |
3.61 ± 0.87aA |
3.68 ± 0.54aA |
3.73 ± 0.59aA |
3.62 ± 0.59aA |
3.67 ± 0.80aA |
3.72 ± 0.62aA |
3.76 ± 0.41aA |
| Amplitude 40% |
3.60 ± 0.42aA |
3.63 ± 1.35aA |
3.68 ± 0.79aA |
3.74 ± 1.27aA |
3.65 ± 0.59aA |
3.71 ± 0.79aA |
3.77 ± 0.70aA |
3.81 ± 0.80aA |
3.75 ± 0.89aA |
3.80 ± 0.94aA |
3.85 ± 1.03aA |
3.91 ± 0.21aA |
| Amplitude 50% |
3.78 ± 0.47aA |
3.86 ± 0.84aA |
3.92 ± 0.45aA |
3.95 ± 0.95aA |
3.84 ± 1.02aA |
3.96 ± 0.14aA |
4.07 ± 0.75aA |
4.11 ± 0.79aA |
4.02 ± 0.18aA |
4.08 ± 0.34aA |
4.14 ± 0.18aA |
4.21 ± 0.52aA |
3.1.2 Cloudiness and browning index.
CI, which indicates the degree of turbidity and the presence of suspended particles in the juice, did not exhibit a significant difference after pasteurization (1.090 ± 0.019) compared to the fresh Sohphie juice (1.067 ± 0.010) (Table 4). However, TS treatment resulted in a noticeable increase in cloudiness, ranging from 1.102 ± 0.016 to 2.162 ± 0.081, which was found to be significantly different (p < 0.05). The increase in cloudiness can be ascribed to the existence of suspended particles, including proteins, lipids, pectins, cellulose, and hemicellulose, in the juice. These particles undergo disintegration (sonolysis) as a result of bubble cavitation through a series of sonochemical reactions, thereby improving the uniform consistency and cloudiness of the juice.21 A similar increase in cloudiness values was investigated in thermosonicated juice derived from African mango and kiwi fruit juice.23,32
Table 4 Comparison of the cloudiness (CI) solid levels of raw, pasteurized, and thermosonicated (performed at amplitudes of 30%, 40%, and 50%) Sohphie fruit juicea
|
Values with different superscript small letters in the same row (a–i) are significantly different (p < 0.05). Values with different superscript capital letters in the same column (A–D) are significantly different (p < 0.05). Results are displayed as mean ± standard deviation of three replicates.
|
| CI |
Raw |
1.067 ± 0.010aA |
| Pasteurized |
1.090 ± 0.019aA |
| Thermosonicated |
| Treatment temperature |
30 °C |
40 °C |
50 °C |
| Treatment time (min) |
15 |
30 |
45 |
60 |
15 |
30 |
45 |
60 |
15 |
30 |
45 |
60 |
| Amplitude 30% |
1.102 ± 0.016aA |
1.175 ± 0.028abA |
1.240 ± 0.036bcB |
1.293 ± 0.006bcdB |
1.324 ± 0.029cdeB |
1.396 ± 0.003defB |
1.437 ± 0.065efgB |
1.493 ± 0.005fghB |
1.526 ± 0.016ghiB |
1.585 ± 0.023hiB |
1.607 ± 0.108hiB |
1.625 ± 0.059iB |
| Amplitude 40% |
1.446 ± 0.049bB |
1.499 ± 0.099bcB |
1.534 ± 0.033bcdC |
1.583 ± 0.022bcdeC |
1.603 ± 0.034bcdeC |
1.684 ± 0.006cdefC |
1.747 ± 0.042defC |
1.796 ± 0.082efC |
1.800 ± 0.188efC |
1.825 ± 0.099 fC |
1.870 ± 0.071 fC |
1.897 ± 0.018 fC |
| Amplitude 50% |
1.738 ± 0.238bB |
1.790 ± 0.177bcC |
1.816 ± 0.011bcD |
1.885 ± 0.012bcdD |
1.841 ± 0.058bcD |
1.919 ± 0.007bcdD |
1.975 ± 0.135bcdD |
2.031 ± 0.050cdD |
1.963 ± 0.034bcdC |
2.041 ± 0.059cdD |
2.160 ± 0.074dD |
2.162 ± 0.081dD |
The BI in SJ (0.109 ± 0.009) and PSSJ (0.143 ± 0.030) exhibited no significant difference (p < 0.05) even as TSSJ ranged from 0.117 ± 0.005 to 0.210 ± 0.092 (Table 5). This indicates that cavitation during sonication did not induce the Maillard reactions, as observed in a previous study.33 Browning reactions often involve the oxidation of phenolic compounds in the presence of oxygen. TS minimizes the exposure of SJ to oxygen and reduces the possibility of browning reactions in SJ. Further, TS can help preserve the antioxidants in the juice, which can inhibit browning reactions by scavenging free radicals. Therefore, the retention of antioxidants could have contributed to the lack of significant browning. The initial composition of the juice, including its phenolic content and pH, can influence the degree of BI. If the juice had a lower concentration of browning-prone compounds or a pH that discouraged browning, it may explain the lack of significant differences in BI.33
Table 5 Comparison of the browning index (BI) solid levels of raw, pasteurized, and thermosonicated (performed at amplitudes of 30%, 40%, and 50%) Sohphie fruit juicea
|
Values with same superscript small letters in the same row (a) are not significantly different (p < 0.05). Values with same superscript capital letters in the same column (A) are not significantly different (p < 0.05). Results are displayed as mean ± standard deviation of three replicates.
|
| BI |
Raw |
0.109 ± 0.009aA |
| Pasteurized |
0.143 ± 0.030aA |
| Thermosonicated |
| Treatment temperature |
30 °C |
40 °C |
50 °C |
| Treatment time (min) |
15 |
30 |
45 |
60 |
15 |
30 |
45 |
60 |
15 |
30 |
45 |
60 |
| Amplitude 30% |
0.117 ± 0.005aA |
0.124 ± 0.074aA |
0.152 ± 0.038aA |
0.175 ± 0.051aA |
0.137 ± 0.042aA |
0.158 ± 0.033aA |
0.171 ± 0.041aA |
0.188 ± 0.059aA |
0.149 ± 0.020aA |
0.170 ± 0.054aA |
0.186 ± 0.024aA |
0.194 ± 0.023aA |
| Amplitude 40% |
0.144 ± 0.047aA |
0.158 ± 0.107aA |
0.177 ± 0.066aA |
0.189 ± 0.068aA |
0.164 ± 0.046aA |
0.175 ± 0.094aA |
0.188 ± 0.030aA |
0.197 ± 0.073aA |
0.172 ± 0.048aA |
0.189 ± 0.078aA |
0.194 ± 0.068aA |
0.197 ± 0.084aA |
| Amplitude 50% |
0.168 ± 0.059aA |
0.175 ± 0.049aA |
0.184 ± 0.133aA |
0.191 ± 0.068aA |
0.174 ± 0.063aA |
0.183 ± 0.060aA |
0.198 ± 0.005aA |
0.207 ± 0.058aA |
0.181 ± 0.061aA |
0.193 ± 0.092aA |
0.201 ± 0.023aA |
0.210 ± 0.092aA |
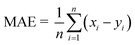
3.2 Ascorbic acid content
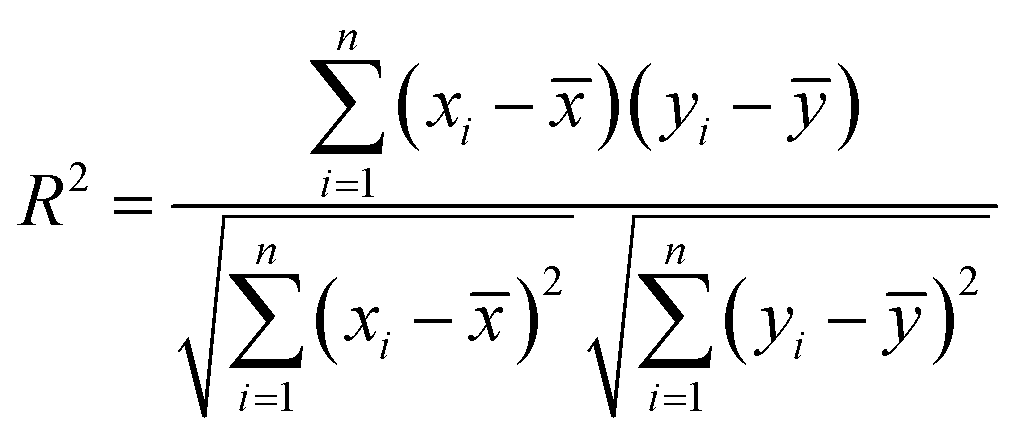
The impact of PS and TS treatment on the AA content of the SJ sample is depicted in Fig. 2(a). PS significantly decreased the AA levels (p < 0.05) from 27.30 ± 2.24 mg/100 mL (AA content of fresh sample) to 18.64 ± 4.53 mg/100 mL. Conversely, TS treatment at 40% amplitude and 40 °C for a 60 min duration substantially improved the SJ, resulting in an AA content of 58.74 ± 3.56 mg/100 mL. The lowest AA content was observed at 30% amplitude and 30 °C for 15 min treatment time (40.54 ± 4.14 mg/100 mL). However, it was observed that the AA levels decreased with a higher amplitude and longer treatment times at elevated temperatures, specifically at 50 °C. The increase in AA content due to TS treatment is linked to the impact of sonolysis (acoustic cavitation) on TS parameters, including amplitude, frequency, temperature, and time.34 The optimal preservation of AA in the processing of fruit juice indicates a crucial quality indicator throughout treatment, preservation, and consumption.1 Both PS and TS treatments could lead to the degradation of AA in food, but TS was generally gentler on heat-sensitive compounds. During pasteurization, which involves heating food to specific temperatures for a set period, ascorbic acid degrades due to the heat, with higher temperatures and longer times leading to more significant losses. Alternatively, TS combines heat and ultrasound to treat food, which can reduce the degradation of ascorbic acid compared to traditional pasteurization methods. The ultrasound helps create localized heating and improve the heat transfer, allowing for lower temperatures and shorter treatment times, which can help preserve more of the ascorbic acid content in the treated food.35
 |
| | Fig. 2 Effects of pasteurization and thermosonication (30%, 40% and 50% amplitude) on (a) ascorbic acid, (b) antioxidant activity, (c) total anthocyanin content (TAC), and (d) total carotenoid content (TCC) levels of Sohphie juice. *Raw: untreated sample; 90-1: pasteurized SJ: Sohphie juice; TS: thermosonicated SJ 30-15: 30 °C for 15 min; TS SJ 30-30: 30 °C for 30 min; TS SJ 30-45: 30 °C for 45 min; TS SJ 30-60: 30 °C for 60 min; TS SJ 40-15: 40 °C for 15 min; TS SJ 40-30: 40 °C for 30 min; TS SJ 40-45: 40 °C for 45 min; TS SJ 40-60: 40 °C for 60 min; TS SJ 50-15: 50 °C for 15 min; TS SJ 50-30: 50 °C for 30 min; TS SJ 50-45: 50 °C for 45 min; TS SJ 50-60: 50 °C for 60 min. | |
The retention of a significant amount of AA may be due to the removal of confined molecules of oxygen during the TS treatment of juices.3,36 This finding is consistent with research on thermosonicated juice made from amora and citrus fruits, which was done concurrently.16,34 Additionally, the decrease in AA content at higher temperatures and prolonged exposure periods may be attributed to the generation of oxidative radicals under intense sonolysis effects, a phenomenon previously documented in hog plum juice.22 Ascorbic acid plays a crucial role in fruits because of its numerous health-promoting properties.20
3.3 Antioxidant activity
Numerous bioactive compounds, including antioxidants, exhibit optimal temperature ranges where they are most active or efficiently released. Additionally, the amplitude of ultrasound plays a pivotal role in influencing the cavitation effect, which is characterized by the formation and collapse of small bubbles within the liquid. The occurrence of cavitation plays a role in facilitating the release of bioactive compounds from plant cells through the breakdown of their cellular walls. Moreover, this phenomenon is ascribed to the stress response of the juice during cavitation, leading to the formation of oxidative agents.37Fig. 2(b) illustrates the AOA of the fresh and treated SJ samples. The raw SJ displayed an AOA of 43.57% ± 3.44%, whereas the pasteurized sample exhibited a slightly lower AOA of 36.04% ± 3.91%. However, a substantial elevation in AOA was observed in the TSSJ, specifically at 40% amplitude, elevated temperature (50 °C), and a treatment duration of 60 min (66.11% ± 3.92%). Conversely, a noticeable lowest content in AOA occurred at a lower amplitude (30%), with a treatment temperature of 30 °C for a 15 min treatment time (46.04% ± 4.44%).
The improvements in AOA content observed with TS processing may be linked to the rise in other bioactive constituents generated as a consequence of cavitation. It occurs due to the increase in treatment conditions (amplitude, temperature and time), which improves the mass transfer of antioxidants available in the matrices to transfer out to the juice sample. This disruption can release antioxidants that were previously encapsulated within the cells, making them more accessible in the juice.3,38 Also, at lower treatment conditions, the antioxidant content became lower due to the reduced mechanical and thermal energy input into the juice. This reduced energy may lead to slower mass transfer within the juice, limiting the movement of antioxidants from the fruit matrix into the liquid phase. Antioxidants may remain trapped within the cell structures, reducing their availability in the juice. The prolonged presence of these radicals at high levels has been documented to exert a detrimental effect on antioxidant activity.22 A similar rise was observed in tangerine juice after TS treatment.39 Thus, it is imperative to optimize these parameters to attain the desired outcomes concerning antioxidant activity and product quality. Fruit juice serves as a valuable source of antioxidants, which are crucial for regulating the presence of free radical in the human system, thus promoting a healthy lifestyle.
3.4 Total anthocyanin content (TAC)
Fig. 2(c) displays the TAC of SJ. It exhibited a slight reduction (p < 0.05) following pasteurization, with values of 11.29 ± 5.09 μg mL−1 compared to the raw juice (24.56 ± 4.84 μg mL−1). Intriguingly, the anthocyanin content significantly increased when subjected to TS at 40% amplitude for 60 min at 30 °C (48.50 ± 4.57 μg mL−1). However, employing lower TS conditions (30% amplitude, 30 °C, for 15 min) resulted in the lowest TAC retention (28.81 ± 6.06 μg mL−1).
Multiple research works have shown that ultrasonic-assisted extraction can boost the anthocyanin yield during the extraction process.25,37 Furthermore, these investigations have shown that ultrasound treatments do not induce the degradation of the anthocyanins.37 Nevertheless, at elevated intensity levels, there is a potential for the substantial disruption of cell walls, causing anthocyanins to migrate into the juice. Moreover, the application of high-intensity ultrasonic energy has been demonstrated to exert a substantial adverse impact on enzyme activity. Enzymes play a central role in the enzymatic breakdown of anthocyanins and the discoloration of the juice. The degradation of anthocyanins during ultrasound treatment can be elucidated by the oxidation reaction induced by the interaction of free radicals, resulting in ring opening and the formation of chalcones.8
3.5 Total carotenoid content (TCC)
The total carotenoid content (TCC) of SJ is presented in Fig. 2(d). It exhibited a slight reduction (p < 0.05) following pasteurization, with values of 95.31 ± 5.40 βCE μg mL−1 compared to raw juice (111.36 ± 3.62 βCE μg mL−1). Carotenoids are sensitive to heat, and at higher temperatures, they can break down, leading to a decrease in their concentration. Lower temperature treatments help preserve these heat-sensitive compounds. Longer treatment times can allow for more thorough mass transfer of carotenoids from the fruit matrix into the liquid phase.26 Interestingly, TCC experienced a modest increase when subjected to TS at 30% amplitude, 30 °C, for 60 min (133.60 ± 5.17 βCE μg mL−1). However, under elevated TS conditions (50% amplitude, 50 °C, 60 min treatment), the lowest TCC was obtained as 112.48 ± 1.11 βCE μg mL−1.
An increase in TCC under TS treatment may be observed due to the prior cavitation effects on enzyme inactivation and generation of several bioactive compounds.40 A similar observation was reported for TS juice from cashew apple, spinach and star fruit.13,28,41 A lower thermosonication amplitude indicates that the mechanical effects (acoustic cavitation) generated within the liquid are less intense. This gentler mechanical action can help prevent the physical degradation of carotenoid molecules.26 In past studies, it was found that the highest release of carotenoids during TS occurred at lower temperatures, lower amplitudes, and higher treatment durations. Lower temperatures are beneficial for preserving the integrity of carotenoids and reducing the matrix viscosity, which facilitate their release. Lower amplitudes enhance the cavitation effects, aiding in cell wall disruption and carotenoid release. Longer treatment durations were also effective in breaking down cell structures, further increasing the carotenoid extraction. This optimization of temperature, amplitude, and treatment duration demonstrated the effectiveness of TS for carotenoid extraction from food matrices.42 At higher amplitudes, more intense cavitation can cause shear forces that may break down the carotenoid molecules. Generally, lower temperatures and longer treatment times result in the reduced thermal degradation of carotenoids.27 However, the fundamental isomerization of carotenoid substances caused by strong cavitation may be linked to the decrease in TCC under high TS conditions. A similar effect was documented in TS-treated tangerine and mango juice.39,43 Carotenoids serve as essential color pigments in SJ, and they also play a role in mitigating specific health conditions, such as ulcers and diabetes.44
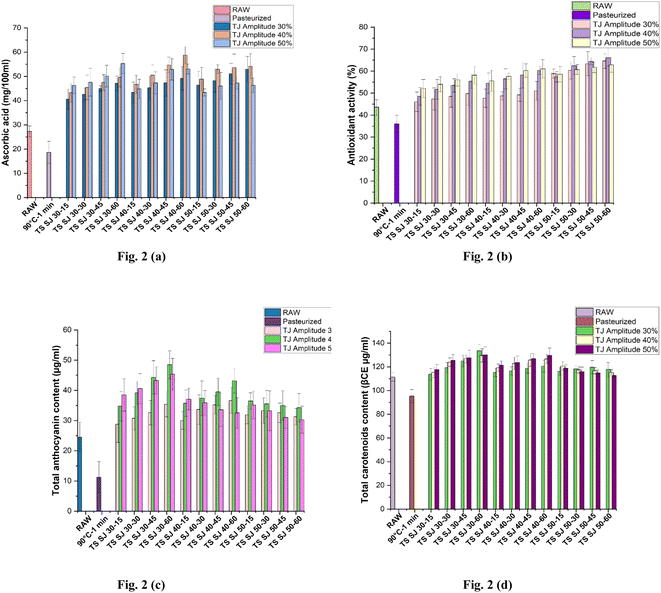
3.6 Total phenolic content (TPC)
Phenolic compounds aid in the treatment of many diseases, which are important for maintaining human health. Additionally, they significantly contribute to the sensory qualities of fruit juices, such as colour and flavour.37 The TPC of the SJ samples is depicted in Fig. 3(a). The unprocessed sample exhibited a TPC of 48.66 ± 3.53 mg GAE mL−1, while the application of PS resulted in a reduction in TPC to 35.98 ± 3.17 mg GAE mL−1. Interestingly, employing TS at 50% amplitude and 40 °C for 60 min noticeably enhanced TPC to 78.94 ± 4.84 mg GAE mL−1. Conversely, at lower amplitude, temperature, and treatment time (30% amplitude, 30 °C for 15 min), the lowest retention of TPC was observed (55.47 ± 3.53 mg GAE mL−1). The structural disruption of the cell wall of caused by cavitation during TS is thought to be responsible for the increase in TPC. This process allows these phenolic compounds to be released from intracellular materials such as proteins, lignin, and other polysaccharides and change from being bound to free forms.37
 |
| | Fig. 3 Effects of pasteurization and thermosonication (30%, 40% and 50% amplitude) on (a) total phenolic content (TPC), (b) total flavonoid content (TFC), (c) total viable content (TVC), and (d) yeast and mold count (YMC) of Sohphie juice. | |
A comparable increase was recorded in the juice obtained through TS processing of tangerine and mango fruits.39,43 The decrease in TPC at higher TS temperatures may be linked to the intense sonolytic cavitation conditions, radical formation, and cellular disruption.45 The combination of higher amplitude, moderate temperature, and longer treatment times may result in synergistic effects that promote the retention of phenolic compounds. For example, the mechanical effects and enzyme inactivation may complement each other, leading to improved phenolic compound retention.27 Also, moderate temperatures help minimize the oxidative stress on the fruit tissue. Phenolic compounds can act as antioxidants, and their preservation is favored under conditions of reduced oxidative stress.36
3.7 Total flavonoid content (TFC)
The TFC values of the Sohphie fruit juices are depicted in Fig. 3(b) (treated and untreated). The fresh sample showed the TFC value of 37.77 ± 3.89 mg QE mL−1, whereas the TFC of PSSJ was observed to decrease, which was determined to be 29.62 ± 3.74 mg QE mL−1. However, a significant increase in TFC (55.49 ± 3.86 mg QE mL−1) was observed when TS was applied at 30 °C with 50% amplitude for a treatment time of 60 min. Conversely, at a lower amplitude, temperature, and time (30%, 30 °C, 15 min) led to the lowest retention in TFC (41.26 ± 3.68 mg QE mL−1).
The increase in TFC levels during TS may be ascribed to the acoustic cavitation phenomenon, which produces radicals of hydroxyl inside the aromatic group structure of phenols.16 The mechanical effects generated by higher amplitude ultrasound can induce shear forces that promote the release of flavonoids from the plant cells. This mechanical action can be particularly effective in dislodging flavonoids that are tightly bound within the cell walls.37 Lower temperatures help minimize the oxidative stress on the fruit or vegetable tissue. Flavonoids, similar to other phenolic compounds, can act as antioxidants, and their preservation is favored under conditions of reduced oxidative stress. Longer treatment times at lower temperatures can contribute to this preservation.46 The increase in quercetin concentration in the fruit juice presents a noteworthy advantage to consumers, given quercetin its well-documented health benefits. This bioactive compound holds considerable promise in enhancing overall health and well-being.46 A parallel finding has been documented in the juice derived from TS kutkura and pomelo fruits.18,21
3.8 Microbial inactivation
The impact of PS and TS on the microbial activity of SJ is depicted in Fig. 3(c) and (d), respectively. PS effectively eliminated both bacteria and yeast and mold, reducing their counts to undetectable levels. Alternatively, after TS treatment, the highest reduction was achieved at 50% amplitude and 50 °C for 60 min significantly (p < 0.05) in TVC (from 4.44 ± 0.23 to 2.44 ± 0.23log CFU mL−1) and in YMC (from 2.94 ± 0.11 to 1.01 ± 0.11log CFU mL−1), respectively. As a result, PS and TS both helped to achieve the FSSAI recommendation of a 5log reduction in the processing of fruit juice. The impairment of cell membranes as a result of the rise in temperature during pasteurisation in fruit juice may be the contributing factor to the complete eradication of microorganisms.47 Significantly, the decrease in the microbial population during thermosonication (TS) is linked to the occurrence of cavitation, wherein the cellular structure undergoes sonolysis due to micro-physical shocks. This results in the production of hydroxyl radicals in the fruit juice, consequently causing the cell membrane to fragment.4,48 The combination of high amplitude, elevated temperature, and extended treatment times creates synergistic effects that enhance the overall microbial inactivation.9 The mechanical forces, elevated temperature, and prolonged treatment duration act in concert to reduce microbial populations more effectively than individual factors alone. Longer treatment times and higher temperatures are particularly effective at inactivating heat-resistant microorganisms, including spore-forming bacteria and yeast/mold species.43 These microorganisms often require prolonged exposure to heat to be destroyed, while thermosonication provides the necessary conditions for their inactivation.4 It was reported that the inactivation of microbial activity occurred in both thermosonicated juice of orange and camu, reflecting a similar observation.9,10 The presence of low levels of yeasts and molds may be attributed to their spore-forming and thermo-resistant nature.21 However, total inactivation is possible with an increase in the TS effects.
3.9 Sensory evaluation
An analysis of the sensory attributes of the juices was conducted to assess the perception of the product by consumers. The study was reviewed and approved by the Institutional Committee at the Central Institute of Technology, Kokrajhar, Assam and participants were informed prior to the studies. The sensory scores for taste, color, odor, and overall acceptability were recorded, as presented in Tables 6, 7, 8, and 9, respectively. In the raw samples, the sensory scores for taste, color, odor, and overall acceptability were recorded as 8.73 ± 0.40, 9.20 ± 0.17, 9.03 ± 0.31, and 8.99 ± 0.24, respectively. Similarly, the sensory scores for the PSSJ samples were obtained as 8.50 ± 0.26, 8.60 ± 0.26, 8.73 ± 0.12, and 8.61 ± 0.12, respectively. However, the TSSJ samples showed an increase in sensory scores for taste (8.97 ± 0.31) at 40%, 40 °C for 60 min, color (8.90 ± 0.53) at 40%, 40 °C for 60 min, odor (8.93 ± 0.47) at 40%, 40 °C for 60 min, and overall acceptability (8.93 ± 0.03) at 40%, 40 °C for 60 min. The lowest sensory scores were achieved for taste (8.03 ± 0.21) at 50%, 50 °C for 60 min, color (7.93 ± 0.15) at 30%, 30 °C for 60 min, odor (8.10 ± 0.20) at 30%, 30 °C for 60 min, and overall acceptability (8.10 ± 0.24) at 30%, 30 °C for 60 min. The occurrence of this phenomenon could be linked to the subtle lingering bitterness commonly associated with the fruit. Therefore, to counteract this, certain processors opt to include sweeteners during the process of extracting juice from Sohphie.49 Some authors reported minimal changes in the sensory profile of different TS juice.28,34 The sensory values obtained from TSSJ in this study were found to be higher than average. This suggests that TS had no detrimental effects on the sensory qualities. As a result, TS has the potential to be a useful extraction and storage technique for enhancing the sensory characteristics of fruit juices.
Table 6 Comparison of sensorial property (taste) of treated and untreated Sohphie fruit juicea
|
Values with same superscript small letters in the same row (a) are not significantly different (p < 0.05). Values with same superscript capital letters in the same column (A) are not significantly different (p < 0.05). Results are displayed as mean ± standard deviation of three replicates.
|
| Taste |
Raw |
8.73 ± 0.40aA |
| Pasteurized |
8.50 ± 0.26aA |
| Thermosonicated |
| Treatment temperature |
30 °C |
40 °C |
50 °C |
| Treatment time (min) |
15 |
30 |
45 |
60 |
15 |
30 |
45 |
60 |
15 |
30 |
45 |
60 |
| Amplitude 30% |
8.63 ± 0.45aA |
8.57 ± 0.35aA |
8.53 ± 0.35aA |
8.40 ± 0.50aA |
8.50 ± 0.36aA |
8.67 ± 0.50aA |
8.50 ± 0.26aA |
8.70 ± 0.60aA |
8.30 ± 0.26aA |
8.33 ± 0.21aA |
8.10 ± 0.30aA |
7.97 ± 0.50aA |
| Amplitude 40% |
8.70 ± 0.40aA |
8.63 ± 0.38aA |
8.60 ± 0.26aA |
8.53 ± 0.35aA |
8.67 ± 0.32aA |
8.73 ± 0.21aA |
8.67 ± 0.21aA |
8.97 ± 0.31aA |
8.40 ± 0.30aA |
8.57 ± 0.06aA |
8.47 ± 0.40aA |
8.60 ± 0.26aA |
| Amplitude 50% |
8.87 ± 0.60aA |
8.73 ± 0.60aA |
8.40 ± 0.26aA |
8.27 ± 0.32aA |
8.27 ± 0.15aA |
8.40 ± 0.36aA |
8.80 ± 0.46aA |
8.07 ± 0.42aA |
8.37 ± 0.55aA |
8.30 ± 0.26aA |
8.50 ± 0.36aA |
8.03 ± 0.21aA |
Table 7 Comparison of the sensorial property (colour) of the treated and untreated Sohphie fruit juicea
|
Values with different superscript small letters in the same row (a and b) are significantly different (p < 0.05). Values with different superscript capital letters in the same column (A and B) are significantly different (p < 0.05). Results are displayed as mean ± standard deviation of three replicates.
|
| Color |
Raw |
9.20 + 0.17aA |
| Pasteurized |
8.60 ± 0.26abAB |
| Thermosonicated |
| Treatment temperature |
30 °C |
40 °C |
50 °C |
| Treatment time (min) |
15 |
30 |
45 |
60 |
15 |
30 |
45 |
60 |
15 |
30 |
45 |
60 |
| Amplitude 30% |
8.40 ± 0.44abA |
8.50 ± 0.35abA |
8.53 ± 0.32abA |
7.93 ± 0.15bB |
8.47 ± 0.40abAB |
8.37 ± 0.38abB |
8.10 ± 0.40abB |
8.33 ± 0.55abAB |
8.37 ± 0.50abA |
8.53 ± 0.25abB |
8.13 ± 0.06abB |
8.50 ± 0.60abAB |
| Amplitude 40% |
8.57 ± 0.29aA |
8.60 ± 0.44aA |
8.67 ± 0.55aA |
8.70 ± 0.53aAB |
8.63 ± 0.15aAB |
8.83 ± 0.12aAB |
8.87 ± 0.65aAB |
8.90 ± 0.53aAB |
8.43 ± 0.42aA |
8.70 ± 0.17aAB |
8.53 ± 0.32aAB |
8.47 ± 0.21aAB |
| Amplitude 50% |
8.63 ± 0.61abA |
8.77 ± 0.40abA |
8.27 ± 0.32abA |
8.17 ± 0.32abB |
8.23 ± 0.31abB |
8.40 ± 0.44abAB |
8.77 ± 0.35abAB |
7.97 ± 0.42bB |
8.33 ± 0.57abA |
8.23 ± 0.31abB |
8.50 ± 0.53abAB |
7.97 ± 0.12bB |
Table 8 Comparison of the sensorial property (odour) of the treated and untreated Sohphie fruit juicea
|
Values with different superscript small letters in the same row (a and b) are significantly different (p < 0.05). Values with different superscript capital letters in the same column (A and B) are significantly different (p < 0.05). Results are displayed as mean ± standard deviation of three replicates.
|
| Odour |
Raw |
9.03 ± 0.31aA |
| Pasteurized |
8.73 ± 0.12abAB |
| Thermosonicated |
| Treatment temperature |
30 °C |
40 °C |
50 °C |
| Treatment time (min) |
15 |
30 |
45 |
60 |
15 |
30 |
45 |
60 |
15 |
30 |
45 |
60 |
| Amplitude 30% |
8.40 ± 0.36aA |
8.40 ± 0.30aA |
8.53 ± 0.35aAB |
8.10 ± 0.20aB |
8.50 ± 0.40aA |
8.27 ± 0.15aB |
8.53 ± 0.40aA |
8.33 ± 0.25aA |
8.47 ± 0.25aA |
8.43 ± 0.42aA |
8.47 ± 0.40aA |
8.20 ± 0.70aA |
| Amplitude 40% |
8.57 ± 0.31aA |
8.37 ± 0.38aA |
8.47 ± 0.21aAB |
8.40 ± 0.44aAB |
8.57 ± 0.25aA |
8.70 ± 0.35aAB |
8.77 ± 0.35aA |
8.93 ± 0.47aA |
8.40 ± 0.26aA |
8.60 ± 0.30aA |
8.37 ± 0.23aA |
8.50 ± 0.40aA |
| Amplitude 50% |
8.63 ± 0.25abA |
8.33 ± 0.15abA |
8.27 ± 0.15abB |
8.37 ± 0.25abAB |
8.47 ± 0.31abA |
8.53 ± 0.35abAB |
8.70 ± 0.35abA |
8.73 ± 0.21abA |
8.43 ± 0.35abA |
8.37 ± 0.38abA |
8.47 ± 0.25abA |
8.20 ± 0.17bA |
Table 9 Comparison of the overall sensorial properties (taste, colour and odour) of the treated and untreated Sohphie fruit juicea
|
Values with different superscript small letters in the same row (a–d) are significantly different (p < 0.05). Values with different superscript capital letters in the same column (A and B) are significantly different (p < 0.05). Results are displayed as mean ± standard deviation of three replicates.
|
| Overall acceptability |
Raw |
8.99 ± 0.24aA |
| Pasteurized |
8.61 ± 0.12abcdAB |
| Thermosonicated |
| Treatment temperature |
30 °C |
40 °C |
50 °C |
| Treatment time (min) |
15 |
30 |
45 |
60 |
15 |
30 |
45 |
60 |
15 |
30 |
45 |
60 |
| Amplitude 30% |
8.48 ± 0.13abB |
8.49 ± 0.08abB |
8.53 ± 0.00abB |
8.10 ± 0.24bB |
8.49 ± 0.02abB |
8.43 ± 0.21bB |
8.38 ± 0.24bB |
8.46 ± 0.21bAB |
8.38 ± 0.08bB |
8.43 ± 0.10bB |
8.23 ± 0.20bB |
8.22 ± 0.27bBC |
| Amplitude 40% |
8.61 ± 0.08bcdAB |
8.53 ± 0.15cdAB |
8.58 ± 0.10cdB |
8.54 ± 0.15cdAB |
8.62 ± 0.05bcdB |
8.76 ± 0.07abcAB |
8.77 ± 0.10abcAB |
8.93 ± 0.03abA |
8.41 ± 0.02 dB |
8.62 ± 0.07bcdB |
8.46 ± 0.08cdB |
8.52 ± 0.07cdABC |
| Amplitude 50% |
8.71 ± 0.13abcAB |
8.61 ± 0.24abcAB |
8.31 ± 0.08bcdB |
8.27 ± 0.10bcdB |
8.32 ± 0.13bcdB |
8.44 ± 0.08bcdB |
8.76 ± 0.05abAB |
8.26 ± 0.42cdB |
8.38 ± 0.05bcdB |
8.30 ± 0.07bcdB |
8.49 ± 0.02bcdB |
8.07 ± 0.12 dC |
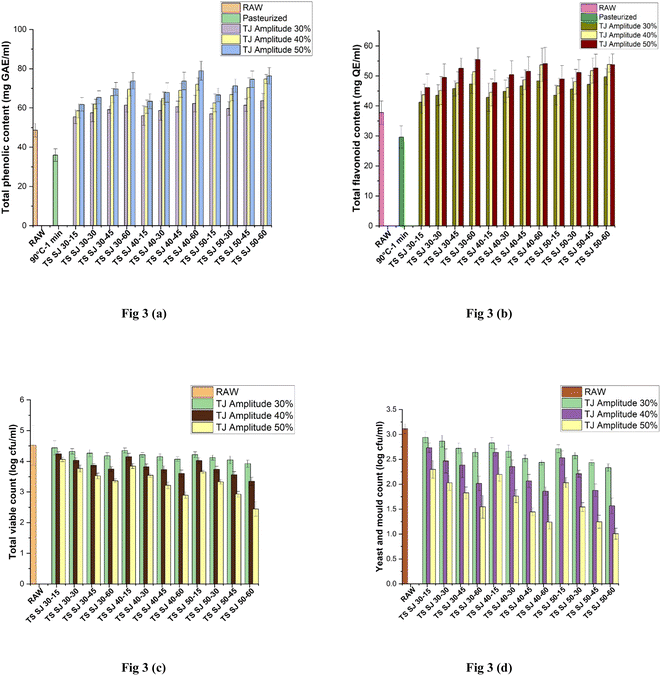
3.10 The effectiveness and assessment of the developed ANN model
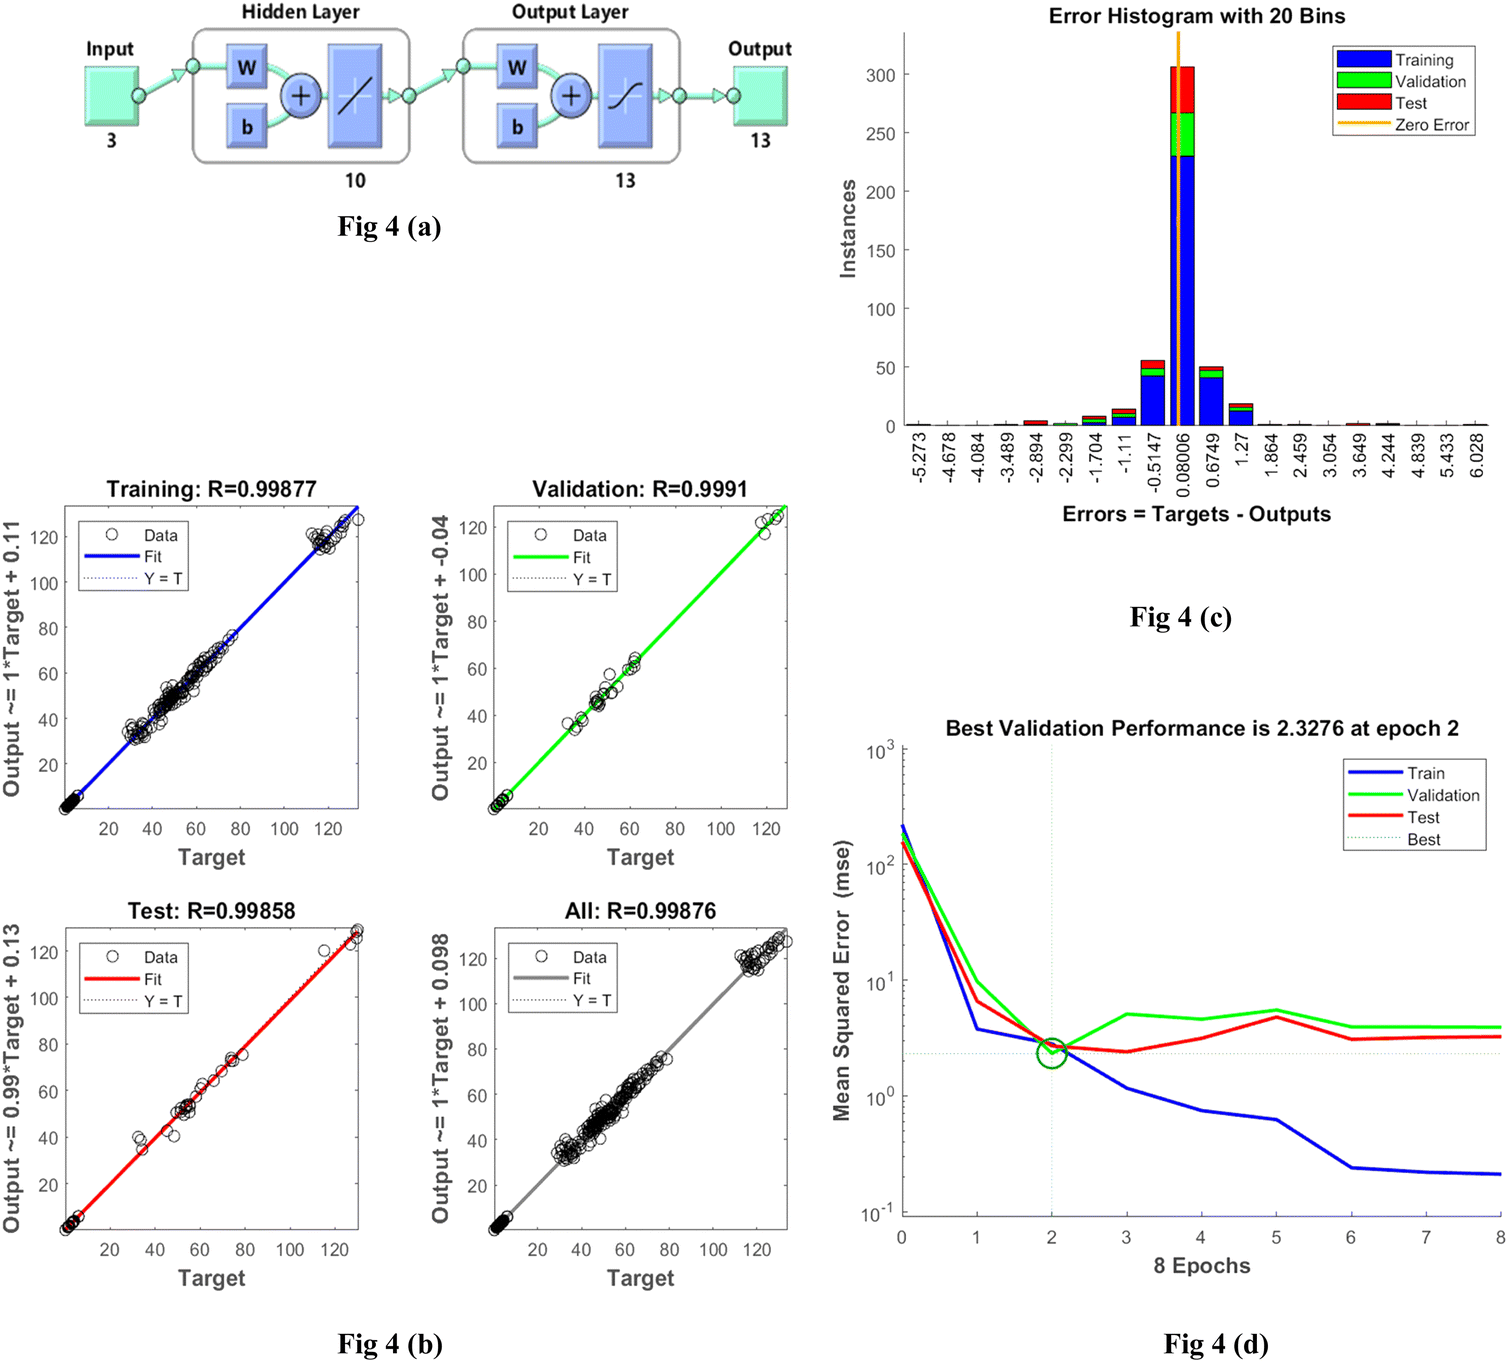
The determination of pinnacle variables for the ANN involved the use of various benchmarks, including the mean absolute error, performance plot, correlation plot, and correlation coefficient, as detailed in earlier studies.50 Following experimentation with different network configurations, it was noted that a network comprised of a single hidden layer containing ten neurons yielded the most promising results. Fig. 4(a) depicts the layout of the proficient ANN model with the most appropriate topology (3:10:13). This illustration showcases the matrix arrangement of connection weights among neural system components in various set of layers, together with the threshold or bias values of the neurons in both the output and concealed layers. The matrix sizes for the links between the neurons of input and hidden layer were 10 × 3, while the matrix sizes for the affinities between the hidden and output layer neurons were 10 × 13. Furthermore, the matrix dimensions for the bias values of neurons in the hidden and output layers were 10 × 1 and 13 × 1, respectively. The performance of the generated ANN model was determined by calculating the correlation coefficient (R). The training data set showed a correlation coefficient of 1.0, while the test data set had a correlation coefficient of 0.99877 (shown in Fig. 4(b)). The accuracy of the established ANN model was further confirmed by analysing the error histogram (Fig. 4(c)), where the minimal bar was observed at zero error (0.08006). This indicates that the ANN model is highly accurate. To further validate the developed ANN model, statistical parameters such as the coefficient of determination (R2), mean squared error (MSE), and mean absolute error (MAE) were also calculated. ESI Table 1† presents the empirical results, while ESI Table 2† exhibits the R2, MSE, and MAE obtained values for all the responses acquired through ANN mathematical modelling of SJ processing using TS.50 The R2 values for pH (0.966), TSS (0.870), TA (0.952), CI (0.998), BI (0.988), AA (0.982), AOA (0.960), TAC (0.821), TCC (0.989), TPC (0.932), TFC (0.980), TVC (0.995), and YM (0.984) were obtained. All the values conform to the standards and criteria established in the literature.29 A minimum R2 value of 0.80 is recognized as the benchmark for an optimal fit model. The R2 values of the constructed ANN model consistently surpassed 0.80 for all the repercussions, confirming the effectiveness of the model. The expected response values generated by the established ANN model are presented in ESI Table 2.†
 |
| | Fig. 4 (a) Topology of a well-developed ANN model for TSSJ. Input 3 indicates independent parameters (amplitude, temperature time of TS treatment), while output 13 indicates dependent parameters (pH, TSS, TA, CI, BI, AA, AOA, TAC, TCC, TPC, TFC, TVC and YMC). W: weight; b: bias; ANN: artificial neural network. (b) Regression graph for the correlation coefficient (R) of the training test and all data of the well-developed ANN model. (c) Error histogram of the developed ANN model. (d) Performance of MSE with respect to the increase in the number of epochs. | |
Three sets of 36 experimental observations were randomly selected to be used for training (constituting 70% of the data), validation (comprising data of 15%), and testing (data of 15%) purposes. During the training phase, network parameters were established, and then assessed for reliability in the validation phase, and any errors were corrected during testing.51 In this study, a neural network model consisting of an input layer with three neurons, a hidden layer with ten neurons, and an output layer with thirteen neurons was utilized, as depicted in Fig. 4(b). To create the optimal ANN model for response prediction, iterative training of the network was conducted until the lowest mean squared error (MSE) and the highest correlation coefficient (R) were achieved. This procedure made it possible to determine the recommended number of neurons for the hidden layer. 10 neurons were found to be the ideal number for the hidden layer based on the findings. This configuration achieved the lowest mean squared error (MSE) values for various parameters, including pH (0.288), TSS (0.548), TA (0.288), CI (0.395), BI (0.503), AA (0.203), AOA (0.199), TAC (0.270), TCC (0.199), TPC (0.617), TFC (0.173), TVC (0.304), and YMC (0.571), across all training, testing, validation, and dataset scenarios. A schematic of the post-training ANN, an error histogram, and regression analysis are depicted in Fig. 4(a), (c), and (b), respectively. The optimal performance, with an MSE value of 2.3276, is achieved at 2 epochs. Fig. 4(c) displays the error value histogram, which illustrates that a considerable portion of the data points possesses an anomaly indicator of 0.08006. This suggests the precise prediction of the target values by the model. The statistics from the regression analysis demonstrate a substantial correlation between the expected and actual target values across all the datasets. Fig. 4(d) displays the performance of the mean squared error (MSE) for the training, validation, and testing data over different epochs. The plot illustrates that the performance of the network improved in proportion to the increase in epochs. The predicted response values generated by the ANN model are presented in ESI Table 2,† demonstrating a strong alignment with the actual values, as confirmed by ESI Tables 1 and 2.† This robust correlation further confirms the stability of the model. The remarkable performance of this model bears considerable significance, underscoring its potential as a valuable predictive tool for upcoming experiments. By employing the ANN model to predict results for a specific combination of input parameters, scientists can efficiently reduce the time and resources required during the experimental phase. The strong connection between the predicted and actual values enhances trust in the reliability and accuracy of the gathered experimental data. However, although the initial results of the ANN model are promising, it is crucial to validate the model using additional experimental data to further improve its accuracy and reliability. The accurate anticipation of the response by the ANN model marks a significant step forward in the realm of food processing, opening the door to more streamlined and proficient processing methods.29,50,51
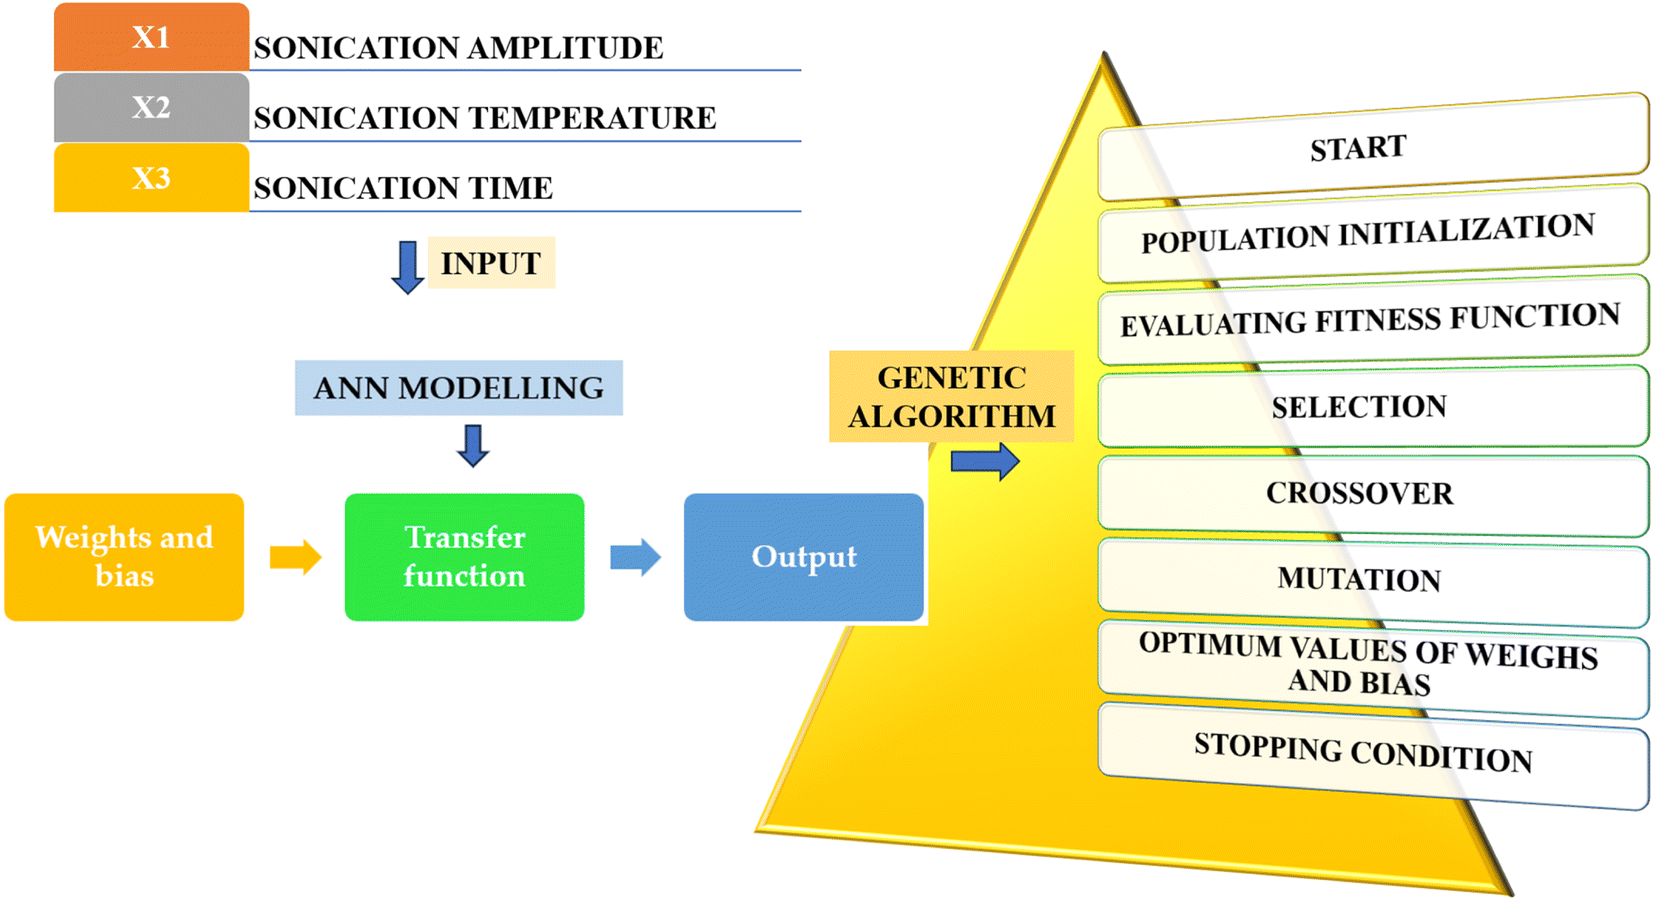
3.11 Optimized process parameter employing ANN using GA
The use of ANN is a prevalent method that utilizes diverse mechanisms, including selection, mutation, and crossover, to optimize both nearly linear and non-linear problems within the population.50,51 The ANN coupled with GA (Fig. 5) has ascertained the top conditions for SJ processing with TS following 15 iterations, as follows: under the treatment conditions: 1 (40% X1, 40 °C X2 and 60 min X3), 2 (40% X1, 50 °C X2 and 60 min X3), 3 (40% X1, 30 °C X2 and 60 min X3), 4 (30% X1, 30 °C X2 and 60 min X3), 5 (50% X1, 40 °C X2 and 60 min X3), 6 (50% X1, 30 °C X2 and 60 min X3), and 7 (50% X1, 50 °C X2 and 60 min X3). The optimized treatment combination in the ANN modelling that elicited the optimal values for the physicochemical, nutritional, and microbial attributes was 50% X1, 40 °C X2 for 60 min X3. These variables exhibited adequate agreement with the prognosticated values, demonstrating the accuracy and potential of the ANN model for enhancement.29
 |
| | Fig. 5 Post-training performance in ANN configuration with GA optimization. | |
4. Conclusions
The present investigation used a multi-layer artificial neural network to represent and optimize TS of SJ. The established ANN has a mean squared error with minimum values for pH (0.288), TSS (0.548), TA (0.288), CI (0.395), BI (0.503), AA (0.203), AOA (0.199), TAC (0.270), TCC (0.199), TPC (0.617), TFC (0.173), TVC (0.304), and YM (0.571). The R values for the training, testing, and validation for all data sets were: pH (0.966), TSS (0.870), TA (0.952), CI (0.998), BI (0.988), AA (0.982), AOA (0.960), TAC (0.821), TCC (0.989), TPC (0.932), TFC (0.980), TVC (0.995), and YMC (0.984), respectively. The high R-values demonstrated a strong agreement between the actual and predicted values. An established ANN was utilized to identify the optimal extraction variables, resulting in the identification of the ideal processing conditions (50% amplitude, 40 °C temperature for 60 min) for SJ with TS after 15 iterations. The maximum levels of AA, AOA, TAC, TCC, TPC, and TFC were attained in TSSJ under the ideal conditions. The realized results using these optimized process parameters closely corresponded to the forecasted values produced by the ANN model. These findings suggest that TS has the potential to be a promising substitute to thermal pasteurization for preserving, minimizing the quality deterioration, and enhancing the functional attributes of SJ.
Data availability
All data generated or analyzed during this study are included in the manuscript.
Author contributions
Puja Das: conceptualization, formal analysis, investigation, data curation, methodology, validation, writing-original draft. Prakash Kumar Nayak: conceptualization, supervision, validation, review and editing. Radha krishnan Kesavan: conceptualization, supervision, validation, writing—review and editing, formal analysis, data curation. All authors reviewed the results and agreed to the published version of the manuscript.
Conflicts of interest
The authors declare no conflicts of interest.
References
- L. M. Anaya-Esparza, R. M. Velázquez-Estrada, A. X. Roig, H. S. García-Galindo, S. G. Sayago-Ayerdi and E. Montalvo-González, Thermosonication: An alternative processing for fruit and vegetable juices, Trends Food Sci. Technol., 2017, 61, 26–37 CrossRef CAS.
- R. M. Aadil, X. A. Zeng, Z. Han, A. Sahar, A. A. Khalil, U. U. Rahman, M. Khan and T. Mehmood, Combined effects of pulsed electric field and ultrasound on bioactive compounds and microbial quality of grapefruit juice, J. Food Process. Preserv., 2018, 42, e13507 CrossRef.
- B. M. Lepaus, B. S. Valiati, B. G. Machado, M. M. Domingos, M. N. Silva, L. Faria-Silva, P. C. Bernardes, D. da S. Oliveira and J. F. B. de São José, Impact of ultrasound processing on the nutritional components of fruit and vegetable juices, Trends Food Sci. Technol., 2023, 138, 752–765 CrossRef CAS.
-
G. J. Swamy, K. Muthukumarappan and S. Asokapandian, Ultrasound for Fruit Juice Preservation, Fruit Juices: Extraction, Composition, Quality and Analysis, 2018, pp. 451–462 Search PubMed.
- A. Kabra, R. Sharma, S. Singla, R. Kabra and U. S. Baghel, Pharmacognostic characterization of Myrica esculenta leaves, J. Ayurveda Integr. Med., 2019, 10, 18–24 CrossRef PubMed.
- S. C. Bhatt, V. Kumar, A. K. Gupta, S. Mishra, B. Naik, S. Rustagi and M. S. Preet, Insights on bio-functional properties of Myrica esculenta plant for nutritional and livelihood security, Food Chem. Adv., 2023, 3, 100434 CrossRef.
- A. Kabra, N. Martins, R. Sharma, R. Kabra and U. S. Baghel, Myrica esculenta Buch.-Ham. ex D. Don: A Natural Source for Health Promotion and Disease Prevention, Plants, 2019, 8, 149 CrossRef CAS PubMed.
- T. F. F. da Silveira, M. Cristianini, G. G. Kuhnle, A. B. Ribeiro, J. T. Filho and H. T. Godoy, Anthocyanins, non-anthocyanin phenolics, tocopherols and antioxidant capacity of açaí juice (Euterpe oleracea) as affected by high pressure processing and thermal pasteurization, Innovative Food Sci. Emerging Technol., 2019, 55, 88–96 CrossRef CAS.
- A. A. Tahi, S. Sousa, K. Madani, C. L. M. Silva and F. A. Miller, Ultrasound and heat treatment effects on Staphylococcus aureus cell viability in orange juice, Ultrason. Sonochem., 2021, 78, 105743 CrossRef CAS PubMed.
- F. das C. do Amaral Souza, L. Gomes Sanders Moura, K. de Oliveira Bezerra, J. Paiva Lopes Aguiar, J. Moreira Mar, E. A. Sanches, F. F. dos Santos, A. M. Bakry, B. Nicolau Paulino and P. H. Campelo, Thermosonication applied on camu–camu nectars processing: Effect on bioactive compounds and quality parameters, Food Bioprod. Process., 2019, 116, 212–218 CrossRef CAS.
- A. G. Dars, K. Hu, Q. Liu, A. Abbas, B. Xie and Z. Sun, Effect of Thermo-Sonication and Ultra-High Pressure on the Quality and Phenolic Profile of Mango Juice, Foods, 2019, 8, 298 CrossRef CAS PubMed.
- A. O. Oladunjoye, F. O. Adeboyejo, T. A. Okekunbi and O. R. Aderibigbe, Effect of thermosonication on quality attributes of hog plum (Spondias mombin L.) juice, Ultrason. Sonochem., 2021, 70, 105316 CrossRef CAS PubMed.
- P. K. Nayak, C. M. Chandrasekar and R. K. Kesavan, Effect of thermosonication on the quality attributes of star fruit juice, J. Food Process. Eng., 2018, 41, e12857 CrossRef.
- M. Abid, S. Jabbar, B. Hu, M. M. Hashim, T. Wu, S. Lei, M. A. Khan and X. Zeng, Thermosonication as a potential quality enhancement technique of apple juice, Ultrason. Sonochem., 2014, 21, 984–990 CrossRef CAS PubMed.
- P. Das, P. K. Nayak, B. S. Inbaraj, M. Sharma, R. krishnan Kesavan and K. Sridhar, Effect of Thermosonication on the Nutritional Quality of Lapsi (Choerospondias axillaris) Fruit Juice: Application of Advanced Artificial Neural Networks, Foods, 2023, 12, 3723 CrossRef CAS PubMed.
- P. K. Nayak, C. M. Chandrasekar, S. Gogoi and R. Krishnan Kesavan, Impact of thermal and thermosonication treatments of amora (Spondius pinnata) juice and prediction of quality changes using artificial neural networks, Biosyst. Eng., 2022, 223, 169–181 CrossRef CAS.
- S. Yıkmış, H. Ozer, O. Levent, B. G. Çöl and B. Erdal, Effect of thermosonication and thermal treatments on antidiabetic, antihypertensive, mineral elements and in vitro bioaccessibility of bioactive compounds in freshly squeezed pomegranate juice, J. Food Meas. Char., 2022, 16, 3023–3041 CrossRef.
- R. krishnan Kesavan, S. Gogoi and P. K. Nayak, Influence of thermosonication and pasteurization on the quality attributes of kutkura (Meyna spinosa) juice, Appl. Food Res., 2023, 3, 100268 CrossRef.
- P. K. Nayak, C. M. Chandrasekar and R. K. Kesavan, Effect of thermosonication on the quality attributes of star fruit juice, J. Food Process. Eng., 2018, 41, e12857 CrossRef.
- G. Putsakum, K. Tzima, B. K. Tiwari, C. P. O'Donnell and D. K. Rai, Effects of thermosonication on ascorbic acid, polyphenols and antioxidant activity in blackberry juice, Int. J. Food Sci. Technol., 2023, 58, 2304–2311 CrossRef CAS.
- B. Basumatary, P. K. Nayak, C. M. Chandrasekar, A. Nath, M. Nayak and R. K. Kesavan, Impact of thermo sonication and pasteurization on the physicochemical, microbiological and anti-oxidant properties of pomelo (Citrus maxima) juice, Int. J. Fruit Sci., 2020, 20, S2056–S2073 CrossRef.
- A. O. Oladunjoye, F. O. Adeboyejo, T. A. Okekunbi and O. R. Aderibigbe, Effect of thermosonication on quality attributes of hog plum (Spondias mombin L.) juice, Ultrason. Sonochem., 2021, 70, 105316 CrossRef CAS PubMed.
- A. O. Oladunjoye and E. U. Awani-Aguma, Effect of thermosonication on physicochemical, bioactive, sensory and microbiological qualities of African mango fruit (Irvingia gabonensis) juice, Measurement: Food, 2023, 11, 100103 Search PubMed.
- T. Taghavi, H. Patel and R. Rafie, Comparing pH differential and methanol-based methods for anthocyanin assessments of strawberries, Food Sci. Nutr., 2022, 10, 2123–2131 CrossRef CAS PubMed.
- X. Gu, W. Cai, Y. Fan, Y. Ma, X. Zhao and C. Zhang, Estimating foliar anthocyanin content of purple corn via hyperspectral model, Food Sci. Nutr., 2018, 6, 572–578 CrossRef CAS PubMed.
- R. Sarkarat, S. Mohamadnia and O. Tavakoli, Recent advances in non-conventional techniques for extraction of phycobiliproteins and carotenoids from microalgae, Braz. J. Chem. Eng., 2022, 40, 321–342 CrossRef.
- C. Castro-López, E. J. Sánchez-Alejo, S. Saucedo-Pompa, R. Rojas, J. Aranda-Ruiz, G. C. G. Martínez-Avila, C. Ex-Hacienda, E. Canadá and N. León, Fluctuations in phenolic content, ascorbic acid and total carotenoids and antioxidant activity of fruit beverages during storage, Heliyon, 2016, 2, e00152 CrossRef PubMed.
- M. G. E. P. Deli, B. D. Kirit, E. Ağçam, N. I. Cinkir and A. Akyildiz, Changes in cashew apple juice treated with optimum thermosonication during storage, Food Chem. Adv., 2022, 1, 100120 CrossRef.
- M. Rakshit and P. P. Srivastav, Optimization of pulsed ultrasonic-assisted extraction of punicalagin from pomegranate (Punica granatum) peel: A comparison between response surface methodology and artificial neural network-multiobjective genetic algorithm, J. Food Process. Preserv., 2021, 45, e15078 CAS.
- S. Gogoi, P. Das, P. K. Nayak, K. Sridhar, M. Sharma, T. P. Sari, R. Krishnan Kesavan and M. Bhaswant, Optimizing Quality and Shelf-Life Extension of Bor-Thekera (Garcinia pedunculata) Juice: A Thermosonication Approach with Artificial Neural Network Modeling, Foods, 2024, 13, 497 CrossRef CAS PubMed.
- S. Raju and S. C. Deka, Influence of thermosonication treatments on bioactive compounds and sensory quality of fruit (Haematocarpus validus) juice, J. Food Process. Preserv., 2018, 42, e13701 CrossRef.
- J. Wang, J. Wang, S. K. Vanga and V. Raghavan, High-intensity ultrasound processing of kiwifruit juice: Effects on the microstructure, pectin, carbohydrates and rheological properties, Food Chem., 2020, 313, 126121 CrossRef PubMed.
- H. Demir and A. Kılınç, Effect of batch and continuous thermosonication on the microbial and physicochemical quality of pumpkin juice, J. Food Sci. Technol., 2019, 56, 5036–5045 CrossRef CAS PubMed.
- J. J. Park, I. F. Olawuyi and W. Y. Lee, Influence of Thermo-sonication and Ascorbic Acid Treatment on Microbial Inactivation and Shelf-Life Extension of Soft Persimmon (Diospyros kaki T.) Juice, Food Bioprocess Technol., 2021, 14, 429–440 CrossRef CAS.
- P. Das, P. K. Nayak, M. Sharma, V. B. Raghavendra, R. Krishnan Kesavan and K. Sridhar, Computational Modelling for Optimization of Thermosonicated Sohshang (Elaeagnus latifolia) Fruit Juice Using Artificial Neural Networks, J. Food Process. Preserv., 2024, 2024, 1–17 CrossRef.
- B. G. Çöl, M. Akhan, B. Ç. Sancar, M. Türkol, S. Yıkmış and C. Hecer, Effect of Thermosonication on Amino Acids, Phenolic Compounds, Sensory Properties and Microbial Quality in Freshly Squeezed Verjuice, Foods, 2023, 12, 2167 CrossRef PubMed.
- Y. Wu, L. Xu, X. Liu, K. M. F. Hasan, H. Li, S. Zhou, Q. Zhang and Y. Zhou, Effect of thermosonication treatment on blueberry juice quality: Total phenolics, flavonoids, anthocyanin, and antioxidant activity, LWT--Food Sci. Technol., 2021, 150, 112021 CrossRef CAS.
- C. F. Codevilla, B. Tischer, A. L. Gindri, D. R. Nogueira-Librelotto, J. S. Barin, C. de B. da Silva, C. M. B. Rolim, L. Q. Zepka and C. R. de Menezes, Cytotoxicity and antioxidant activity of goldenberry extracts obtained with high intensity ultrasound, Cienc. Rural, 2018, 48, e20170362 Search PubMed.
- L. de L. Alves, R. L. dos Santos, B. L. Bayer, A. L. M. Devens, A. J. Cichoski and C. R. B. Mendonça, Thermosonication of tangerine juice: Effects on quality characteristics, bioactive compounds, and antioxidant activity, J. Food Process. Preserv., 2020, 44, e14914 Search PubMed.
- A. R. Abdulstar, A. B. Altemimi and A. R. Al-Hilphy, Exploring the Power of Thermosonication: A Comprehensive Review of Its Applications and Impact in the Food Industry, Foods, 2023, 12, 1459 CrossRef CAS PubMed.
- M. F. Manzoor, B. Xu, S. Khan, R. Shukat, N. Ahmad, M. Imran, A. Rehman, E. Karrar, R. M. Aadil and S. A. Korma, Impact of high-intensity thermosonication treatment on spinach juice: Bioactive compounds, rheological, microbial, and enzymatic activities, Ultrason. Sonochem., 2021, 78, 105740 CrossRef CAS PubMed.
- P. S. Das, P. K. Nayak, K. Senthilnathan, P. Das and R. Krishnan Kesavan, Optimization of thermosonication treatments to improve the quality parameters of posotia (Vitex negundo) juice, J. Agric. Food Res., 2023, 14, 100811 CAS.
- T. M. Qureshi, M. Nadeem, F. Maken, A. Tayyaba, H. Majeed and M. Munir, Influence of ultrasound on the functional characteristics of indigenous varieties of mango (Mangifera indica L.), Ultrason. Sonochem., 2020, 64, 104987 CrossRef CAS PubMed.
- L. Mateus-Reguengo, L. Barbosa-Pereira, W. Rembangouet, M. Bertolino, M. Giordano, O. Rojo-Poveda and G. Zeppa, Food applications of Irvingia gabonensis (Aubry-Lecomte ex. O’Rorke) Baill., the ‘bush mango’: A review, Crit. Rev. Food Sci. Nutr., 2019, 60, 2446–2459 CrossRef PubMed.
- R. Krishnan Kesavan, S. Begum, P. Das and P. K. Nayak, Hurdle effect of thermosonication and non-thermal processing on the quality characteristics of fruit juices: An overview, J. Food Process. Eng., 2023, 46, e14310 CrossRef CAS.
- R. Khani, R. Sheykhi and G. Bagherzade, An environmentally friendly method based on micro-cloud point extraction for determination of trace amount of quercetin in food and fruit juice samples, Food Chem., 2019, 293, 220–225 CrossRef CAS PubMed.
- J. Mandha, H. Shumoy, A. O. Matemu and K. Raes, Characterization of fruit juices and effect of pasteurization and storage conditions on their microbial, physicochemical, and nutritional quality, Food Biosci., 2023, 51, 102335 CrossRef CAS.
- J. Li, X. Zhang, M. Ashokkumar, D. Liu and T. Ding, Molecular regulatory mechanisms of Escherichia coli O157:H7 in response to ultrasonic stress revealed by proteomic analysis, Ultrason. Sonochem., 2020, 61, 104835 CrossRef CAS PubMed.
- L. Mateus-Reguengo, L. Barbosa-Pereira, W. Rembangouet, M. Bertolino, M. Giordano, O. Rojo-Poveda and G. Zeppa, Food applications of Irvingia gabonensis (Aubry-Lecomte ex. O’Rorke) Baill., the ‘bush mango’: A review, Crit. Rev. Food Sci. Nutr., 2019, 60, 2446–2459 CrossRef PubMed.
- A. Sonawane, S. S. Pathak and R. C. Pradhan, Optimization of a Process for the Enzymatic Extraction of Nutrient Enriched Bael Fruit Juice Using Artificial Neural Network (ANN) and Response Surface Methodology (RSM), Int. J. Fruit Sci., 2020, 20, S1845–S1861 CrossRef.
- S. Yıkmış, E. Bozgeyik, O. Levent and H. Aksu, Organic cherry laurel (Prunus laurocerasus) vinegar enriched with bioactive compounds with ultrasound technology using artificial neural network (ANN) and response surface methodology (RSM): Antidiabetic, antihypertensive, cytotoxic activities, volatile profile and optical microstructure, J. Food Process. Preserv., 2021, 45, e15883 Search PubMed.
|
| This journal is © The Royal Society of Chemistry 2024 |
Click here to see how this site uses Cookies. View our privacy policy here. 
 Open Access Article
 This Open Access Article is licensed under a Creative Commons Attribution-Non Commercial 3.0 Unported Licence
 *
*