 Open Access Article
Nutritional quality analysis of high-moisture extrudates containing mixed proteins from soy and surimi
Anna
Hu†
a,
Yujie
Zhang†
a,
Jinchuang
Zhang
 *a,
Tongqing
Li
a,
Zhaojun
Wang
 b and
Qiang
Wang
 *a
*a
aInstitute of Food Science and Technology, Chinese Academy of Agricultural Sciences, Key Laboratory of Agro-Products Processing, Ministry of Agriculture and Rural Affairs, Beijing 100193, China. E-mail: zhangjinchuang1002@163.com; wangqiang06@caas.cn
bState Key Laboratory of Food Science and Resource, Jiangnan University, Wuxi, 214122, China
First published on 1st December 2023
Abstract
High-moisture extrusion technology emerges as a prime choice for preparing alternative protein products with a meat-like texture. However, the nutritional aspects of these products, prepared from a blend of plant and animal proteins, remain unclear. This study investigated the nutritional qualities of extrudates derived from soy protein isolate (SPI) and surimi, exploring ratios ranging from 90![[thin space (1/6-em)]](https://www.rsc.org/images/entities/char_2009.gif) :
:![[thin space (1/6-em)]](https://www.rsc.org/images/entities/char_2009.gif) 10 to 50
10 to 50![[thin space (1/6-em)]](https://www.rsc.org/images/entities/char_2009.gif) :
:![[thin space (1/6-em)]](https://www.rsc.org/images/entities/char_2009.gif) 50, with varied extrusion temperature (125 °C, 135 °C and 145 °C) and moisture content (65%, 70% and 75%). Results revealed the significant role played by surimi in enhancing both amino acid and fatty acid contents in high-moisture extrudates originating from SPI and surimi. Notably, the first limiting amino acid score (AAS/MET + CYS) increased significantly from 88.82 to 109.50 as the surimi content increased from 10% to 50%. Moreover, the levels of docosahexaenoic acid (DHA) and eicosapentaenoic acid (EPA) in the extrudates significantly increased, concurrently reducing the n-6/n-3 fatty acid ratio. At a higher moisture content (70–75%), increasing extrusion temperature bolstered the fatty acid content in the extrudates. When the SPI–surimi ratio was 90
50, with varied extrusion temperature (125 °C, 135 °C and 145 °C) and moisture content (65%, 70% and 75%). Results revealed the significant role played by surimi in enhancing both amino acid and fatty acid contents in high-moisture extrudates originating from SPI and surimi. Notably, the first limiting amino acid score (AAS/MET + CYS) increased significantly from 88.82 to 109.50 as the surimi content increased from 10% to 50%. Moreover, the levels of docosahexaenoic acid (DHA) and eicosapentaenoic acid (EPA) in the extrudates significantly increased, concurrently reducing the n-6/n-3 fatty acid ratio. At a higher moisture content (70–75%), increasing extrusion temperature bolstered the fatty acid content in the extrudates. When the SPI–surimi ratio was 90![[thin space (1/6-em)]](https://www.rsc.org/images/entities/char_2009.gif) :
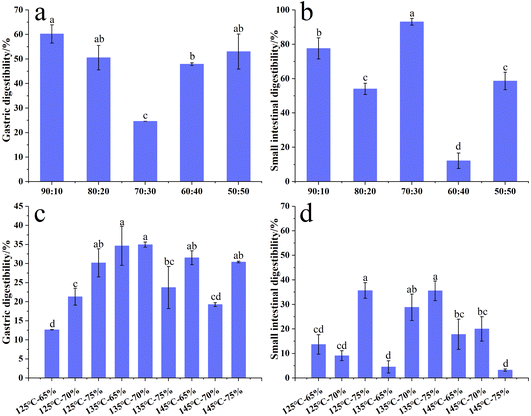
:![[thin space (1/6-em)]](https://www.rsc.org/images/entities/char_2009.gif) 10, the gastric digestibility of the extrudates was the highest (60.20%). Meanwhile, the highest small intestinal digestibility was 93.07% at a SPI–surimi ratio of 70
10, the gastric digestibility of the extrudates was the highest (60.20%). Meanwhile, the highest small intestinal digestibility was 93.07% at a SPI–surimi ratio of 70![[thin space (1/6-em)]](https://www.rsc.org/images/entities/char_2009.gif) :
:![[thin space (1/6-em)]](https://www.rsc.org/images/entities/char_2009.gif) 30. At lower extrusion temperatures (125–135 °C), increasing moisture content led to a notable increase in the small intestinal digestibility of the extrudates. SPI–surimi ratios and hydro-thermal combined parameters have significant effects on the in vitro digestibility of high-moisture extrudates. This study could contribute to the improvement of nutritional qualities of alternative protein products based on mixed proteins from soy and surimi.
30. At lower extrusion temperatures (125–135 °C), increasing moisture content led to a notable increase in the small intestinal digestibility of the extrudates. SPI–surimi ratios and hydro-thermal combined parameters have significant effects on the in vitro digestibility of high-moisture extrudates. This study could contribute to the improvement of nutritional qualities of alternative protein products based on mixed proteins from soy and surimi.
Sustainability spotlightAccording to the UN's Sustainable Development Goals (SDGs), alternative protein products containing mixed proteins from soy and surimi can contribute to sustainability in several aspects. Firstly, this study focuses on the nutrition analysis of high-moisture extruded mixed proteins from soy and surimi, including amino acid and fatty acid contents, etc., which corresponds to SDG 2, improving nutrition and promoting sustainable agriculture. Secondly, partially replacing animal protein with plant protein has the potential to mitigate chronic diseases like heart disease and diabetes, thereby contributing to the achievement of SDG 3 of healthier food and diets. Thirdly, this study is also beneficial for achieving SDG 13 for fewer greenhouse gas emissions through alternative protein product development. In conclusion, this study has a positive impact on the UN SDGs. |
Introduction
The global population is projected to reach about 10 billion individuals by 2050,1 resulting in a rapid rise in the global demand for protein sources. The global demand for animal-derived meat products is expected to reach 455 million tons.2 To meet this demand, it is necessary to explore new protein sources to complement traditional ones. Alternative protein sources3 such as plant proteins (grains, legumes, tubers, and oilseeds), insect proteins, microorganisms (fungi and bacteria) and aquatic proteins (algae) are gaining attention. These sources are grown and processed in ways that reduce greenhouse gas emissions,4,5 land, and water resource wastage.6 They are already used in food, cosmetics and pharmaceuticals.1,7 Various meat-like alternative protein products have been developed from sustainable sources.8,9 Soy protein is known for its excellent gelation properties and fibrous structure formation.10–12 Surimi, derived from animals, contains unsaturated fatty acids (e.g., DHA and EPA). Mixing soy protein with surimi can create alternative protein products with comprehensive nutrition quality.13,14 These products have garnered attention, particularly in terms of their nutrition profile,14,15 including amino acids, fatty acids and digestibility.Combining soy protein and surimi results in products with superior nutritional properties.13,16 Researchers have explored different processing methods,7,8 such as ultra-high pressure, microwave heating, 3D printing and ultrasonic technology, to enhance the quality of surimi-based products. Food extrusion technology has also been used to improve the digestibility and texture of soy protein and surimi blends.17 Kaur et al.18 showed that adjusting the ratios of surimi and wheat protein could enhance the digestibility of extrudates. Adding soy protein can increase the content of essential amino acids,19 but a higher extrusion temperature and a lower moisture content may lead to amino acid loss.20
High-moisture extrusion is a promising method for creating alternative protein products with a meat-like texture.21 One of the advantages of high-moisture extrusion is that the extrudates produced are ready-to-eat and have an improved fibrous structure.22 It is energy-efficient and environmentally sustainable,9,23 improving the digestibility of both plant and animal proteins while reducing anti-nutritional factors.24 At present, raw materials mainly consist of plant proteins such as soy protein, pea protein, and wheat gluten. Gradually, animal proteins have been added, enriching the products with a variety of nutrients, including proteins, lipids, carbohydrates, minerals, vitamins and dietary fiber.13,16,17 Extrusion can be used to imitate the texture of marine products, such as by adding surimi during extrusion.25 Altering the raw material ratio and extrusion process parameters during the high-moisture extrusion can further enhance nutritional properties.17,26 Kaur et al.18 showed that the content of essential amino acids and fatty acids can be increased as the surimi content increased. Lin et al.27 showed that the dietary fiber content of surimi and the antioxidant capacity were enhanced with the addition of wheat. Pudtikajorn et al.28 reported that the addition of surimi increased the nutritional quality of fish tofu. Sorensen et al.29 reported that a low extrusion temperature improved the digestibility of extruded feeds. Delgado et al.30 found that different extrusion temperatures, screw speeds and moisture contents changed the nutritional content of extrudates. However, the nutritional qualities of mixed proteins from soy and surimi under high-moisture extrusion conditions (moisture content ranging from 40% to 80%) remain uncertain.31
This study aims to analyze nutritional changes in extrudates through high-moisture extrusion, varying SPI–surimi ratios and extrusion parameters. It also seeks to explore the effect of SPI–surimi ratios on amino acids and fatty acids in extrudates and examine how hydrothermal parameters affect these nutritional aspects. Additionally, the digestibility of the mixed proteins from soy and surimi was investigated. These findings reveal the nutritional potential of alternative protein products with a mixture of plant and animal proteins prepared using high-moisture extrusion.
Materials and methods
Materials
Soy protein isolate (SPI) was supplied by Yihai Kerry Co., Ltd. (Shanghai, China), containing 90.81% protein (dry basis), 5.55% moisture, 0.36% fat (dry basis) and 4.67% ash content (dry basis). Surimi was purchased from Shengteng Seafood Co., Ltd. (Qingdao, China), containing 52.78% protein (dry basis), 67.97% moisture, 8.38% fat (dry basis) and 1.73% ash content (dry basis).High-moisture extrusion experiments
Before extruding, the SPI and surimi were mixed using a mixer (JHF-20L, Zhengzhou Jinhe Machinery Manufacture Co., Ltd, China). The extrusion experiments of the SPI–surimi mixtures were carried out using a co-rotating twin-screw food extruder (FMHE36-24, FUMACH, China) with a screw diameter of 36 mm and a length/diameter ratio of 24![[thin space (1/6-em)]](https://www.rsc.org/images/entities/char_2009.gif) :
:![[thin space (1/6-em)]](https://www.rsc.org/images/entities/char_2009.gif) 1. The extruder barrel was segmented into a feeding zone and five temperature-controlled zones. At the exit of the barrel, a long cylindrical cooling die with a diameter of 22 mm was attached. The extrusion conditions of different SPI–surimi ratios and hydro-thermal combined parameters were set according to Tables 1 and 2, respectively. The cooling die was kept at 50 °C controlled by the running moisture.8
1. The extruder barrel was segmented into a feeding zone and five temperature-controlled zones. At the exit of the barrel, a long cylindrical cooling die with a diameter of 22 mm was attached. The extrusion conditions of different SPI–surimi ratios and hydro-thermal combined parameters were set according to Tables 1 and 2, respectively. The cooling die was kept at 50 °C controlled by the running moisture.8
![[thin space (1/6-em)]](https://www.rsc.org/images/entities/char_2009.gif) :
:![[thin space (1/6-em)]](https://www.rsc.org/images/entities/char_2009.gif) surimi ratios
surimi ratios
| Number | SPI![[thin space (1/6-em)]](https://www.rsc.org/images/entities/char_2009.gif) : :![[thin space (1/6-em)]](https://www.rsc.org/images/entities/char_2009.gif) surimi surimi |
Extrusion temperature (°C) | Moisture content (%) | Screw speed (rpm) | Feed rate (kg h−1) |
|---|---|---|---|---|---|
| 1 | 90![[thin space (1/6-em)]](https://www.rsc.org/images/entities/char_2009.gif) : :![[thin space (1/6-em)]](https://www.rsc.org/images/entities/char_2009.gif) 10 10 |
135 | 70 | 210 | 7 |
| 2 | 80![[thin space (1/6-em)]](https://www.rsc.org/images/entities/char_2009.gif) : :![[thin space (1/6-em)]](https://www.rsc.org/images/entities/char_2009.gif) 20 20 |
135 | 70 | 210 | 7 |
| 3 | 70![[thin space (1/6-em)]](https://www.rsc.org/images/entities/char_2009.gif) : :![[thin space (1/6-em)]](https://www.rsc.org/images/entities/char_2009.gif) 30 30 |
135 | 70 | 210 | 7 |
| 4 | 60![[thin space (1/6-em)]](https://www.rsc.org/images/entities/char_2009.gif) : :![[thin space (1/6-em)]](https://www.rsc.org/images/entities/char_2009.gif) 40 40 |
135 | 70 | 210 | 7 |
| 5 | 50![[thin space (1/6-em)]](https://www.rsc.org/images/entities/char_2009.gif) : :![[thin space (1/6-em)]](https://www.rsc.org/images/entities/char_2009.gif) 50 50 |
135 | 70 | 210 | 7 |
| Number | SPI![[thin space (1/6-em)]](https://www.rsc.org/images/entities/char_2009.gif) : :![[thin space (1/6-em)]](https://www.rsc.org/images/entities/char_2009.gif) surimi surimi |
Extrusion temperature (°C) | Moisture content (%) | Screw speed (rpm) | Feed rate (kg h−1) |
|---|---|---|---|---|---|
| 1 | 80![[thin space (1/6-em)]](https://www.rsc.org/images/entities/char_2009.gif) : :![[thin space (1/6-em)]](https://www.rsc.org/images/entities/char_2009.gif) 20 20 |
125 | 65 | 210 | 7 |
| 2 | 80![[thin space (1/6-em)]](https://www.rsc.org/images/entities/char_2009.gif) : :![[thin space (1/6-em)]](https://www.rsc.org/images/entities/char_2009.gif) 20 20 |
125 | 70 | 210 | 7 |
| 3 | 80![[thin space (1/6-em)]](https://www.rsc.org/images/entities/char_2009.gif) : :![[thin space (1/6-em)]](https://www.rsc.org/images/entities/char_2009.gif) 20 20 |
125 | 75 | 210 | 7 |
| 4 | 80![[thin space (1/6-em)]](https://www.rsc.org/images/entities/char_2009.gif) : :![[thin space (1/6-em)]](https://www.rsc.org/images/entities/char_2009.gif) 20 20 |
135 | 65 | 210 | 7 |
| 5 | 80![[thin space (1/6-em)]](https://www.rsc.org/images/entities/char_2009.gif) : :![[thin space (1/6-em)]](https://www.rsc.org/images/entities/char_2009.gif) 20 20 |
135 | 70 | 210 | 7 |
| 6 | 80![[thin space (1/6-em)]](https://www.rsc.org/images/entities/char_2009.gif) : :![[thin space (1/6-em)]](https://www.rsc.org/images/entities/char_2009.gif) 20 20 |
135 | 75 | 210 | 7 |
| 7 | 80![[thin space (1/6-em)]](https://www.rsc.org/images/entities/char_2009.gif) : :![[thin space (1/6-em)]](https://www.rsc.org/images/entities/char_2009.gif) 20 20 |
145 | 65 | 210 | 7 |
| 8 | 80![[thin space (1/6-em)]](https://www.rsc.org/images/entities/char_2009.gif) : :![[thin space (1/6-em)]](https://www.rsc.org/images/entities/char_2009.gif) 20 20 |
145 | 70 | 210 | 7 |
| 9 | 80![[thin space (1/6-em)]](https://www.rsc.org/images/entities/char_2009.gif) : :![[thin space (1/6-em)]](https://www.rsc.org/images/entities/char_2009.gif) 20 20 |
145 | 75 | 210 | 7 |
Determination of amino acids
The amino acid score (AAS) was estimated from the amount of protein required to provide the minimal essential amino acid (EAA) pattern for adults, using the FAO/WHO (2007) reference pattern and according to the equation:32 | (1) |
The chemical score (CS) and the essential amino acid index (EAAI) were calculated by the method of the equations:33
 | (2) |
 | (3) |
The biological value (BV) is the ratio of the amount of nitrogen used by the human body and the amount of nitrogen absorbed by the body after protein was digested and absorbed. BV was calculated using eqn (4):34
| BV = (1.09 × EAAI) − 11.70 | (4) |
The nutritional index (NI) was used to comprehensively describe the protein content and amino acid composition patterns, which was calculated using eqn (5):35
| NI = EAA × protein (g/100 g)/100 | (5) |
Determination of fatty acids
The fatty acid profiles were analyzed in a previous study.33 The atherosclerosis index (IA) and thrombosis index (IT), used to assess the effect of fatty acids in extrudates on human cardiovascular diseases, were calculated according to eqn (6) and (7),36 respectively. | (6) |
 | (7) |
The monounsaturated fatty acid and the polyunsaturated fatty acid were denoted as MUFA and PUFA, respectively.
In vitro protein digestibility
The in vitro protein digestibility (IVPD) of the extrudates was determined according to a previous study.8 With some modifications, 0.1 g triturated extrudates were diluted with 15 mL of 0.1 M HCL and preheated at 37.5 °C for 10 min. 2 mg pepsin (Sigma-Aldrich Ltd., St Louis, USA) was added into the preheated solution and kept at 37.5 °C for 3 h. The pepsin hydrolysis was ended by adding 7.5 mL of 0.2 M NaOH. The solution was collected to analyze the gastric IVPD. The simulated intestinal digestibility started with adding 7.5 mL of 0.2 M phosphate buffer (pH 8.0) containing 4 mg trypsin (Sigma-Aldrich Ltd., St Louis, USA) into the solution of the ended pepsin hydrolysis, and then the solution was heated at 37 °C for 4 h. The trypsin hydrolysis was ended by boiling for 10 min. The final solution was collected. All of the collected solution was precipitated with isopycnic 10% trichloroacetic acid for 1 h and then centrifuged at 1000 g for 30 min.37 The liquid supernatant was collected to determine the protein content. The blank sample was prepared by treatments under the described conditions without the extrudate sample. The IVPD of the extrudates was calculated using the equation:34| IVPD (%) = (Ps − P0)/Pe × 100% | (8) |
Statistical analysis
Analysis of variance (ANOVA) was used to analyze all data through Statistical Product and Service Solutions software (version 26.0, SPSS Inc., Chicago, USA). Duncan's test was used to evaluate the comparisons between treatments. The statistical significance level was set at 0.05. Principal component analysis (PCA) was performed using The Unscrambler X 10.4.Results and discussion
Amino acid evaluation
![[thin space (1/6-em)]](https://www.rsc.org/images/entities/char_2009.gif) :
:![[thin space (1/6-em)]](https://www.rsc.org/images/entities/char_2009.gif) 20, 60
20, 60![[thin space (1/6-em)]](https://www.rsc.org/images/entities/char_2009.gif) :
:![[thin space (1/6-em)]](https://www.rsc.org/images/entities/char_2009.gif) 40 and 50
40 and 50![[thin space (1/6-em)]](https://www.rsc.org/images/entities/char_2009.gif) :
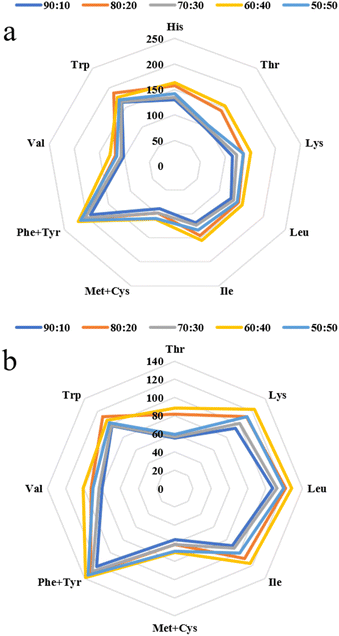
:![[thin space (1/6-em)]](https://www.rsc.org/images/entities/char_2009.gif) 50, the AAS of the extrudates was more than 100, suggesting that the amino acid contents of the extrudates was much higher than those of the FAO/WHO and the extrudates at these ratios could meet the requirements of adults' body.41
50, the AAS of the extrudates was more than 100, suggesting that the amino acid contents of the extrudates was much higher than those of the FAO/WHO and the extrudates at these ratios could meet the requirements of adults' body.41
| Amino acids (mg per g protein) | SPI–surimi ratios | |||||
|---|---|---|---|---|---|---|
90![[thin space (1/6-em)]](https://www.rsc.org/images/entities/char_2009.gif) : :![[thin space (1/6-em)]](https://www.rsc.org/images/entities/char_2009.gif) 10 10 |
80![[thin space (1/6-em)]](https://www.rsc.org/images/entities/char_2009.gif) : :![[thin space (1/6-em)]](https://www.rsc.org/images/entities/char_2009.gif) 20 20 |
70![[thin space (1/6-em)]](https://www.rsc.org/images/entities/char_2009.gif) : :![[thin space (1/6-em)]](https://www.rsc.org/images/entities/char_2009.gif) 30 30 |
60![[thin space (1/6-em)]](https://www.rsc.org/images/entities/char_2009.gif) : :![[thin space (1/6-em)]](https://www.rsc.org/images/entities/char_2009.gif) 40 40 |
50![[thin space (1/6-em)]](https://www.rsc.org/images/entities/char_2009.gif) : :![[thin space (1/6-em)]](https://www.rsc.org/images/entities/char_2009.gif) 50 50 |
||
| a Different letters in the same row mean significant differences (p < 0.05). | ||||||
| Essential amino acids (EAAs) | THR | 22.05 ± 0.51c | 32.55 ± 0.62b | 22.71 ± 0.53c | 35.23 ± 0.11a | 23.78 ± 1.57c |
| VAL | 39.80 ± 0.11e | 46.15 ± 0.64b | 41.76 ± 0.11d | 50.36 ± 0.68a | 44.96 ± 0.25c | |
| MET | 11.49 ± 0.13c | 13.00 ± 0.01b | 13.10 ± 0.28b | 15.50 ± 0.52a | 16.33 ± 0.48a | |
| ILE | 35.54 ± 0.27e | 43.43 ± 0.45b | 37.02 ± 0.16d | 46.73 ± 0.30a | 40.25 ± 0.61c | |
| LEU | 75.10 ± 0.30d | 85.07 ± 2.02b | 78.41 ± 0.26c | 89.69 ± 0.66a | 83.59 ± 0.93b | |
| TRP | 9.77 ± 0.25b | 11.20 ± 0.36a | 9.85 ± 0.13b | 10.57 ± 0.52ab | 10.17 ± 0.11b | |
| PHE | 43.62 ± 0.16d | 45.77 ± 0.25c | 46.17 ± 0.52c | 48.18 ± 0.94a | 47.12 ± 0.39ab | |
| LYS | 51.63 ± 0.45d | 61.21 ± 1.12b | 55.40 ± 0.47c | 67.69 ± 0.81a | 61.61 ± 0.28b | |
| Non-essential amino acids (NEAAs) | ASP | 110.72 ± 0.16c | 113.85 ± 1.85bc | 115.81 ± 0.70b | 120.92 ± 1.45a | 119.93 ± 1.46a |
| HIS | 19.55 ± 0.08d | 23.60 ± 0.42b | 20.25 ± 0.13d | 24.49 ± 0.54a | 21.23 ± 0.24c | |
| ARG | 59.54 ± 0.80c | 71.98 ± 1.10a | 62.50 ± 0.42bc | 75.65 ± 0.81a | 64.45 ± 3.37b | |
| PRO | 51.02 ± 4.12a | 40.94 ± 2.45b | 51.75 ± 1.24a | 41.94 ± 1.03b | 46.64 ± 2.65b | |
| CYS | 8.05 ± 0.05b | 8.48 ± 0.66ab | 8.53 ± 0.03ab | 9.00 ± 0.25a | 7.76 ± 0.27b | |
| TYR | 29.21 ± 0.23c | 32.90 ± 0.26b | 31.00 ± 0.74c | 34.77 ± 0.28a | 33.79 ± 1.38ab | |
| SER | 40.60 ± 1.01c | 43.58 ± 0.83b | 41.45 ± 0.47c | 47.58 ± 0.26a | 41.89 ± 0.51c | |
| GLU | 190.05 ± 0.14d | 207.33 ± 1.34b | 198.52 ± 1.84c | 222.38 ± 2.50a | 208.33 ± 1.51b | |
| GLY | 32.38 ± 0.01c | 37.68 ± 0.89b | 32.91 ± 0.40c | 39.49 ± 0.48a | 33.67 ± 0.64c | |
| ALA | 34.97 ± 0.36d | 41.40 ± 1.83ab | 37.07 ± 0.52cd | 43.51 ± 0.37a | 39.54 ± 1.46bc | |
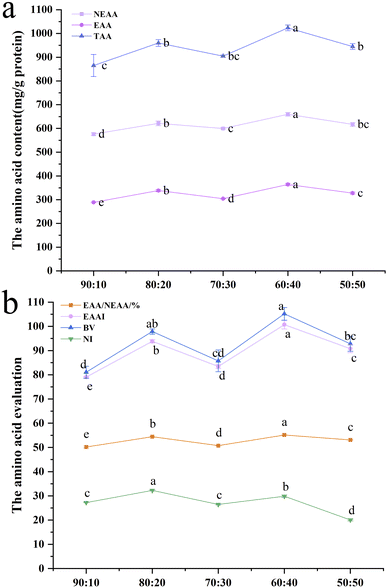
| Total amino acids (TAAs) | 865.01 ± 46.32c | 960.06 ± 14.23b | 904.17 ± 4.93bc | 1023.60 ± 12.01a | 945.01 ± 12.05b | |
 | ||
| Fig. 1 Amino acid scores (AASs) (a) and chemical scores (CSs) (b) of the extrudates with different SPI–surimi ratios. | ||
In Fig. 2, the EAA/EAAI values were between 50.17% and 55.16%, which could almost reach the reference values of 60% recommended by the FAO/WHO. At a SPI–surimi ratio of 60![[thin space (1/6-em)]](https://www.rsc.org/images/entities/char_2009.gif) :
:![[thin space (1/6-em)]](https://www.rsc.org/images/entities/char_2009.gif) 40, the TAA, EAA, NEAA, EAA/NEAA, EAAI and BV of the extrudates were significantly higher than those of others. In Fig. 2b, at a SPI–surimi of 80
40, the TAA, EAA, NEAA, EAA/NEAA, EAAI and BV of the extrudates were significantly higher than those of others. In Fig. 2b, at a SPI–surimi of 80![[thin space (1/6-em)]](https://www.rsc.org/images/entities/char_2009.gif) :
:![[thin space (1/6-em)]](https://www.rsc.org/images/entities/char_2009.gif) 20, the NI of the extrudates was 32.24, which was significantly higher than that of all the others. Results showed that as the surimi content increased from 10% to 50%, the extrudates were rich in various amino acids and the amino acid pattern was more balanced, especially at a SPI–surimi ratio of 60
20, the NI of the extrudates was 32.24, which was significantly higher than that of all the others. Results showed that as the surimi content increased from 10% to 50%, the extrudates were rich in various amino acids and the amino acid pattern was more balanced, especially at a SPI–surimi ratio of 60![[thin space (1/6-em)]](https://www.rsc.org/images/entities/char_2009.gif) :
:![[thin space (1/6-em)]](https://www.rsc.org/images/entities/char_2009.gif) 40. Ai et al.19 also reported that fish meal from surimi can improve the balance of the amino acid pattern. When the surimi content was excessive (50%), the interactions between soy protein and surimi protein molecules became weaker, while the protein–protein interactions of surimi were enhanced, which might not be conducive to the retention of amino acids.
40. Ai et al.19 also reported that fish meal from surimi can improve the balance of the amino acid pattern. When the surimi content was excessive (50%), the interactions between soy protein and surimi protein molecules became weaker, while the protein–protein interactions of surimi were enhanced, which might not be conducive to the retention of amino acids.
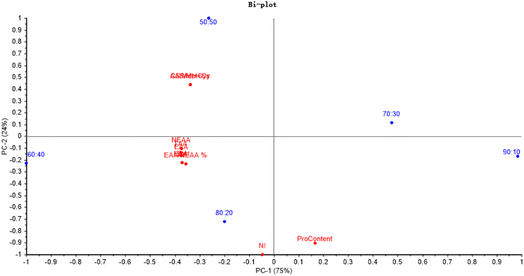
The principal component analysis (PCA) soring plot and factor loading plot can make it easier to discriminate the differences of the samples visually and help to determine the degree of contribution of the variances (PC1-75% and PC2-24%). According to Fig. 3, EAA, NEAA and TAA were significantly related to the ratio of 60![[thin space (1/6-em)]](https://www.rsc.org/images/entities/char_2009.gif) :
:![[thin space (1/6-em)]](https://www.rsc.org/images/entities/char_2009.gif) 40. And the NI was critically related to the ratio of 80
40. And the NI was critically related to the ratio of 80![[thin space (1/6-em)]](https://www.rsc.org/images/entities/char_2009.gif) :
:![[thin space (1/6-em)]](https://www.rsc.org/images/entities/char_2009.gif) 20.
20.
| Amino acid contents (mg per g protein) | Hydro-thermal parameters | |||||||||
|---|---|---|---|---|---|---|---|---|---|---|
| 125 °C-65% | 135 °C-65% | 145 °C-65% | 125 °C-70% | 135 °C-70% | 145 °C-70% | 125 °C-75% | 135 °C-75% | 145 °C-75% | ||
| a Different letters in the same row mean significant differences (p < 0.05). | ||||||||||
| EAA | THR | 26.70 ± 1.82bcd | 28.96 ± 0.47abc | 26.62 ± 1.22cd | 29.14 ± 0.06abc | 25.73 ± 0.76d | 29.25 ± 0.18abc | 31.67 ± 2.06a | 29.80 ± 0.59ab | 29.32 ± 2.02abc |
| VAL | 45.55 ± 3.31ab | 48.31 ± 0.12a | 44.68 ± 2.23ab | 46.50 ± 0.79ab | 42.18 ± 1.27b | 47.60 ± 0.13a | 47.83 ± 0.91a | 44.75 ± 0.23ab | 42.93 ± 2.85b | |
| MET | 12.59 ± 0.78abc | 13.41 ± 0.38a | 12.41 ± 0.38abc | 12.61 ± 0.07abc | 11.45 ± 0.29c | 12.94 ± 0.49ab | 13.05 ± 0.21a | 12.45 ± 0.26abc | 11.8 ± 0.77bc | |
| ILE | 39.32 ± 2.63ab | 41.67 ± 0.01a | 38.83 ± 1.99ab | 41.36 ± 0.64a | 37.04 ± 1.14b | 41.91 ± 0.66a | 42.96 ± 1.17a | 40.47 ± 0.10ab | 39.50 ± 2.86ab | |
| LEU | 75.18 ± 4.54abc | 79.53 ± 0.06ab | 73.88 ± 3.47bc | 78.84 ± 1.28ab | 69.87 ± 2.42c | 79.00 ± 0.49ab | 82.10 ± 3.28a | 78.45 ± 0.22ab | 75.38 ± 5.61abc | |
| TRP | 12.06 ± 0.52ab | 12.37 ± 0.69a | 10.57 ± 0.40cd | 11.09 ± 0.35bc | 10.26 ± 0.35cd | 10.92 ± 0.42bcd | 11.18 ± 0.29abc | 11.05 ± 0.82bcd | 9.84 ± 0.30a | |
| PHE | 43.64 ± 2.79ab | 46.96 ± 0.06a | 43.83 ± 1.56ab | 45.00 ± 0.78ab | 41.55 ± 0.95b | 46.76 ± 0.31a | 46.52 ± 1.73ab | 44.27 ± 0.82ab | 42.86 ± 3.85ab | |
| LYS | 59.41 ± 4.07abc | 62.89 ± 0.39a | 58.31 ± 2.40abc | 61.09 ± 0.95ab | 54.70 ± 1.41c | 62.29 ± 0.54a | 63.16 ± 1.48a | 59.59 ± 0.35abc | 55.93 ± 4.03bc | |
| NEAA | ASP | 107.57 ± 7.38abc | 115.41 ± 0.94ab | 105.89 ± 4.55abc | 111.51 ± 1.34ab | 100.32 ± 2.67c | 113.71 ± 0.91ab | 116.70- ± 4.18a | 109.97 ± 0.47abc | 104.8 ± 7.74bc |
| HIS | 21.41 ± 1.37abc | 22.47 ± 0.69ab | 20.97 ± 0.82bc | 22.33 ± 0.06ab | 19.79 ± 0.42c | 22.53 ± 0.24ab | 23.19 ± 0.87a | 22.17 ± 0.15ab | 21.41 ± 1.51abc | |
| ARG | 68.40 ± 4.94abc | 71.96 ± 1.09ab | 66.79 ± 2.86abc | 70.41 ± 0.48ab | 63.13 ± 1.50ab | 71.34 ± 0.44ab | 72.59 ± 2.36a | 68.86 ± 0.72abc | 65.33 ± 4.43bc | |
| PRO | 30.77 ± 0.26d | 33.9 ± 0.63bcd | 31.11 ± 2.89cd | 35.08 ± 0.3abc | 30.09 ± 1.24d | 34.96 ± 0.77abc | 38.21 ± 2.79a | 36.52 ± 0.10ab | 36.52 ± 2.45ab | |
| CYS | 8.32 ± 0.30abc | 8.79 ± 0.66abc | 9.04 ± 0.69ab | 8.90 ± 0.40abc | 7.78 ± 0.18c | 8.76 ± 0.16abc | 9.45 ± 0.69a | 8.93 ± 0.34abc | 8.00 ± 0.21bc | |
| TYR | 27.72 ± 1.70bc | 29.43 ± 0.17ab | 27.85 ± 1.04bc | 29.74 ± 0.35ab | 26.47 ± 0.84c | 29.79 ± 0.25ab | 31.37 ± 1.36a | 30.28 ± 0.23ab | 29.13 ± 2.03abc | |
| SER | 39.40 ± 2.86bc | 42.88 ± 0.75abc | 39.20 ± 2.17bc | 42.95 ± 0.18abc | 37.73 ± 1.15c | 43.18 ± 0.30ab | 46.78 ± 2.95a | 43.29 ± 2.18ab | 42.15 ± 3.12abc | |
| GLU | 200.27 ± 14.25abc | 214.26 ± 1.55a | 197.65 ± 8.58abc | 208.47 ± 2.50ab | 186.66 ± 5.47c | 211.89 ± 1.48ab | 217.33 ± 6.60a | 205.66 ± 1.90abc | 192.45 ± 14.31bc | |
| GLY | 31.54 ± 2.27bc | 33.85 ± 0.19ab | 31.58 ± 1.07bc | 34.19 ± 0.19ab | 30.49 ± 1.07c | 34.15 ± 0.10ab | 36.06 ± 1.40a | 34.12 ± 0.30ab | 33.56 ± 2.21abc | |
| ALA | 34.42 ± 2.15bc | 36.86 ± 0.24ab | 34.46 ± 1.29bc | 36.09 ± 0.31abc | 33.12 ± 0.74c | 37.47 ± 0.02ab | 38.53 ± 1.77a | 36.20 ± 0.35abc | 35.55 ± 1.82abc | |
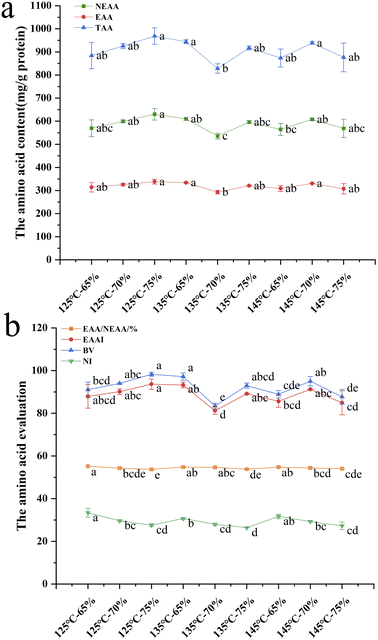
| TAA | 884.27 ± 56.83ab | 943.91 ± 8357a | 873.67 ± 38.8ab | 925.30 ± 11.02ab | 828.36 ± 20.30b | 938.45 ± 5.40a | 968.68 ± 35.52a | 916.83 ± 8.10ab | 876.47 ± 62.12ab | |
Table 5 shows the AAS and CS of the extrudates under different hydro-thermal parameters and the PHE + TYR of the extrudates showed the highest scores, which were 179.00–204.97 and 113.37–129.82, respectively. The AAS and CS of the amino acids were more than 100 except Met + Cys, which can be seen as the first limiting amino acid with the corresponding scores of 90.00–102.27 and 54.94–64.29, respectively. The result indicated that the extrusion parameters had no large effect on the first limiting amino acid of the SPI–surimi extrudates. At the same time, it showed that the amino acid composition of the extrudates could meet the recommended intake.41
| Amino acid evaluation (scores) | Hydro-thermal parameters | |||||||||
|---|---|---|---|---|---|---|---|---|---|---|
| 125 °C-65% | 135 °C-65% | 145 °C-65% | 125 °C-70% | 135 °C-70% | 145 °C-70% | 125 °C-75% | 135 °C-75% | 145 °C-75% | ||
| a Different letters in the same row mean significant differences (p < 0.05). | ||||||||||
| AAS | HIS | 142.72 ± 9.14abc | 149.82 ± 4.61ab | 139.78 ± 5.47bc | 148.85 ± 0.40ab | 131.95 ± 2.83c | 150.20 ± 1.63ab | 154.58 ± 5.82a | 147.75 ± 0.99ab | 142.72 ± 10.08abc |
| THR | 116.08 ± 7.93bcd | 125.89 ± 2.04abc | 115.71 ± 5.32cd | 126.71 ± 0.25abc | 111.85 ± 3.27d | 127.18 ± 0.81abc | 137.68 ± 8.95a | 129.55 ± 2.57ab | 127.46 ± 8.74abc | |
| LYS | 132.02 ± 9.06abc | 139.75 ± 0.86a | 129.57 ± 5.32abc | 135.75 ± 2.12ab | 121.56 ± 3.15c | 138.42 ± 1.19a | 140.35 ± 3.30a | 132.41 ± 0.76abc | 124.28 ± 8.97bc | |
| LEU | 131.07 ± 8.79ab | 138.90 ± 0.01a | 129.43 ± 6.66ab | 137.85 ± 2.16a | 123.45 ± 3.78b | 139.68 ± 2.21a | 143.19 ± 3.87a | 134.89 ± 0.33ab | 131.67 ± 9.5ab | |
| ILE | 127.43 ± 7.70abc | 134.8 ± 0.10ab | 125.21 ± 5.88bc | 133.62 ± 2.17ab | 118.43 ± 4.10c | 133.89 ± 0.83ab | 139.15 ± 5.57a | 132.97 ± 0.37ab | 127.77 ± 9.52abc | |
| MET + CYS | 95.05 ± 3.54abc | 100.91 ± 1.75a | 97.50 ± 1.74abc | 97.77 ± 0.30abc | 87.41 ± 1.30c | 98.64 ± 2.22ab | 102.27 ± 0.95a | 97.18 ± 1.21abc | 90.00 ± 3.49bc | |
| PHE + TYR | 187.79 ± 11.83ab | 201.03 ± 0.59a | 188.63 ± 6.83ab | 196.68 ± 2.95ab | 179.00 ± 4.72b | 201.45 ± 1.47a | 204.97 ± 8.13a | 196.18 ± 2.76ab | 189.45 ± 15.48ab | |
| VAL | 119.80 ± 8.48ab | 127.13 ± 0.32a | 117.58 ± 5.73ab | 122.37 ± 2.02ab | 111.00 ± 3.24b | 125.26 ± 0.34a | 125.87 ± 2.33a | 117.76 ± 0.57ab | 112.97 ± 7.31b | |
| TRP | 200.93 ± 8.70ab | 206.12 ± 11.38a | 176.10 ± 6.72cd | 184.85 ± 5.85bc | 171.04 ± 5.84cd | 181.97 ± 7.09bcd | 186.29 ± 4.88bc | 184.13 ± 13.7bcd | 163.89 ± 5.02d | |
| CS | THR | 66.75 ± 4.56bcd | 72.38 ± 1.17abc | 66.54 ± 3.06cd | 72.86 ± 0.14abc | 64.32 ± 1.87d | 73.13 ± 0.47abc | 79.17 ± 5.14a | 74.50 ± 1.48ab | 73.29 ± 5.02abc |
| LYS | 108.02 ± 7.42abc | 114.34 ± 0.70a | 106.02 ± 4.35abc | 111.07 ± 1.73ab | 99.46 ± 2.57c | 113.26 ± 0.97a | 114.84 ± 2.69a | 108.34 ± 0.63abc | 101.69 ± 7.33bc | |
| LEU | 107.40 ± 6.49ab | 113.62 ± 0.08a | 105.54 ± 4.96cd | 112.62 ± 1.82bc | 99.82 ± 3.46cd | 112.85 ± 0.70bcd | 117.29 ± 4.69abc | 112.07 ± 0.32bcd | 107.69 ± 8.03d | |
| ILE | 98.30 ± 6.59abc | 104.18 ± 0.01ab | 97.08 ± 5.00bc | 103.39 ± 1.62ab | 92.59 ± 2.84c | 104.76 ± 1.65ab | 107.40 ± 2.91a | 101.17 ± 0.24ab | 98.75 ± 7.13abc | |
| MET + CYS | 59.74 ± 2.23abc | 63.43 ± 1.10a | 61.29 ± 1.10abc | 61.46 ± 0.18abc | 54.94 ± 0.82c | 62.00 ± 1.40ab | 64.29 ± 0.59a | 61.09 ± 0.76abc | 56.57 ± 2.19bc | |
| PHE + TYR | 118.93 ± 4.37ab | 127.32 ± 0.65ab | 119.47 ± 5.54ab | 124.57 ± 2.42ab | 113.37 ± 5.58b | 127.58 ± 0.86ab | 129.82 ± 3.81a | 124.25 ± 3.02ab | 119.98 ± 10.85ab | |
| VAL | 91.10 ± 6.60ab | 96.61 ± 0.25a | 89.37 ± 4.46ab | 93.00 ± 1.58ab | 84.35 ± 2.53b | 95.19 ± 0.26a | 95.66 ± 1.82a | 89.51 ± 0.45ab | 85.86 ± 5.71b | |
| TRP | 120.56 ± 5.23ab | 123.67 ± 6.83a | 105.66 ± 4.03cd | 110.91 ± 3.51bc | 102.63 ± 3.50cd | 109.18 ± 4.26bcd | 111.77 ± 2.93abc | 110.47 ± 8.22bcd | 98.34 ± 3.01d | |
In Fig. 4, at a moisture content of 70% and extrusion temperature of 135 °C, the TAA, EAA, NEAA, EAAI and BV of the extrudates were significantly lower, and the EAA/NEAA values were between 53.71% and 55.18%, which could reach the reference values of 60% recommended by the FAO/WHO. At a certain temperature (125–145 °C), the EAA/NEAA and NI decreased dramatically as the moisture content increased from 65% to 75%. It indicated that at a certain temperature (125–145 °C), increasing moisture content could decrease the EAA/NEAA values slightly, and the amino acid pattern of the extrudates was also changed. Zahari et al.45 found that the amino acid pattern of the extrudates was more balanced at a moisture content of 65%. In this study, when the extrusion temperature was 125 °C, as the moisture content increased from 65% to 75%, the NEAA, EAA, TAA, EAAI and BV increased remarkably. At a moisture content of 75%, when the extrusion temperature increased from 125 °C to 145 °C, NEAA, EAA, TAA, EAAI and BV decreased dramatically, indicating that higher extrusion temperature would destroy the extrudates' amino acid pattern.46 It was further shown that the amino acid content and amino acid balance of the SPI–surimi extrudates could be improved by changing the extrusion parameters.
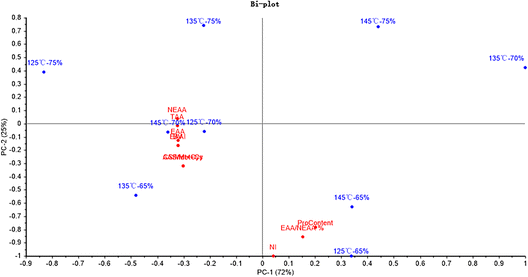
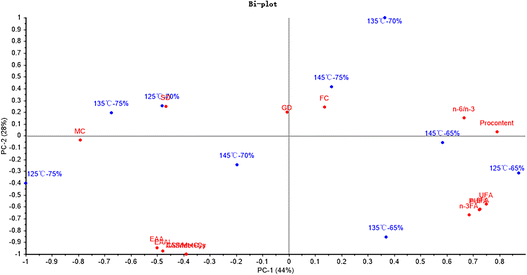
Fig. 5 shows that PC1 and PC2 could explain 72% and 25% of the total variance, respectively. Moreover, the NEAA and TAA were significantly related to the hydro-thermal combination parameters of 125 °C-75%. And the NI was significantly related to the hydro-thermal combined parameters of 125 °C-65%.
Fatty acid evaluation
![[thin space (1/6-em)]](https://www.rsc.org/images/entities/char_2009.gif) :
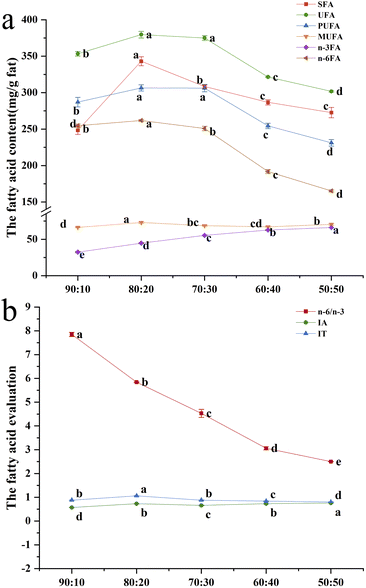
:![[thin space (1/6-em)]](https://www.rsc.org/images/entities/char_2009.gif) 20, and the lowest fatty acid was butyric acid (0.00–1.76 mg per g fat). It showed that the high-moisture extrusion processing had no significant effect on the most abundant fatty acids in the SPI–surimi extrudates. As the ratio of surimi increased from 10% to 50%, the eicosapentaenoic acid (EPA) of the extrudates increased significantly from 1.44 mg per g to 10.30 mg per g and the docosahexaenoic acid (DHA) content increased prominently from 6.44 mg g−1 to 41.12 mg g−1. This result was consistent with Jannat et al.47 who also found that the addition of surimi resulted in the increase of DPA and EHA, which further confirmed that the surimi enhanced the unsaturated fatty acids (UFA) of the alternative protein foods.48
20, and the lowest fatty acid was butyric acid (0.00–1.76 mg per g fat). It showed that the high-moisture extrusion processing had no significant effect on the most abundant fatty acids in the SPI–surimi extrudates. As the ratio of surimi increased from 10% to 50%, the eicosapentaenoic acid (EPA) of the extrudates increased significantly from 1.44 mg per g to 10.30 mg per g and the docosahexaenoic acid (DHA) content increased prominently from 6.44 mg g−1 to 41.12 mg g−1. This result was consistent with Jannat et al.47 who also found that the addition of surimi resulted in the increase of DPA and EHA, which further confirmed that the surimi enhanced the unsaturated fatty acids (UFA) of the alternative protein foods.48
| Fatty acid contents (mg per g fat) | SPI–surimi ratios | ||||||
|---|---|---|---|---|---|---|---|
90![[thin space (1/6-em)]](https://www.rsc.org/images/entities/char_2009.gif) : :![[thin space (1/6-em)]](https://www.rsc.org/images/entities/char_2009.gif) 10 10 |
80![[thin space (1/6-em)]](https://www.rsc.org/images/entities/char_2009.gif) : :![[thin space (1/6-em)]](https://www.rsc.org/images/entities/char_2009.gif) 20 20 |
70![[thin space (1/6-em)]](https://www.rsc.org/images/entities/char_2009.gif) : :![[thin space (1/6-em)]](https://www.rsc.org/images/entities/char_2009.gif) 30 30 |
60![[thin space (1/6-em)]](https://www.rsc.org/images/entities/char_2009.gif) : :![[thin space (1/6-em)]](https://www.rsc.org/images/entities/char_2009.gif) 40 40 |
50![[thin space (1/6-em)]](https://www.rsc.org/images/entities/char_2009.gif) : :![[thin space (1/6-em)]](https://www.rsc.org/images/entities/char_2009.gif) 50 50 |
|||
| a Different letters in the same row mean significant differences (p < 0.05). SFA denotes saturated fatty acids, UFA denotes unsaturated fatty acids, MUFA denotes monounsaturated fatty acids and PUFA denotes polyunsaturated fatty acids. n-3 and n-6 denote PUFA types. | |||||||
| C4:0 | SFA | Butyric acid | 0.00 ± 0.00c | 1.76 ± 0.31a | 1.20 ± 0.09b | 1.21 ± 0.07b | 0.00 ± 0.00c |
| C12:0 | SFA | Lauric acid | 3.69 ± 0a | 0.00 ± 0.00c | 0.00 ± 0.00c | 1.04 ± 0.03b | 1.01 ± 0.11b |
| C14:0 | SFA | Myristic acid | 3.57 ± 0.06d | 6.47 ± 0.53bc | 6.09 ± 0.71c | 7.79 ± 0.03ab | 9.18 ± 1.09a |
| C15:0 | SFA | Pentadecanoic acid | 1.04 ± 0.06c | 1.83 ± 0.24b | 2.11 ± 0.25b | 2.52 ± 0.02a | 2.76 ± 0.04a |
| C16:0 | SFA | Palmitic acid | 184.91 ± 3.22d | 251.37 ± 4.24a | 225.55 ± 2.74b | 202.32 ± 0.59c | 191.83 ± 11.24cd |
| C16:1n7 | MUFA | Palmitoleic acid | 2.08 ± 0.02d | 5.57 ± 0.57c | 6.89 ± 0.62b | 9.07 ± 0.37a | 10.38 ± 0.74a |
| C17:0 | SFA | Pearlescent fatty acid | 2.23 ± 0.06c | 3.68 ± 0.29b | 3.71 ± 0.05b | 4.41 ± 0.17a | 4.75 ± 0.28a |
| C18:0 | SFA | Stearic acid | 45.61 ± 0.35c | 67.08 ± 2.72a | 60.58 ± 1.01b | 58.13 ± 0.74b | 55.79 ± 3.64b |
| C18:1n9c | MUFA | Oleic acid | 64.35 ± 0.56ab | 67.55 ± 4.25a | 61.94 ± 1.27ab | 58.05 ± 0.74b | 60.26 ± 5.51ab |
| C18:2n6c | PUFA n-6 | Linoleic acid | 253.4 ± 5.56ab | 259.25 ± 2.36a | 246.28 ± 0.95b | 184.92 ± 0.67c | 157.18 ± 6.87d |
| C20:0 | SFA | Arachidonic acid | 1.34 ± 0.10b | 1.49 ± 0.28ab | 1.67 ± 0.53ab | 2.10 ± 0.27ab | 2.23 ± 0.25a |
| C18:3n3 | PUFA n-3 | Alpha-linolenic acid | 24.56 ± 0.80a | 21.73 ± 0.10b | 22.70 ± 0.06b | 16.02 ± 0.01c | 14.66 ± 0.67d |
| C22:0 | SFA | Behenic acid | 3.38 ± 0.25b | 5.29 ± 0.08a | 4.47 ± 0.42a | 4.31 ± 0.17ab | 3.24 ± 0.77b |
| C20:4n6 | PUFA n-6 | Arachidonic acid | 1.17 ± 0.24d | 2.58 ± 0.65c | 4.61 ± 0.97b | 6.85 ± 0.24a | 8.02 ± 0.31a |
| C24:0 | SFA | Lignocarboxylic acid | 3.52 ± 0.04bc | 4.55 ± 0.71a | 3.70 ± 0.15ab | 3.21 ± 0.10bc | 2.78 ± 0.29c |
| C20:5n3 | PUFA n-3 | EPA | 1.44 ± 0.37e | 4.62 ± 0.10d | 6.17 ± 0.14c | 9.24 ± 0.38b | 10.30 ± 0.45a |
| C22:6n3 | PUFA n-3 | DHA | 6.44 ± 0.07e | 18.47 ± 0.57d | 26.51 ± 2.04c | 37.40 ± 1.26b | 41.12 ± 1.62a |
As can be seen in Fig. 6, at a SPI–surimi ratio of 80![[thin space (1/6-em)]](https://www.rsc.org/images/entities/char_2009.gif) :
:![[thin space (1/6-em)]](https://www.rsc.org/images/entities/char_2009.gif) 20, the extrudate showed the highest saturated fatty acid (SFA), unsaturated fatty acid (UFA), monounsaturated fatty acid (MUFA), polyunsaturated fatty acid (PUFA), n-6 fatty acid (n-6FA) contents and the highest IT values. Meanwhile, at a SPI–surimi ratio of 50
20, the extrudate showed the highest saturated fatty acid (SFA), unsaturated fatty acid (UFA), monounsaturated fatty acid (MUFA), polyunsaturated fatty acid (PUFA), n-6 fatty acid (n-6FA) contents and the highest IT values. Meanwhile, at a SPI–surimi ratio of 50![[thin space (1/6-em)]](https://www.rsc.org/images/entities/char_2009.gif) :
:![[thin space (1/6-em)]](https://www.rsc.org/images/entities/char_2009.gif) 50, the n-6FA, UFA and PUFA contents were the lowest and the IA values were the highest. Moreover, the n-6 fatty acid content/n-3 fatty acid content (n-6/n-3) values gradually decreased as the surimi content increased from 10% to 50%, and it might be related to the increasing n-3 fatty acid content from 32.44 mg g−1 to 66.08 mg g−1, indicating the enhanced ability of extrudates to prevent chronic diseases. The above results indicated that the fatty acid levels were the highest and the antioxidant properties of extrudates increased significantly when at a SPI–surimi ratio of 80
50, the n-6FA, UFA and PUFA contents were the lowest and the IA values were the highest. Moreover, the n-6 fatty acid content/n-3 fatty acid content (n-6/n-3) values gradually decreased as the surimi content increased from 10% to 50%, and it might be related to the increasing n-3 fatty acid content from 32.44 mg g−1 to 66.08 mg g−1, indicating the enhanced ability of extrudates to prevent chronic diseases. The above results indicated that the fatty acid levels were the highest and the antioxidant properties of extrudates increased significantly when at a SPI–surimi ratio of 80![[thin space (1/6-em)]](https://www.rsc.org/images/entities/char_2009.gif) :
:![[thin space (1/6-em)]](https://www.rsc.org/images/entities/char_2009.gif) 20 during the high-moisture extrusion processing.49
20 during the high-moisture extrusion processing.49
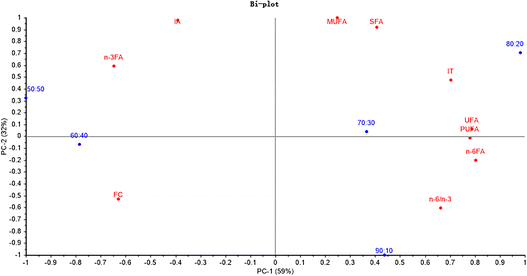
Fig. 7 shows that PC1 and PC2 could explain 59% and 32% of the total variance, respectively. The SFA, UFA, PUFA, MUFA and IT were significantly related to the ratio of 80![[thin space (1/6-em)]](https://www.rsc.org/images/entities/char_2009.gif) :
:![[thin space (1/6-em)]](https://www.rsc.org/images/entities/char_2009.gif) 20. Additionally, the n-6/n-3 was positively related to the ratio of 90
20. Additionally, the n-6/n-3 was positively related to the ratio of 90![[thin space (1/6-em)]](https://www.rsc.org/images/entities/char_2009.gif) :
:![[thin space (1/6-em)]](https://www.rsc.org/images/entities/char_2009.gif) 10.
10.
| Fatty acid contents (mg per g fat) | Hydro-thermal parameters | ||||||||||
|---|---|---|---|---|---|---|---|---|---|---|---|
| 125 °C-65% | 135 °C-65% | 145 °C-65% | 125 °C-70% | 135 °C-70% | 145 °C-70% | 125 °C-75% | 135 °C-75% | 145 °C-75% | |||
| a Different letters in the same row mean significant differences (p < 0.05). SFA denotes saturated fatty acids, UFA denotes unsaturated fatty acids, MUFA denotes monounsaturated fatty acids and PUFA denotes polyunsaturated fatty acids. n-3 and n-6 denote PUFA types. | |||||||||||
| C4:0 | SFA | Butyric acid | 1.19 ± 0.08b | 1.2 ± 0.05b | 1.15 ± 0.20b | 0.95 ± 0.10b | 0.00 ± 0.00c | 0.00 ± 0.00c | 0.00 ± 0.00c | 0.00 ± 0.00c | 1.50 ± 0.25a |
| C12:0 | SFA | Lauric acid | 1.64 ± 0.03a | 1.44 ± 0.58a | 1.42 ± 0.49a | 0.94 ± 0.14a | 1.12 ± 0.42a | 0.88 ± 0.04a | 0.00 ± 0.00b | 1.26 ± 0.14a | 1.39 ± 0.29a |
| C14:0 | SFA | Myristic acid | 10.33 ± 0.20a | 9.80 ± 3.99ab | 7.98 ± 1.51abc | 5.72 ± 0.29c | 6.83 ± 0.79abc | 7.22 ± 1.19abc | 4.64 ± 0.17c | 6.29 ± 0.48bc | 7.29 ± 0.59abc |
| C15:0 | SFA | Pentadecanoic acid | 1.78 ± 0.22a | 1.57 ± 0.23ab | 1.39 ± 0.41abc | 1.00 ± 0.04c | 1.18 ± 0.06bc | 1.09 ± 0.08bc | 1.10 ± 0.10bc | 1.05 ± 0.29bc | 1.40 ± 0.08abc |
| C16:0 | SFA | Palmitic acid | 284.01 ± 4.68a | 280.80 ± 4.32a | 253.63 ± 2.36b | 157.20 ± 3.47f | 203.92 ± 0.07d | 215.78 ± 8.86c | 175.73 ± 0.49e | 177.10 ± 4.96e | 221.47 ± 0.91c |
| C16:1n7 | MUFA | Palmitoleic acid | 3.54 ± 0.16ab | 3.72 ± 0.92a | 3.39 ± 0.29ab | 2.21 ± 0.26cd | 2.69 ± 0.11bcd | 2.69 ± 0.15bcd | 2.16 ± 0.11d | 2.37 ± 0.17cd | 3.05 ± 0.10abc |
| C17:0 | SFA | Pearlescent fatty acid | 3.32 ± 0.15a | 3.23 ± 0.08ab | 3.02 ± 0.08b | 1.74 ± 0.12d | 2.30 ± 0.09c | 2.31 ± 0.14c | 1.90 ± 0.15d | 1.90 ± 0.14d | 2.51 ± 0.02c |
| C18:0 | SFA | Stearic acid | 75.26 ± 0.61a | 72.31 ± 1.25a | 67.65 ± 0.91b | 39.82 ± 1.02f | 51.58 ± 1.17d | 53.54 ± 2.24d | 43.36 ± 0.14e | 44.82 ± 1.48e | 57.23 ± 1.64c |
| C18:1n9c | MUFA | Oleic acid | 102.09 ± 1.24a | 96.35 ± 1.83b | 88.85 ± 1.04c | 60.37 ± 1.80f | 76.52 ± 1.30e | 77.16 ± 2.97de | 58.43 ± 0.44f | 62.00 ± 2.72f | 81.34 ± 1.38d |
| C18:2n6c | PUFA n-6 | Linoleic acid | 305.84 ± 4.45a | 308.46 ± 9.05a | 276.19 ± 8.92b | 176.89 ± 0.45e | 227.69 ± 4.79c | 238.82 ± 3.83c | 206.75 ± 0.02d | 199.34 ± 10.28d | 241.15 ± 3.22c |
| C20:0 | SFA | Arachidonic acid | 2.14 ± 0.03a | 1.81 ± 0.43abc | 2.08 ± 0.44ab | 0.00 ± 0.00e | 1.14 ± 0.11d | 1.53 ± 0.20cd | 1.35 ± 0.15cd | 0.00 ± 0.00e | 1.59 ± 0.03bcd |
| C18:3n3 | PUFA n-3 | Alpha-linolenic acid | 27.09 ± 0.28a | 26.95 ± 0.87a | 24.61 ± 0.98b | 15.96 ± 0.17f | 19.95 ± 0.51cd | 20.90 ± 0.76c | 18.39 ± 0.28de | 17.39 ± 1.11ef | 21.01 ± 0.24c |
| C22:0 | SFA | Behenic acid | 5.79 ± 0.18a | 5.86 ± 0.55a | 4.75 ± 0.53ab | 2.11 ± 0.10e | 3.47 ± 0.33cd | 3.89 ± 0.51bc | 2.40 ± 0.03de | 2.61 ± 1.07de | 3.91 ± 0.06bc |
| C20:4n6 | PUFA n-6 | Arachidonic acid | 2.58 ± 0.42abc | 3.45 ± 0.10a | 2.88 ± 0.67ab | 1.90 ± 0.16bc | 2.02 ± 0.33bc | 2.21 ± 0.38bc | 1.82 ± 0.72bc | 1.59 ± 0.34c | 2.47 ± 0.16abc |
| C24:0 | SFA | Lignocarboxylic acid | 5.30 ± 0.45a | 5.25 ± 0.12ab | 4.72 ± 0.05b | 2.46 ± 0.00e | 3.32 ± 0.16cd | 3.71 ± 0.26c | 2.95 ± 0.12de | 2.63 ± 0.22e | 3.40 ± 0.23cd |
| C20:5n3 | PUFA n-3 | EPA | 2.06 ± 0.05ab | 2.21 ± 0.42a | 1.82 ± 0.03ab | 1.17 ± 0.29c | 1.52 ± 0.05bc | 1.62 ± 0.24abc | 1.82 ± 0.07ab | 1.51 ± 0.27bc | 1.71 ± 0.28abc |
| C22:6n3 | PUFA n-3 | DHA | 16.47 ± 0.06ab | 16.74 ± 1.22a | 15.11 ± 0.48bc | 9.61 ± 0.18g | 12.32 ± 0.74ef | 13.48 ± 0.12de | 13.17 ± 0.87def | 11.67 ± 0.46f | 14.37 ± 0.58cd |
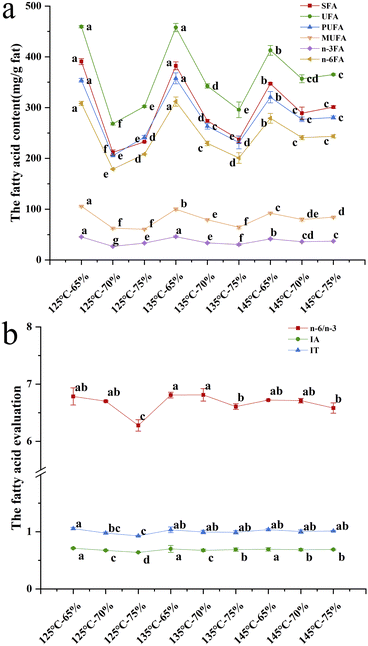
As shown in Fig. 8, when the extrusion temperature was constant, the six different fatty acid contents (SFA, UFA, MUFA, PUFA, n-3FA, and n-6FA) and two indicators (n-6/n-3 and IT values) both decreased dramatically as the moisture content increased from 65% to 75%. Azam et al.51 reported the effect of low moisture on the nutritional properties of the extrudates, which was positive for increasing the various fatty acids. When the moisture content was 65%, the increasing extrusion temperature could lead to less fatty acid contents. It might be caused by lipid oxidation and thermal decomposition according to a study.50 Wang et al.52 also reported that fatty acids were broken down due to the action of high temperature, high pressure and high shear. It is generally believed that fatty acids can form complexes with carbohydrates and proteins in the extrusion process.53 Interestingly, at higher moisture contents (70–75%), increasing extrusion temperature (from 125 °C to 145 °C) enhanced the fatty acid contents due to inactivation of fatty acid hydrolases.31
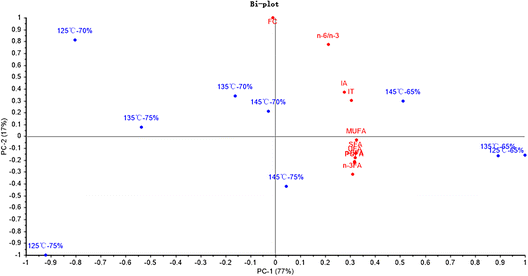
Fig. 9 shows that PC1 and PC2 could explain 77% and 17% of the total variance, respectively. The SFA, UFA, PUFA n-3FA and n-6FA were significantly irrelated to the hydro-thermal combined parameters of 125 °C-70%. Moreover, the n-6/n-3, IA and IT were dramatically irrelated to the hydro-thermal combined parameters of 125 °C-75%.
In vitro digestibility
![[thin space (1/6-em)]](https://www.rsc.org/images/entities/char_2009.gif) :
:![[thin space (1/6-em)]](https://www.rsc.org/images/entities/char_2009.gif) 30, the GD value was the lowest, which should be considered as the turning point of the mixed protein ratios for gastric digestion. This might be related to higher gel strength at this ratio according to our previous study.8 Furthermore, the vegetable ingredients of plant-based meat significantly reduced the number of gastric parietal cells and pepsin activity.54 An enzyme activity test also confirmed that the plant-based meat significantly decreased pepsin activity but increased trypsin activity.55 Moreover, the increased surimi content could lead to an increase in chain proteins, which promoted the contact between the pepsin and binding points. In terms of small intestinal digestibility (SD), the highest SD was 93.07% at a SPI–surimi ratio of 70
30, the GD value was the lowest, which should be considered as the turning point of the mixed protein ratios for gastric digestion. This might be related to higher gel strength at this ratio according to our previous study.8 Furthermore, the vegetable ingredients of plant-based meat significantly reduced the number of gastric parietal cells and pepsin activity.54 An enzyme activity test also confirmed that the plant-based meat significantly decreased pepsin activity but increased trypsin activity.55 Moreover, the increased surimi content could lead to an increase in chain proteins, which promoted the contact between the pepsin and binding points. In terms of small intestinal digestibility (SD), the highest SD was 93.07% at a SPI–surimi ratio of 70![[thin space (1/6-em)]](https://www.rsc.org/images/entities/char_2009.gif) :
:![[thin space (1/6-em)]](https://www.rsc.org/images/entities/char_2009.gif) 30. It was perhaps related to the increase of the surimi content and the increase of the intestinal pepsin activity according to a previous study.54 The lowest SD was only 12.16% with 40% surimi addition and further research should be necessary.
30. It was perhaps related to the increase of the surimi content and the increase of the intestinal pepsin activity according to a previous study.54 The lowest SD was only 12.16% with 40% surimi addition and further research should be necessary.
Comprehensive nutritional evaluation of SPI–surimi extrudates
![[thin space (1/6-em)]](https://www.rsc.org/images/entities/char_2009.gif) :
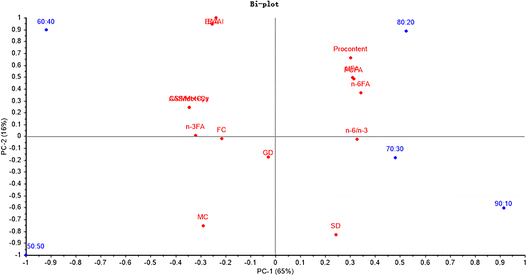
:![[thin space (1/6-em)]](https://www.rsc.org/images/entities/char_2009.gif) 20 was in the first quadrant, mainly influenced by AC, PUFA, UFA, and n-6FA on comprehensive nutritional quality evaluation. The ratio of 60
20 was in the first quadrant, mainly influenced by AC, PUFA, UFA, and n-6FA on comprehensive nutritional quality evaluation. The ratio of 60![[thin space (1/6-em)]](https://www.rsc.org/images/entities/char_2009.gif) :
:![[thin space (1/6-em)]](https://www.rsc.org/images/entities/char_2009.gif) 40 was distributed in the second quadrant, mainly influenced by EAA, EAAI, AAS (Met + Cys), CS (Met + Cys), and n-3FA. The ratio of 50
40 was distributed in the second quadrant, mainly influenced by EAA, EAAI, AAS (Met + Cys), CS (Met + Cys), and n-3FA. The ratio of 50![[thin space (1/6-em)]](https://www.rsc.org/images/entities/char_2009.gif) :
:![[thin space (1/6-em)]](https://www.rsc.org/images/entities/char_2009.gif) 50 was in the third quadrant, mainly influenced by MC, GD and FC, and the ratios of 90
50 was in the third quadrant, mainly influenced by MC, GD and FC, and the ratios of 90![[thin space (1/6-em)]](https://www.rsc.org/images/entities/char_2009.gif) :
:![[thin space (1/6-em)]](https://www.rsc.org/images/entities/char_2009.gif) 10 and 70
10 and 70![[thin space (1/6-em)]](https://www.rsc.org/images/entities/char_2009.gif) :
:![[thin space (1/6-em)]](https://www.rsc.org/images/entities/char_2009.gif) 30 were in the fourth quadrant, mainly influenced by SD and n-6/n-3.
30 were in the fourth quadrant, mainly influenced by SD and n-6/n-3.
Conclusions
When the surimi content increased from 10% to 50%, the AAS significantly increased from 88.82 to 109.50. Furthermore, the EPA and DHA levels in the extrudates increased notably, going from 1.44 mg g−1 to 10.30 mg g−1 and from 6.44 mg g−1 to 41.22 mg g−1, respectively. These findings suggest that surimi plays a crucial role in improving both amino acid and fatty acid contents in high-moisture extrudates derived from SPI and surimi. Additionally, when the moisture content reached 75%, elevating the extrusion temperature from 125 °C to 145 °C resulted in a significant decrease in the essential amino acid content. In a certain extrusion temperature range (125–145 °C), the EPA and DHA contents of the extrudates decreased substantially as the moisture content increased from 65% to 75%. It was found that higher extrusion temperature and increased moisture content disrupted the amino acid patterns in the extrudates, while simultaneously enhancing certain fatty acid levels. Conversely, a lower extrusion temperature (125 °C) and lower moisture content (65%) contributed to higher EPA and DHA levels. During the high-moisture processing, with an SPI–surimi ratio of 70![[thin space (1/6-em)]](https://www.rsc.org/images/entities/char_2009.gif) :
:![[thin space (1/6-em)]](https://www.rsc.org/images/entities/char_2009.gif) 30, the lowest GD was 24.63%, while the highest SD reached 93.07%. Higher moisture levels (70% and 75%) were associated with greater SD, and increasing the temperature at a lower moisture content (60%) or increasing moisture content at a lower temperature (125 °C) leads to an obvious increase in GD during high-moisture extrusion processing.
30, the lowest GD was 24.63%, while the highest SD reached 93.07%. Higher moisture levels (70% and 75%) were associated with greater SD, and increasing the temperature at a lower moisture content (60%) or increasing moisture content at a lower temperature (125 °C) leads to an obvious increase in GD during high-moisture extrusion processing.
Author contributions
Anna Hu: investigation, validation, formal analysis, and writing – original draft. Yujie Zhang: methodology, investigation, data curation, and writing – original draft. Jinchuang Zhang: conceptualization, methodology, formal analysis, writing – review & editing, and supervision. Tongqing Li: visualization and validation. Zhaojun Wang: writing – review & editing and supervision. Qiang Wang: funding acquisition and supervision.Conflicts of interest
There are no conflicts to declare.Acknowledgements
This research was supported by the National Key Research and Development Plan of China (2021YFC2101402), the Young Elite Scientist Sponsorship Program by CAST (YESS20220162), the Science and Technology Innovation Project of Chinese Academy of Agricultural Sciences (CAAS-ASTIP-Q2022-IFST-05), and the earmarked fund for China Agriculture Research System (CARS-13).References
- N. R. Rubio, N. Xiang and D. L. Kaplan, Nat. Commun., 2020, 11, 6276 CrossRef CAS PubMed.
- J. L. Banach, J. P. van der Berg, G. Kleter, H. van Bokhorst-van de Veen, S. Bastiaan-Net, L. Pouvreau and E. D. van Asselt, Crit. Rev. Food Sci. Nutr., 2022, 1–18, DOI:10.1080/10408398.2022.2089625.
- D. M. Otero, G. da Rocha Lemos Mendes, A. J. da Silva Lucas, A. Christ-Ribeiro and C. D. F. Ribeiro, Food Chem., 2022, 394, 133486 CrossRef CAS PubMed.
- N. A. Rust, L. Ridding, C. Ward, B. Clark, L. Kehoe, M. Dora, M. J. Whittingham, P. McGowan, A. Chaudhary, C. J. Reynolds, C. Trivedy and N. West, Sci. Total Environ., 2020, 718, 137208 CrossRef CAS PubMed.
- J. Zhang, Z. Meng, Q. Cheng, Q. Li, Y. Zhang, L. Liu, A. Shi and Q. Wang, J. Integr. Agric., 2022, 21, 2435–2444 CrossRef.
- J. Zhang, L. Liu, Y. Jiang, S. Faisal, L. Wei, C. Cao, W. Yan and Q. Wang, J. Agric. Food Chem., 2019, 67, 10713–10725 CrossRef CAS PubMed.
- J. Zhang, Q. Chen, D. L. Kaplan and Q. Wang, Trends Food Sci. Technol., 2022, 128, 202–216 CrossRef CAS.
- Y. Zhang, J. Zhang, Q. Chen, N. He and Q. Wang, Foods, 2022, 11, 1397 CrossRef CAS PubMed.
- Q. Chen, J. Zhang, Y. Zhang, S. Meng and Q. Wang, Food Hydrocolloids, 2021, 117, 106732 CrossRef CAS.
- Y. Luo, H. Shen, D. Pan and G. Bu, Food Hydrocolloids, 2008, 22, 1513–1519 CrossRef CAS.
- Z. Wang, J. Liang, L. Jiang, Y. Li, J. Wang, H. Zhang, D. Li, F. Han, Q. Li, R. Wang, B. Qi and X. Sui, CyTA--J. Food, 2015, 1–8 Search PubMed.
- A. C. Alves and G. M. Tavares, Food Hydrocolloids, 2019, 97, 105171 CrossRef CAS.
- N. Shaheen, S. Islam, S. Munmun, M. Mohiduzzaman and T. Longvah, Food Chem., 2016, 213, 83–89 CrossRef CAS PubMed.
- C. Wu, T. Wang, C. Ren, W. Ma, D. Wu, X. Xu, L. S. Wang and M. Du, Compr. Rev. Food Sci. Food Saf., 2021, 20, 627–651 CrossRef CAS PubMed.
- A. J. Borderías, C. A. Tovar, F. Domínguez-Timón, M. T. Díaz, M. M. Pedrosa and H. M. Moreno, Food Hydrocolloids, 2020, 107, 105976 CrossRef.
- J. Jose, L. Pouvreau and A. H. Martin, Food Hydrocolloids, 2016, 60, 216–224 CrossRef CAS.
- T. He, B. Mo, J. Huang, D. Fan, W. Zhang, L. Wang, J. Zhao, W. Chen and H. Zhang, Food Sci. Technol. Res., 2014, 20, 517–527 CrossRef CAS.
- S. Kaur, S. Sharma, B. Singh and B. N. Dar, J. Food Sci. Technol., 2015, 52, 1670–1676 CrossRef CAS PubMed.
- Q. Ai and X. Xie, J. World Aquacult. Soc., 2005, 36, 498–507 CrossRef.
- S. Singh, L. Wakeling and S. Gamlath, J. Agric. Food Chem., 2007, 55, 8779–8786 CrossRef CAS PubMed.
- H. Zhu, H. Tang, Y. Cheng, Z. Li and L. Tong, Lebensm.-Wiss. Technol., 2021, 148, 111702 CrossRef CAS.
- S. Xie, Z. Wang, Z. He, M. Zeng, F. Qin, B. Adhikari and J. Chen, J. Integr. Agric., 2023, 22, 1590–1602 CrossRef CAS.
- J. Zhang, L. Liu, Y. Jiang, F. Shah, Y. Xu and Q. Wang, Food Hydrocolloids, 2020, 99, 105311 CrossRef CAS.
- J. Guo, L. Hu, X.-Q. Yang, S.-J. Yu, Y.-C. Liu and Y.-C. Jin, J. Am. Oil Chem. Soc., 2015, 92, 523–531 CrossRef CAS.
- E. M. Schmid, A. Farahnaky, B. Adhikari and P. J. Torley, Compr. Rev. Food Sci. Food Saf., 2022, 21, 4573–4609 CrossRef CAS PubMed.
- J. C. Cheftel, M. Kitagawa and C. Quéguiner, Food Rev. Int., 1992, 8, 235–275 CrossRef CAS.
- Y. Lin, K. Chen, D. Tu, X. Yu, Z. Dai and Q. Shen, Lebensm.-Wiss. Technol., 2019, 102, 106–112 CrossRef CAS.
- K. Pudtikajorn, T. Sae-leaw, N. Buamard, A. Zhou, L. Ma and S. Benjakul, Int. J. Food Sci. Technol., 2022, 57, 6711–6721 CrossRef CAS.
- M. Sorensen, T. Storebakken and K. D. Shearer, Aquacult. Nutr., 2005, 11, 251–256 CrossRef.
- E. Delgado, D. J. Valles-Rosales, N. C. Flores and D. Reyes-Jáquez, Aquac. Rep., 2021, 19, 100588 CrossRef.
- M. E. Camire, A. Camire and K. Krumhar, Crit. Rev. Food Sci. Nutr., 1990, 29, 35–57 CrossRef CAS PubMed.
- F. Joint and W. H. Organization, Protein and Amino Acid Requirements in Human Nutrition: Report of a Joint FAO/WHO/UNU Expert Consultation, World Health Organization, 2007 Search PubMed.
- B. L. Oser, J. Am. Diet. Assoc., 1951, 27, 396–402 CrossRef CAS PubMed.
- H. N. Nadeesha Dilrukshi, D. D. Torrico, M. A. Brennan and C. S. Brennan, Food Chem., 2022, 389, 133107 CrossRef CAS PubMed.
- A. S. Sandberg, H. Andersson, B. Kivisto and B. Sandstrom, Br. J. Nutr., 1986, 55, 245–254 CrossRef CAS PubMed.
- T. Ulbricht and D. Southgate, Lancet, 1991, 338, 985–992 CrossRef CAS PubMed.
- O. M. Akusu, D. B. Kiin-Kabari and E. M. Isah, J. Agric Sci. Food Technol., 2020, 6, 44–50 Search PubMed.
- J. Liu, Y. Hu, H. Wei and W. Shi, Int. J. Food Sci. Technol., 2022, 57, 2487–2497 CrossRef CAS.
- A. Aberoumand and F. Baesi, J. Aquat. Food Prod. Technol., 2021, 30, 315–322 CrossRef CAS.
- G. J. Hughes, D. J. Ryan, R. Mukherjea and C. S. Schasteen, J. Agric. Food Chem., 2011, 59, 12707–12712 CrossRef CAS PubMed.
- H. Mokrane, H. Amoura, N. Belhaneche-Bensemra, C. M. Courtin, J. A. Delcour and B. Nadjemi, Food Chem., 2010, 121, 719–723 CrossRef CAS.
- M. O. Iwe, D. J. van Zuilichem, P. O. Ngoddy and W. Lammers, LWT--Food Sci. Technol., 2001, 34, 71–75 CrossRef CAS.
- S. D. Hood-Niefer and R. T. Tyler, Food Res. Int., 2010, 43, 659–663 CrossRef CAS.
- J. Csapó, E. Varga-Visi, K. Loki, C. Albert and S. Salamon, Amino Acids, 2008, 34, 287–292 CrossRef PubMed.
- I. Zahari, F. Ferawati, J. K. Purhagen, M. Rayner, C. Ahlstrom, A. Helstad and K. Ostbring, Foods, 2021, 10, 2397 CrossRef CAS PubMed.
- C. Lankhorst, Q. D. Tran, R. Havenaar, W. H. Hendriks and A. F. B. van der Poel, Anim. Feed Sci. Technol., 2007, 138, 285–297 CrossRef CAS.
- H. Jannat-Alipour, M. Rezaei, B. Shabanpour and M. Tabarsa, J. Appl. Phycol., 2019, 31, 2529–2539 CrossRef CAS.
- J. A. Ramírez, N. R. Rodríguez, R. M. Uresti, G. Velazquez and M. Vázquez, Food Hydrocolloids, 2007, 21, 527–536 CrossRef.
- C. Panda, S. Varadharaj and V. S. Voruganti, Prostaglandins, Leukotrienes Essent. Fatty Acids, 2022, 176, 102377 CrossRef CAS PubMed.
- D. Čolović, R. Čolović, N. Spasevski, B. Ikonić, C. Dragomir, V. Banjac and O. Đuragić, Arch. Zootech., 2015, 8, 5–14 Search PubMed.
- M. Azam and M. Singh, Green Farming, 2020, 11, 240 CrossRef.
- Q. Wang, K. Sivakumar and S. Mohanasundaram, Int. J. Syst. Assur. Eng. Manag., 2021, 13, 364–374 CrossRef.
- T. De Pilli and O. Alessandrino, Crit. Rev. Food Sci. Nutr., 2020, 60, 556–565 CrossRef CAS PubMed.
- Y. Xie, L. Cai, Z. Huang, K. Shan, X. Xu, G. Zhou and C. Li, J. Agric. Food Chem., 2022, 70, 12442–12455 CrossRef CAS PubMed.
- Y. Xie, L. Cai, D. Zhao, H. Liu, X. Xu, G. Zhou and C. Li, Food Chem., 2022, 387, 132917 CrossRef CAS PubMed.
- A. Schuchert-Shi and P. C. Hauser, Anal. Biochem., 2009, 387, 202–207 CrossRef CAS PubMed.
Footnote |
| † Equal contribution. |
| This journal is © The Royal Society of Chemistry 2024 |

