
 Open Access Article
 This Open Access Article is licensed under a Creative Commons Attribution-Non Commercial 3.0 Unported Licence
Probing the active sites of oxide encapsulated electrocatalysts with controllable oxygen evolution selectivity†
William D. H.
Stinson
a,
Robert S.
Stinson
a,
Jingjing
Jin
a,
Zejie
Chen
 b,
Mingjie
Xu
c,
Fikret
Aydin
d,
Yinxian
Wang
a,
Marcos F.
Calegari Andrade
d,
Xiaoqing
Pan
cef,
Tuan Anh
Pham
d,
Katherine E.
Hurst
g,
Tadashi
Ogitsu
d,
Shane
Ardo
beh and
Daniel V.
Esposito
*a
b,
Mingjie
Xu
c,
Fikret
Aydin
d,
Yinxian
Wang
a,
Marcos F.
Calegari Andrade
d,
Xiaoqing
Pan
cef,
Tuan Anh
Pham
d,
Katherine E.
Hurst
g,
Tadashi
Ogitsu
d,
Shane
Ardo
beh and
Daniel V.
Esposito
*a
aDepartment of Chemical Engineering, Columbia Electrochemical Engineering Center, Lenfest Center for Sustainable Energy Columbia University in the City of New York, New York, NY 10027, USA. E-mail: de2300@columbia.edu
bDepartment of Chemistry, University of California, Irvine, California 92697, USA
cIrvine Materials Research Institute (IMRI), University of California, Irvine, 92697, USA
dMaterials Science Division, Lawrence Livermore National Laboratory, Livermore, California 94550, USA
eDepartment of Materials Science and Engineering, University of California, Irvine, California 92697, USA
fDepartment of Physics and Astronomy, University of California, Irvine, California 92697, USA
gEnergy Conversion and Storage Systems Center National Renewable Energy Laboratory, Golden, CO 80401, USA
hDepartment of Chemistry and Biomolecular Engineering, University of California, Irvine, California 92697, USA
First published on 17th April 2024
Abstract
Electrocatalysts encapsulated by nanoscopic overlayers can control the rate of redox reactions at the outer surface of the overlayer or at the buried interface between the overlayer and the active catalyst, leading to complex behavior in the presence of two competing electrochemical reactions. This study investigated oxide encapsulated electrocatalysts (OECs) comprised of iridium (Ir) thin films coated with an ultrathin (2–10 nm thick) silicon oxide (SiOx) or titanium oxide (TiOx) overlayer. The performance of SiOx|Ir and TiOx|Ir thin film electrodes towards the oxygen evolution reaction (OER) and Fe(II)/Fe(III) redox reactions were evaluated. An improvement in selectivity towards the OER was observed for all OECs. Overlayer properties, namely ionic and electronic conductivity, were assessed using a combination of electroanalytical methods and molecular dynamics simulations. SiOx and TiOx overlayers were found to be permeable to H2O and O2 such that the OER can occur at the MOx|Ir (M = Ti, Si) buried interface, which was further supported with molecular dynamics simulations of model SiO2 coatings. In contrast, Fe(II)/Fe(III) redox reactions occur to the same degree with TiOx overlayers having thicknesses less than 4 nm as bare electrocatalyst, while SiOx overlayers inhibit redox reactions at all thicknesses. This observation is attributed to differences in electronic transport between the buried interface and outer overlayer surface, as measured with through-plane conductivity measurements of wetted overlayer materials. These findings reveal the influence of oxide overlayer properties on the activity and selectivity of OECs and suggest opportunities to tune these properties for a wide range of electrochemical reactions.
Broader contextThe need for high performance electrocatalysts represents a significant barrier to the widespread implementation of renewable energy technologies like electrolyzers, fuel cells, and photocatalytic reactors. These electrocatalysts will typically need to be highly selective towards formation of the product(s) of interest, withstand thousands of hours of operation, and be capable of operating at high current densities with minimal kinetic losses. Towards this end, encapsulating active electrocatalysts with semi-permeable, nanoscopic oxide overlayers is a promising approach to modulate the local microenvironment of conventional electrocatalyst materials in ways that inhibit degradation mechanisms, improve catalytic activity, and/or enhance redox selectivity. Using silicon and titanium oxide nanocoatings as a case study, the current study explains how the electrical and species transport properties of oxide overlayers coated on state-of-the-art iridium oxygen evolution electrocatalysts strongly influences the rates of reactions occurring on the outer surface of the overlayer relative to reactions at the overlayer/catalyst buried interface. |
I. Introduction
The need for high performance electrocatalysts represents a significant barrier to the widespread implementation of renewable energy technologies.1 One promising approach to improve electrocatalyst performance is to encapsulate the active catalyst with a semi-permeable oxide overlayer.2 Such oxide encapsulated electrocatalysts (OECs) offer several potential advantages over traditional electrocatalysts, including increased stability,3–5 tolerance to catalyst poisons,6 improved activity,7,8 and enhanced selectivity.9–12 Studies of encapsulated electrocatalysts based on chromium oxide (CrOx),10 manganese oxide (MnOx),13 and silicon oxide (SiOx)6,11 have provided evidence that the overlayers can act as ionically-conducting, electronically-insulating coatings that permit reactant/product species transport between the bulk electrolyte and active sites at the buried interface between the overlayer and catalyst. In contrast, several studies on titanium dioxide (TiOx) overlayers have indicated that the overlayer itself can facilitate electron transfer to/from its outer surface where active sites catalyze reactions of interest.14–16 Various explanations for improved activity or selectivity of OECs have been proposed, including the ability of overlayers to facilitate selective species transport and/or electronic interactions between the overlayer and electrocatalyst that enhance activity.14,17,18 A deeper understanding of how ionic and electronic conductivities can affect the activity and selectivity of oxide overlayers is needed to inform rational design of OECs.In this work, the primary interest is the design of OECs for selectively promoting the oxygen evolution reaction (OER) in the presence of a competing redox reaction that is thermodynamically favored over the OER. The OER, shown below for acidic electrolytes, is of practical importance to a wide range of electrolytic processes.19
| 2H2O → O2 + 4H+ + 4e− E° = 1.23 V vs. RHE | (1) |
The oxide encapsulated architecture has attracted significant interest for improving OER electrocatalyst stability, activity, and selectivity in the presence of competing oxidation reactions.8,11,13,20 However, explanations of the mechanistic details of how oxide overlayers enhance the performance of OER electrocatalysts can vary greatly among studies. In their investigations of TiO2-encapsulated iridium and ruthenium electrocatalysts, Finke et al. indicated that the OER occurs at the outer surface of the TiO2 overlayers and attributed increases in OER activity to electronic interactions between the IrOx and TiO2 layers.14 This reaction scheme requires that the outer surface of the overlayer be catalytically active for the reaction of interest and that facile electron transport occurs between the active sites and the underlying catalyst or support material, as illustrated in Fig. 1a. In contrast, other studies of OECs based on SiOx,6,11 MnOx13 and CeOx21 encapsulated OER catalysts have hypothesized that the OER occurs predominantly at the buried interface between the overlayer and active electrocatalyst. As illustrated in Fig. 1b, such a reaction scheme requires transport of reactants and products (H2O, OH−, H+, and O2 for the OER) through the overlayer while inferring that poor electronic conductivity and/or catalytic activity of the overlayer limits reactions from occurring at the outer surface. Collectively, recent studies of OECs for the OER have demonstrated the promise of this electrocatalyst architecture to improve OER electrocatalyst performance but also highlight the lack of a comprehensive understanding for how overlayer ionic and electronic conductivity can influence the location of active sites for competing reactions, and thus the overall electrode performance.
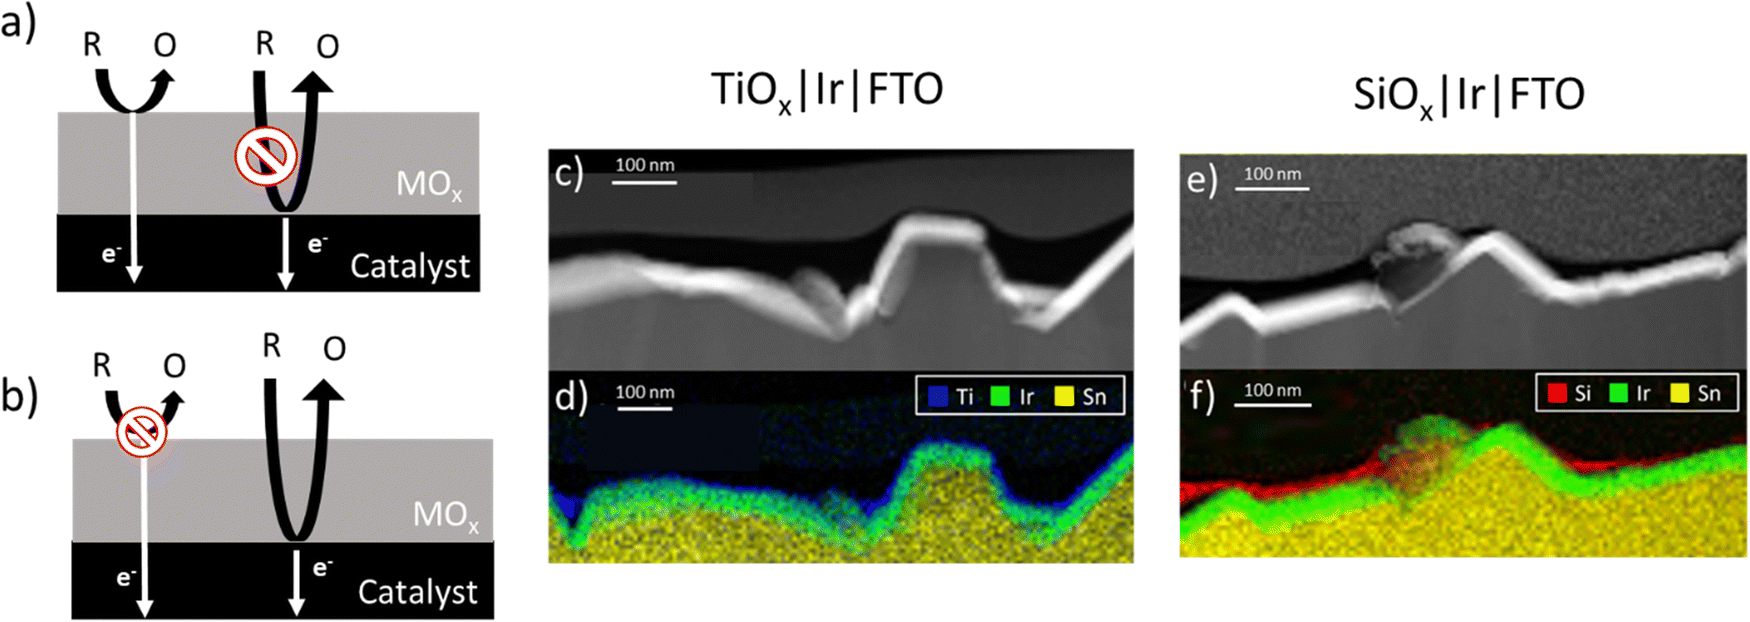 | ||
| Fig. 1 Schematic side-views of oxide encapsulated electrocatalysts (OECs) for which the oxide overlayer (a) possesses sufficient electronic conductivity, active site density and activity so that redox reactions on the outer surface of the oxide overlayer occur more rapidly than species transport and subsequent redox reactivity at the overlayer-catalyst buried interface, or (b) possesses insufficient electronic conductivity, active site density, or activity on the outer surface in comparison to the rate of species transport and subsequent redox reactivity at active sites in the buried interface. (c) and (e) dark field cross-sectional scanning transmission electron microscopy (STEM) images of TiOx|Ir and SiOx|Ir electrodes, respectively. (d) and (f) corresponding elemental maps of TiOx|Ir and SiOx|Ir electrodes, respectively, measured by STEM/EDS (yellow: Sn, green: Ir, red: Si, and blue: Ti). | ||
In this study, planar thin film electrodes such as those shown in Fig. 1c and e are used, whereupon SiOx and TiOx overlayers were deposited by photochemical deposition.22 Such thin film electrodes are more conducive to measuring the electronic and ionic transport properties of oxide overlayers. As an additional probe reaction, the aqueous ferric/ferrous redox couple (eqn (2)) was investigated:
| Fe2+(aq) → Fe3+(aq) + e− E° = 0.771 V vs. NHE | (2) |
The ferric and ferrous ions exist as both aquo- and sulfate complexes,23 but will be referred in this article as Fe(III) and Fe(II) for simplicity. Unlike the OER, this reaction involves only a single electron transfer and is known to exhibit facile kinetics for a variety of electrode materials ranging from Pt group metals24 to carbon.25 Due to its formal reduction potential being located in between those for H+/H2 and H2O/O2,H+, this reaction is also of practical interest as a redox mediator for use in photocatalytic Z-scheme water splitting.26,27 Owing to the relatively fast kinetics for the Fe(II)/Fe(III) reaction on many conductive materials, it is plausible that OECs containing overlayers possessing sufficiently high electronic conductivity can carry out the Fe(II) oxidation reaction on the outer surface of the overlayer as shown in Fig. 1a. In contrast, OECs with overlayers that are electronically insulating and significantly impermeable to Fe(II) are not expected to display any significant activity towards Fe(II) oxidation.
In the present study, it is demonstrated that Ir electrodes possessing TiOx or SiOx overlayers with thickness >10 nm can significantly enhance selectivity towards the OER reaction. Furthermore, we show that TiOx overlayers can have sufficient electronic conductivity to facilitate Fe(II) oxidation at the outer surface of the overlayer, although the reaction rate may be limited by the availability of active sites. In contrast, SiOx overlayers are found to be both electronically resistive and electrochemically inert with low permeability for the Fe(II)/Fe(III) redox couple, allowing for higher OER selectivity compared to TiOx-encapsulated Ir electrodes having similar overlayer thickness.
II. Results and discussion
2.1. Electrode characterization
Full details of electrode fabrication and characterization procedures are provided in the Materials and methods section. Briefly, iridium (Ir) thin film electrodes were fabricated using physical vapor deposition to deposit ≈ 50 nm of Ir onto fluorine doped tin oxide (FTO)-coated glass substrates. Next, TiOx or SiOx overlayers were deposited by a low-temperature photochemical conversion process22,28 using three concentrations of precursors (low, medium, high) to create TiOx|Ir and SiOx|Ir electrodes. The low, medium, and high solution concentrations yielded oxide layer thicknesses of ≈ 2, 5 and 10 nm, respectively, when oxide overlayers were deposited on separate smooth platinum-coated Si wafers and measured using ellipsometry. However, overlayer thicknesses could not be determined using the same method on the rougher FTO substrates, for which reason oxide encapsulated electrodes deposited on FTO/glass substrates will henceforth be referred to by their solution concentration rather than overlayer thickness.Fig. 1c and e show representative cross-section STEM images of high concentration TiOx|Ir and SiOx|Ir electrodes with corresponding energy dispersive X-ray spectroscopy (EDS) maps of identical areas of these electrodes displayed in Fig. 1d and f. Despite the notable roughness of the Ir thin films that results from the underlying FTO layer, the low-resolution images show thin TiOx and SiOx overlayers stretching across the field of view in all images taken. However, the thickness of the oxide overlayers is non-uniform, appearing to be thickest in the cavities of the FTO substrate and thinnest on the high points. This observation from cross-sectional STEM images was further confirmed by atomic force microscopy (AFM) images measured before and after deposition of the oxide coatings (Fig. S1, ESI†). While the root mean squared (rms) roughness of the Ir|FTO substrate was found to be 38 nm, deposition of the oxide overlayers consistently resulted in a decrease in the root-mean-square roughness by 7–18% (Supporting Section SI, ESI†). STEM bright-field/EDS line scans measured perpendicular to the overlayer/Ir buried interface (Fig. 2b and d) suggest there could be some intermixing between the overlayers and iridium, but the lack of a sharp MOx|Ir (M = Ti, Si) interface may also result from the roughness of the FTO substrate, which is evident from low-resolution images (Fig. S2, ESI†). Overlayer thicknesses ranging between 10–15 nm were determined for both the TiOx|Ir and SiOx|Ir electrodes from additional STEM/EDS line scans (Fig. S3–S6, ESI†). High resolution STEM bright-field images of the high concentration TiOx|Ir (Fig. 2a) and SiOx|Ir (Fig. 2c) electrodes suggest that both types of overlayers are amorphous, which is further supported by analysis of the electron diffraction patterns using the bandpass method in DigitalMicrograph (Fig. S7, ESI†).
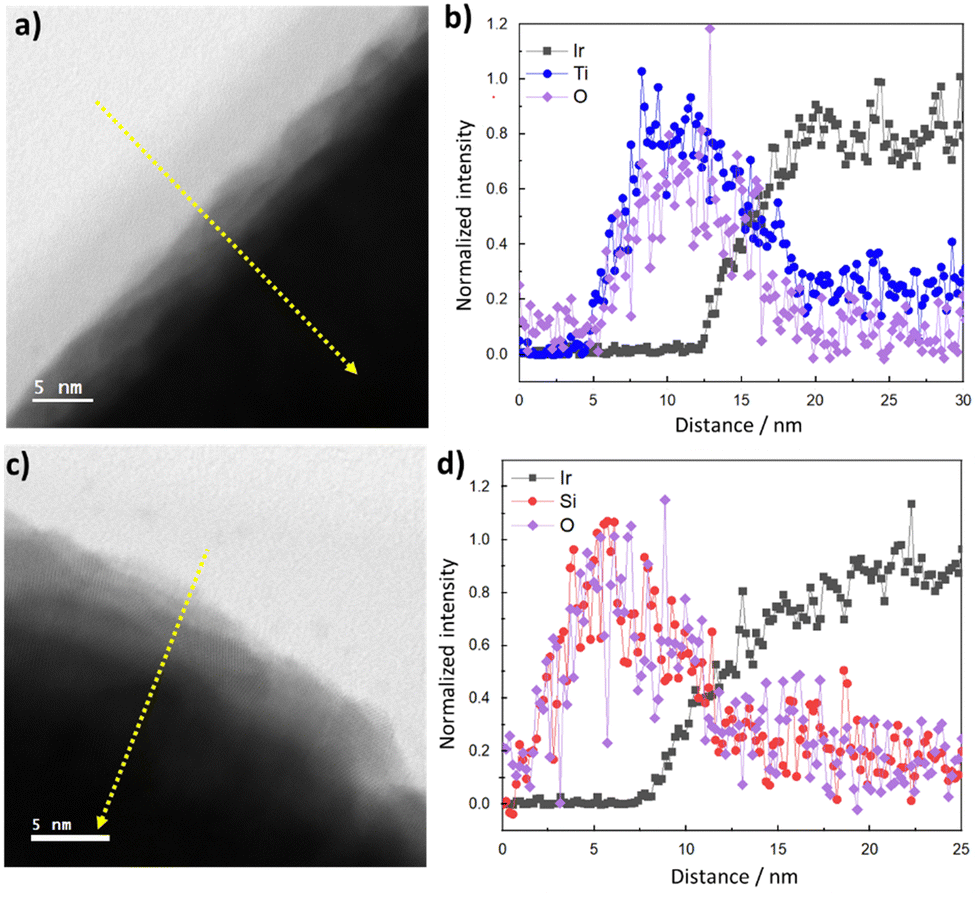 | ||
| Fig. 2 STEM bright-field images of (a) high precursor concentration TiOx|Ir and (c) SiOx|Ir electrodes alongside (b) and (d) normalized EDS elemental line scan profiles corresponding to the locations of the dashed yellow lines in (a) and (c). | ||
Overlayers deposited using the lower concentration MOx|Ir electrodes could not be directly visualized via EDS/STEM due to the small amount of overlayer material and the rough Ir|FTO substrate (Fig. S8–S11, ESI†). XPS measurements of the “low” and “medium” samples are consistent with high coverages of the oxide layers (Fig. S14, ESI†), although it is also possible that thinnest overlayers made from the low and medium precursor concentrations are semi-continuous with breaks in the overlayers corresponding to the high points or peaks in the Ir substrate. Such morphology was previously seen for silicon oxide nanolayers deposited by the same method onto platinum particles.5
Electrodes were also characterized by X-ray photoelectron spectroscopy (XPS), with Ir 4f, Si 2p, Ti 2p, and O 1s spectra shown in Fig. 3 for electrodes containing overlayers made with the highest precursor concentration. Full details on acquisition and peak fitting analysis, as well as XPS of the lower precursor samples, can be found in the Supporting Section SIII (Fig. S12–S14, ESI†). The Ir 4f region (Fig. 3a) of bare Ir and SiOx|Ir electrodes displays peaks corresponding to both metallic Ir and IrOx with Ir 4f 7/2 peak locations within 0.1 eV of the literature value (60.8 eV for Ir, and 61.6 eV for IrO2).29 The Ir 4f region for the TiOx|Ir electrode includes Ti 3s signal from the TiOx overlayer that overlaps with the Ir 4f signal, yielding less-defined Ir 4f peaks.30–32 Both SiOx|Ir and TiOx|Ir electrodes show significantly lower Ir 4f signal compared to bare Ir due to screening by the overlayer. The ratio of Ir 4f peak areas associated with IrOx and Ir increased to a value of 0.3 for SiOx|Ir compared to a value of 0.05 for non-treated bare Ir, which may be explained by partial oxidation of Ir caused by the UV-Ozone curing process. This was confirmed by carrying out XPS on a second bare Ir electrode that underwent the same UV-Ozone treatment (Fig. S12, ESI†), which showed a IrOx![[thin space (1/6-em)]](https://www.rsc.org/images/entities/char_2009.gif) :Ir peak area ratio of 0.2 which was similar to that of the SiOx|Ir sample.
:Ir peak area ratio of 0.2 which was similar to that of the SiOx|Ir sample.
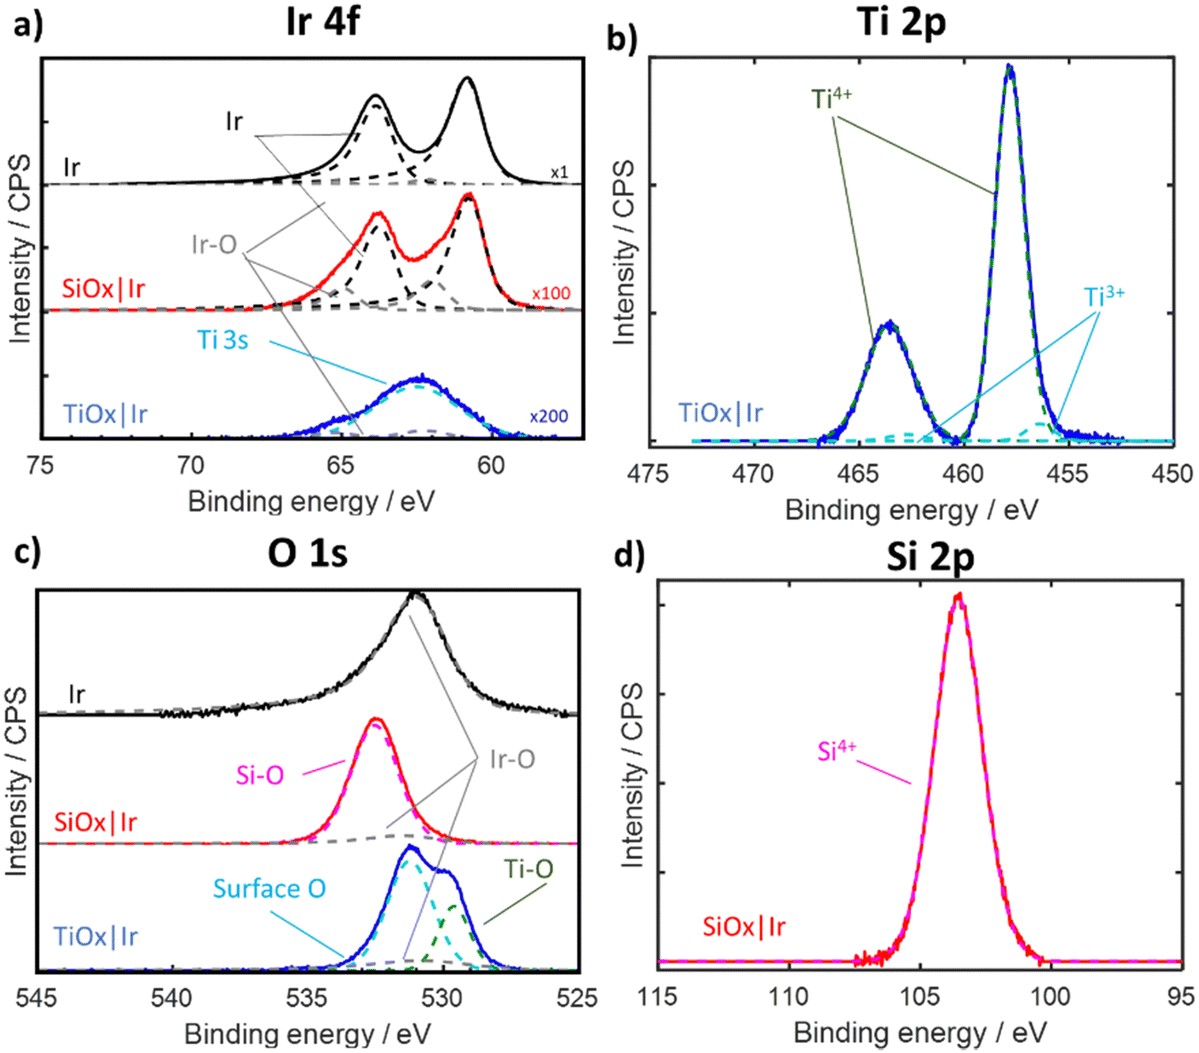 | ||
| Fig. 3 XPS spectra of bare Ir (black trace), “high” SiOx|Ir (red trace) and “high” TiOx|Ir (blue trace) electrodes. (a) Ir 4f, (b) Ti 2p, (c) O 1s and (d) Si 2p regions. Dashed lines in all XPS regions correspond to fitted spectra with labels indicating the type of bond or oxidation state. Ir 4f region was scaled by 100× and 200× for SiOx|Ir and TiOx|Ir, respectively, for visualization. Details related to peak fitting are found in Supporting Section SIII (ESI†). | ||
The O 1s region (Fig. 3c) for bare Ir displays an asymmetric peak centered at 530.9 eV that corresponds to a mixture of Ir-oxide species.29 This O 1s peak associated with IrOx species was also evident in the TiOx|Ir and SiOx|Ir electrodes but was greatly diminished due to screening from the overlayer. Two additional O 1s peaks are present for the TiOx|Ir electrode, whereas only one other O 1s peak is found for the SiOx|Ir electrode. The two additional O 1s peaks for the TiOx|Ir electrode centered at 529.6 eV and 531.2 eV can be attributed to oxygen in the TiOx lattice (e.g. Ti–O–Ti) and surface oxygen (seen as Ti–OH or adsorbed H2O), respectively.33,34 Fitting the Ti 2p region (Fig. 3b) reveals a large doublet associated with Ti4+ (from TiO2) and a minor doublet associated with the more reduced Ti3+ (either from Ti–OH or Ti neighboring oxygen vacancies).14,33 Meanwhile, the pronounced O 1s peak centered at 532.5 eV for the SiOx|Ir electrode can be attributed to oxygen in SiO235 (Fig. 3c), while a single peak seen in the Si 2p region is consistent with Si4+ in SiO2 (Fig. 3d).
2.2. Electrochemical performance of OECs towards OER and Fe(II) oxidation
To assess the electrochemical performance of oxide encapsulated Ir electrodes towards the OER, cyclic voltammetry (CV) measurements on bare Ir, SiOx|Ir, and TiOx|Ir electrodes were performed in deaerated aqueous 0.1 M Na2SO4 + 0.05 M H2SO4 with the pH adjusted to 1.5. CVs for bare Ir, high precursor concentration TiOx|Ir, and high precursor concentration SiOx|Ir are provided as dotted curves in Fig. 4a–c. Additional CVs for the other oxide precursor concentrations can be found in Fig. S15 (ESI†). The only significant feature observed for all electrodes in the supporting electrolyte is the oxidation current associated with the OER. Consistent with previously reported results for Ir-based OER electrocatalysts,36–39 all of these electrodes exhibit OER onset potentials around 1.55 V vs. RHE, and Tafel slopes of 48–61 mV dec−1 (Fig. S17 and Table S2, ESI†). When the CV curves for the bare Ir, TiOx|Ir, and SiOx|Ir electrodes are overlaid (Fig. S15, ESI†), a minor increase in OER activity can be seen for the SiOx|Ir electrodes while a decrease in activity is seen for TiOx|Ir electrodes. Comparison with a bare Ir electrode subjected to the same UV-ozone treatment as the coated electrodes (Fig. S15, ESI†) shows a similar improvement in activity, but was not consistent across multiple samples (Fig. S16, ESI†) suggesting differences can most likely be attributed to the influence of the oxide coating rather than changes to the buried Ir catalyst caused by the UV-ozone treatment. Importantly, the presence of thin (< 15 nm) SiOx and TiOx overlayers only alter the OER overpotential by < 10 mV and < 35 mV, respectively, at 4 mA cm−2 as compared to the uncoated UV-ozone Ir (Fig. S15 and Table S1, ESI†).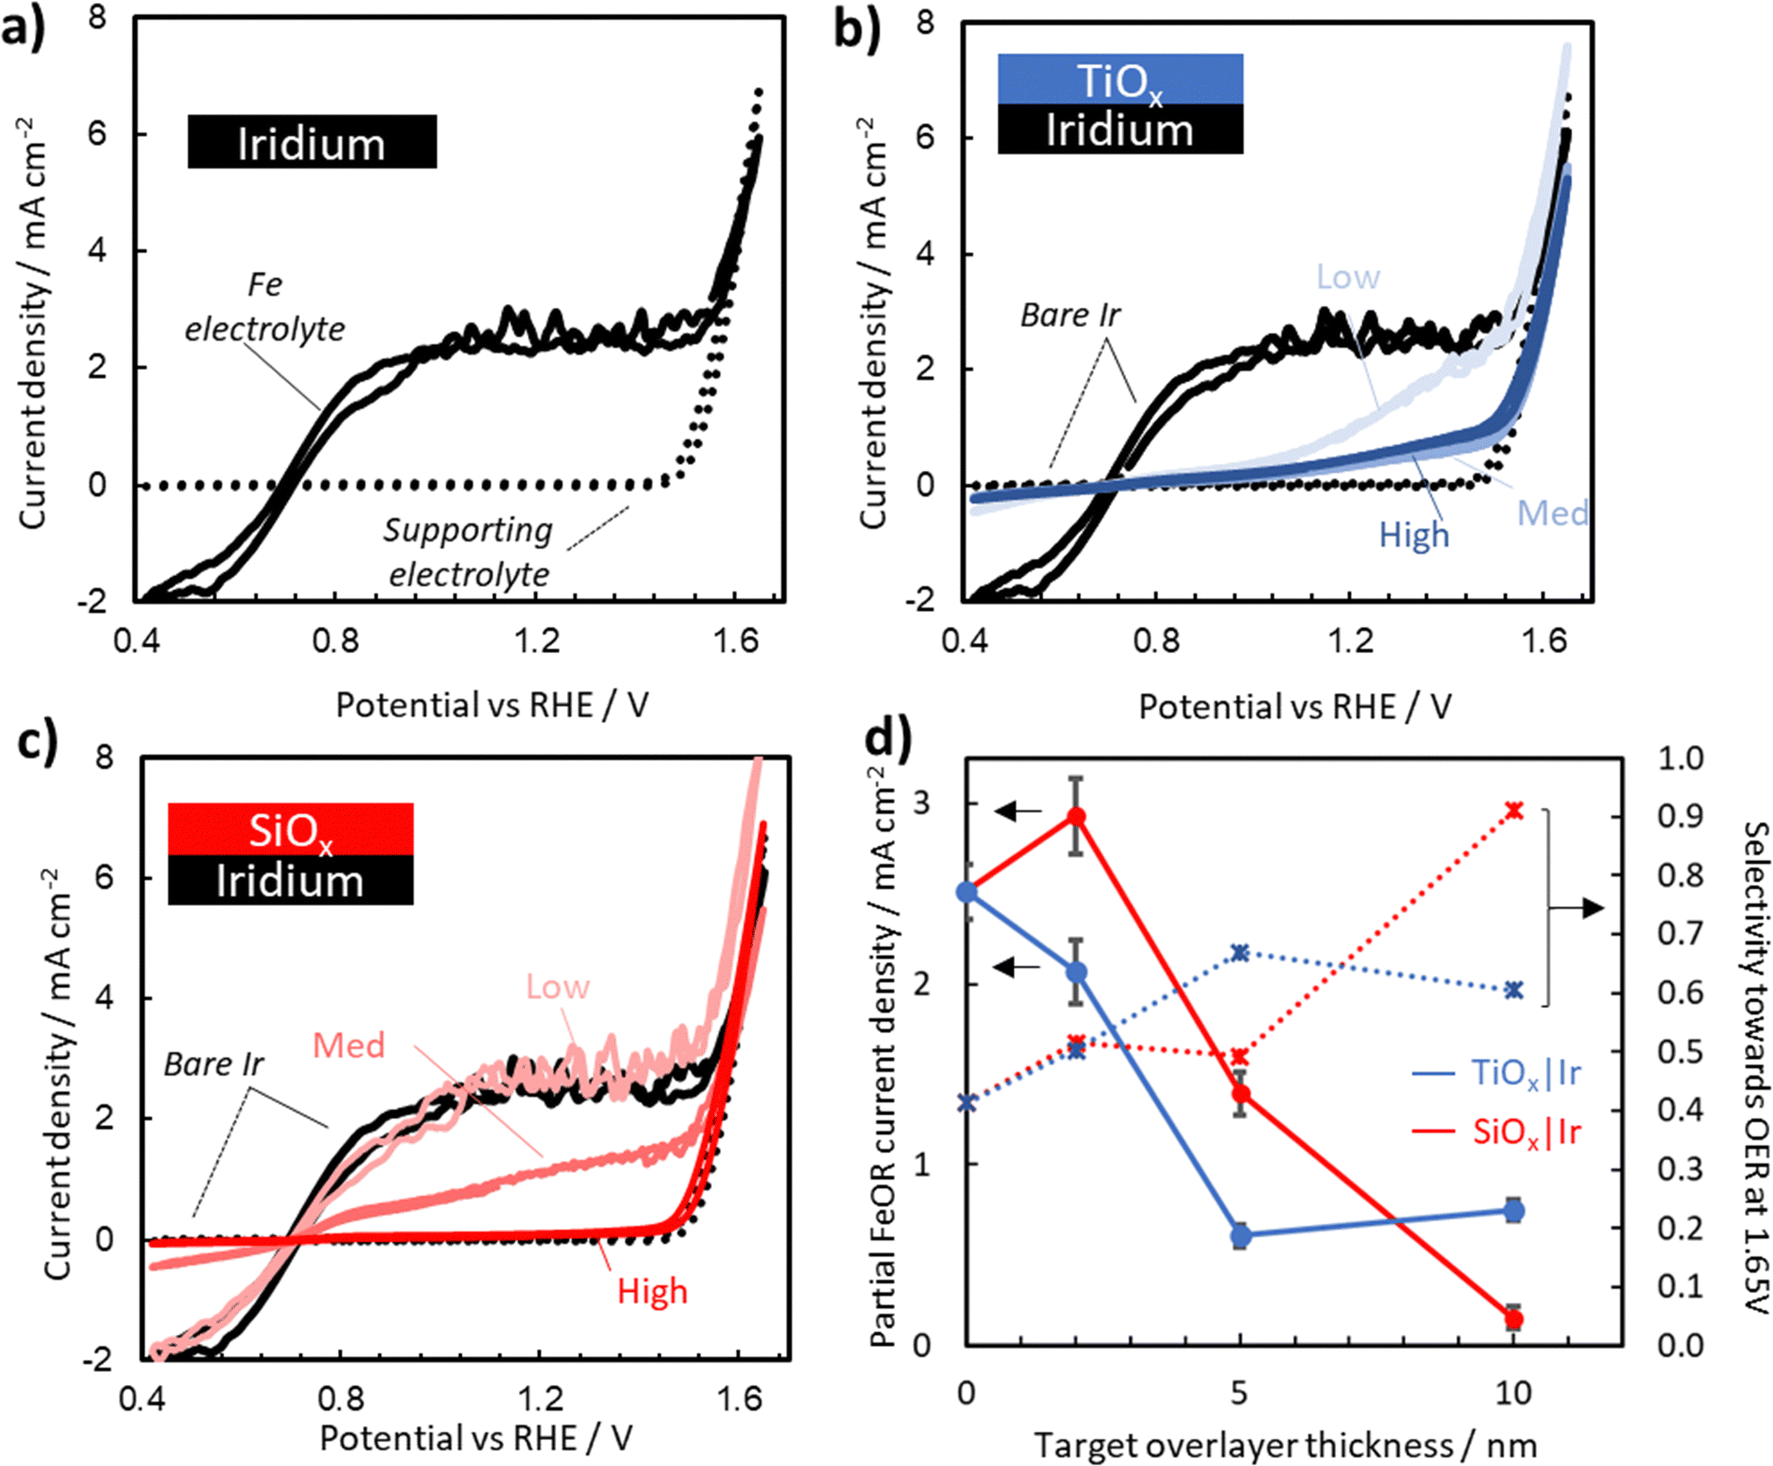 | ||
| Fig. 4 Representative CV curves recorded for (a) bare Ir electrodes in deaerated aqueous 0.1 M Na2SO4 + 0.05 M H2SO4 (pH adjusted to 1.5) supporting electrolyte (dotted line) and an Fe-containing electrolyte with additional 25 mM FeSO4 and 12.5 mM Fe2(SO4)3 (solid line). CV curves recorded in the Fe-containing electrolyte for (b) TiOx|Ir and (c) SiOx|Ir electrodes made with three different precursor concentrations. Supporting electrolyte scans (dotted) for the high concentration MOx|Ir (M = Ti, Si) electrode and scans in the Fe-containing electrolyte for the bare Ir (solid black curves) are added for reference. (d) Partial Fe(II) oxidation current density taken at 1.45 V vs. RHE (solid) and selectivity towards the OER taken at 1.65 V vs. RHE (dotted) for each of the electrodes plotted as a function of targeted overlayer thickness, where the red and blue data points correspond to SiOx|Ir and TiOx|Ir electrodes, respectively. Error bars indicate standard deviation in the current density taken on the final CV over a 10 mV window around 1.45 V vs. RHE for both the forward and reverse scan. CV curves for bare Ir and high concentration SiOx|Ir are reproduced from ref. 40. | ||
To assess stability of MOx overlayers during extended OER operating conditions, chronoamperometric (CA) scans were recorded at 1.65 V vs. RHE for 10 hours in 50 mM H2SO4 + 500 mM Na2SO4 (Fig. S18a, ESI†) for both high concentration MOx|Ir electrodes and a bare Ir control. All three thin film electrodes displayed gradual decreases in current density over the course of the 10 hour measurement and similar final current densities. Post-CA XPS characterization of the spent electrodes (Fig. S18c and d, ESI†) revealed that the TiOx overlayer was no longer present, while the magnitude of the Si 2p signal associated with the SiOx overlayer had decreased by 35%. More investigations are needed to understand and deconvolute the activity and stability changes under longer duration operation. However, for the current study, measurements were limited to short duration (< 60 min of electrochemical measurements) to focus on establishing the structure–property–performance relationships of as-made MOx|Ir electrodes.
Fig. 4a–c also contain CV curves (solid lines) recorded in the presence of 25 mM FeSO4 and 12.5 mM Fe2(SO4)3 for MOx|Ir with three different overlayer precursor concentrations. The partial current associated with the Fe(II)/Fe(III) electrochemistry can be estimated by the difference between the CV curves containing Fe(II)/Fe(III) (solid lines) and those in the Fe-free supporting electrolyte (dotted lines). For bare Ir (Fig. 4a), pronounced Fe(II) oxidation (FeOR) and Fe(III) reduction (FeRR) signal is observed with sharp increases in current density on either side of the Fe(II)/Fe(III) formal reduction potential ( ) of 0.77 V vs. RHE, reflecting the facile reaction kinetics for the Fe(II)/Fe(III) reaction on bare Ir. At overpotentials larger than ± 0.3 V vs.
 , the FeRR and the FeOR current densities level off and reach a limiting current density of ≈ 3.0 mA cm−2 associated with mass transfer of Fe(III)/Fe(II) across the diffusion boundary layer. Scanning to even larger overpotentials, the oxidation current rapidly increases at ≈ 1.55 V vs. RHE. This closely matches the OER onset potential observed in the supporting electrolyte, strongly suggesting that the increase in oxidation current in the Fe-containing electrolyte beyond 1.55 V vs. RHE is also associated with the OER.
Interestingly, the magnitude of the FeOR current observed between 0.77 V and 1.55 V vs. RHE varies greatly between the bare Ir and MOx|Ir electrodes. For SiOx|Ir electrodes, the FeOR current decreases monotonically from 3.0 mA cm−2 at a potential of 1.45 V vs. RHE for the “low” electrode containing the thinnest overlayer down to only ≈ 0.25 mA cm−2 for the “high” electrode with the thickest overlayer (Fig. 4d). The presence of TiOx overlayers also decreases the FeOR relative to bare Ir, but only to ≈ 0.5 mA cm−2 at 1.45 V vs. RHE for the highest overlayer concentration. Additionally, the decrease in FeOR does not follow the same monotonic trend as with SiOx, nor do they reach a constant mass-transport-limited current density for Fe(II) oxidation before the OER onset potential.
Selectivities of each electrode towards the OER (SO2) over the FeOR were estimated by linear extrapolation of the FeOR current to potentials above 1.45 V vs. RHE as described in the Section SVII (Fig. S19, ESI†), and are provided in Fig. 4d as a function of MOx (M = Ti, Si) overlayer thickness. While a minor decrease in OER activity was seen for all electrodes when scanned in Fe electrolyte (Table S1, ESI†), MOx|Ir electrodes had a reduced impact on OER in Fe containing electrolyte. For example, at 4 mA cm−2, there was an additional overpotential of 68 mV required for bare Ir, while the high concentration SiOx and TiOx only needed additional overpotentials of 20 mV and 47 mV, respectively. Both SiOx|Ir and TiOx|Ir electrodes achieve enhanced selectivity towards the OER compared to bare Ir. At 1.65 V vs. RHE, SO2 values of 40%, 60%, and 91% were determined for the bare Ir, thick TiOx|Ir and thick SiOx|Ir electrodes, respectively.
These results demonstrate the ability to alter oxide overlayer thickness to manipulate the current density of a competing reaction (FeOR) while leaving the desired reaction (OER) minimally affected compared to bare Ir. This is a remarkable result given the thermodynamic and kinetic advantages of the FeOR over the OER. Such behavior is desirable for a wide range of applications, such as Z-scheme water splitting by photocatalysis, where the presence of undesired competing reactions can drastically reduce system efficiency.41,42 However, it is not clear from the results of Fig. 4 what the physical origin of the enhanced OER selectivity is, and where the active sites for OER and Fe(II) oxidation are located within these composite electrodes. To better address these questions and identify which scenarios from Fig. 1 are most likely responsible for the enhanced selectivity of oxide encapsulated electrodes, experiments and simulations were carried out to assess the ability of SiOx and TiOx overlayers to facilitate electrocatalytic reactions, electron transport, and ion transport.
2.3. Electronic conductivity of oxide overlayers
To assess the electronic conductivity of TiOx and SiOx overlayers in contact with the electrolyte, a set of electrodes were fabricated with a thin (≈ 1 nm) layer of Pt deposited on top of SiOx|Pt|p + Si(100) and TiOx|Pt|p + Si(100) electrodes to create a “sandwich structure” as illustrated in Fig. 5a. The thin outer Pt layer introduces catalytic sites on the outer surface of the oxide overlayer where Fe(II)/Fe(III) redox reactions can occur. The use of a very thin Pt layer helps to minimize any influence of electrical shunts between the inner and outer Pt layers as a high sheet resistance limits lateral charge transport. Thus, the electrochemical current recorded for such sandwich structure electrodes must involve electron transfer across the oxide layer, which can become rate limiting for thicker, resistive overlayers at overpotentials for which reaction kinetics are fast. Under these conditions, the electronic resistivity of the thin oxide layers can be estimated within the electrochemical environment of interest.43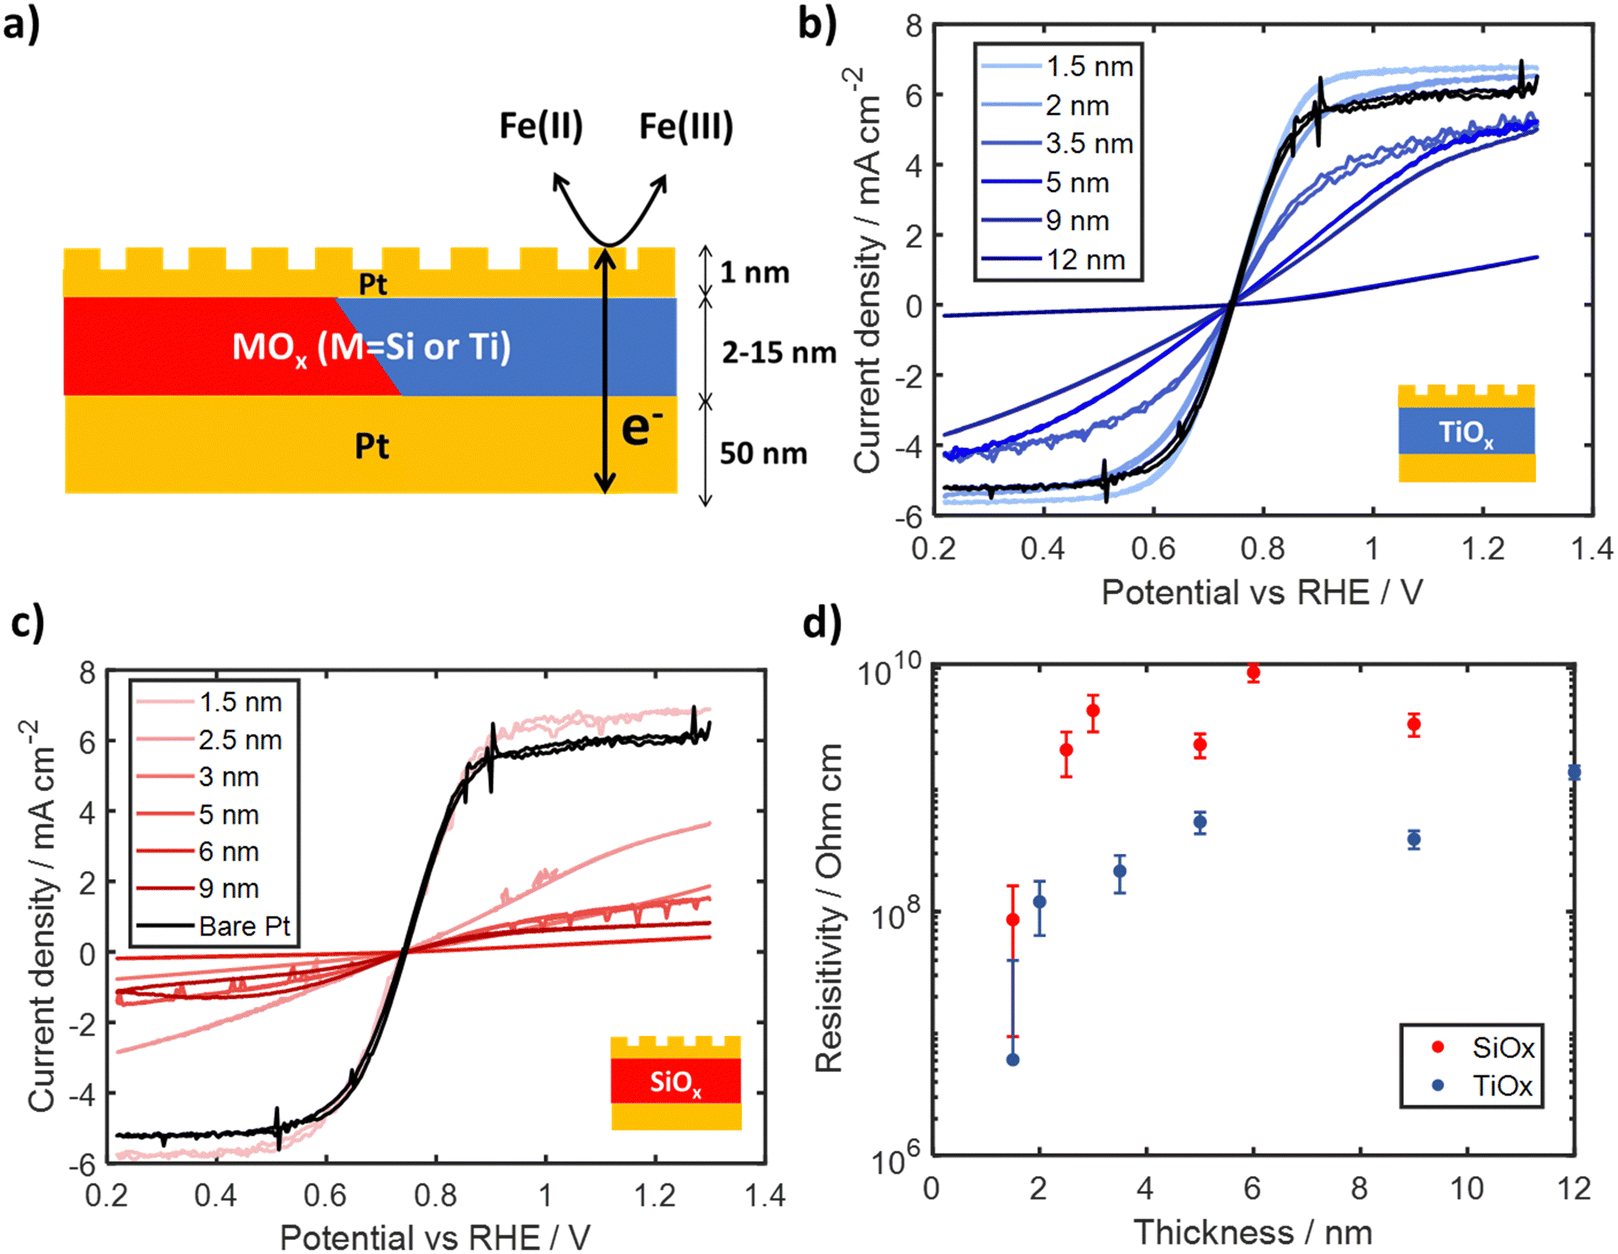 | ||
| Fig. 5 (a) Schematic of “sandwich” structure electrodes used for electronic conductivity measurements. Representative CV curves recorded for (b) Pt|TiOx|Pt and (c) Pt|SiOx|Pt electrodes mounted onto a rotator in deaerated aqueous 25 mM FeSO4 and 12.5 mM Fe2(SO4)3 (pH adjusted to 1.5) with a scan rate of 10 mV s−1 for 4 cycles at an RPM of 250. Figure legends report the thickness of the oxide layer. (d) Electronic resistivities of SiOx and TiOx overlayers calculated from analysis of CV curves in (b) and (c), plotted as a function of overlayer thickness. Error bars in (d) are the propagated standard deviation associated with resistance and thickness measurements. | ||
The electronic conductivity of SiOx and TiOx sandwich structure electrodes were evaluated by carrying out CVs in the same Fe-containing electrolyte used in Section 2.2. Electrodes were mounted on a custom Teflon holder attached to a rotator to ensure consistent mass transport and completed at three different rotation rates. CV curves for Pt|TiOx|Pt and Pt|SiOx|Pt electrodes are provided in Fig. 5b and c, respectively, for oxide layer thicknesses varying between 1 nm and 12 nm, which were generated through varying precursor concentration and measured through ellipsometry. Focusing first on the bare Pt control electrode, symmetric CV curves are observed that switch between oxidation and reduction current at the formal reduction potential for Fe(II) and Fe(III), with clear mass transfer limiting current densities associated with Fe(II) oxidation at positive potentials and Fe(III) reduction at negative potentials. Pt|SiOx|Pt and Pt|TiOx|Pt electrodes show a similar profile as the CV curve for the bare Pt electrode, but generally appear to be skewed to larger overpotentials. A monotonic decrease in current density is observed with increasing thickness of the oxide interlayer. The large suppression in both the apparent FeRR and FeOR limiting current density for Pt|SiOx|Pt electrodes can be seen for almost all thicknesses. However, these current densities seem to still have a positive slope suggesting the electrodes are likely not mass-transport limited, but electronically limited. This conclusion is supported by a Levich analysis (Fig. S23 and S24, ESI†), where the calculated Fe(II) and Fe(III) diffusion coefficients for electrodes containing oxide layers with thicknesses >3 nm are an order of magnitude lower than literature values.44
As all electrodes shown in Fig. 5 were tested under identical conditions and contain the same amount of Pt on their outer surface, the differences in CV curves can be attributed to ohmic overpotentials associated with the transport of electrons across the oxide layer interposed between the inner and outer Pt layers. The calculated oxide layer resistances and resistivities for each electrode are plotted in Fig. S21 and Fig. 5d (ESI†), respectively, as a function of oxide overlayer thickness at the highest rotation speed of 250 RPM. Full details on determination of resistances and resistivities are provided in Supporting Section SVIII (Fig. S20–S24, ESI†). Fig. 5d shows that the resistivity of both SiOx and TiOx increases with thicknesses up to 3–5 nm, beyond which resistivity becomes relatively independent of thickness. For SiOx overlayers, the calculated resistivity increased from 8.6 ± 7.6 × 10⁷ Ω cm for 2 nm thickness up to 9.2 ± 1.5 × 10⁹ Ω cm for 9 nm thickness, with an average of 4.3 ± 2.8 × 10⁹ Ω cm for thicknesses above 3 nm. Fig. 5d also shows that the resistivities of TiOx interlayers were found to be almost an order of magnitude lower than those for SiOx for all thicknesses. Calculated resistivities ranged from 6.1 ± 0.3 × 10⁶ Ω cm at 2 nm thickness to 3.9 ± 0.7 × 10⁸ Ω cm at 9 nm thickness, with an average resistivity of 7.8 ± 5.4 × 10⁸ Ω cm for TiOx thicknesses above 5 nm. While the electronic resistivity of oxide coatings can vary highly depending on the material synthesis and crystallinity,45–51 the average resistivities for overlayers thicker than 3 nm are still orders of magnitude lower than those for bulk crystalline SiO252,53 and TiO2.54–57
The lower resistivity of oxide overlayers used in this study can most likely be attributed to the highly defective, amorphous nature of overlayers deposited by the low temperature photochemical deposition process (Fig. 2a and c), although it is also possible that residual carbon within the MOx layer58 could increase the conductivity. Previous studies have shown that oxygen deficient TiO2, characterized by Ti3+ states such as those evident in the Ti 2p spectra in Fig. 3b, have lower resistivity compared to stoichiometric TiO2.59,60 The thickness-dependent resistivity of both types of MOx layers for < 3 nm is likely influenced by quantum mechanical tunneling, which is known to be an important mode of electron transport for thin dielectric layers in this thickness regime.43,61,62 The slight dependence of resistivity on thickness for TiO2 overlayers from 3 to 7 nm may suggest electronic conduction through a combination of tunneling and bulk conduction, as previously suggested in literature.43,63
Importantly, the high resistivities of thicker SiOx overlayers support the hypothesis that redox reactions are not able to occur on the outer surface to any meaningful extent due to the inability of SiOx to support electron transport between the substrate and active sites located on its outer surface. For example, a 5–10 nm thick SiOx overlayer characterized by a resistivity of 109 Ω cm would incur an ohmic drop of ≈ 1 V to support a current density of ∼ 1 mA cm−2. However, charge transport through TiOx overlayers could still be significant at resistivities of 108 Ω cm, as the same conditions would only require ∼100 mV of additional ohmic resistance. This analysis demonstrates that TiOx overlayers could support meaningful rates of electronic transport (such as those seen in Fig. 4b) to active sites on their outer surface.
2.4. Electrocatalytic activity of oxide overlayers
To further assess whether the outer surface of the oxide overlayers are catalytically active, SiOx and TiOx overlayers were also deposited on three different Ir-free substrates: FTO/glass, degenerately doped p-Si(100) (p+Si), and 50 nm thick Pt thin film on p+Si(100). CV curves were recorded in the identical electrolytes and using the same scan conditions and range of oxide layer thicknesses used in Section 2.2.CV cycling of bare and oxide-encapsulated FTO substrates in Fe(II)/Fe(III)-containing electrolyte was used to assess the intrinsic catalytic activity and Fe blocking capabilities of overlayers in the absence of a good catalyst at the buried interface. As seen in both Fig. 6a and b, the bare FTO electrodes in the Fe-containing electrolyte exhibit notable oxidation and reduction current densities, which can be attributed to the FeOR and FeRR, respectively, but with significantly larger overpotentials and higher asymmetry than for bare Ir. These differences can be attributed to the poor catalytic activity of FTO.64 The CVs recorded for SiOx|FTO electrodes in the Fe-containing electrolyte, seen in Fig. 6a, show that even the thinnest SiOx overlayer (made with the lowest precursor concentration) suppresses the Fe redox current while the thicker overlayers synthesized with the higher precursor concentrations nearly eliminate Fe redox current. The CV curves for the TiOx|FTO electrodes, seen in Fig. 6b, display suppressed Fe(II) oxidation and Fe(III) reduction current at both the low and medium precursor concentrations, with curve shapes displaying asymmetry similar to the CV curve for bare FTO. The highest precursor concentration TiOx|FTO electrode displays even lower FeOR and FeRR signal that is slightly larger than that seen for the medium and high concentration SiOx|FTO electrodes.
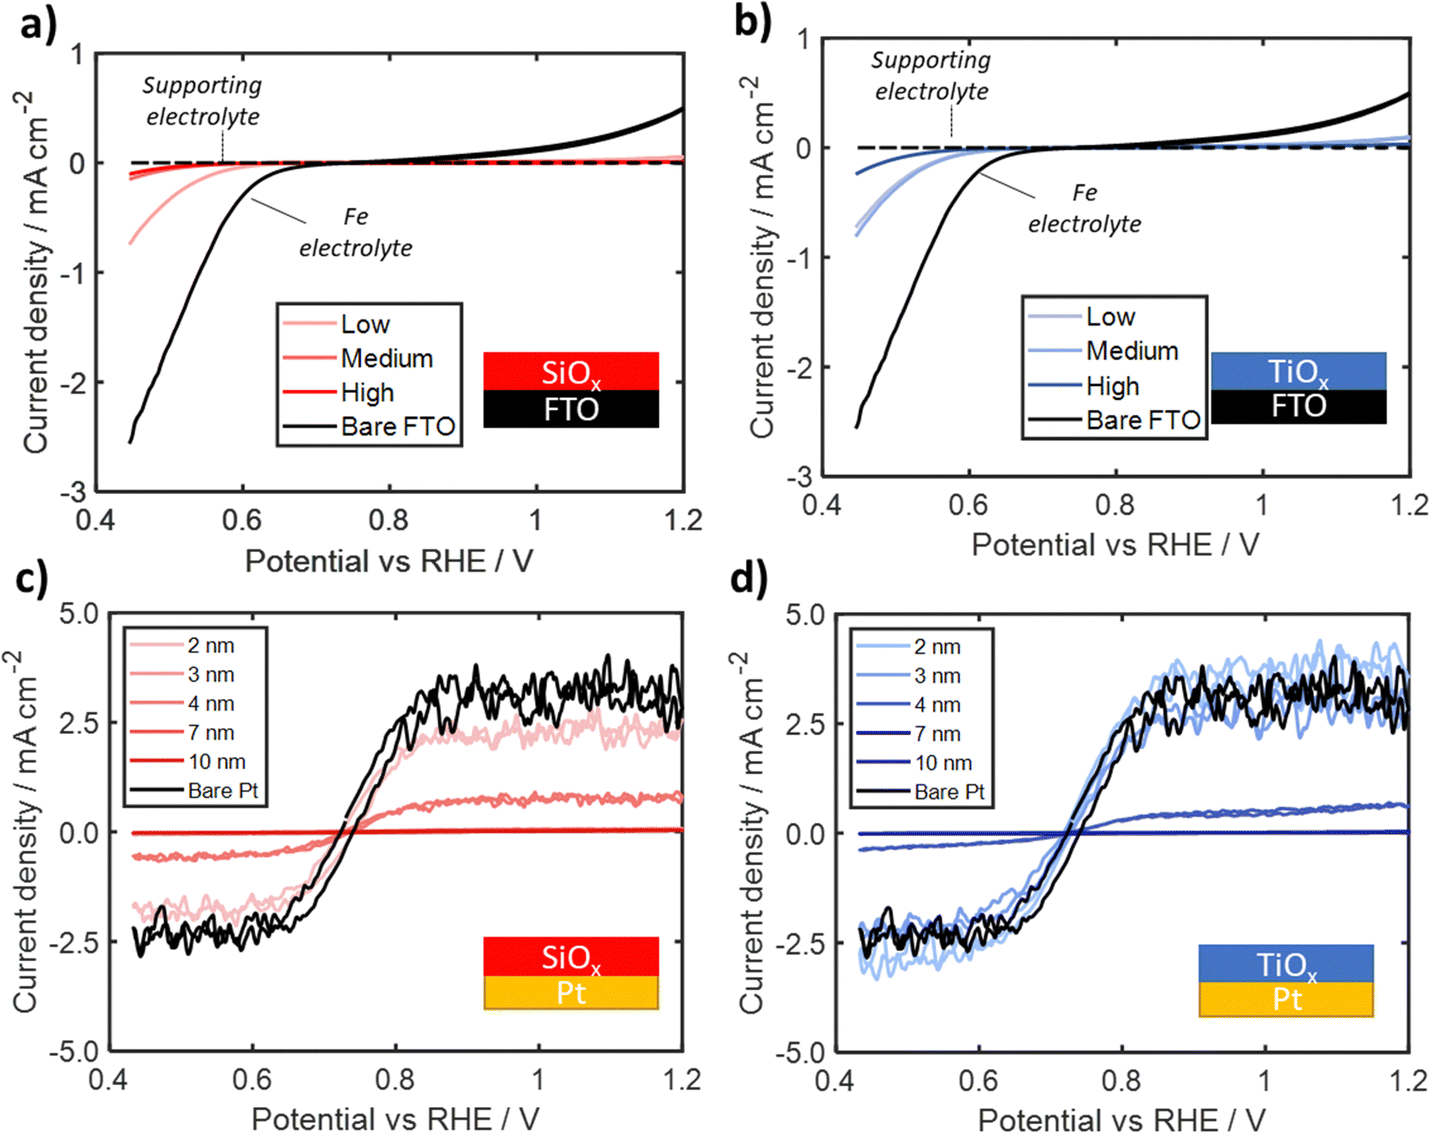 | ||
| Fig. 6 Representative CV cycles of (a) SiOx|FTO and (b) TiOx|FTO for three different overlayer precursor concentrations (low, medium, high). Representative CV cycles for (c) SiOx|Pt and (d) TiOx|Pt electrodes with varied overlayer thicknesses measured with a scan rate of 10 mV s−1 in dearated aqueous Fe-containing electrolyte (25 mM FeSO4 + 12.5 mM Fe2(SO4)3 + 0.1 M Na2SO4 + 0.05 M H2SO4). For all CV curves, the black trace corresponds to the bare substrate without any overlayer. | ||
To assess whether the roughness of the FTO substrates has a substantial impact on the continuity of the oxide overlayers and more accurately determine how Fe(II)/Fe(III) redox features change with overlayer thickness, a series of electrodes were fabricated by depositing oxide overlayers on substrates based on a smooth p+Si(100) wafers. First, overlayers were deposited directly onto the as-received p+Si substrate. None of these electrodes exhibited any significant electrochemical features associated with Fe redox reactions (Fig. S25, ESI†). While this result may demonstrate that there are no Fe-redox-active sites present on either the SiOx or TiOx overlayers, it is possible that the presence of a 1–2 nm native silicon oxide layer present on the Si wafer could be suppressing redox signal by increasing electrical resistance between the substrate and overlayer.65
Finally, overlayers were deposited onto p+Si(100) wafers coated with 50 nm of Pt, which served as a proxy for Ir that is also very active towards Fe(II)/Fe(III) redox reactions. Representative CV curves recorded for overlayers with thicknesses varying between 2–10 nm are seen in Fig. 6c and d for SiOx|Pt and TiOx|Pt respectively. For all electrodes, CV curves display an apparent mass transport limited current densities at large overpotentials for both the FeRR and the FeOR. For the thinnest overlayers (< 4 nm), there is a decrease in the apparent limiting current for SiOx|Pt electrodes while the limiting current for the TiOx|Pt electrodes remain the same as the bare Pt electrode. Above this thickness threshold of ≈ 4 nm, the Fe(II)/Fe(III) redox signal for both types of oxide layers becomes similar to the background signal. Interestingly, this near complete suppression of Fe redox is different from the data in Fig. 5b and c, where appreciable FeOR and FeRR current was still observed for thicknesses up to 9 nm for both Pt|TiOx|Pt and Pt|SiOx|Pt in the presence of an active outer Pt layer. This suggests that the outer surfaces of both TiOx and SiOx may not possess high enough catalytic activity towards the Fe redox reactions, especially at larger thicknesses and moderate overpotentials. This difference in behavior may also be explained by differences in density of states at the outer surface, which would help facilitate tunneling of charge carriers through the oxide, as suggested in previous studies with tunneling TiO2 layers.62,66
2.5. Species transport through silicon oxide overlayers
To further investigate the role of species transport through the overlayer to active sites at the buried interface, the Fe(II)/Fe(III) redox behavior of 40 additional MOx|Pt thin film electrodes with varying thickness was evaluated. Apparent FeRR limiting currents, similar to Fig. 6, recorded during CV measurements in Fe-containing electrolyte were normalized by the limiting FeRR current for a bare Pt control electrode and plotted against overlayer thickness in Fig. 7. It is seen that the limiting current for SiOx|Pt electrodes rapidly decreases with overlayer thickness for thicknesses greater than 2 nm, while significant decreases in the limiting current density of TiOx -encapsulated electrodes are not seen until an overlayer thickness of 3–4 nm. Above these two thickness thresholds, a drastic decrease in limiting current is followed by a more gradual decline towards zero current for thicknesses greater than ≈ 5 nm.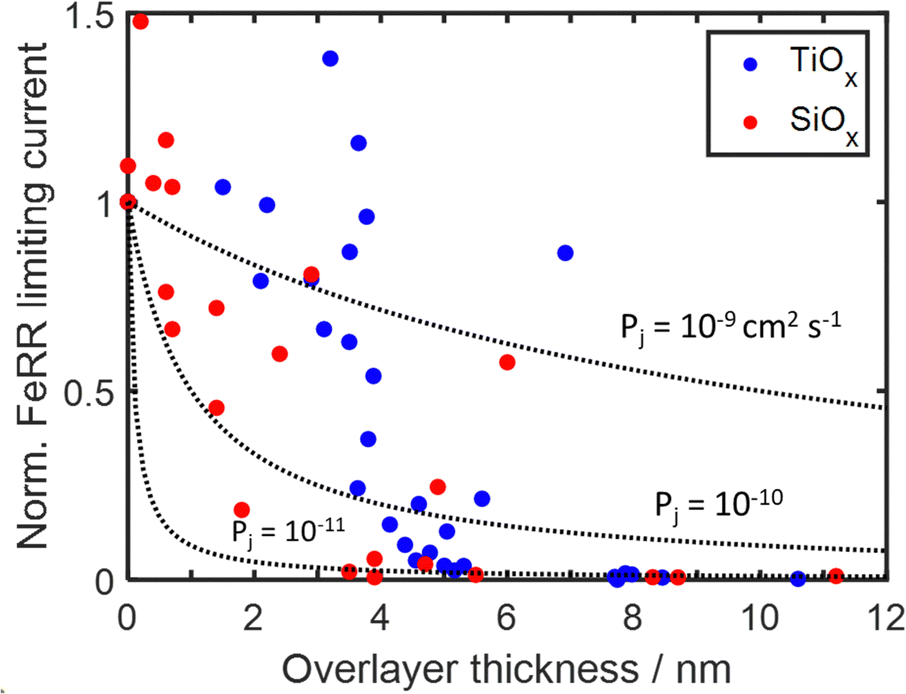 | ||
| Fig. 7 Current density towards the FeRR taken over 0.45–0.5 V vs. RHE for 40 MOx|Pt electrodes during CV cycling in Fe-containing electrolyte (25 mM FeSO4 + 12.5 mM Fe2(SO4)3 + 0.1 M Na2SO4 + 0.05 M H2SO4). Current densities were normalized to the limiting current density of a bare electrode and plotted as a function of overlayer thickness for both SiOx and TiOx overlayers. Dotted lines represent current densities predicted by the 1D diffusion model (eqn (5)) for different species permeabilities. The 1D model assumes that species transport across the diffusion boundary layer remains the same for bare Pt and MOx|Pt electrodes. | ||
The drastic decrease in current with increasing overlayer thickness (to) in Fig. 7 could be consistent with a reaction occurring on the outer surface of the overlayer (Fig. 1a) if electrical transport across the overlayer is limited by quantum mechanical tunneling through a dielectric barrier, for which tunneling probability decreases exponentially with overlayer thickness (i ∼ exp(−to)).62 However, current is also expected to decrease with to for reactions occurring at the buried interface of an oxide encapsulated electrocatalyst (Fig. 1b), for which the limiting current density should vary as ilim ∼ 1/to. This inverse relationship between ilim and to is seen in eqn (3), which is based on a 1-dimensional (1D) solution-diffusion model describing reactant transport by diffusion across a diffusion boundary layer and an overlayer with thickness to:17,67
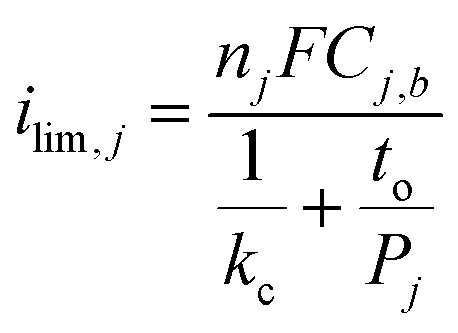 | (3) |
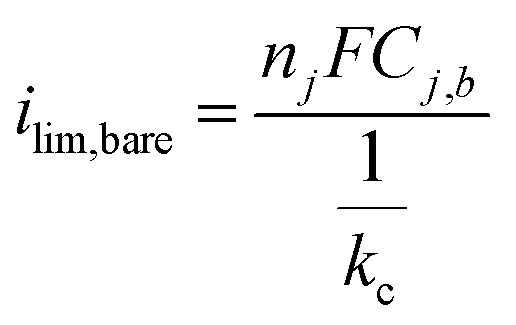 | (4) |
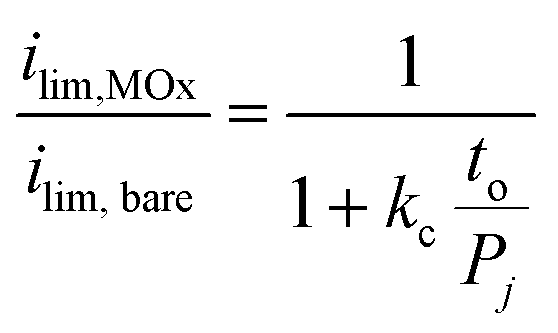 | (5) |
Eqn (5) was used to model (ilim,MOx/ilim,bare) for three different permeabilities spanning three orders of magnitude (10−9–10−11 cm2 s−1), with the results shown in Fig. 7. In this analysis, kc was kept as a constant value corresponding to that extracted from the bare Pt electrode CVs. Comparison of the modeled curves in Fig. 7 to the experimental data points shows that the 1D diffusion model may reasonably describe (ilim,MOx/ilim,bare) vs. to data for SiOx|Pt electrodes for a species permeability of ≈ 1 × 10⁻¹⁰ cm2 s−1. However, the scatter present in the experimental data makes it difficult to confidently state whether the 1D diffusion model gives a better fit to the data than an exponential fit associated with quantum tunneling.
While the 1D diffusion model could be a reasonable fit to the experimental data for the SiOx|Pt electrodes, the same cannot be said for TiOx|Pt electrodes for any assumed Fe(III) permeability. Disagreement between the shape of the modeled curves and experimental data is especially pronounced at the lowest thicknesses (< 4 nm), where the FeRR current densities of the TiOx-encapsulated electrodes were statistically the same as bare Pt. While this thickness-independent behavior could potentially be explained by incomplete coverage of the overlayers, conformal TiO2 overlayers made by atomic layer deposition (ALD) exhibit similar behavior over this thickness range (Fig. S26, ESI†). Overlayers fabricated by ALD are expected to be highly conformal, even for thicknesses down to 2 nm, and thus the similar FeRR behaviors suggests that the wet chemical overlayers were also conformal. Therefore, the most likely cause of the behavior for overlayer thicknesses < 4 nm is that the FeRR occurs at the outer surface over the overlayer (Fig. 1a), bypassing the need for species transport through the overlayer and resulting in similar mass transport limiting current as an unencapsulated electrode. This scenario is similar to that described by Hoffman et al.14 for thin ALD TiO2 overlayers deposited on Ir electrodes and is consistent with the thinnest TiOx overlayers having the lowest electrical resistivity (Fig. 5d). Combining insights from Sections 2.3, 2.4, and 2.5, we conclude that active sites exist on the outer surface of the TiOx overlayers, and that the bulk material possesses sufficiently low electronic resistivity to support meaningful electron transfer to those sites for TiOx overlayer thicknesses < 4 nm. For to > 4 nm, the electrical resistance of the overlayer becomes too large, causing electron transport and/or Fe(II)/Fe(III) transport across the overlayer to become limiting.
The observations that (i) SiOx overlayers possess very high electronic resistivity (Fig. 5), (ii) SiOx|FTO substrates do not display any meaningful OER activity (Fig. S25 and S27, ESI†), and (iii) SiOx|Ir electrodes exhibit similar OER performance as bare Ir electrodes (Fig. 4), suggest that the OER is occurring at the SiOx|Ir buried interface as depicted in Fig. 1b. For this to happen, H2O, O2, and H+ must be able to transport through the SiOx overlayers with low energy penalty. Meanwhile, the high selectivity towards the OER vs. FeOR is likely explained by Fe(II) species being selectively blocked by a semipermeable oxide overlayer, which is consistent with the observations that little-to-no Fe(II) oxidation signal is observed for SiOx|Ir (Fig. 4c), SiOx|FTO (Fig. 6a), or SiOx|Pt (Fig. 6c) electrodes. Additionally, a recent molecular dynamics study by Aydin et al. suggested that Fe(II) and Fe(III) transport through SiO2 is constrained by size exclusion of the solvated ions,40 while it is well-established that dense SiOx overlayers can readily transport H+ through a facilitated diffusion process involving hopping of protons along a H-bonding network within SiO2.58,68,69 However, some studies have reported that SiO270 and MoOx9 overlayers can be effective at blocking O2 transport, including a recent study from our group that reported that O2 permeability of SiO2 overlayers can be two orders of magnitude lower than the permeability of H+.58
To better understand transport mechanism of species through SiOx coatings, classical molecular dynamics (MD) simulations were carried out for 2 nm thick SiO2 slabs with a well-defined pore diameter of 0.8 nm (Fig. 8a). Additional studies on nanoscopic SiOx on platinum suggest species transport is associated with the formation of Si–O–Si ring structures71 with diameters > 0.3 nm.72 Previous characterization of SiOx overlayers deposited by the UV-ozone process by ellipsometric porosimetry indicated that pores, if they exist, have average diameters that are less than 0.6 nm6 while other studies on nanoscopic SiOx on carbon nanotubes suggest pores are likely < 0.7 nm through BET analysis.73 Thus, by using MD simulations to investigate species transport for a pore diameter slightly larger than 0.6 nm, this study is being conservative in its assessment of whether species are likely to enter and diffuse through the overlayers.
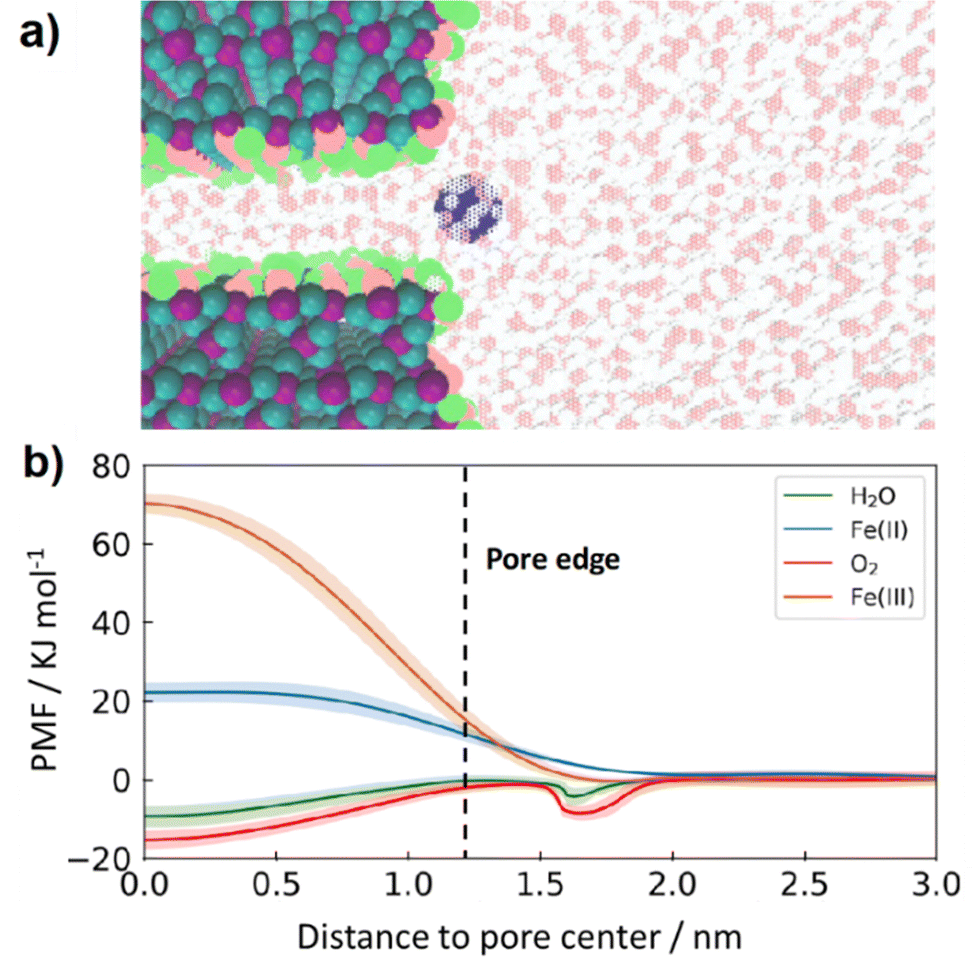 | ||
| Fig. 8 (a) Representative illustration of the molecular dynamics simulation consisting of an aqueous solution phase [water (H: red, O: white), and Fe(II) (blue) ion] and a single SiO2 (Si: purple, O:cyan) pore with a hydroxylated surface and a pore size of 0.8 nm (O: pink, H: light green) (b) potential of mean force (PMF) as a function of distance to the SiO2 pore center for O2, H2O, Fe(II) and Fe(III). PMF curves for Fe(II) and Fe(III) are reproduced from ref. 40. | ||
Results of MD simulations are provided in Fig. 8b, where the potential of mean force (PMF) for H2O, O2, Fe(II), and Fe(III) permeants are shown as a function of their location with respect to the pore center. These results predict that transport of both O2 (red line) and H2O (green line) from the bulk electrolyte into a 0.8 nm pore is barrierless, meaning that there is no energy penalty for these permeants to enter the pore. This lack of energy barrier is attributed to favorable interactions between both O2 and H2O with the silanol groups present in the SiO2 pore that overcome the energy penalty associated with the breaking of hydrogen bonds when entering the pore.74 In sharp contrast, the energy barrier for Fe(II) (blue line) and Fe(III) (orange line) transport is found to be significantly higher than that of O2 and H2O, providing further evidence that SiO2 overlayers promote selectivity towards the OER over the FeOR thanks to their ability to block Fe(II) from reaching buried active sites while still permitting diffusion of H2O and O2 into free volume elements of SiO2 from the bulk electrolyte. The energy barriers of Fe species were due to modulation of solvation structures albeit qualitatively different between Fe(II) and Fe(III): loss of weakly bound second shell and large strain in strongly bound second shell, respectively.40
III. Conclusions
This study demonstrates that TiOx- and SiOx-encapsulated iridium electrocatalysts can significantly enhance the selectivity towards the OER over the competing Fe(II) oxidation reaction with minimal impact on the OER activity. The ability to suppress Fe(II)/Fe(III) redox reactions while permitting the OER is highly dependent on the thickness of the oxide overlayer, with SiOx overlayers being more effective at blocking Fe(II)/Fe(III) reactions than TiOx overlayers of the same thickness. However, Fe(II)/Fe(III) redox reactions may occur at very thin (< 4 nm) TiOx overlayers, while comparable SiOx overlayers show suppressed electrochemical activity. The effectiveness of SiOx overlayers to suppress Fe(II)/Fe(III) reactions on their outer surface is explained by their large through-plane electronic resistivity, which is around one order of magnitude larger than for TiOx. Furthermore, molecular dynamics simulations show that H2O and O2 species experience low energy barriers for transport through model SiO2 nanopores–thus allowing the OER to proceed at the oxide/Ir interface—while Fe(II) and Fe(III) species transport is hindered by large energy barriers. This ability to manipulate the selectivity of OER electrocatalysts in the presence of a competing redox species through rational design of oxide overlayer properties is relevant to a number of applications, including but not limited to seawater electrolysis and Z-scheme photocatalysis. Through precise control over both charge carrier and species transport, oxide-encapsulated electrocatalysts also offer an attractive approach for designing multi-site electrocatalysts for co-optimization of selectivity and activity for more complex multi-step redox reactions.Material and methods
Electrode fabrication
Electrodes were fabricated on either FTO glass (TEC7, 2.2 mm thick, GreatSolarCell), or monocrystalline degenerately doped p+Si(100) wafers (Prime-grade p+Si, resistivity < 0.005 Ω cm, 500–550 μm thick, WRS materials). The iridium electrodes were prepared by sputter coating a thin layer of iridium (∼ 50 nm) using an EMS150T sputter coater (Electron Microscopy Sciences, Hatfield, PA, USA) onto the aforementioned FTO glass substrate. For metal|p+Si based electrodes, 50 nm of Pt was deposited at a rate of 1 Å s−1 with a 2 nm Ti adhesion layer (deposited at 0.5 Å s−1). For the fabrication of SiOx overlayers: low, medium and high precursor solutions of high-molecular-weight trimethyl siloxy-terminated poly(dimethylsiloxane) (PDMS) (600000 cSt, Gelest) in toluene (1.2, 3.3, and 5.3 mg mL−1) were spin-coated for 2.5 min at 4000 rpm.28 For the fabrication of TiOx overlayers solutions of titanium isopropoxide (TTIP) (97%, Sigma Aldrich) in anhydrous ethanol (2, 5, 10 mg mL−1) were spin-coated for 1 min at 1000 rpm. The PDMS and TTIP coated electrodes were then dried in a vacuum oven (30 in Hg) at 90 °C for 1 h before undergoing treatment in the UV-ozone chamber (UVOCS, T10X10/OES) for 2 h to convert the PDMS to SiOx and the TTIP to TiOx. Replicate electrodes were fabricated in all cases to ensure reproducibility. A range of precursor solutions (0.5–6 mg mL−1 of PDMS in toluene for SiOx or 1–6 mg mL−1 TTIP in ethanol for TiOx) were prepared for varying overlayer thickness between 1–15 nm, which was measured via ellipsometry. Electrical contacts were attached by soldering a copper wire onto the front of the Ir electrode, or the back of the p+Si substrates using a solder temperature of 220 °C. The geometric area was defined using 3 M electroplaters tape with a circular opening of 0.25 cm2 through which the electrode was exposed to electrolyte. To create the Pt|SiOx|Si and Pt|TiOx|Si electrodes 1 nm of Pt was deposited on SiOx|Si and TiOx|Si substrates through electron beam deposition at a rate of 0.3 Å s−1.
Atomic layer deposited TiOx overlayers were deposited in a custom deposition chamber at 150 °C using alternating cycles of titanium(IV) chloride (TiCl4) and water in N2 carrier gas. One cycle consisted of 1 s pulse of TiCl4, 1 s N2 purge, followed by 1 s pulse of H2O and 3 s N2 purge. Samples with various cycles were synthesized all under continuous flow conditions.
Electrode characterization
Overlayer thickness of electrodes on p+Si(100) substrates were measured using a J. A. Woollam α-SE ellipsometer. Thicknesses of the SiOx and TiOx overlayers were determined by fitting the raw data to Cauchy model with optical constants for SiO2 and TiO2. Thickness of the SiOx and TiOx overlayers for electrodes on the FTO substrates were estimated by measuring the thickness of the SiOx and TiOx overlayer on smooth Pt-coated Si substrates after undergoing identical spin-coating procedures.X-ray photoelectron spectroscopy measurements were made with a PHI XPS system at pressures < 2 × 10⁻¹⁰ torr using a monochromatic Al Kα source (15 kV, 20 mA) and a charge neutralizer, tilted to 54.7° relative to the detector. Multiplex spectra are shown as averages of three measurements and were fit using CasaXPS software applying Shirley's algorithm for background subtraction. Atomic ratios were calculated by normalizing the intensity of each element's atomic sensitivity factor.
Surface topography and roughness was measured using a BrukerDimension Icon atomic force microscope (AFM) in air using a ScanAsyst silicon tip on a nitride cantilever with a 2 nm nominal tip radius and a spring force constant of 0.4 N m−1. Measurements were performed in peak force nanomechanical mapping mode using a scan rate of 0.22 Hz and a resonant frequency of 70 kHz.
Electrochemical measurements
All electrochemical measurements were performed in deaerated aqueous 0.1 M Na2SO4 (ACS reagent, ≥99.0%, anhydrous, granular, Sigma Aldrich) + 0.05 M H2SO4 (Certified ACS plus, Fischer Scientific) in 18 MΩ cm deionized water (Millipore, Milli-Q Direct 8) that was adjusted to pH 1.5 using concentrated sulfuric acid or sodium hydroxide. The iron-containing electrolyte was prepared identically except for the addition of 25 mM FeSO4·7H2O (ACS reagent, ≥99.0%, Sigma Aldrich) and 12.5 mM Fe2(SO4)3·xH2O (97%, Sigma Aldrich). Measurements of pH were taken with a benchtop pH meter (Fisher Science Education, S90526), using a 3-point calibration from 1.69, 4.01, 7.00 standard buffers (Oakton). Bulk electrochemical measurements were conducted with an SP-200 BioLogic potentiostat, a commercial Ag|AgCl (sat. 3 M KCl) reference electrode (E° = 0.21 V vs. NHE, Hach, E21M002), a carbon rod (Saturn Industries) counter electrode and a standard glass three neck round bottom flask (Ace Glass, European flask, 250 mL). Electrolyte for all electrochemical experiments was deaerated by purging nitrogen (Airgas, 99.99% purity) for 20 min prior to experimentation. Sandwich structure experiments were completed by mounting Pt|MOx|Pt|p+Si electrodes onto a custom designed Teflon enclosed stainless steel holder (47 mm diameter) which was directly mounted onto a rotator (MSR Rotator, Pine Research). The geometric area was defined using 3M electroplaters tape with a circular opening of 0.25 cm2 through which the electrode was exposed to electrolyte.Internal resistance of each electrode was measured by performing potentiometric electrochemical impedance spectroscopy (PEIS) at open circuit potential from 200 kHz–100 mHz with an amplitude of 10 mV before performing cyclic voltammetry measurements. Cyclic voltammetry measurements for Ir based electrodes were performed between potentials of 0.42 and 1.65 V vs. RHE with a scan rate of 20 mV s−1 for 5 cycles. Cyclic voltammetry measurements for p+Si and FTO based electrodes without Ir were performed between potentials of −0.1 and 1.65 V vs. RHE with a scan rate of 20 mV s−1 for 3 cycles, after initial pre-treatment scans between 0.05 and 1.15 V vs. RHE with a scan rate of 100 mV s−1 for 20 cycles. Electrochemical testing in supporting electrolyte (where applicable) was additionally completed before any Fe containing electrolyte. RDE scans were completed between potentials of 0.2 and 1.2 V vs. RHE with a scan rate of 20 mV s−1 for three different rotation rates of 50, 100, and 250 RPM.
Molecular dynamics simulations
Models of SiO2 slit pores were created using a four-step process described in our recent study,40 which we briefly summarize here. Starting with the α-quartz phase of SiO2, an orthorhombic supercell with dimensions of 24.0 × 34.0 × 32.4 Å3 was constructed. Several layers of the oxide were then removed to create slit pores, and surface oxygens were terminated with hydrogen atoms. An extra vacuum region was then added and filled by aqueous solutions that contain water molecules, a redox shuttle, and chloride ions for charge neutrality. For the simulations involving gas transport, either an O2 or H2 molecule was added to the aqueous solution. The system was equilibrated for 1 ns under the NPT ensemble at T = 298.15 K and P = 1 atm by using the Berendsen barostat.75 To prevent rigid-body translation, silicon and oxygen atoms in the middle of the SiO2 slab were constrained, while all other atoms were allowed to move. The Lennard-Jones (LJ) parameters for Fe(III) and Fe(II) were obtained from the literature,76,77 and those for O2 were also obtained from the literature.78 Finally, the LJ parameters provided by Joseph and Aluru were used for the pore structure atoms.79 A rigid SPCE water model was used in all simulations.80After equilibrium, free energy surfaces associated with the transport of redox shuttles, water, and O2 through SiO2 pores were determined using well-tempered metadynamics (WT-MetaD) simulations.81 This method involves adding Gaussian potentials to the system's free energy landscape based on predetermined collective variables. Two collective variables were selected: the center-of-mass (COM) distances between the permeant and the pore in two directions (parallel and perpendicular to the pore surface) for water and O2. For the Fe ions, the collection variables were the COM distance between the ion and the pore and the number of water molecules in the first hydration shell of the ion. Statistics was collected for four replicas of WT-MetaD simulations, each spanning 350–450 ns. The simulations were carried out under the NVT ensemble at T = 298.15 K using the Nose–Hoover thermostat.82 The Gaussian bias energy was deposited every 500 steps with specific heights and widths for each collection variable, as described in a recent study.40 All simulations were performed using the LAMMPS package83 patched with PLUMED 2.5b.84
Author contributions:
Conceptualization: WDHS, RSS, and DVE; formal analysis: WDHS, RSS, JJ, ZC, MX, FA, and MA; funding acquisition: DVE, and SA; investigation: WDHS, RSS, JJ, YW, ZC, MX, FA, MFCA and KEH; methodology: WDHS, RSS, ZC, MX, TAP, TO, DVE; supervision: SA, XP, DE, TAP, TO, and DVE; visualization: WDHS, RSS, ZC, JJ, and FA; writing – original draft: WDHS, RSS, and JJ; and writing – review and editing: WDHS, RSS, JJ, ZC, MX, FA, TAP, SA, KEH, and DVE.Conflicts of interest
There are no conflicts to declare.Acknowledgements
The authors acknowledge funding from the Department of Energy, Office of Energy Efficiency and Renewable Energy (EERE) Hydrogen Fuel Cells Technologies Office and specifically the HydroGEN Advanced Water Splitting Materials Consortium, established as part of the Energy Materials Network under this same office (Award No. DE-EE0008838). EERE funding supported early R&D efforts including synthesis, characterization (TEM, XPS, AFM), and evaluation of the performance of oxide-encapsulated Ir electrocatalysts, in addition to molecular dynamics simulations. Nearly equal funding support was provided through Ensembles of Photosynthetic Nanoreactors (EPN), an Energy Frontier Research Center funded by the U.S. Department of Energy, Office of Science under Award Number DE-SC0023431. This second funding source supported a majority of manuscript writing efforts as well as additional experiments and data analysis related to oxide overlayer conductivity measurements, TEM characterization, XPS characterization, and stability measurements. The authors acknowledge the use of facilities and instrumentation supported by NSF through the Columbia University, Columbia Nano Initiative, and the Materials Research Science and Engineering Center DMR-2011738. The authors acknowledge the use of facilities and instrumentation at the UC Irvine Materials Research Institute (IMRI), which is supported in part by the National Science Foundation through the UC Irvine Materials Research Science and Engineering Center (DMR-2011967). Part of this work was performed under the auspices of the U.S. Department of Energy by Lawrence Livermore National Laboratory under Contract DE-AC52-07NA27344. Part of this work was authored by the National Renewable Energy Laboratory, operated by Alliance for Sustainable Energy, LLC, for the U.S. Department of Energy (DOE) under Contract No. DE-AC36-08GO28308.References
- Z. W. Seh, J. Kibsgaard, C. F. Dickens, I. Chorkendorff, J. K. Norskov and T. F. Jaramillo, Science, 2017, 355 Search PubMed.
- D. V. Esposito, V. Guilimondi, J. G. Vos and M. T. M. Koper, Ultrathin Oxide Layers for Solar and Electrocatalytic Systems, The Royal Society of Chemistry, 2022, pp. 167–209 Search PubMed.
- S. Takenaka, N. Susuki, H. Miyamoto, E. Tanabe, H. Matsune and M. Kishida, Chem. Commun., 2010, 46, 8950–8952 RSC.
- S. Takenaka, H. Miyamoto, Y. Utsunomiya, H. Matsune and M. Kishida, J. Phys. Chem. C, 2014, 118, 774–783 CrossRef CAS.
- N. Y. Labrador, X. X. Li, Y. K. Liu, H. Y. Tan, R. Y. Wang, J. T. Koberstein, T. P. Moffat and D. V. Esposito, Nano Lett., 2016, 16, 6452–6459 CrossRef CAS PubMed.
- N. Y. Labrador, E. L. Songcuan, C. De Silva, H. Chen, S. J. Kurdziel, R. K. Ramachandran, C. Detavernier and D. V. Esposito, ACS Catal., 2018, 8, 1767–1778 CrossRef CAS.
- J. E. Robinson, N. Y. Labrador, H. Chen, B. E. Sartor and D. V. Esposito, ACS Catal., 2018, 8, 11423–11434 CrossRef CAS.
- R. A. Krivina, M. Zlatar, T. N. Stovall, G. A. Lindquist, D. Escalera-López, A. K. Cook, J. E. Hutchison, S. Cherevko and S. W. Boettcher, ACS Catal., 2023, 13, 902–915 CrossRef CAS.
- A. T. Garcia-Esparza, T. Shinagawa, S. Ould-Chikh, M. Qureshi, X. Peng, N. Wei, D. H. Anjum, A. Clo, T. C. Weng, D. Nordlund, D. Sokaras, J. Kubota, K. Domen and K. Takanabe, Angew. Chem., Int. Ed., 2017, 56, 5780–5784 CrossRef CAS PubMed.
- K. Maeda, K. Teramura, D. Lu, N. Saito, Y. Inoue and K. Domen, Angew. Chem., Int. Ed., 2006, 45, 7806–7809, DOI:10.18434/T4T88K.
- A. A. Bhardwaj, J. G. Vos, M. E. S. Beatty, A. F. Baxter, M. T. M. Koper, N. Y. Yip and D. V. Esposito, ACS Catal., 2021, 11, 1316–1330 CrossRef CAS.
- J. G. Vos and M. T. M. Koper, J. Electroanal. Chem., 2018, 819, 260–268 CrossRef CAS.
- J. G. Vos, T. A. Wezendonk, A. W. Jeremiasse and M. T. M. Koper, J. Am. Chem. Soc., 2018, 140, 10270–10281 CrossRef CAS PubMed.
- C. E. Finke, S. T. Omelchenko, J. T. Jasper, M. F. Lichterman, C. G. Read, S. Lewis and M. R. Hoffmann, Energy Environ. Sci., 2019, 12, 358–365 RSC.
- B. Hou, L. Shen, H. Shi, J. Chen, B. Zhao, K. Li, Y. Wang, G. Shen, M.-A. Ha, F. Liu, A. N. Alexandrova, W. H. Hung, J. Dawlaty, P. Christopher and S. B. Cronin, ACS Appl. Mater. Interfaces, 2019, 11, 10351–10355 CrossRef CAS PubMed.
- G. Lu, A. Linsebigler and J. T. Yates, Jr., J. Phys. Chem., 1994, 98, 11733–11738 CrossRef CAS.
- D. V. Esposito, V. Guilimondi, J. G. Vos and M. T. M. Koper, in Energy and Environment Series, ed. H. Frei and D. Esposito, Royal Society of Chemistry, Cambridge, 2022, pp. 167–209 Search PubMed.
- T. Kotani, K. Ogawa, H. Suzuki, K. Kato, O. Tomita, A. Yamakata and R. Abe, EES Catal., 2023, 1, 255–262 RSC.
- L. An, C. Wei, M. Lu, H. Liu, Y. Chen, G. G. Scherer, A. C. Fisher, P. Xi, Z. J. Xu and C. H. Yan, Adv. Mater., 2021, 33, 2006328 CrossRef CAS PubMed.
- J. Guo, Y. Zheng, Z. Hu, C. Zheng, J. Mao, K. Du, M. Jaroniec, S.-Z. Qiao and T. Ling, Nat. Energy, 2023, 8, 264–272 CAS.
- K. Obata and K. Takanabe, Angew. Chem., 2018, 130, 1632–1636 CrossRef.
- C. L. Mirley and J. T. Koberstein, Langmuir, 1995, 11, 1049–1052 CrossRef CAS.
- J. M. Casas, G. Crisóstomo and L. Cifuentes, Hydrometallurgy, 2005, 80, 254–264 CrossRef CAS.
- T. V. Sawant and J. R. McKone, ACS Appl. Energy Mater., 2018, 1, 4743–4753 CrossRef CAS.
- L. W. Hruska and R. F. Savinell, J. Electrochem. Soc., 1981, 128, 18–25 CrossRef CAS.
- R. Bala Chandran, S. Breen, Y. Shao, S. Ardo and A. Z. Weber, Energy Environ. Sci., 2018, 11, 115–135 RSC.
- D. M. Fabian, S. Hu, N. Singh, F. A. Houle, T. Hisatomi, K. Domen, F. E. Osterloh and S. Ardo, Energy Environ. Sci., 2015, 8, 2825–2850 RSC.
- M. E. S. Beatty, H. Chen, N. Y. Labrador, B. J. Lee and D. V. Esposito, J. Mater. Chem. A, 2018, 6, 22287–22300 RSC.
- S. J. Freakley, J. Ruiz-Esquius and D. J. Morgan, Surf. Interface Anal., 2017, 49, 794–799 CrossRef CAS.
- NIST X-ray Photoelectron Spectroscopy Database, NIST Standard Reference Database Number 20, National Institute of Standards and Technology, Gaithersburg MD, 20899 (2000) DOI:10.18434/T4T88K, (retrieved 11/2023).
- Y. Mei, S. Guo, Y. Jiang, F. Li, Y. Li and X. Hu, Electrochim. Acta, 2020, 344, 136149 CrossRef CAS.
- J. F. Moulder and J. Chastain, Handbook of X-ray Photoelectron Spectroscopy: A Reference Book of Standard Spectra for Identification and Interpretation of XPS Data, Physical Electronics Division, PerkinElmer Corporation, 1992 Search PubMed.
- M. C. Biesinger, L. W. M. Lau, A. R. Gerson and R. S. C. Smart, Appl. Surf. Sci., 2010, 257, 887–898 CrossRef CAS.
- E. McCafferty and J. P. Wightman, Surf. Interface Anal., 1998, 26, 549–564 CrossRef CAS.
- C. D. Wagner, D. E. Passoja, H. F. Hillery, T. G. Kinisky, H. A. Six, W. T. Jansen and J. A. Taylor, J. Vac. Sci. Technol., 1982, 21, 933–944 CrossRef CAS.
- T. Reier, M. Oezaslan and P. Strasser, ACS Catal., 2012, 2, 1765–1772 CrossRef CAS.
- T. Shinagawa, A. T. Garcia-Esparza and K. Takanabe, Sci. Rep., 2015, 5, 13801 CrossRef PubMed.
- Y. Zhao, N. M. Vargas-Barbosa, E. A. Hernandez-Pagan and T. E. Mallouk, Small, 2011, 7, 2087–2093 CrossRef CAS PubMed.
- M. Bernt, A. Siebel and H. A. Gasteiger, J. Electrochem. Soc., 2018, 165, F305 CrossRef CAS.
- F. Aydin, M. F. C. Andrade, R. S. Stinson, A. Zagalskaya, D. Schwalbe-Koda, Z. Chen, S. Sharma, A. Maiti, D. V. Esposito, S. Ardo, T. A. Pham and T. Ogitsu, ACS Appl. Mater. Interfaces, 2023, 15, 17814–17824 CrossRef CAS PubMed.
- Y. Qi, S. Chen, J. Cui, Z. Wang, F. Zhang and C. Li, Appl. Catal., B, 2018, 224, 579–585 CrossRef CAS.
- S. S. Chen, J. J. M. Vequizo, Z. H. Pan, T. Hisatomi, M. Nakabayashi, L. H. Lin, Z. Wang, K. Kato, A. Yamakata, N. Shibata, T. Takata, T. Yamada and K. Domen, J. Am. Chem. Soc., 2021, 143, 10633–10641 CrossRef CAS PubMed.
- A. G. Scheuermann, K. W. Kemp, K. Tang, D. Q. Lu, P. F. Satterthwaite, T. Ito, C. E. D. Chidsey and P. C. McIntyre, Energy Environ. Sci., 2016, 9, 504–516 RSC.
- A. F. Gil, L. Galicia and I. González, J. Electroanal. Chem., 1996, 417, 129–134 CrossRef CAS.
- A. Daniyan, L. Umoru, A. Fasasi, J. Borode, K. Oluwasegun and S. Olusunle, J. Miner. Mater. Charact. Eng., 2014, 2, 15–20 CAS.
- S. Amirtharajan, P. Jeyaprakash, J. Natarajan and P. Natarajan, Appl. Nanosci., 2016, 6, 591–598 CrossRef CAS.
- F. Zeribi, A. Attaf, A. Derbali, H. Saidi, L. Benmebrouk, M. S. Aida, M. Dahnoun, R. Nouadji and H. Ezzaouia, ECS J. Solid State Sci. Technol., 2022, 11, 023003 CrossRef.
- A. Yildiz, S. B. Lisesivdin, M. Kasap and D. Mardare, J. Non-Cryst. Solids, 2008, 354, 4944–4947 CrossRef CAS.
- H. Bartzsch, D. Glöβ, B. Böcher, P. Frach and K. Goedicke, Surf. Coat. Technol., 2003, 174–175, 774–778 CrossRef CAS.
- D. Wang, J. Liu, Z. Lv, H. Tao, Y. Cui, H. Wang, S. Liu, C. Liu, N. Wang, W. Jiang, W. Chai and W. Ding, Mater. Lett., 2018, 211, 277–280 CrossRef CAS.
- Q. Wang, Z. Liu, Z. Liu, Z. Li, J. Yin, H. Wang, W. Jiang, S. Liu, Y. Cui, W. Ding and C. Dong, Appl. Surf. Sci., 2023, 636, 157791 CrossRef CAS.
- W. R. Ayles, et al., in Engineered materials handbook, ed. M. M. Gauthier, ASM International, Amsterdam, Desk edn, 1995, ch. 30.
- H. E. Wenden, Am. Mineral., 1957, 42, 859–888 CAS.
- A. G. Scheuermann, J. D. Prange, M. Gunji, C. E. D. Chidsey and P. C. McIntyre, Energy Environ. Sci., 2013, 6, 2487 RSC.
- E. Kumi-Barimah, R. Penhale-Jones, A. Salimian, H. Upadhyaya, A. Hasnath and G. Jose, Sci. Rep., 2020, 10, 10144 CrossRef CAS PubMed.
- H. Tang, K. Prasad, R. Sanjinès, P. E. Schmid and F. Lévy, J. Appl. Phys., 1994, 75, 2042–2047 CrossRef CAS.
- Y. Katsuta, R. Akahane and K. Yahagi, Jpn. J. Appl. Phys., 1971, 10, 976 CrossRef CAS.
- M. E. S. Beatty, E. I. Gillette, A. T. Haley and D. V. Esposito, ACS Appl. Energy Mater., 2020, 3, 12338–12350 CrossRef CAS.
- J. Nowotny, T. Bak, M. K. Nowotny and L. R. Sheppard, Int. J. Hydrogen Energy, 2007, 32, 2630–2643 CrossRef CAS.
- X. Liu, H. Xu, L. R. Grabstanowicz, S. Gao, Z. Lou, W. Wang, B. Huang, Y. Dai and T. Xu, Catal. Today, 2014, 225, 80–89 CrossRef CAS.
- A. J. Bard, L. R. Faulkner and H. S. White, Microscopic Theories of Charge Transfer, Wiley, 2022, vol. 3, pp. 142–168 Search PubMed.
- C. M. Hill, J. Kim and A. J. Bard, J. Am. Chem. Soc., 2015, 137, 11321–11326 CrossRef CAS PubMed.
- Y. W. Chen, J. D. Prange, S. Dühnen, Y. Park, M. Gunji, C. E. D. Chidsey and P. C. McIntyre, Nat. Mater., 2011, 10, 539–544 CrossRef CAS PubMed.
- A. Korjenic and K. S. Raja, J. Electrochem. Soc., 2019, 166, C169–C184 CrossRef CAS.
- M. Morita, T. Ohmi, E. Hasegawa, M. Kawakami and K. Suma, Appl. Phys. Lett., 1989, 55, 562–564 CrossRef CAS.
- C. M. Hill, J. Kim, N. Bodappa and A. J. Bard, J. Am. Chem. Soc., 2017, 139, 6114–6119 CrossRef CAS PubMed.
- D. V. Esposito, ACS Catal., 2018, 8, 457–465 CrossRef CAS.
- J. Godet and A. Pasquarello, Phys. Rev. Lett., 2006, 97, 155901 CrossRef PubMed.
- H. A. Kurtz and S. P. Karna, IEEE Trans. Nucl. Sci., 1999, 46, 1574–1577 CAS.
- W. J. Jo, G. Katsoukis and H. Frei, Adv. Funct. Mater., 2020, 30, 1909262 CrossRef CAS.
- J. A. Bau and K. Takanabe, ACS Catal., 2017, 7, 7931–7940 CrossRef CAS.
- S. T. Oyama, D. Lee, P. Hacarlioglu and R. F. Saraf, J. Membr. Sci., 2004, 244, 45–53 CrossRef CAS.
- S. Takenaka, T. Miyazaki, H. Matsune and M. Kishida, Catal. Sci. Technol., 2015, 5, 1133–1142 RSC.
- A. M. Schrader, J. I. Monroe, R. Sheil, H. A. Dobbs, T. J. Keller, Y. Li, S. Jain, M. S. Shell, J. N. Israelachvili and S. Han, Proc. Natl. Acad. Sci. U. S. A., 2018, 115, 2890–2895 CrossRef CAS PubMed.
- H. J. C. Berendsen, J. P. M. Postma, W. F. van Gunsteren, A. DiNola and J. R. Haak, J. Chem. Phys., 1984, 81, 3684–3690 CrossRef CAS.
- P. Li, L. F. Song and K. M. Merz, Jr., J. Phys. Chem. B, 2015, 119, 883–895 CrossRef CAS PubMed.
- P. Li, B. P. Roberts, D. K. Chakravorty and K. M. Merz, Jr., J. Chem. Theory Comput., 2013, 9, 2733–2748 CrossRef CAS PubMed.
- S. Wang, K. Hou and H. Heinz, J. Chem. Theory Comput., 2021, 17, 5198–5213 CrossRef CAS PubMed.
- S. Joseph and N. R. Aluru, Langmuir, 2006, 22, 9041–9051 CrossRef CAS PubMed.
- H. J. C. Berendsen, J. R. Grigera and T. P. Straatsma, J. Phys. Chem., 1987, 91, 6269–6271 CrossRef CAS.
- A. Barducci, G. Bussi and M. Parrinello, Phys. Rev. Lett., 2008, 100, 020603 CrossRef PubMed.
- S. Nosé, J. Chem. Phys., 1984, 81, 511–519 CrossRef.
- S. Plimpton, J. Comput. Phys., 1995, 117, 1–19 CrossRef CAS.
- G. A. Tribello, M. Bonomi, D. Branduardi, C. Camilloni and G. Bussi, Comput. Phys. Commun., 2014, 185, 604–613 CrossRef CAS.
Footnote |
| † Electronic supplementary information (ESI) available. See DOI: https://doi.org/10.1039/d4ey00074a |
| This journal is © The Royal Society of Chemistry 2024 |