Low-carbon transition pathways of power systems for Guangdong–Hongkong–Macau region in China†
Zuming
Liu
 *a,
Mingquan
Li
 b,
Edgar
Virguez
c and
Xiaomin
Xie
 *de
*de
aCollege of Smart Energy, Shanghai Jiao Tong University, Shanghai, 200240, China. E-mail: zmliu@sjtu.edu.cn
bSchool of Economics and Management, Beihang University, Beijing, 100191, China
cDepartment of Global Ecology, Carnegie Institution for Science, Stanford University, California, USA
dResearch Institute of Carbon Neutrality, Shanghai Jiao Tong University, Shanghai, 200030, China. E-mail: xiexiaomin@sjtu.edu.cn
eSchool of Mechanical Engineering, Shanghai Jiao Tong University, Shanghai, 200240, China
First published on 21st November 2023
Abstract
China has announced its ambitious targets towards carbon neutrality by 2060. The Guangdong–Hongkong–Macau (GHM) region, as a pilot demonstration area for China's reform and opening-up, faces dual pressures on providing low-carbon electricity for meeting its surging demand while limiting carbon emissions. Here, we develop an energy system optimization model with high spatio-temporal resolution that integrates investment planning and operation optimization to explore transition pathways for the GHM power system under various decarbonization scenarios. Power system operations in hourly resolution are included to quantify spatio-temporal variability of generation and demand. We show that reducing carbon emissions by 70%, 85%, and 100% in 2050 requires a total system cost of 619.1, 628.3, and 653.1 billion USD (values in 2021 USD), with an average decarbonization cost of 4.79, 5.27, and 7.11 USD per ton, respectively. Accelerating transition to carbon neutrality by 2035 incurs a total system cost of 686.9 billion USD and an average decarbonization cost of 9.11 USD per ton. Moreover, nuclear, offshore-wind, and imported electricity cover over 80% of electricity demand when achieving carbon neutrality and thus serve as cornerstones for supporting the GHM power system transition. Furthermore, we observe that a high fossil fuel price benefits emission mitigation, while reinforcing transmission networks considerably reduces system transition costs. Combing low renewable and storage prices, a high electricity import ratio, and transmission network expansion delivers a lower bound for system transition and a negative average decarbonization cost for the GHM region.
Broader contextThe Guangdong–Hongkong–Macau (GHM) region is a pilot demonstration area for practicing China's economic and energy policies. How the GHM region can achieve a low-carbon transition is quite concerning, as its energy supply is mainly derived from fossil fuels. A successful and economic transition will set up an exemplar and provide important decarbonization experiences for other provinces or regions in China. Hence, this study develops an assessment model that integrates investment planning and operation optimization for exploring transition pathways for the GHM power system. Achieving carbon neutrality by 2050 requires an average annual expense of 21.8 billion USD, accounting for 0.94% of GHM's GDP in 2021, while accelerating the transition to carbon neutrality by 2035 incurs an increase in average annual expense of 5.18%. Considering its financial conditions, we believe the GHM region bears low pressure in realizing carbon neutrality in its power system. Nuclear, offshore-wind, and imported electricity are found to be essential for the power system low-carbon transition. Moreover, raising fossil fuel prices and enhancing transmission networks are beneficial for the low-carbon transition. The findings from this study provide a deep understanding on GHM power system decarbonization and valuable guidelines and insights to policymakers for drawing up energy and economic policies. |
1 Introduction
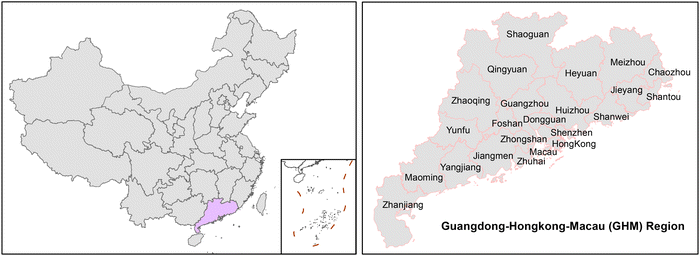
Stabilizing the global average temperature increase to well below 1.5–2 °C compared with previous industrial levels requires decreasing anthropogenic CO2 emissions to zero by around 2050.1 Many countries are planning to transition their energy systems from carbon-intensive ones to renewable dominated and deeply decarbonized systems.2–4 China, as the largest global CO2 emitter, pledged to achieve carbon emission peaking by 2030 and carbon neutrality by 2060.5 Many studies suggest the electricity sector, accounting for over 50% of coal consumption and 45% of carbon emissions in China, has to achieve carbon neutrality by 2050.6 The electricity consumption in China differs remarkably among provinces or regions. The southeastern provinces consume more than 40% of total electricity generation and contribute over 45% to national gross domestic products.7 Hence, low-carbon transition of power systems for these regions and provinces is of importance for realizing China's strategic decarbonization plans.The Guangdong–Hongkong–Macau (GHM) region, as a pilot demonstration area for China's reform and opening-up, is an essential window for other countries to study China's economic and energy policies. The GHM region is geographically located in Southern China as shown in Fig. 1, where economic, cultural, and technological connections among Guangdong, Hongkong, and Macau are very close. The gross domestic product of the GHM region exceeded 2.33 trillion USD in 2021 and was ranked the first among all China's provinces.8 The GHM region's energy demand continues to surge due to its prosperous economy and growing population. The installed capacity of fossil fuel power plants in the GHM region reaches 102.9 GW, of which coal-fired generation accounts for 69%.9,10 Over 70% of electricity generation was derived from coal and natural gas in 2021. Moreover, electricity imported from other provinces accounts for 19.3% of the electricity demand.11 The GHM region has been actively deploying renewable energies in recent years, emphasizing the importance of a power system transition. However, it is still unclear how the GHM power system can cost-effectively achieve low-carbon transition. Hence, the main goal of this study is to answer this question by determining optimal transition pathways for the GHM power system under various decarbonization scenarios. Such a real-world successful transition will provide a strong reference of demonstration for other provinces and regions in China or the world.
Power system transition requires coordinating investment planning and operation optimization for meeting variable electricity demand.12–14 Low-carbon transition of national-scale systems attracts great attention.15–17 Existing energy system models have been soft-linked to explore new system configurations18 and structural evolution19 during system transition. The impacts of technical and economic details,20 myopic decision-making,21 as well as disruptive and extreme climate events22,23 were quantified on transition pathways of national-scale power systems. Moreover, electricity supply cost trajectories,24 the value of regional coordination,25 and technological transformation speeds26 during low-carbon transition were examined for China, US, Europe, and Africa to unearth their decarbonization challenges and opportunities. The above studies, viewing each province or region in a country as a node during system planning, can provide valuable insights on decarbonization pathways for national power systems. However, one main question is how these pathways can guide local power system decarbonization. Power system planning in China is performed with each province as an entity, in which cities serve leading roles for deploying energy technologies. Each province carries out its power system planning with respect to cities based on its energy resources, energy infrastructure, and future electricity demand, and submits its planning results to the National Energy Administration (NEA) of China. The NEA examines each province' s planning based on future energy policy, energy availability, energy resource exploitation ability, and environmental carrying capacity, and then approves their respective power system planning. Under this circumstance, analyzing transition pathways of power systems with cities as nodes for important regions, especially those with great economic influence in a country such as the GHM region in China is of significance and should be given more attention.
There have been a few recent studies investigating low-carbon transition of regional power systems in China. Luo et al. analyzed deep decarbonization of the power system for Sichuan province, China, and found that a combination of imported electricity, biomass, wind power and solar photovoltaics could sustain its deep decarbonization.27 Zhang et al. developed an analytical framework for managing coal power phaseout strategies and comparing various decarbonization pathways of power systems in the Jilin province.28 Their findings showed that phasing out coal power earlier was economically feasible and beneficial for deep decarbonization. Luo et al. quantified the costs and benefits of decarbonizing the power system through carbon tax, and internalizing human health impacts into system planning.29 Since the stock of electric vehicles (EV) is increasing significantly in recent years, integrating EV with power systems improves renewable penetration.30,31 Chen et al. assessed the impacts of fleet types and charging modes on wind power penetration and power system decarbonization.32 Moreover, sector coupling via hydrogen was considered as an effective means for decarbonizing power systems.33 Lin et al. applied this concept to northern China and discussed infrastructure investments across electricity and hydrogen supply systems.34 These contributions addressed regional power system decarbonization; however, they generally consider a region as a single entity and seldom look into its detailed city-scale grid architecture. The city-scale grid topology and energy resource distribution in a region significantly impact regional power system decarbonization. To offer valuable insights toward carbon neutrality, city-scale spatial resolution should be used for studying power system transition of important regions such as the GHM region in China. A few studies have been carried out on transition pathways of the Greater Bay Area (GBA) in the GHM region. Luo et al. assessed the impacts of carbon emission trading on GBA transition pathways,35 while Zhou et al. simulated pathways towards a cleaner energy system in terms of energy supply and demand for GBA.36 However, GBA comprises only nine of twenty-two cities in the GHM region and thus is unable to give a full and comprehensive picture of the power system transition of the GHM region. Moreover, to our knowledge, there are few works investigating the transition pathways of power systems with a city as a node for the GHM region. Considering its huge economy scale and great influence in China, it is necessary to explore the potential transition pathways of power systems for the GHM region so as to provide practical guidelines and valuable insights to other provinces and regions in China and facilitate their decarbonization plans towards carbon neutrality.
Here, we develop an integrated investment planning and operation optimization model to study cost-effective transition pathways of power systems for the GHM region under various decarbonization scenarios. The model covers renewable resources evaluation, city-load forecasting, investment planning in generation, storage, and transmission infrastructure, as well as simulation of power system operations in hourly resolution. Four categories of scenarios are designed for transition pathway exploration. How generation, storage, and transmission facilities should be invested, how transmission network topology should be evolved, and how generation and storage technologies as well as transmission networks should be coordinated are analyzed in detail for realizing economic low-carbon transition of the GHM power system. Moreover, scenario and sensitivity analyses are performed to assess how the transition pathway changes when subject to system parameter variations, and some policy implication and conclusions are provided for facilitating GHM region decarbonization. Our developed methodology can be applied to other provinces and regions in China or the world to identify potential transition pathways for energy systems.
The remainder of this paper is organized as follows. The modeling framework and scenarios for studying GHM power system decarbonization are given in Section 2. Section 3 presents a thorough results discussion on transition pathways, while Section 4 provides some discussion and policy implication on the GHM region. Finally, conclusions and future works are drawn in Section 5.
2 Methods
2.1 GHM power system modeling
We develop an energy system optimization model (ESOM) that integrates investment planning and operation optimization to determine optimal transition pathways of the GHM power system under various decarbonization scenarios. We consider a set of potential generation and storage technologies for low-carbon transition of the GHM power system. Generation technologies comprise clean energy technologies and fossil-based technologies. Clean energy technologies consist of solar photovoltaics (PV), onshore wind turbines (onshore-wind), offshore wind turbines (offshore-wind), biomass, hydro, and nuclear, while fossil-based generation technologies are composed of combined cycle gas turbine (CCGT), combined cycle gas turbine with carbon capture and storage (CCGT-CCS), coal-fired generation (Coal), and coal-fired generation with carbon capture and storage (Coal-CCS). Moreover, pumped storage hydropower (PSH) and lithium batteries are included as energy storage technologies. Transmission networks here are modeled as power flows among cities, and transmission line lengths are quantified by the euclidean distance between centroids of two cities. The ESOM, allowing free investments and decommission of energy technologies, minimizes total system costs (TSC) to obtain cost-effective system designs and operation dispatch patterns over a given planning horizon (2021–2050) for the GHM power system, subject to constraints on the capacity availability of technologies, technology operation characteristics and boundaries, hourly electricity balance and system reserves, as well as annual limitations of electricity import and carbon emissions. Two classes of decision variables (investment and operation) are interlinked and simultaneously optimized to obtain a least-cost power system in ESOM. The investment decision variables include the possible installed capacities of generation and storage technologies as well as transmission lines for electricity import and inter-city power transmission, while the operation decision variables are the hourly power output of generation technologies, hourly stored energy and charging and discharging power of storage technologies, as well as the hourly power flows in transmission networks. The detailed model formulation for the GHM power system can be found in the ESI,† Section S3.![[thin space (1/6-em)]](https://www.rsc.org/images/entities/char_2009.gif) 49 for solar and 8 W m−2
49 for solar and 8 W m−2![[thin space (1/6-em)]](https://www.rsc.org/images/entities/char_2009.gif) 50 for onshore-wind, we can determine their respective capacity potentials for a city by aggregating each suitable site's installation capacity within its administrative boundary. For offshore-wind, this work considers only suitable installation sites (a water depth of shallower than 70 meters18) within GHM's exclusive economic zones (EEZ). The suitable sites are allocated to their nearest coastal cites, and a capacity density of 15 W m−2
50 for onshore-wind, we can determine their respective capacity potentials for a city by aggregating each suitable site's installation capacity within its administrative boundary. For offshore-wind, this work considers only suitable installation sites (a water depth of shallower than 70 meters18) within GHM's exclusive economic zones (EEZ). The suitable sites are allocated to their nearest coastal cites, and a capacity density of 15 W m−2![[thin space (1/6-em)]](https://www.rsc.org/images/entities/char_2009.gif) 50 is assumed to determine the offshore-wind potential capacity. The hourly solar and wind generation in a city can be computed by mapping their hourly capacity factors averaged from all suitable sites to their respective installed capacities. Details of the data and calculation procedures are given in the ESI,† Section S2.1–S2.3.
50 is assumed to determine the offshore-wind potential capacity. The hourly solar and wind generation in a city can be computed by mapping their hourly capacity factors averaged from all suitable sites to their respective installed capacities. Details of the data and calculation procedures are given in the ESI,† Section S2.1–S2.3.
Biomass is a valuable resource for low-carbon transition. The biomass considered in this work comprises agricultural biomass, forestry biomass, and urban waste. Agricultural biomass consists of residues of rice and sugarcane, as they account for more than 85% of food and economic crops in the GHM region.42 Forestry biomass is composed of residues from wood logging, processing, and lumbering, fuelwood processing, bamboo processing as well as urban greening. The data for assessing biomass potentials are obtained from the Guangdong Statistical Yearbook42 and Guangdong Statistical Yearbook on Agriculture.51 This work mainly follows Bi et al.'s52 and Fu et al.'s53 calculation procedures to assess biomass potentials, as further detailed in the ESI,† Section S2.4.
2.2 Model scenarios
China has submitted its nationally determined contributions (NDC) on emission mitigation and pledged to achieve carbon neutrality of the complete economy by 2060. Carbon neutrality is easier to achieve in the power sector than other sectors as there are relatively mature low-carbon generation technologies.54–56 Moreover, the power sector has to achieve carbon neutrality in advance of other sectors, i.e. manufacturing, chemical, and transportation, to provide zero-carbon electricity to help them realize carbon neutrality. Hence, in this paper, we assume the power sector achieves carbon neutrality by 2050, as a practical translation of China's future energy policies. Based on this assumption as well as the modeling formulation and data in Section 2, we simulate 4 categories and in total 31 specific scenarios to explore cost-effective pathways for low-carbon transition of the GHM power system. The abbreviation and detailed descriptions of various scenarios are shown in Table 1. The optimal investment plans and operation characteristics for energy technologies and transmission networks are investigated for the GHM region towards low-carbon transition.| Abbreviation | Description |
|---|---|
| (1) BAU | Meeting hourly power demand from 2021 to 2050 without fossil resources and carbon emissions limitation |
| (2) Optimal transition pathways | |
| CDM70, CDM85, CDM100 | Satisfying carbon emission limitation and hourly power demand by coordinating investment plans and operations of renewable, fossil and nuclear generations, storage systems, and electricity import for each city with all possible inter-city transmissions |
| (3) Ambitious transition pathways towards carbon neutrality | |
| CN35, CN40, CN45 | Achieving carbon neutrality in 2035, 2040, and 2045 under three emission trajectories |
| (4) Sensitivities on system parameters | |
| NTM | No transmission network expansion to showcase network expansion's importance |
| HFP | High fossil fuel (coal and natural gas) price trajectory (low availability of fossil fuels)57 |
| HRS | Conservative capital cost trajectories for renewable (solar and wind) and storage technologies58,59 |
| LRS | Advanced capital cost trajectories for renewable (solar and wind) and storage technologies58,59 |
| ECR | Electricity demand increases according to eletrification trajectory24 |
| LEI | Low electricity import ratio: 10% of system annual demand |
| HEI | High electricity import ratio: 30% of system annual demand |
| LSC | Low system costs: advanced capital cost trajectory for renewable and storage technologies + transmission network expansion + high electricity import ratio to provide a lower bound for system decarbonization |
3 Results
3.1 Optimal transition pathways for the GHM power system
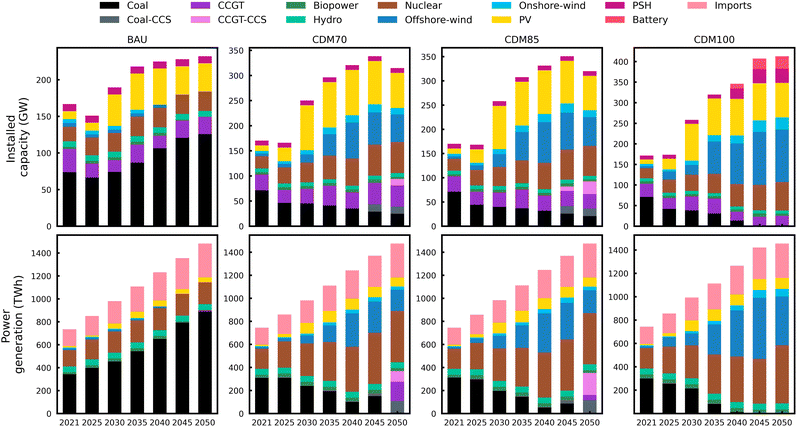
The optimal designs of the GHM power system in BAU, CDM70, CDM85, and CDM100 are shown in Fig. 3. Since no limitation is imposed on fossil fuel resources and carbon emissions, coal-fired generation in BAU features an aggressive expansion. As our ESOM allows capacity decommission of existing generation technologies, the installed capacity shows a mild decrease by 2025 to reduce system transition costs. However, electricity generation increases since generation technologies especially coal-fired generation can run for a longer time. The invested capacity of coal-fired generation increases by 95.4 GW to 125.7 GW between 2021 and 2050, and its produced power reaches 889.2 TW h, accounting for 60.3% of the power demand in 2050. CCGT, with a new installed capacity of 23.5 GW, produces only 10.6 TW h electricity in 2050 as a consequence of higher natural gas price. It mainly serves as a system reserve provider in BAU. Nuclear capacity rises by 9.8 GW to 26.6 GW from 2021 to 2050, and it delivers a constant power of 191.1 TW h since 2035. The power produced by coal-fired and nuclear generation accounts for 65.7–73.3% of electricity demand in a 30-years planning horizon. PV capacity rises by 27.7 GW to 38.5 GW; however, its produced power is relatively low (42.5 TW h) in 2050. As onshore- and offshore-wind is not invested under BAU, there is no wind power generation after they are decommissioned in 2045. BAU holds a TSC of 578.2 billion USD (values in 2021 USD60) and cumulative carbon emissions of 13.79 billion ton.CDM70 and CDM85 share many similarities in power system design. The capacity of coal-fired generation decreases significantly by 46.7 GW in CDM70 and 50.4 GW in CDM85, and its power generation under these two scenarios reduces from around 310.0 TW h in 2021 to 7.5 TW h and 5.4 TW h respectively in 2050 as a result of emission regulation. CCGT-CCS (12.9 GW vs. 26.4 GW) and Coal-CCS (14.1 GW vs. 15.4 GW) are invested after 2045 in both CDM70 and CDM85, aiming to lower power system emissions with minimum system costs. The power generation of CCGT-CCS and Coal-CCS in 2050 reaches 92.8 TW h and 100.0 TW h in CDM70 and 194.4 TW h and 108.7 TW h in CDM85. Since coal-fired generation reduces significantly, clean energy generation has to compensate for this power reduction. PV, onshore-wind, and offshore-wind capacities increase by 59.0 (60.2) GW, 7.6 (8.9) GW, and 49.7 (54.2) GW under CDM70 (CDM85), and their power generation rises by 6.4 (6.5) times to 77.1 (78.3) TW h, 3.4 (3.7) times to 28.6 (31.4) TW h, and 12.5 (13.4) times to 185.0 (199.7) TW h between 2021 to 2050. Moreover, their respective generation ramps up first due to new technology investments and ramps down later due to old technology decommission. The new invested capacity of nuclear technology is 45.0 GW under both scenarios, and its annual power generation is the same, varying from 174.8 TW h in 2021 to 444.2 TW in 2050. A major difference between CDM70 and CDM85 lies in CCGT, whose capacity and power generation in 2050 increase to 42.4 GW and 167.8 TW h under CDM70, but decreases to 29.8 GW and 46.9 TW h under CDM85. This mainly results from the stricter emission limitation of CDM85. The TSC and cumulative carbon emissions are 619.1 billion USD and 5.26 billion ton in CDM70 and 628.3 billion USD and 4.29 billion ton in CDM85.
CDM100 achieves zero-emission in 2050. The stringent regulation on emissions reduces the coal-fired generation capacity by 69.9 GW, while the new invested capacity of CCGT reaches 24.6 GW between 2021 and 2050. Both coal-fired and CCGT generation technologies are employed to provide system reserves after 2040. Consequently, massive investments of clean generation technologies are required for meeting the electricity demand. The new invested capacities of PV, onshore-wind, offshore-wind, and nuclear are 99.1 GW, 34.8 GW, 146.8 GW, and 52.5 GW, respectively. From 2021 to 2050, PV and onshore-wind generation increases by around 6.6 times to 92.1 TW h and 66.1 TW h, while offshore-wind and nuclear generation expands by 27.0 and 1.8 times to 417.7 TW h and 498.0 TW h. The penetration of renewable energies exceeds 43.0% after 2040, and 25.1 GW of PSH and 30.0 GW of lithium battery are invested to balance their fluctuation and intermittency. CDM100 features a TSC of 653.1 billion USD, with cumulative carbon emissions of 3.26 billion ton.
For these four scenarios, hydro and biomass capacities are relatively small, and their annual generation varies between 54.0 TW h and 85.6 TW h, accounting for 7.3% and 5.8% of GHM's demand in 2021 and 2050. This makes their installed capacities and generation nearly unchanged when compared with other technologies. New installation of energy storage technologies is unnecessary under BAU, CDM70, and CDM85, since combining existing PSH and transmission network expansion is sufficient to balance renewable intermittency. Moreover, CCGT-CCS and Coal-CCS are invested only in CDM70 and CDM85, as CCS becomes cost-competitive after 2045 under their emission trajectories. The imported electricity accounts for around 20% of the annual power demand from 2021 to 2050. Nuclear, offshore-wind, and imported electricity dominate generation mix under CDM70, CDM85, and CDM100, and thus are essential for low-carbon transition of the GHM power system.
The hourly dispatches of energy technologies under CDM70, CDM85, and CDM100 differ significantly from BAU as shown in the ESI,† Fig. S9–S12. Coal-fired generation dominates system daily power generation under BAU; however, it decreases remarkably in other scenarios from 2021 to 2050, especially in CDM100. Hourly dispatch patterns in seasonal days have much in common in CDM70 and CDM85. A major difference between the two scenarios lies in CCGT and CCGT-CCS generation, where CCGT-CCS produces more power than CCGT in CDM85, and vice versus in CDM70. The hourly coal-fired generation decreases significantly in CDM100, as evidenced by its low or zero generation after 2040 in Fig. 4. As a result, offshore-wind and nuclear generation has to increase to compensate power reduction from coal-fired generation. The hourly offshore-wind and nuclear generation in 2050 reaches 70.0 GW and 63.0 GW, respectively. New capacities of PSH and lithium battery are invested to help balance mismatches between electricity generation and demand. The PSH and lithium battery discharge power mainly during summer days after 2040 to meet the peak power demand. The GHM region mainly imports hydropower via west-to-east transmission corridors from China's southwestern provinces as shown in Fig. 6. The dispatchable hydropower is mainly supplied to high-load cites of the GHM region and can be used for peak-load regulation. Renewable and fossil-based generation technologies coordinate with the imported electricity, PSH, and lithium battery to satisfy the GHM power demand in the given planning horizon.
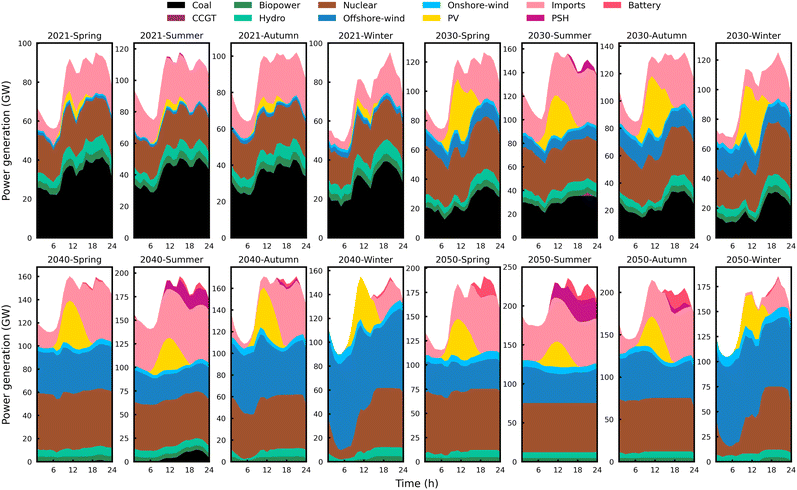 | ||
| Fig. 4 The hourly dispatches of energy technologies in spring, summer, autumn, and winter days from 2021 to 2050 in CDM100 scenario. | ||
3.2 Geographical distribution of energy infrastructure
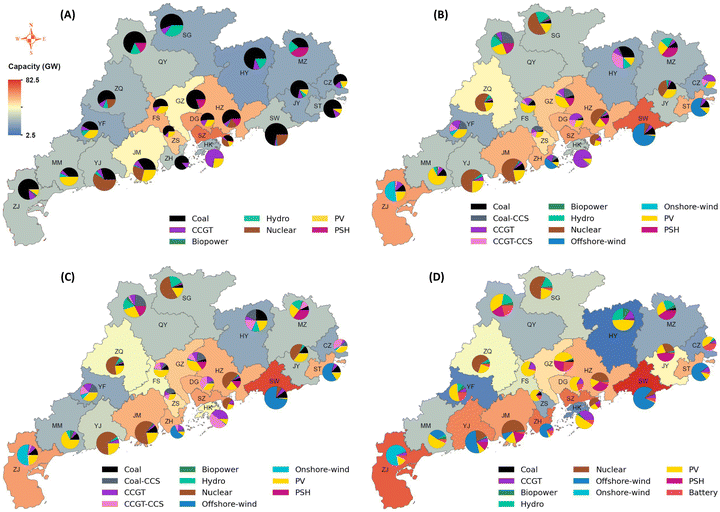
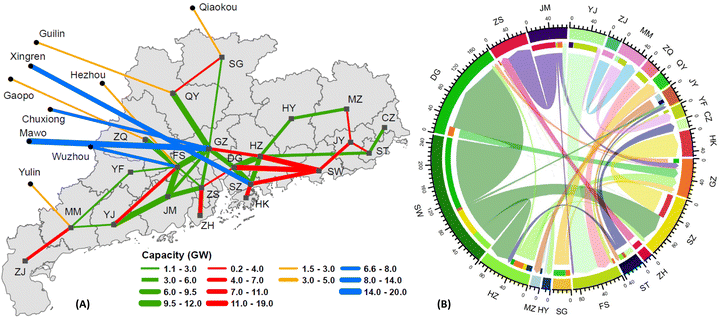
The geographical distribution of energy infrastructure is of great importance for enabling an economic transition of the GHM power system. The spatial distribution of generation and storage capacities in BAU, CDM70, CDM85, and CDM100 is shown in Fig. 5. The generation capacities are mainly invested in high-load cities in BAU: Guangzhou (12.8 GW), Shenzhen (30.8 GW), Foshan (21.2 GW), and Dongguan (27.1 GW), thus avoiding expensive construction of transmission lines from transmission network expansion. Moreover, coal-fired generation dominates the system capacity mix, as evidenced by its high retained capacity in nearly every city of the GHM region. However, because of emission regulation, its capacity is quite low and is retained in only a few cities in CDM70, CDM85, and CDM100, as illustrated in Fig. 5(B)–(D). Clean and low-carbon generation technologies are massively invested to enable power system transition. Shanwei and Zhanjiang are the two cites with the largest installed capacities in comparison with BAU. Specifically, their respective installed capacity reaches 82.4 GW and 41.9 GW under CDM100. Moreover, onshore-wind is installed only in Zhanjiang, while offshore-wind is mainly deployed in Shantou, Shanwei, and Zhuhai. New capacities of nuclear generation are invested in Shaoguan, Zhaoqing, and Jieyang, while existing nuclear generation is reinforced in Shenzhen, Huzhou, Yangjiang, and Jiangmen. Furthermore, 6.7 (4.1) GW CCGT-CCS and 2.8 (3.2) GW Coal-CCS are installed in Dongguan and Guangzhou respectively under CDM70 (CDM85). All of these aim to deliver a cost-effective low-carbon transition of the GHM power system under various scenarios.Low-carbon transition of the GHM power system requires substituting electricity sourced from fossil fuels by clean or renewable electricity. Transmission network expansion is needed for importing clean electricity and balancing spatio-temporal variability of renewable generation and demand, as shown in the ESI,† Fig. S13 and S14. The transmission lines for importing electricity are reinforced remarkably, as evidenced by their increased capacities in four scenarios. The line capacities of Xingren-Shenzhen and Mawo-Guangzhou account for over 65.4% of the total installed capacities for importing electricity. The capacities of transmission lines between cities expands gradually to allow more renewable energy integration when moving from BAU to CDM70, CDM85, and CDM100. For example, transmission lines connecting with Shanwei are reinforced for exporting more offshore-wind power to inland cities. Therefore, annual power flows between cities change significantly. The power exported from Shanwei increases from 43.0 TW h in BAU to 141.4 TW h in CDM100, as shown in Fig. 6. Moreover, more frequent power exchange among cities occurs when subject to stricter emission regulation, which in turn entails strengthened transmission networks. This leads to a structure evolution from “central” to “peripheral” in network topology, namely, coastal cities send renewable electricity to the GHM central region, as shown in Fig. 6.
3.3 Ambitious decarbonization pathways for the GHM power system
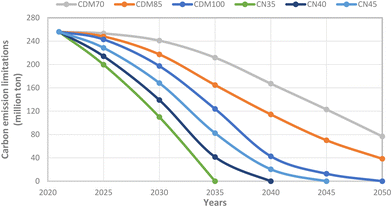
Ambitious decarbonization scenarios feature a more aggressive decommission plan for coal-fired generation than CDM100 as shown in Fig. 7. CN35, CN40, and CN45 fully decommission coal-fired generation in 2035, 2040, and 2045, respectively. Since PV and nuclear generation hold similar investment plans, onshore- and offshore-wind have to be deployed in a larger scale in CN35 than CN40 and CN45 for compensating power reduction from coal-fired generation. The invested capacities of onshore- and offshore-wind between 2021 and 2050 are 43.9 and 189.3 GW in CN35, 39.3 and 170.5 GW in CN40, and 34.2 and 153.1 GW in CN45. Energy storage systems, comprising PSH and lithium batteries, are sized to be larger in CN35 (79.6 GW) than CN40 (69.0 GW) and CN45 (61.8 GW) to balance power generation and demand. CN35 requires a smaller scale of gas-fired generation than CN40 and CN45, owing to the larger capacities of wind turbines and storage systems. The later incurs higher capital expenditure (CapEx), operation and maintenance (O&M) costs, and TSC. CN35, CN40, and CN45 have a TSC of 686.9, 676.8, and 663.2 billion USD, respectively, while their cumulative carbon emissions are 1.86, 2.28, and 2.76 billion ton, respectively.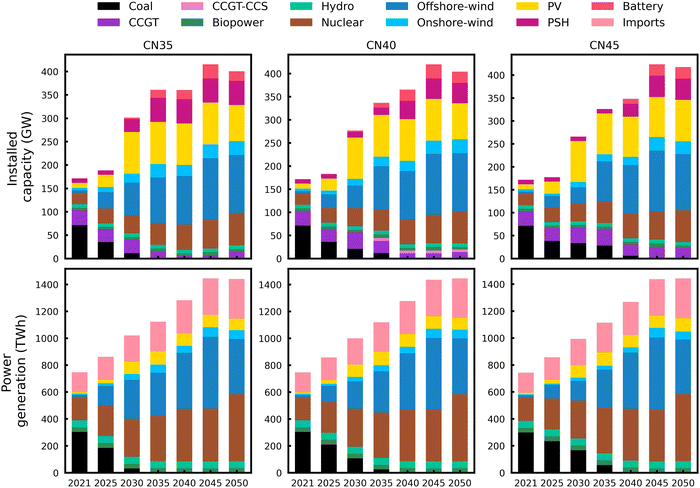 | ||
| Fig. 7 Optimal capacity and generation mix for the GHM power system from 2021 to 2050 in CN35, CN40, and CN45 scenarios. | ||
Though there exist some differences in the invested capacities of energy technologies, their spatial distributions under CN35, CN40, and CN45 are similar in 2050, as shown in the ESI,† Fig. S15. Onshore-wind is deployed in Zhanjiang, while offshore-wind is mainly installed in Shantou, Shanwei, and Zhuhai. Shanwei and Zhanjiang possess the largest installed capacities of energy technologies among all cites. Lithium battery is invested across 22 cities to balance mismatches between generation and demand. There are also many in common in transmission networks and annual power flows in CN35, CN40, and CN45, as shown in the ESI,† Fig. S16. Transmission lines, especially for importing electricity and exporting wind power from Shanwei and Zhangjiang, need to be reinforced significantly. The electric power exported from Shanwei differs less than 20 TW h among CN35, CN40, and CN45. Hence, we can conclude that achieving carbon neutrality ahead of schedule mainly impacts investment plans of renewable energies and system transition costs instead of final system configuration and transmission network topology for the GHM region.
3.4 Comparison of decarbonization scenarios towards low-carbon transition
The cost breakdown, average decarbonization costs (ADC), and average electricity costs (AEC) in seven decarbonization scenarios are summarized in Fig. 8. The TSC varies from 578.2 billion USD in BAU to 619.1, 628.3, 653.1, 663.2, 676.8, and 686.9 billion USD in CDM70, CDM85, CDM100, CN45, CN40, and CN35, with an increment ranging between 7.1% and 18.8%. Fossil O&M and FCS dominates TSC in BAU; however, their proportion decreases gradually from 36.0% in CDM70 to 16.8% in CN35 due to stricter emission regulation. Nuclear CapEx, FCS, and O&M remain nearly unchanged and total around 27.6% of TSC in CDM70 and CDM85, indicating nuclear generation exerts a similar impact on these decarbonization scenarios. Offshore-wind CapEx and O&M are nearly tripled from CDM70 to CN35, and their cost contribution accounts for 27.5% of TSC in CN35. Transmission O&M is remarkably higher than its CapEx, while storage O&M is lower than its CapEx under deep decarbonization scenarios. Moreover, CapEx and O&M become comparable when moving towards deep decarbonization. As the power system transits from a fossil-intense system to a deeply decarbonized one, CapEx and O&M of fossil-based technologies decrease, while renewable CapEx and O&M increase. The deeper and earlier the system decarbonization, the faster the fossil-based technologies are decommissioned, leading to a faster decrease in their CapEX and O&M, and the greater the renewable CapEx and O&M are required. Their variation trends offset each other, resulting in a comparable CapEX and O&M during system transition. The ADC increases from 4.79 USD per ton in CDM70 to 9.11 USD per ton in CN35, with a clear leap between CDM85 and CDM100. This mainly results from stricter emission limitation of CDM100, calling for more investments in renewable technologies, especially offshore-wind. The AEC varies from 17.30 USD per MW h to 20.56 USD per MW h between BAU and CN35.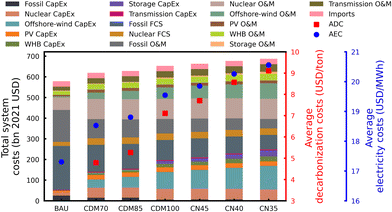 | ||
| Fig. 8 Cost breakdown of various decarbonization scenarios and their associated average decarbonization and electricity costs. WHB denotes onshore-wind, hydro, and biomass, while FCS represents the fuel consumption costs. The formula for calculating the average electricity and decarbonization costs can be found in Section S3.5 in the ESI.† | ||
3.5 Sensitivity analysis for decarbonization pathways
High fossil fuel price (HFP) has a marginal impact on TSC in CDM70, CDM85, and CDM100 as shown in the ESI,† Fig. S17 and Fig. 9. TSC increases only by 2.9 billion USD in CDM100 and 5.7 billion USD in CDM70. However, its impact on lowering system carbon emissions is of significance. Emission reduction varies from 300.0 million ton in CDM100 to over 1000.0 million ton in CDM70. This is mainly because CDM70 has a higher annual emission threshold and thus its fossil-based generation is more sensitive to fossil fuel price variation. Moreover, HFP forces CCGT to become a reserve provider from 2021 to 2040 in CDM70, and renders coal-fired plants to produce only 6.7 TW h electric power in 2050, despite possessing a capacity of 25.9 GW, as shown in the ESI,† Fig. S18.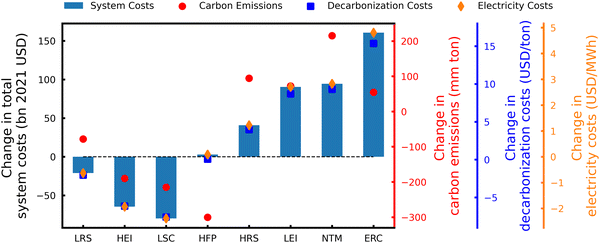 | ||
| Fig. 9 Changes in system costs, carbon emissions, decarbonization costs, and electricity costs in sensitivity analysis under CDM100 scenario. The changes are relative to the reference scenario, CDM100, which has a total system cost of 653.1 billion USD, carbon emissions of 3.26 billion ton, average decarbonization cost of 7.11 USD per ton, and average electricity cost of 19.55 USD per MW h. Table 1 provides a detailed description on scenario names. | ||
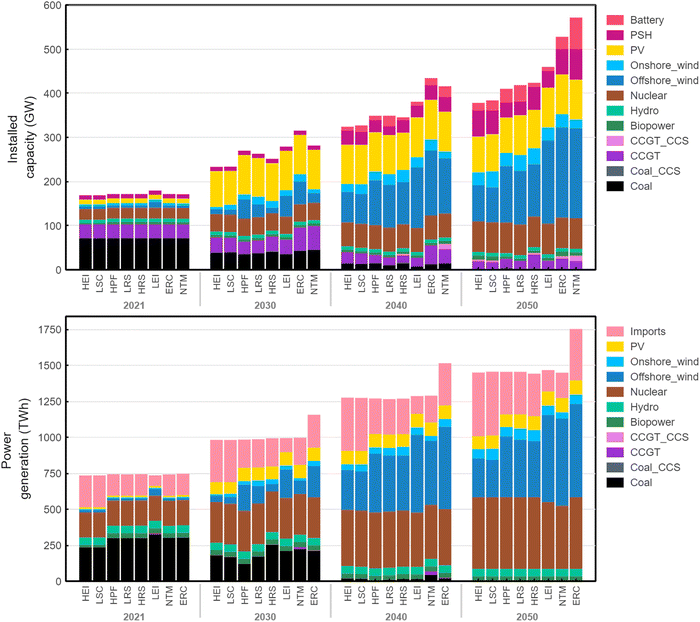
Renewable and storage price has a more profound impact on TSC in CDM100 than the other two scenarios. A low (high) renewable and storage price leads to a greater decrease (increase) in TSC under CDM100, since its stricter emission regulation calls for more investments in capacities from renewable or storage technologies, as presented in Fig. 10. Moreover, a low renewable and storage price (LRS) is favorable for battery deployment, while a high renewable and storage price (HRS) is beneficial for PSH installation, as evidenced by their respective capacities (36.4 GW vs. 53.2 GW) in 2050. Regarding CDM70 and CDM85, HRS excludes possible deployment of new storage technologies, while LRS favors only battery installation, as shown in the ESI,† Fig. S18 and S19. The installed capacity of the battery reaches 16.0 GW in CDM70 and 21.2 GW in CDM85. Furthermore, since CDM70 and CDM85 allow accommodation of more capacities of cheaper fossil-based technologies, LRS (HRS) results in a milder decrease (increase) in their TSC and a sharper reduction (rise) in their carbon emissions than CDM100, as shown in the ESI,† Fig. S17. Similar variation trends are also observed for ADC and AEC among CDM70, CDM85, and CDM100.
The performance of the GHM power system is significantly affected by electrification, electricity import ratio, and transmission network expansion. More generation capacities, either fossil-based or renewable, need to be deployed to satisfy the increased power demand incurred by electrification. For example, CCGT and CCGT-CCS capacities in CDM70 increase to 56.8 and 32.0 GW, respectively, as illustrated in the ESI,† Fig. S18, while offshore-wind and storage capacities in CDM100 rise to 204.5 and 84.2 GW, respectively, as presented in Fig. 10. Moreover, CDM70, CDM85, and CDM100 possess a total installed capacity of 376.2, 391.6, and 528.0 GW in 2050, respectively. Hence, CDM100 has a larger increase in TSC than CDM85 and CDM70 as shown in Fig. 9 and Fig. S17 in the ESI.† However, due to their looser emission restrictions, CDM70 and CDM85 have a larger increase in carbon emissions than CDM100. ADC and AEC feature a maximum increase among all sensitivity scenarios due to electrification. ADC increases by 16.98 USD per ton in CDM70, whereas AEC rises by 4.80 USD per MW h in CDM100.
Either a high electricity import ratio (HEI) or low electricity import ratio (LEI) requires deploying a large-scale storage system in CDM100 as shown in Fig. 10. The storage system is employed to store excess imported electricity under HEI; however, it is used to balance renewable intermittency under LEI, as offshore-wind capacity increases to 188.4 GW. HEI (LEI) entails a power system less (more) reliant on local energy infrastructure, and thus incurs a decrease (increase) in TSC and carbon emissions. However, due to their higher annual emission thresholds, CDM85 and CDM70 have a larger decrease (increase) in carbon emissions than CDM100 when subject to a high (low) electricity import ratio, as shown in the ESI,† Fig. S17 and Fig. 9.
Power system planning with no transmission network expansion (NTM) requires an intensive investment in generation and storage technologies to balance the spatio-temporal variability of generation and demand. The total installed capacity in CDM100 reaches 571.7 GW, which is nearly 60% higher than that in CDM70, as illustrated in Fig. 10 and Fig. S18 in the ESI.† This results in an increase in both TSC and carbon emissions in CDM70, CDM85, and CDM100, as shown in the ESI,† Fig. S17 and Fig. 9. The TSC increases by 94.4 billion USD in CDM100 and 54.6 billion USD in CDM70. CDM70 features a larger increase in carbon emissions than CDM100, as its higher emission threshold allows more generation from fossil-based technologies. Moreover, ADC and AEC increase by 9.30 USD per ton and by 2.82 USD per MW h under CDM100.
Combining a low renewable and storage price, a high electricity import ratio, and transmission network expansion delivers a lower bound for power system decarbonization as shown in the ESI,† Fig. S17 and Fig. 9. TSC decreases by 79.8 billion USD in CDM100, while carbon emissions reduce by 347.4 million in CDM70. Negative decarbonization costs occur in CDM100, CDM85, and CDM70, as combining these three factors renders their respective TSC even lower than that in BAU. Their ADC and AEC feature a maximum reduction among all sensitivity scenarios: ADC decreases by 8.10 USD per ton in CDM70, while AEC reduces by 2.39 USD per MW h in CDM100.
4 Discussions and policy implications
We develop a high spatio-temporal resolution ESOM to study various low-carbon transition pathways for the GHM power system. Our results show that when transiting from CDM70 to CDM100, TSC increases from 619.1 to 653.1 billion USD, which indicates the GHM power system can achieve low- or zero-emission in 2050 by raising an annual average expense of 20.6–21.8 billion USD. The GHM region bears low financial burden in achieving these decarbonization goals, considering its gross domestic product exceeds 2.33 trillion USD in 2021.8 Moreover, accelerating the transition speed towards carbon neutrality will not incur heavy financial burden, since TSC increases by only 33.8 billion USD from CDM100 to CN35. Hence, we recommend the GHM power system to realize carbon neutrality before 2050 to establish an exemplar and provide decarbonization experiences for other provinces and regions in China. However, it is worth noting that some cities in the eastern, western, and northern GHM regions, due to their underdeveloped economies, may have difficulties in raising funding for low-carbon transition. Bearing this in mind, policymakers should offer them more financial support to address energy justice issues among cities during system transition.Nuclear, offshore-wind, and transmission network expansion are essential for low-carbon transition of the GHM power system. By 2050, 62.0% of annual electricity generation will be derived from nuclear (33.7%) and offshore-wind (28.3%). Hence, we can conclude that nuclear and offshore-wind will become fundamental blocks for system decarbonization, and enhancing their technology performance and reducing their capital costs are of importance for facilitating system transition. Moreover, expanding inter-city transmission and electricity import networks is beneficial for power system low-carbon transition. We find that TSC decreases by 54.6–94.4 billion USD when considering transmission network expansion. The latter allows integration of more offshore-wind power and higher electricity import ratio, which transforms the power transmission pattern from only “west-to-east” transmission into “peripheral-to-central” transmission, namely, sending electricity from coastal cities and importing electricity from western cites to the GHM central region. New investments in energy infrastructure as planned are necessary to guarantee this transformation and system transition.
Two kinds of storage technologies, PSH and lithium batteries, are considered in this work for balancing renewable intermittency. We find that future changes in storage prices can significantly affect transition costs of the GHM power system. Hydrogen storage technology is promising for low-carbon transition and can be included in the GHM power system for mutual complementarity. However, hydrogen is a secondary energy, and converting renewable electricity to hydrogen via electrolysis and reconverting it back into electricity through thermal or electrochemical processes incurs substantial loss in energy efficiency. Moreover, hydrogen storage involves hydrogen production, storage, transportation, and utilization. Hydrogen storage and transportation technologies are immature, incurring hydrogen storage technology economically uncompetitive. Further breakthroughs in hydrogen storage technology can amplify its influences on decarbonizing not only the power sector but also other hard-to-abate sectors, i.e. transportation, iron and steel, chemical, and heating sectors.61 This allows us to determine cost-effective transition pathways for the GHM region via multi-sector coupling, and obtain a more comprehensive understanding on system-wide decarbonization.
5 Conclusions and future works
As a demonstration area with prosperous economic prospects for implementing pilot reforms, the GHM region's decarbonization has become an area of interest. Transition pathways, accounting for practical operation constraints of the GHM energy system, are needed for scrutinizing its decarbonization. This paper developed a detailed assessment model that integrates investment planning and hourly operation optimization to determine cost-effective transition pathways for the GHM power system under various decarbonization scenarios. The pathways unearth optimal planning of generation, storage, and transmission infrastructure as well as their hourly operation profiles towards low-carbon transition. Our results show that it is economically feasible for the GHM power system to achieve carbon neutrality by 2050. The annual average expense for achieving carbon neutrality in 2050 and 2035 is 21.8 and 22.9 billion USD, totaling 653.1 and 686.9 billion USD, respectively. Considering its prosperous economy, we recommend the GHM power system achieve carbon neutrality earlier than 2050 to provide some decarbonization experiences for other provinces and regions in China. Nuclear, offshore-wind, and imported electricity play important roles in decarbonizing the GHM power system. The findings show that nuclear and offshore-wind generation plus imported electricity accounts for over 82.0% of the annual power demand by 2050. Hence, enhancing nuclear and offshore-wind performance is of essence for system decarbonization. Moreover, transmission line capacities should be reinforced for absorbing more offshore-wind power and importing more electricity, which incurs a shift in transmission paradigm from “west-to-east” transmission to “peripheral-to-central” transmission. New storage technologies are deployed only for decarbonization scenarios achieving zero emissions, as existing storage capacities in these scenarios are insufficient for balancing mismatches between generation and demand.This study also examines the impacts of parameter variation on GHM power system decarbonization. A high fossil fuel price incurs a marginal increase in total transition costs; however, it greatly mitigates system carbon emissions by prioritizing deployment of renewable technologies. High and low electricity import ratios require installing large-scale storage technologies for storing excess electricity and balancing generation and demand. Transmission network expansion has a significant impact on system decarbonization, excluding which during system planning incurs intensive investments in generation and storage technologies for meeting spatio-temporal variable power demand. Combining all these favorable factors delivers a lower bound for decarbonizing the GHM power system, setting up a reference with minimal total system costs and providing valuable insights into the low-carbon transition of the GHM power system for policymakers. Our developed methodology can be applied to other provinces and regions in China or the world for investigating energy system transition pathways.
Though this work employs state-of-the-art energy system modeling techniques to study various decarbonization pathways of the GHM power system, achieving a fully decarbonized power system is highly complex, and additional studies are needed to fill the research gaps in understanding how various factors impact system decarbonization and what their costs are of achieving carbon neutrality in power systems. This study does not consider the following factors during low-carbon transition of the GHM power system. (1) The capital costs of energy technologies are intrinsically endogenous and elastic to demand. Ignoring this intrinsic nature leads to myopic decisions on investments of energy technologies and in turn costlier or even infeasible decarbonization pathways. (2) The industrial production capacity of energy technologies depends on the availability of critical material resources. The production of renewable and storage technologies heavily relies on critical materials, especially critical and rare metals.62–65 Neglecting the ramifications of critical material scarcity on production capacity may incur higher financial costs or even infeasible system expansion and operation. (3) The deployment of energy technologies and their associated costs are impacted by a number of external factors unknown before realization. Appropriately quantifying these factors can increase resilience of decarbonization pathways to future uncertainties and risks. (4) Electricity demand is coupled with socio-economic developments, and extrapolation from only historical load trends overlooks their intense mutual interaction. (5) Electricity demand can be reduced by implementing demand mitigation options.66 Fully utilizing the potential of demand mitigation options helps alleviate growth trends in electricity consumption and benefits low-carbon transition. Moreover, neglecting other constraining factors such as conflicts over land-use, social opposition to certain energy technologies, and ecological constraints in naturally protected areas would inevitably incur a higher real-word cost for low-carbon transition of energy systems. Hence, our scenarios could be interpreted as a benchmark for studying cost-effective transition pathways of power systems for the GHM region.
Future studies can focus on integrating these important factors into energy system modeling to obtain a better understanding of the GHM power system decarbonization. The endogenous nature of the costs of technologies can be modeled by cost learning curves and piecewise approximation.67 Computable general equilibrium (CGE) models can consider various socio-economic factors for electricity demand prediction. However, CGE models are very complex, and another good method is to establish a few simple correlations mapping electricity demand with important socio-economic factors for demand prediction. Moreover, we can analyze how resource scarcity impacts industrial production capacity on a yearly basis, establish some relationships correlating production capacity with critical material resources, and including them as constraints during model formulation. For demand mitigation, we can perform a comprehensive analysis to assess the impacts of energy efficiency measures, digital technologies, and demand response on reducing electricity consumption. We can improve the energy efficiency of energy sectors using advanced energy technologies, employing state-of-the art digital technologies to digitize energy consumption processes for precise energy provision, and adopt incentive- or price-based demand response programs to change the energy consumption behaviors of consumers. To quantify uncertainties in the deployment of technologies and their costs, we can divide a given planning horizon into several stages, use sampling method to construct a set of scenarios to capture capacity and price variations of energy technologies in each stage, and develop a scenario-based multi-stage stochastic programming framework to study power system transition pathways. We hope to develop an integrated energy system modeling platform that considers all of these factors for investigating energy system transition pathways and providing practical guidelines and valuable insights on decarbonization to energy system planners and policymakers.
Conflicts of interest
The authors declare no competing interests.Acknowledgements
The authors acknowledge financial support from the Shanghai Pujiang Program under Grant No. 22PJ1407000, the National Natural Science Foundation of China under Grant No. 72004005, the Basic Scientific Research Fund of Central Universities under Grant No. YWF-23-JT-103, and the Gates Ventures LLC through a gift provided to Carnegie Institution for Science.References
- Intergovernmental Panel on Climate Change, Global Warming of 1.5 °C, 2018, https://www.ipcc.ch/sr15/.
- D. B. Howard, R. Soria, J. The, R. Schaeffer and J. D. Saphores, The energy-climate-health nexus in energy planning: A case study in Brazil, Renewable Sustainable Energy Rev., 2020, 132, 110016 CrossRef.
- M. O. Dioha and A. Kumar, Exploring sustainable energy transitions in sub-Saharan Africa residential sector: The case of Nigeria, Renewable Sustainable Energy Rev., 2020, 117, 109510 CrossRef.
- R. Dominguez, M. Carrion and G. Oggioni, Planning and operating a renewable-dominated European power system under uncertainty, Appl. Energy, 2020, 258, 113989 CrossRef.
- United Nations News, China headed towards carbon neutrality by 2060, 2021, https://news.un.org/en/story/2021/09/1100642.
- China Electricity Council. Annual development report of China's power industry, China Architecture and Building Press, 2021.
- National Bureau of Statistics, China Stitiscal Yearbook, 2021.
- National Bureau of Statistics of China, National Data, 2022, https://data.stats.gov.cn/easyquery.htm?cn=E0103.
- Global Energy Monitor, Global Coal Plant Tracker, 2022, https://globalenergymonitor.org/projects/global-coal-plant-tracker/.
- Energy Bureau of Guangdong Province, The 14th Five-Year Plan of Guangdong Province on Energy Development, 2020.
- D. Zhao, The visions and goals of carbon emission peaking in the 14th Five-Years Planing of Guandong–Hongkong–Macau region, Guangzhou Institute of Energy Conversion, Chinese Academy of Sciences, 2020 Search PubMed.
- X. Yang, J. Pang, F. Teng, R. Gong and C. Springer, The environmental co-benefit and economic impact of China's low-carbon pathways: Evidence from linking bottom-up and top-down models, Renewable Sustainable Energy Rev., 2021, 136, 110438 CrossRef CAS.
- H. A. Daggash and N. Mac Dowell, Delivering low-carbon electricity systems in sub-Saharan Africa: insights from Nigeria, Energy Environ. Sci., 2021, 14(7), 4018–4037 RSC.
- S. Luo, W. Hu, W. Liu, Z. Zhang, C. Bai and Q. Huang, et al., Study on the decarbonization in China's power sector under the background of carbon neutrality by 2060, Renewable Sustainable Energy Rev., 2022, 166, 112618 CrossRef CAS.
- A. Galan-Martin, C. Pozo, A. Azapagic, I. E. Grossmann, N. Mac Dowell and G. Guillen-Gosalbez, Time for global action: an optimised cooperative approach towards effective climate change mitigation, Energy Environ. Sci., 2018, 11(3), 572–581 RSC.
- O. Lugovoy, S. Gao, J. Gao and K. Jiang, Feasibility study of China's electric power sector transition to zero emissions by 2050, Energy Econ., 2021, 96, 105176 CrossRef.
- S. Song, P. Liu and Z. Li, Low carbon transition of China's electric and heating sector considering reliability: A modelling and optimization approach, Renewable Sustainable Energy Rev., 2022, 169, 112904 CrossRef.
- M. Zeyringer, J. Price, B. Fais, P. H. Li and E. Sharp, Designing low-carbon power systems for Great Britain in 2050 that are robust to the spatiotemporal and inter-annual variability of weather, Nat. Energy, 2018, 3(5), 395–403 CrossRef CAS.
- H. A. Daggash and N. Mac Dowell, Structural Evolution of the UK Electricity System in a below 2 °C World, Joule, 2019, 3(5), 1239–1251 CrossRef.
- S. Zhang and W. Chen, Assessing the energy transition in China towards carbon neutrality with a probabilistic framework, Nat. Commun., 2022, 13(1), 87 CrossRef CAS PubMed.
- C. F. Heuberger, I. Staffell, N. Shah and N. Mac Dowell, Impact of myopic decision-making and disruptive events in power systems planning, Nat. Energy, 2018, 3(8), 634–640 CrossRef.
- E. Spyrou, B. F. Hobbs, M. D. Bazilian and D. Chattopadhyay, Planning power systems in fragile and conflict-affected states, Nat. Energy, 2019, 4(4), 300–310 CrossRef.
- J. A. Bennett, C. N. Trevisan, J. F. DeCarolis, C. Ortiz-Garcia, M. Peirez-Lugo and B. T. Etienne, et al., Extending energy system modelling to include extreme weather risks and application to hurricane events in Puerto Rico, Nat. Energy, 2021, 6(3), 240–249 CrossRef.
- Z. Zhuo, E. Du, N. Zhang, C. P. Nielsen, X. Lu and J. Xiao, et al., Cost increase in the electricity supply to achieve carbon neutrality in China, Nat. Commun., 2022, 13(1), 3172 CrossRef CAS PubMed.
- P. R. Brown and A. Botterud, The value of inter-regional coordination and transmission in decarbonizing the US electricity system, Joule, 2021, 5(1), 115–134 CrossRef.
- M. Victoria, E. Zeyen and T. Brown, Speed of technological transformations required in Europe to achieve different climate goals, Joule, 2022, 6(5), 1066–1086 CrossRef CAS.
- S. Luo, W. Hu, W. Liu, X. Xu, Q. Huang and Z. Chen, et al., Transition pathways towards a deep decarbonization energy system - A case study in Sichuan, China, Appl. Energy, 2021, 302, 117507 CrossRef CAS.
- W. Zhang, Z. Meng, J. Yang, Y. Song, Y. Zhou and C. Zhao, et al., Managing the phaseout of coal power: A comparison of power decarbonization pathways in Jilin Province, Resour., Conserv. Recycl., 2022, 180, 106216 CrossRef.
- Q. Luo, B. Copeland, F. Garcia-Menendez and J. X. Johnson, Diverse pathways for power sector decarbonization in Texas yield health cobenefits but fail to alleviate air pollution exposure inequities, Environ. Sci. Technol., 2022, 56(18), 13274–13283 CrossRef CAS PubMed.
- Y. Xu, S. Colak, E. C. Kara, S. J. Moura and M. C. Gonzalez, Planning for electric vehicle needs by coupling charging profiles with urban mobility, Nat. Energy, 2018, 3(6), 484–493 CrossRef.
- F. Manriquez, E. Sauma, J. Aguado, S. de la Torre and J. Contreras, The impact of electric vehicle charging schemes in power system expansion planning, Appl. Energy, 2020, 262, 114527 CrossRef.
- X. Chen, H. Zhang, Z. Xu, C. P. Nielsen, M. B. McElroy and J. Lv, Impacts of fleet types and charging modes for electric vehicles on emissions under different penetrations of wind power, Nat. Energy, 2018, 3(5), 413–421 CrossRef CAS.
- G. He, D. S. Mallapragada, A. Bose, C. F. Heuberger-Austin and E. Gencer, Sector coupling via hydrogen to lower the cost of energy system decarbonization, Energy Environ. Sci., 2021, 14(9), 4635–4646 RSC.
- H. Lin, Q. Wu, X. Chen, X. Yang, X. Guo and J. Lv, et al., Economic and technological feasibility of using power-to-hydrogen technology under higher wind penetration in China, Renewable Energy, 2021, 173, 569–580 CrossRef CAS.
- Y. Luo, W. Wang and D. Zhao, The impacts of carbon emission trading mechanism on the power transition pathway -taking Guangdong-Hong Kong-Macao Greater Bay Area as an example, J. Cleaner Prod., 2022, 330, 129894 CrossRef CAS.
- Y. Zhou, T. Wei, S. Chen, S. Wang and R. Qiu, Pathways to a more efficient and cleaner energy system in Guangdong-Hong Kong-Macao Greater Bay Area: A system-based simulation during 2015-2035, Resour., Conserv. Recycl., 2021, 174, 105835 CrossRef.
- Guangdong Provincial Development and Reform Commission, Energy Bureau of Guangdong Province, 2022.
- Energy Bureau of Guangdong Province, The onshare wind generation development plan of Guangdong Province: 2016–2030, 2016.
- Energy Bureau of Guangdong Province, The offshare wind generation development plan of Guangdong Province: 2017–2030, 2017.
- Power Scheduling and Control Center, China Southern Power Grid Corporation, China Southern Power Grid Opeartion Manners, 2015.
- Y. Wang, T. Wu, H. Li, M. Skitmore and B. Su, A statistics-based method to quantify residential energy consumption and stock at the city level in China: The case of the Guangdong-Hong Kong-Macao Greater Bay Area cities, J. Cleaner Prod., 2020, 251, 119637 CrossRef.
- Statistics Bureau of Guangdong Province, Guangdong Statistical Yearbook, 2019.
- R. Gelaro, W. McCarty, M. J. Suarez, R. Todling, A. Molod and L. Takacs, et al., The Modern-Era Retrospective Analysis for Research and Applications, Version 2 (MERRA-2), J. Clim., 2017, 30(14), 5419–5454 CrossRef PubMed.
- F. Feng and K. Wang, Does the modern-era retrospective analysis for research and applications-2 aerosol reanalysis introduce an improvement in the simulation of surface solar radiation over China?, Int. J. Climatol., 2019, 39(3), 1305–1318 CrossRef.
- A. P. Dobos, PVWatts version 5 manual, National Renewable Energy Lab.(NREL), Golden, CO (United States), 2014 Search PubMed.
- Chinese Academy of Sciences, 2018 Land Utilization in China, Remote Sensing Data. Resource and Environment Science and Data Center, Chinese Academy of Sciences, 2019, https://www.resdc.cn/data.aspx?DATAID=264.
- Chinese Academy of Sciences, DEM 90m Data by Province, Resource and Environment Science and Data Center, Chinese Academy of Sciences, 2018, https://www.resdc.cn/data.aspx?DATAID=284.
- Chinese Academy of Sciences, Landform Types Distribution in China, 1 Million Resolution, Resource and Environment Science and Data Center, Chinese Academy of Sciences, 2010, https://www.resdc.cn/data.aspx?DATAID=124.
- M. Li, E. Virguez, R. Shan, J. Tian, S. Gao and D. Patino-Echeverri, High-resolution data shows China's wind and solar energy resources are enough to support a 2050 decarbonized electricity system, Appl. Energy, 2022, 306, 117996 CrossRef.
- T. Trondle, J. Lilliestam, S. Marelli and S. Pfenninger, Trade-offs between geographic scale, cost, and infrastructure requirements for fully renewable electricity in Europe, Joule, 2020, 4(9), 1929–1948 CrossRef PubMed.
- Statistics Bureau of Guangdong Province, Guangdong Statistical Yearbook on Agcriculture, 2019.
- Y. Bi, C. Gao, Y. Wang and B. Li, Estimation of straw resources in China, Trans. Chin. Soc. Agcricultural Eng., 2009, 25(12), 211–217 Search PubMed.
- T. Fu, W. Bao and G. Xie, Methods for assessing resources of forestry residues, Chin. J. Biotechnol., 2018, 34(9), 1500–1509 Search PubMed.
- A. Lawson, Decarbonizing U.S. Power, C2ES Climate Innovation 2050, 2018, https://www.c2es.org/document/decarbonizing-u-s-power/.
- J. D. Jenkins, M. Luke and S. Thernstrom, Getting to Zero Carbon Emissions in the Electric Power Sector, Joule, 2018, 2(12), 2498–2510 CrossRef.
- E. Papadis and G. Tsatsaronis, Challenges in the decarbonization of the energy sector, Energy, 2020, 205, 118025 CrossRef CAS.
- W. J. Cole, D. Greer, P. Denholm, A. W. Frazier, S. Machen and T. Mai, et al., Quantifying the challenge of reaching a 100% renewable energy power system for the United States, Joule, 2021, 5(7), 1732–1748 CrossRef.
- National Energy Adminstration, Manual of Renewable Energy Data, 2015, https://www.docin.com/p-1445847621.html.
- National Renewable Enegy Laboratory, Annual Technology Baseline, 2022, https://atb.nrel.gov/electricity/2021/data.
- D. L. McCollum, W. Zhou, C. Bertram, H. S. de Boer, V. Bosetti and S. Busch, et al., Energy investment needs for fulfilling the Paris Agreement and achieving the Sustainable Development Goals, Nature Energy, 2018, 3(7), 589–599 CrossRef.
- X. Yang, C. P. Nielsen, S. Song and M. B. McElroy, Breaking the hard-to-abate bottleneck in China's path to carbon neutrality with clean hydrogen, Nat. Energy, 2022, 7(10), 955–965 CrossRef CAS.
- A. Valero, A. Valero, G. Calvo and A. Ortego, Material bottlenecks in the future development of green technologies, Renewable Sustainable Energy Rev., 2018, 93, 178–200 CrossRef.
- I. de Blas, M. Mediavilla, I. Capellan-Perez and C. Duce, The limits of transport decarbonization under the current growth paradigm, Energy Strategy Rev., 2020, 32, 100543 CrossRef.
- J. Li, K. Peng, P. Wang, N. Zhang, K. Feng and D. Guan, et al., Critical Rare-Earth Elements Mismatch Global Wind-Power Ambitions, One Earth, 2020, 3(1), 116–125 CrossRef.
- A. Renner and M. Giampietro, Socio-technical discourses of European electricity decarbonization: Contesting narrative credibility and legitimacy with quantitative story-telling, Energy Res. Soc. Sci., 2020, 59, 101279 CrossRef.
- F. Creutzig, L. Niamir, X. Bai, M. Callaghan, J. Cullen and J. Diaz-Jose, et al., Demand-side solutions to climate change mitigation consistent with high levels of well-being, Nat. Clim. Change, 2021, 12(1), 36–46 CrossRef.
- E. S. Rubin, I. M. L. Azevedo, P. Jaramillo and S. Yeh, A review of learning rates for electricity supply technologies, Energy Policy, 2015, 86, 198–218 CrossRef.
Footnote |
| † Electronic supplementary information (ESI) available. See DOI: https://doi.org/10.1039/d3ee02181e |
| This journal is © The Royal Society of Chemistry 2024 |

