
 Open Access Article
 This Open Access Article is licensed under a
 Creative Commons Attribution 3.0 Unported Licence
Method development and analysis of nanoparticle size fractions from tire-wear emissions†
Molly
Haugen
 a,
Philipp
Bühler
b,
Stefan
Schläfle
b,
David
O'Loughlin
ac,
Siriel
Saladin
a,
Chiara
Giorio
a and
Adam
Boies
*a
a,
Philipp
Bühler
b,
Stefan
Schläfle
b,
David
O'Loughlin
ac,
Siriel
Saladin
a,
Chiara
Giorio
a and
Adam
Boies
*a
aUniversity of Cambridge, Cambridge, UK. E-mail: amb233@cam.ac.uk
bKarlsruhe Institute of Technology, Baden-Württemberg, Germany
cMRC Toxicology Unit, Cambridge, UK
First published on 20th August 2024
Abstract
Herein, we examine the generation of nanoparticles from tire and road interactions, with a focus on two key aspects: replicating real-world conditions in a controlled environment for particle generation and analysing the collected particles through both online and offline techniques. In order to generate realistic wear patterns, third body particles were used in a standardized laboratory tire testing facility across dynamic and static speeds and load profiles. The findings indicated that milled stone dust as a third body particle significantly disrupted the nanoparticle size range, complicating the differentiation between tire-based and third-body-based nanoparticles. However, using sand as a third body particle, the interference showed comparatively lower background noise within the nanoparticle region. Here, steady-state cycles were employed to discern the relationships between force events and nanoparticle generation, which were compared to analyses conducted over an entire dynamic drive cycle. The steady-state cycles revealed that high lateral forces (>2 kN) yielded the highest nanoparticle concentrations, surpassing background levels by over two orders of magnitude. Meanwhile, the drive cycle trials indicated that approximately 70% of the emitted nanoparticles throughout the entire drive cycle were semi-volatile emissions, likely originating from vaporization events. ICP-MS results confirmed the presence of tire-related elements in the nanoparticle region, but definitive attribution to the tire or road surface remains a challenge for the field. This study underscores the complexities inherent in generating, collecting, and assessing submicron tire wear particles, laying the groundwork for addressing uncertainties and refining non-exhaust tire emission methodologies.
Environmental significanceA typical problem in understanding emissions from tire wear particles generated under realistic driving conditions, in conjunction with road wear particles, is recreating real-world driving conditions in laboratory settings. Here, the research focuses on uncovering nanoparticles generated under real-world driving conditions while using third body particles. Key findings indicate that nanoparticles are predominantly semi-volatile rather than solid, as concluded through online and offline analysis, including, for the first time with non-exhaust tire emissions, a catalytic stripper to provide information on the solid component of non-exhaust emissions. Generalizing this requires considering the composition of rubber for health-related impacts. Addressing this is crucial for determining the contribution to urban emissions, especially with the increasing electrification of passenger fleets. |
Introduction
Non-exhaust emissions, encompassing brake wear, tire wear, road wear, and road dust, are garnering increasing attention in academic and policy studies. Research indicates that while brake wear is relatively easier to characterize, tire-wear emissions present greater complexity due to their interaction with dynamic environmental factors such as varying road conditions, surfaces, multiple forces and operational modes.1 This, in part, contributes to the lack of literature on tire and road wear nanoparticles. There are four identified variables that can dictate the types of particles emitted from tires: tire characteristics, vehicle characteristics, road surface characteristics, and vehicle operations.2Previous studies have shown that standardized laboratory wear testing must include “third body particles” to enable test results that mimic known real-world wear. By incorporating third body particles like sand, chalk, and stone dust, macroscopic wear and large particle emissions correspond to real-world driving conditions more accurately, as these materials are commonly encountered on roads and play critical roles in how tires emit particles.3–5 However, careful selection of third body materials is vital, as certain substances may hinder the accurate characterization of tire emissions depending on the size fraction of interest.
In previous work, particulate matter (PM) has been measured using cyclones for size fractionation at 10 μm (PM10) and 2.5 μm (PM2.5), or higher size resolution instrumentation has been used such as an Electrical Low-Pressure Impactor (ELPI).6 The size fractions of release have differing sensitivities. Increasing the lateral loads at a constant driving speed decreased the PM2.5 to PM10 ratio exponentially, where PM10 emissions were found to be 3.8 times more sensitive to load than PM2.5.7 However, nanoparticle production from tires, specifically those <100 nm, is more sensitive to higher slip angles and longitudinal forces.8
Collection mechanisms have ranged from sampling directly behind the tire8–10 or downstream with the help of an extraction system that pulls the particles to the collection locations.6,7,11 The collection mechanisms either deposit particles on filters for offline analysis or assess the incoming particles in real time for online analysis. The tire collections and analyses have employed methods and instrumentation that often do not include ultrafine particles (<300 nm).6 This means that ultrafine particles from tire and road wear particles (TRWPs) continue to be less understood. In part, studies that are done in an open system, or those that do not extract particles from directly behind the tire, are at a much higher risk of ultrafine particle loss.12 Also, because humidity can influence the size of the particles detected, specifically ultrafine particles, the distance from particle generation to particle collection should be minimized to reduce the impact of humidity.13
Overall particle generation sensitivities have been correlated to the load, tire speed, overall distance travelled, slip speed, tire tread loss (mg), wear rate (mg km−1), and PM2.5 to PM10 ratios.6,7,14 In addition, the particle distributions have been shown to depend on the severity of the drive cycle. Mathissen et. al. have shown that harsh driving conditions have bimodal size distributions, whereas other driving modes tend to have unimodal distributions.10 The existing literature on tire and road wear nanoparticles has established a foundation for the research presented herein, where a notable gap is the absence of recreating representative driving conditions within the testing environment.
Characterising the chemical composition requires significant instrumentation resources for on-line analysis and careful sample collection and storage for off-line analysis. The use of a catalytic stripper (CS)15 allows on-line particle distinction to be made between solid and semi-volatile particles when used in conjunction with appropriate particle measurement, e.g. ELPI. By comparing data obtained with and without the CS, studies can discern details about the evaporated and solid fraction of micrometre to nanometre sized particles. While prior research has utilized this technique to monitor exhaust emissions16,17 and urban pollution,18 its application to submicron emissions from tire operations has not yet been shown.
Our present work provides quantified measurements of nanoparticle emissions from standardized tire test conditions, building on previous studies. We incorporate third body particles to emulate the critical interaction between the tire and road surface that exists in the real world. Here, trials of steady-state cycles and previously reported drive cycles are used to assess particle size distributions, specifically focusing on the nanoparticle size range, for tire and road wear particles while using third body particles within a laboratory setting to represent real-world driving conditions. The difference between mass and particle number (PN) distribution is explored in relation to nanoparticle tire and road wear emissions. Further, we develop new testing structures that incorporate third body particles, which are compared to previously reported literature based on force-dependent emissions. Finally, the use of a catalytic stripper provides new insights into non-exhaust emissions differentiating between solid and semi-volatile size distributions, where comparisons can be made to offline microscopy and mass spectrometry analysis.
Materials and methods
The trials were conducted in accordance with standardized methodologies developed at the Karlsruhe Institute of Technology (KIT). Previous testing parameters and procedures are reinstated8,19 and enhanced here with online and offline nanoparticle detection capabilities. There are three main components to the trials detailed: the testing rig at KIT, the online instrumentation and the offline instrumentation.Testing the rig and tire
The KIT rig consists of a rotating drum where the emissions from the test tire had were measured under varying loads and speed settings.8,19 The KIT tire rig has an inner diameter of 3.8 m and can achieve speeds of >140 km h−1 with loadings of 7 kN, which has been the basis of many studies found in the literature.8 The wheel load force (N) and tangential and lateral forces are shown in the ESI (Fig. S1 and S2,† respectively). The road surface chosen for this study was asphalt, which was resurfaced via grinding prior to each experimental run. To improve thermal stability and limit background fluctuations of nanoparticles, the rig has been enclosed to shield it from external environments. In addition, the tire is driven hydraulically while the drum is driven electrically using a 16-speed transmission, and segment bearings have specifically been used to prevent the tire tread from shifting laterally. The proven design facilitates a robust platform for generating tire and road wear particles.The same summer tire was tested throughout the study, with AC 11 D S asphalt. The tires were packed and stored in tire bags in a protected space when they were not being tested. These tires were manufactured in 2022.
The sampling location and extraction system were tested at the onset of this study, where various locations and particle losses were examined (see Fig. S3 and S4†). The final configuration used in the study is depicted in Fig. 1, where Fig. 1a shows where the third body particles are introduced into the system (Fig. 1a-1) and where the extraction system (Fig. 1a-2) attaches to the scoop that sits behind the tire in Fig. 1a-3. The tire used was a new summer tire and was not equipped with any studs or spikes and had a symmetrical tread pattern, and thus negative and positive slip angles should result in comparable tire emissions. Two drive cycles are detailed here, steady state cycles and a portion of a drive cycle used by the Tire Industry Project, both reported in previous studies.8,19
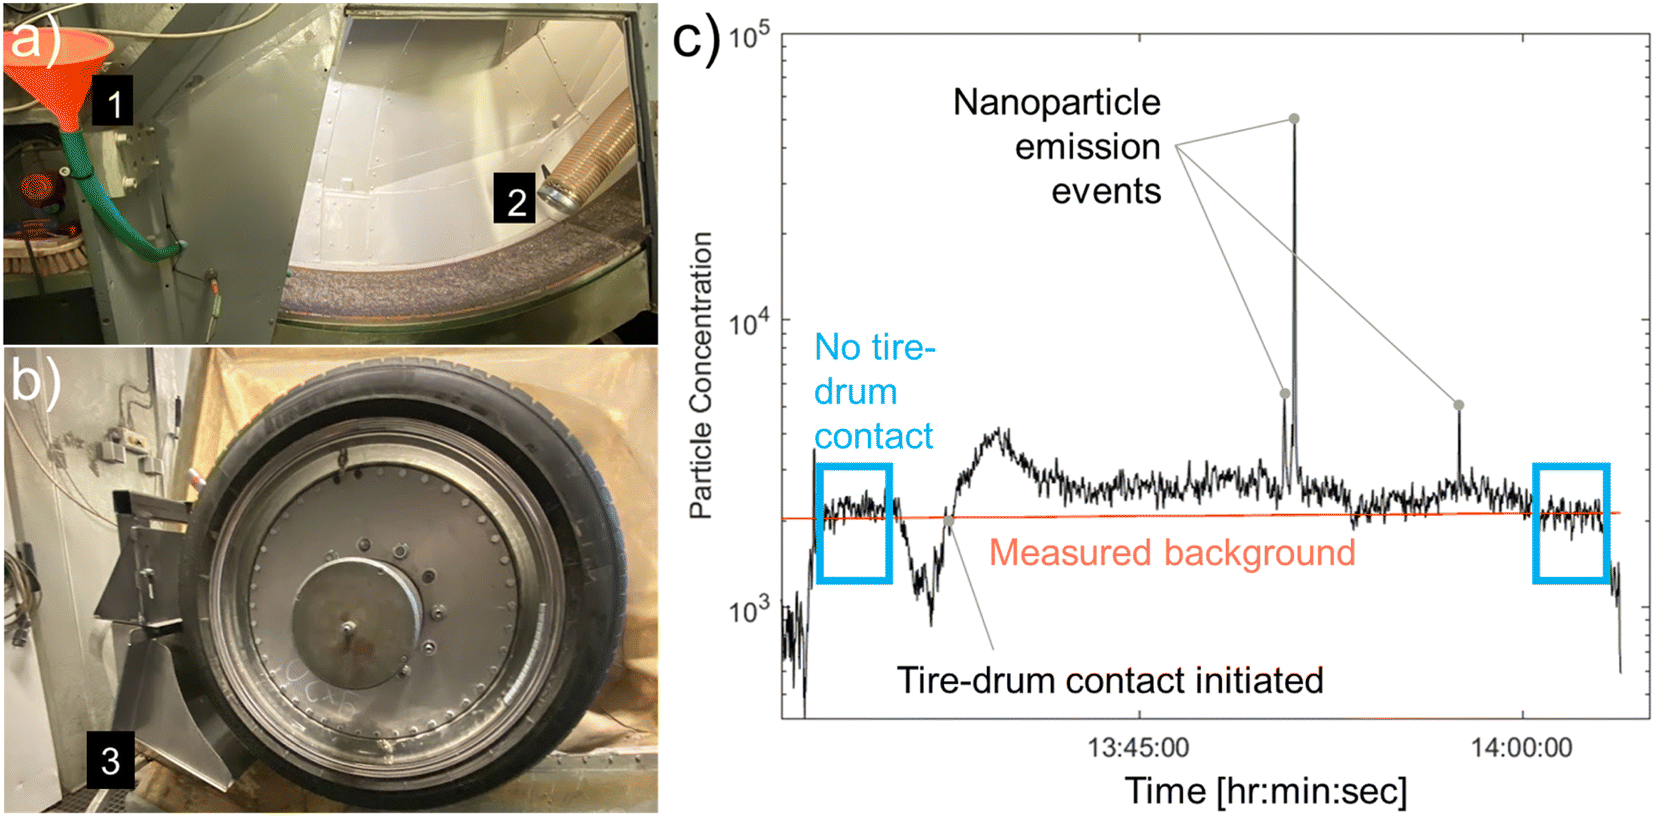 | ||
| Fig. 1 Picture of the (a) inner drum highlighting where the third body particles are introduced,1 where the extraction2 is connected to the (b) tire and where the particles are collected from ref. 3 in relation to the tire. (c) Post-processing method for determining the background or baseline and particle number concentration. The blue boxes represent steady-state operation without the tire drum to assess background particles from third body addition, the rig itself, or ambient nanoparticles. The red line denotes the background concentration in relation to the rest of the drive cycle. | ||
ELPI
A Dekati Electrical Low-Pressure Impactor (ELPI) was used as it was able to provide size distributions for online data analysis, while also supporting the possibility of offline analysis with particles impacted into the various stages of the ELPI. The ELPI used a flow rate of 10 L min−1 to sample particles from 6 nm–10 μm with a sampling frequency of 10 Hz. Pre-greased aluminium substrates were used throughout the collection periods for the subsequent off-line analysis. This type of substrate is known to have increased particle bounce compared to sintered plates, as discussed in previous work,20 and could influence the online and offline results for the ELPI data. However, the use of sintered plates eliminates the possibility of offline analysis, as substrates are required in order to remove the collected particles, by stage, and perform SEM. As reported by others, ELPI electrometers typically have 0.1–1 fA noise,21 which is <3% of the raw data current collected throughout the sampling periods during the TRWP testing cycle.The ELPI has 14 stages that bin particles by size, where they are counted as they deposit onto their respective stage based on the aerodynamic particle diameter with an approximate logarithmic spacing between 10 μm and 6 nm (see Table S1,† where green denotes the nanoparticle stages).22 The ELPI data provide a particle number based on particles that impact stages as they are brought into the instrument. The deposition of the particle is dependent on the equivalent aerodynamic diameter, and the default size interpretation assumes that particles are spherical with a density close to 1 g cm−3.23 The micron-sized particles sampled here are likely to have non-spherical morphologies, as shown in previous literature reports, and the morphology of the submicron fraction is unknown. The density used throughout this study was 1.1 g cm−3, which is likely to be less than the true density of the particles collected throughout this work. Because the composition of the particles is largely unknown, the density used could underpredict the mass distribution, but does not influence the particle number concentrations reported.
High flow impactor
To increase the mass of nanoparticles collected, a lower size resolution impactor was needed than the ELPI. The high flow impactor used was the TSI Inc. model 129 that operated with a flow rate of 100 L min−1. Two days of testing resulted in 4.1 mg and 1.9 mg of sample collected on glass-fibre substrates for the submicron-sized particles. The bottom two impactor stages (<250 nm and the 250–1000 nm stages) were combined. Glass-fibre substrates were preferred for ICP-MS digestion, as they did not introduce metals or grease into the ICP-MS analysis. Future studies could compare the ICP-MS results between the two impactor stages with extended collection times.ICP-MS
Inductively coupled mass spectrometry (ICP-MS) operates by ionizing a digested sample and subsequently separating ions based on their mass-to-charge ratio, thus facilitating the determination of metal abundances. The digestion process previously used for analysing tire tread was developed by our group separately and verified by the UK National Physics Laboratory.24 This method requires a minimum of 5 mg of sample, which is challenging when collecting nanomaterial generated throughout the drive cycles.SEM with EDX
A Scanning Electron Microscope (SEM) was used with Energy Dispersive X-ray Spectroscopy (EDX) for imaging both submicron and micron-sized particles in offline analyses. SEM imaging creates an image of the surface by focusing a beam of electrons onto the specimen of interest. Here, a Tescan MIRA3 SEM was used with a point resolution of 2 nm. EDX detects and measures the energies of these X-rays, which are unique to each element. By analysing the energy spectrum of the X-rays, EDX can determine the elemental composition of the sample, providing information about the types and relative quantities of elements present on a surface level. The ELPI stages can be fitted with conductive substrates. Once these substrates are removed from the ELPI, the individual stage substrates are then transferred back to Cambridge and imaged using SEM with EDX to understand the chemical composition of the collected particles.Catalytic stripper
A catalytic stripper (CS)15 enabled the measurement of the aerosol solid fraction in real time. The CS was introduced prior to the ELPI in some of the experiments, removing the semi-volatile component of the incoming sample. The layout of how the emitted TRWPs come through this setup is shown in ESI Fig. S5.† The comparisons of test runs with and without the CS give online insight into the composition of the particles emitted.There are corrections for particle loss within the CS where the literature reports penetration curves for solid particles.25,26 The influences of diffusion and thermophoretic losses within the CS for this dataset are discussion within the results.
Background particles
Fig. 1c highlights the method used to quantify and correct for background nanoparticles that were not generated from tire-road interactions. The test rig tire was driven at 50 kilometres per hour for 3 minutes without tire-road contact prior to starting the drive cycle and 3 minutes upon the conclusion of the drive cycle, highlighted in blue boxes. The average particle concentration was calculated for each blue box and a best fit line was generated between the points, depicted as a red line. The nanoparticle concentration in the blue box comprises the background, or baseline, nanoparticle concentration that is due to moving components within the rig, ambient nanoparticles, and third body particles that do not interact with the tire. The slope of the line represents the decay of third body particles that must be accounted for to accurately assess nanoparticles generated throughout the drive cycle. When the drive cycle starts, particle concentrations above this red line are therefore from the tire and road interaction and are classified here as emitted TRWPs. The particle concentrations above the red line would be considered background-corrected concentrations.Testing structure
Quantifying the fraction of TRWPs sampled versus the total TRWPs emitted considers two opposing variables: (1) collecting data that are above the background of the test bench and above the noise threshold of the ELPI and (2) accurately calculating the portion of sampled air into the instrumentation compared to the total air flow through the testing system. Because the entire rotating drum is not air-tight, the total air flow cannot be calculated and therefore a comparison between the sampled fraction and total emitted fraction cannot be made. Due to this limitation, emission factors for tire wear particles cannot be calculated here. Instead, these results give insight into relative changes in emitted nanoparticles from tire and road wear under real-world driving conditions and provide a method of distinguishing nanoparticles from background concentrations.The test structure shown in Table 1 was determined to reduce third body intake into the instrumentation, provide real-world conditions (i.e. retaining third body particles) throughout the run cycle, and account for background nanoparticle concentrations within the rig and from the third body particles. The sand used here was Arizona find dust. The exact composition of third body particles in real-world settings is not homogenous and is required for realistic friction combinations. The sand is thus introduced at a lower speed at the beginning of the test cycle as there is less turbulence in the drum.
| Time elapsed (min) | Cycle event |
|---|---|
| 0 | Add 10 g of sand mixture |
| 0–5 | Run the rig with no tire contact |
| 5 | HEPA filters and extraction turned on |
| 5–8 | Run the rig at steady-state (50 kilometres per hour) for background concentration |
| 8–28 | Drive cycle or steady-state cycles |
| 28–31 | Run the rig at steady-state (50 kilometres per hour) for background comparison |
A graphical representation of lateral force and acceleration for the drive cycle is shown in ESI Fig. S6,† where there is a higher frequency of left cornering events (right half of the graph) than right cornering events and more accelerating than decelerating (top vs. bottom, respectively) events. However, all four quadrants are expressed throughout the drive cycle and are representative of real-world driving conditions. This drive cycle focuses on city driving, which comprises 70% of driving on a global scale.27 Therefore, the TRWP nanoparticles that are reported here are representative of real-world city-driving conditions.
Results and discussion
Comparison of third body materials
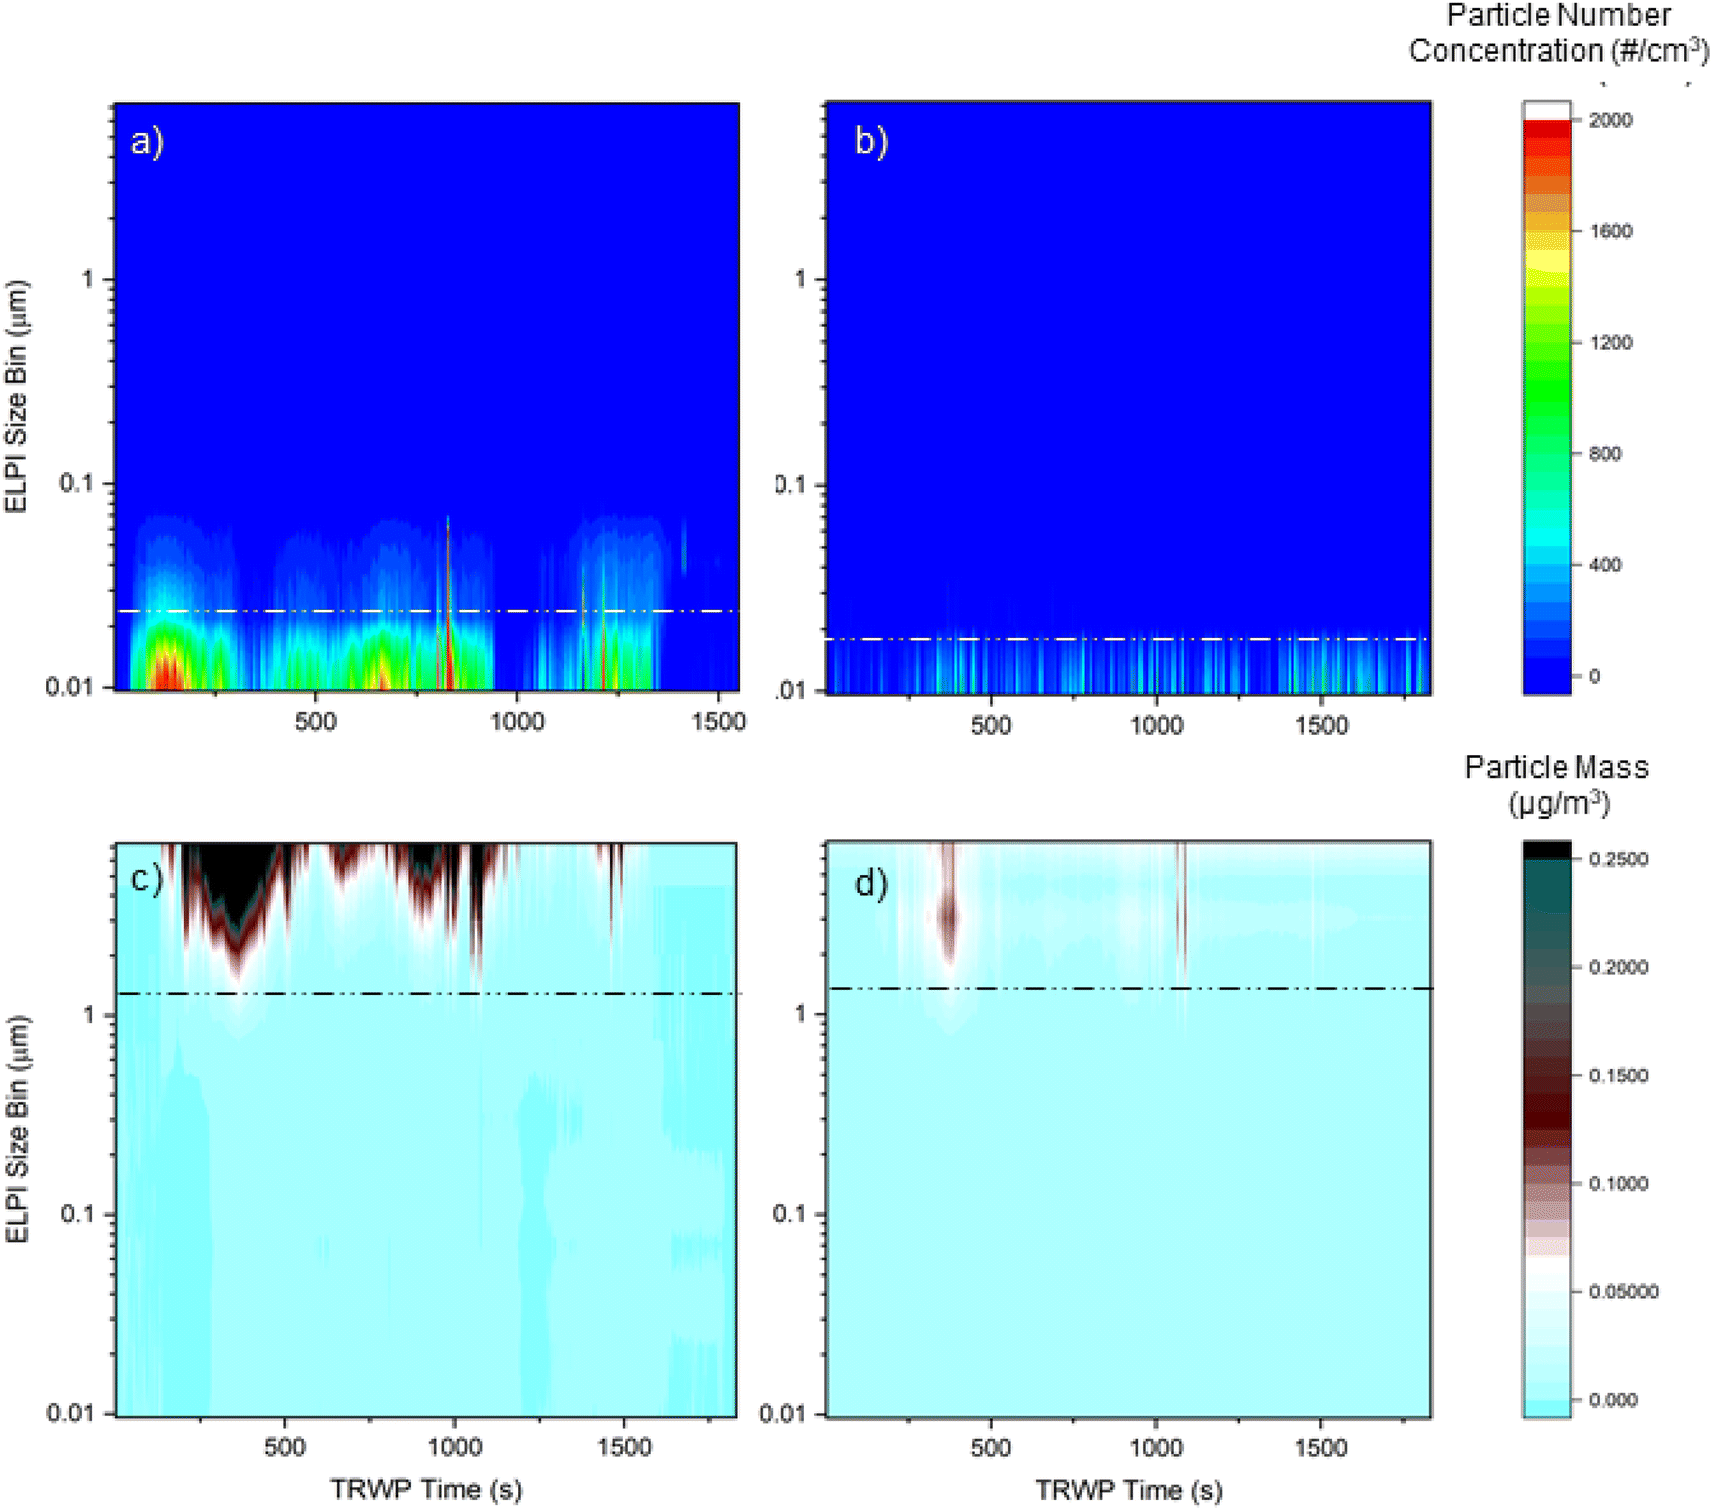
Third body particles are required to maintain real-world driving conditions inside the rotary drum. The third body particles help emulate the interaction of the tire and road surface in typical driving environments and maintain the tire's operational integrity. They also help prevent the degradation of the rubber, which would cause an overly adhesive tire surface, resulting in greater tire-road adhesion and unrealistic wear. Yet, despite the need for third body particles operationally, the measurement of particle emissions from tire-road interactions is potentially inhibited by a large concentration of background third bodies. In previous studies, milled stone dust (MSD)19 and sand have been used at KIT,28 thus enabling the comparison of third body particle options. Fig. 2 shows an exemplary particle size distribution (colour bar) over a 50 kilometres per hour steady-state cycle (SSC) over time (x-axis) by particle size bins (y-axis) from the ELPI for MSD (a) and sand (b). MSD was preferential for the creation and assessment of microparticles from TRWPs, which is shown by low PN (particle concentrations <100 cm−3) in the micron size bins in Fig. 2a. However, MSD interfered with the nano-sized ELPI stages (∼1000 cm−3), reducing the ability to quantify and differentiate TRWPs from third body particles for these size ranges. | ||
| Fig. 2 Particle size distribution by concentration (colour bar) shown for (a) milled stone dust and (b) sand at a constant tire speed of 50 kilometres per hour. | ||
The sand third body particles (Fig. 2b) exhibited lower concentrations (PN per stage <500 PN per cm3) of background particles compared to MSD, reducing instrument noise throughout the drive cycle. The sand interference remained significant (>500 PN per cm3) for the first two stages of the ELPI (dp ≤ 16 nm) but was markedly improved compared to MSD, which significantly interfered with eight ELPI stages (dp ≤ 380 nm). Additionally, the fine texture of MSD tended to obstruct the inlet of the ELPI. Thus, sand was validated and used as the third body material for the experiments conducted herein. There were additional measures taken to reduce interference from large sand particles within the ELPI, such as only connecting the ELPI to the extraction system when the sand had reached a uniform concentration within the rig, as summarised in Table 1.
For nanoparticle TRWP emission studies, it is concluded that sand maintains the tire's integrity, while representing real-world driving conditions with reduced interference compared to milled stone dust.
Comparison of PN and PM
All steady state and transient drive cycles showed similar results in terms of characteristic emissions, whereby large particles accounted for the majority of PM and small particles accounted for the majority of PN. Table S2† details the relative percentage of total particles measured both by PN and PM above background concentrations, for four separate trials that did not use the CS (labelled 1–4). A separate trial used the CS prior to the ELPI, denoted as CS, to measure the solid PN and PM relative distributions. The green cells highlight the ELPI size bins that jointly comprise 95% of the PN or orange for PM. These results are characteristic of many emission sources, whereby the number of particles emitted is dominated by nanoparticles (in this case <100 nm) and the cubic relationship between the particle diameter and mass results in a majority of mass in the largest diameter ranges (>940 nm) regardless of the solid/semi-volatile nature of the particles.When considering PM emissions throughout the TRWP cycle from all particles (solid and semi-volatile) 95% of the total mass was represented in the micron-sized ELPI stages. The mass distribution shifts when the solid component is considered independently (with the CS), and here the five largest ELPI stages account for 95% of the mass collected. The broadening of mass distribution could indicate that semi-volatile particles have condensed onto solid, micron-sized particles, and when evaporated, there is a small amount of mass lost in these size ranges. The contribution from nanoparticles to the mass concentration is minor, and thus using mass as a metric to analyse nanoparticles generated by tire-road interactions does not provide suitable resolution above the background.
Considering PN, 95% of the TRWPs are <250 nm, highlighting the importance of focusing on a number-based metric for assessing nanoparticle TRWPs. The solid PN distribution (CS) has a broadening of the relative concentration of particles, indicating that there could be a semi-volatile component to these particles as well; however, the 95% distribution remains < 250 nm. Table S2† also shows that micron particles do not contribute a significant amount of total PN.
Drive cycle emissions
The measurement of both TRWP total particles and total solid particles via the CS demonstrated that the majority of particles, by number, are semi-volatile. To demonstrate this, the particle emissions over the entire drive cycle are shown in Fig. 3a for a normal driving cycle (purple) and a severe driving mode (green) that increased the normal lateral load by 25% over the course of the drive cycle for total particles and total solid particles. The total solid particle data are determined using the same drive cycle but incorporating the CS prior to the ELPI. Fig. S7† compares the data from Fig. 3a for normal driving conditions compared to the data incorporating the diffusional and thermophoretic losses for the solid particle data. Fig. S7a and b† provide the particle size distribution for the total particles under normal driving conditions and the solid particle fraction, respectively, for reference. The ESI† shows the effects of applying the diffusional loss correction (Fig. S7c†) and a correction for both diffusion and thermophoretic losses (Fig. S7d†). Relative to the reported total particle concentration, Fig. S8† highlights that there could be up to a 33% increase in solid particle concentration with the sampling method used. However, even with a maximum 33% increase, the solid particle concentration is still near baseline concentrations. | ||
| Fig. 3 Throughout the drive cycle, there are specific events that generate particles during (a) normal and severe driving modes and with and without the catalytic stripper. Comparing the driving mode with and without the catalytic stripper is shown in (b) for semi-volatile (SV) particles. | ||
To compare the response to more severe driving behaviour, the lateral force was increased and the cycle is more representative of severe cornering. Here, only one force is increased for the severe mode in order to reduce the effects of multi-variable changes. TRWP generation is shown to increase with increased lateral loads compared to the normal driving mode. In addition, by subtracting the total particles from the total solid particles, the semi-volatile fraction of emitted particles can be calculated, which is shown in Fig. 3b for the nanoparticle size fraction (SV1) and all size fractions collected (SV10). The difference between SV1 and SV10 is most noticeable during high emitting events.
Fig. 4, which is background corrected, shows the total particles generated in particle number concentration (a) and particle mass (b) by size compared to the solid particles generated throughout the drive cycle, in Fig. 4c and d, respectively. The solid fraction of the particles only comprises a small fraction of the total particles emitted, as shown by comparing Fig. 4b to a. Data below the white dashed lines within Fig. 4a and b highlight the size bins where 95% of the particle number concentration can be found, which is in size bins <250 nm, whereas 95% of PM can be found >1 μm, as shown with the black dashed line in Fig. 4c and d, indicating the size bins where 95% of particle mass was collected throughout the drive cycle.
 | ||
| Fig. 4 The size distribution is shown for the entire drive cycle driven displayed by particle number concentration for data (a) without the CS (total particle number) and (b) with the CS (solid particle number) in comparison to the mass distribution by size bins for data (c) without the CS data (total particle mass) and (d) with the CS (solid particle mass). Data below the dashed line (a and b) represent the size bins where 95% of the particle number concentration is collected and data in size bins above the black dashed line (c and d) comprise 95% of the mass concentration. These data are background corrected. | ||
The particle distribution shown in Fig. 4b has been background corrected and thus could represent particle collection noise due to third body particles, as they would not be removed by the CS or they could be solid tire/road particles that have chemical compositions that are stable above 350 °C. Comparatively, Fig. 4a shows high particle concentrations (>2000 PN per cm3 per size bin in the nano-range) that were removed by the CS (Fig. 4b <500 PN per cm3 per bin) and are not present in the CS-based data. Here, over the course of the drive cycle, more than 70% of the particles (above background) are semi-volatile and are evaporated when subjected to the CS. The difference in measured TRWPs between solid particles (Fig. 4b) and total particles (Fig. 4a) is most pronounced during high concentration events, exemplified during 200, 700, 800 and 1200 s of the drive cycle. Further speciation is needed to quantify and characterise the chemical composition of the nanoparticle size bins; however, this is complicated by the amount of mass required to perform these types of analyses. The particle distribution shown for both PN and PM is reproducible for all valid test results (Table S2†), and corroborates previous work at KIT that did not use third body particles where >95% of PN is <300 nm.8
The mass distribution for the drive cycle is shown for total particles (Fig. 4c) and solid particles (Fig. 4d), where it is apparent that the majority of mass in both distributions is micron sized (>1 μm). Comparing Fig. 4a and c, the total particle size distribution shows that both a large number of particles are generated in the nano-size bins and a high mass in the micron-sized bins. However, comparing the solid particle number (Fig. 4d) to solid particle mass (Fig. 4b) indicates that there are few particles (indistinguishable by number) that contribute to high solid mass concentrations during the drive cycle. It is not known whether these large particles are third body silica or TRWP emissions.
There is continuity between drive cycles and the fingerprint created. The majority of particles are semi-volatile throughout both drive cycles and are primarily nanoparticles, except for specific high-force events.
Steady state cycle emissions
The SSCs show that nanoparticles are generated during high force events, providing further mechanistic insights into TRWP emissions from dynamic drive cycles. PM data are shown to be more sensitive to all force events compared to PN data. The particles generated at higher forces (>2 kN) influence both PN and PM and are shown to be semi-volatile. Fig. 5 compares PM1 (PM for particles <1 μm) and PM2.5 (a) and PN1 (PN for particles <1 μm) and PN2.5 (b), respectively, plotted on the left axis, with the lateral force from the rig (N), plotted on the right axis. Here, as particles increase in mass, from PM1 to PM2.5, there is not a corresponding increase in PN, comparing PN1 to PN2.5 for the same force events. It should be noted that PN2.5 includes PN1 by definition. Further, there is more than an order of magnitude increase in PM at 50 s when the tire makes contact with the road surface, or when the load is applied to the wheel, independent of any lateral force. The increase for PN at this time is relatively small (<5%) compared to the background. For both PM and PN, the negative lateral force events correlate with a lower particle concentration increase above the background compared to the positive lateral events, up to 15% for PM or 30% for PN.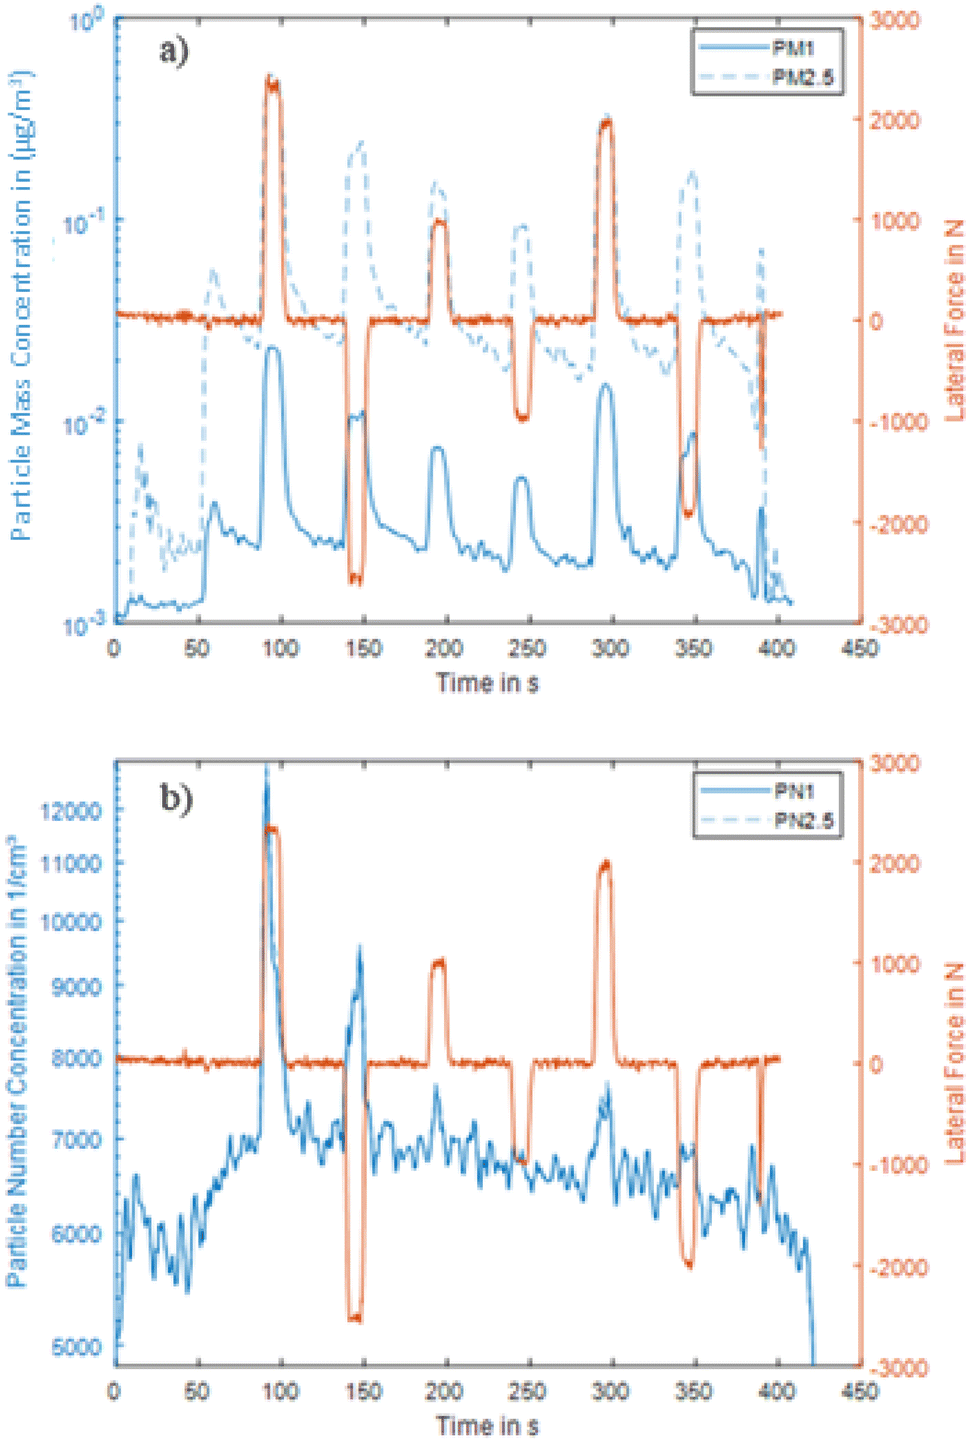 | ||
| Fig. 5 The steady-state force (right axis, orange) is shown with particle concentration (left, blue) for (a) PM and (b) PN measurements for submicron particles (PN1 solid line) and up to 2.5 microns (PM2.5 dotted line). The PN2.5 and PN1 lines are indistinguishable as they overlap. | ||
Fig. 5 demonstrates that PM1 and PM2.5 have over an order of magnitude difference in PM generated during force events, whereas there is no distinguishable difference between PN2.5 and PN1 indicating that nearly all particles generated during these force events are within the nanoparticle range.
To investigate the generation events leading to TRWP nanoparticle emissions, particle concentrations within various size ranges are examined versus applied force in Fig. 6. Two trials of SSCs are segregated by particle sizes of 6–260 nm (PN0.3), 260 nm–0.98 μm (PN0.3–1) and 0.98 μm–10 μm (PN1–10), as well as by the absolute force exerted during the SSC for 2.5 kN (blue), 2 kN (purple) and 1 kN (green). The particle size distributions for these forces are explicitly shown in Fig. S9.†Fig. 6 shows the total particles generated ((a), without the CS) and for the solid fraction of the generated particles ((b), with the CS). The larger fractions (PN1 and PN10) have statistically insignificant increases in the mean and interquartile spread between forces. As the force increases, the total concentration increases, but specifically in the smallest size fraction. Fig. 6a shows that at 2.5 kN, the mean PN0.3 concentration increases by 195% compared to concentrations at 2 kN and 1 kN forces. It is also clear that the interquartile range broadens as the force increases, meaning that the TRWPs generated during high force events are more variable than those generated during lower force events, which could be due to the “memory effects” of the time–temperature profile of the tire during a drive cycle. Memory effects occur when a specific event within a drive cycle influences a later emission event, such as a high friction or force event that could result in a different subsequent emission than a low friction or force event.
 | ||
| Fig. 6 Box and whisker plot for steady-state cycle data shown for repeat cycles for PN (a) without the CS (representative of all particles) and (b) with the CS (only the solid, non-evaporative particles). The data are grouped for particle sizes 0.006–0.26 μm (PN0.3), 0.26–1 μm (PN0.3–1), and 1–10 μm (PN1–10). The analysis is shown for 2.5 kN (blue), 2 kN (purple), and 1 kN (green) forces. | ||
Fig. 6b shows the solid fraction generated by SSC force on the same scale as Fig. 6a. All size ranges have consistent low particle concentrations (<170 PN per cm3), with the exception of PN0.3 when subjected to a 2.5 kN force, where we see an increase in outlier concentrations. This collective analysis shows that SSCs provide insights into threshold forces for nanoparticle generation. The current tire and speed configuration demonstrate that particles in size bins 6–260 nm (PN0.3) are present at all forces, but the concentration increases when forces are above 2 kN, where the majority of nanoparticles are semi-volatile. This method provides a pathway for broader investigations of different tires and speed-load conditions for our continued studies of nanoparticle TRWP generating events.
SSCs give nuanced insight into when nanoparticles are generated, expanding on full drive cycle analyses. Here, the SSCs conclude that at lower force events, semi-volatile nanoparticles are less likely to be generated, whereas forces >2 kN generate semi-volatile nanoparticles.
Chemical assessment
The chemical analysis of the TRWP submicron particles shows that the particles exhibit an elemental finger print with similar components to the total tire, but at different relative elemental ratios. Due to the digestion requirements for sand, ICP-MS was not performed, but the composition of sand is predominately silicon dioxide (SiO2).Fig. 7 shows the results of the Inductively Coupled Plasma Mass Spectrometry (ICP-MS) analysis on submicron particles for two sampling days. On each day, eight TRWP cycles were deposited onto each substrate with the goal of increasing the deposited mass on each substrate for ICP-MS digestion. To ensure sufficient mass for ICP-MS digestion, particles from two impactor stages were combined, the <250 nm size bins and the 250 nm–1 μm size bins. The sample preparation and digestion method followed a previously published methodology, and due to the mass required for offline analyses, there was not enough material to compare catalytic stripper based samples.24
 | ||
| Fig. 7 ICP-MS results for two separate days, denoted with blue and red, including only submicron TRWPs. | ||
Moreover, the analysis revealed the presence of zinc (Zn) within the emitted submicron particles. Previous research has established Zn as a constituent of tire rubber;24 however, this work cannot definitively say that Zn is solely a result of tire compound emissions. It is worth noting that sand could not be digested for ICP-MS analysis due to the unavailability of hydrofluoric acid digestion capabilities at our facility. Future work may include comparing the composition of the emitted particles to the digested sand third body particles, as well as the road surface, further identifying and differentiating elemental markers capable of distinguishing between tire rubber and road material.
The SEM with EDX results that were obtained on the substrates removed from the ELPI corroborate the above findings that the generated nanoparticles have chemical characteristics representative of tire-based compounds.24 The SEM results for >10 μm, 1 μm and 70 nm are shown in Fig. 8a–c, respectively. Fig. 8e details the EDX results for the corresponding size fraction. Fig. S10–S12† show the SEM with elements highlighted directly on the images. Sand (red) on a tire (maroon) particle is shown within Fig. 8d and the chemical composition is notable within the EDX results. Considering the peaks at 1.74 and 0.71 keV, respectively, the Fe![[thin space (1/6-em)]](https://www.rsc.org/images/entities/char_2009.gif) :Si ratio is shown in the legend. For non-peak regions, a moving average filter with 5 data points was applied to suppress noise.
:Si ratio is shown in the legend. For non-peak regions, a moving average filter with 5 data points was applied to suppress noise.
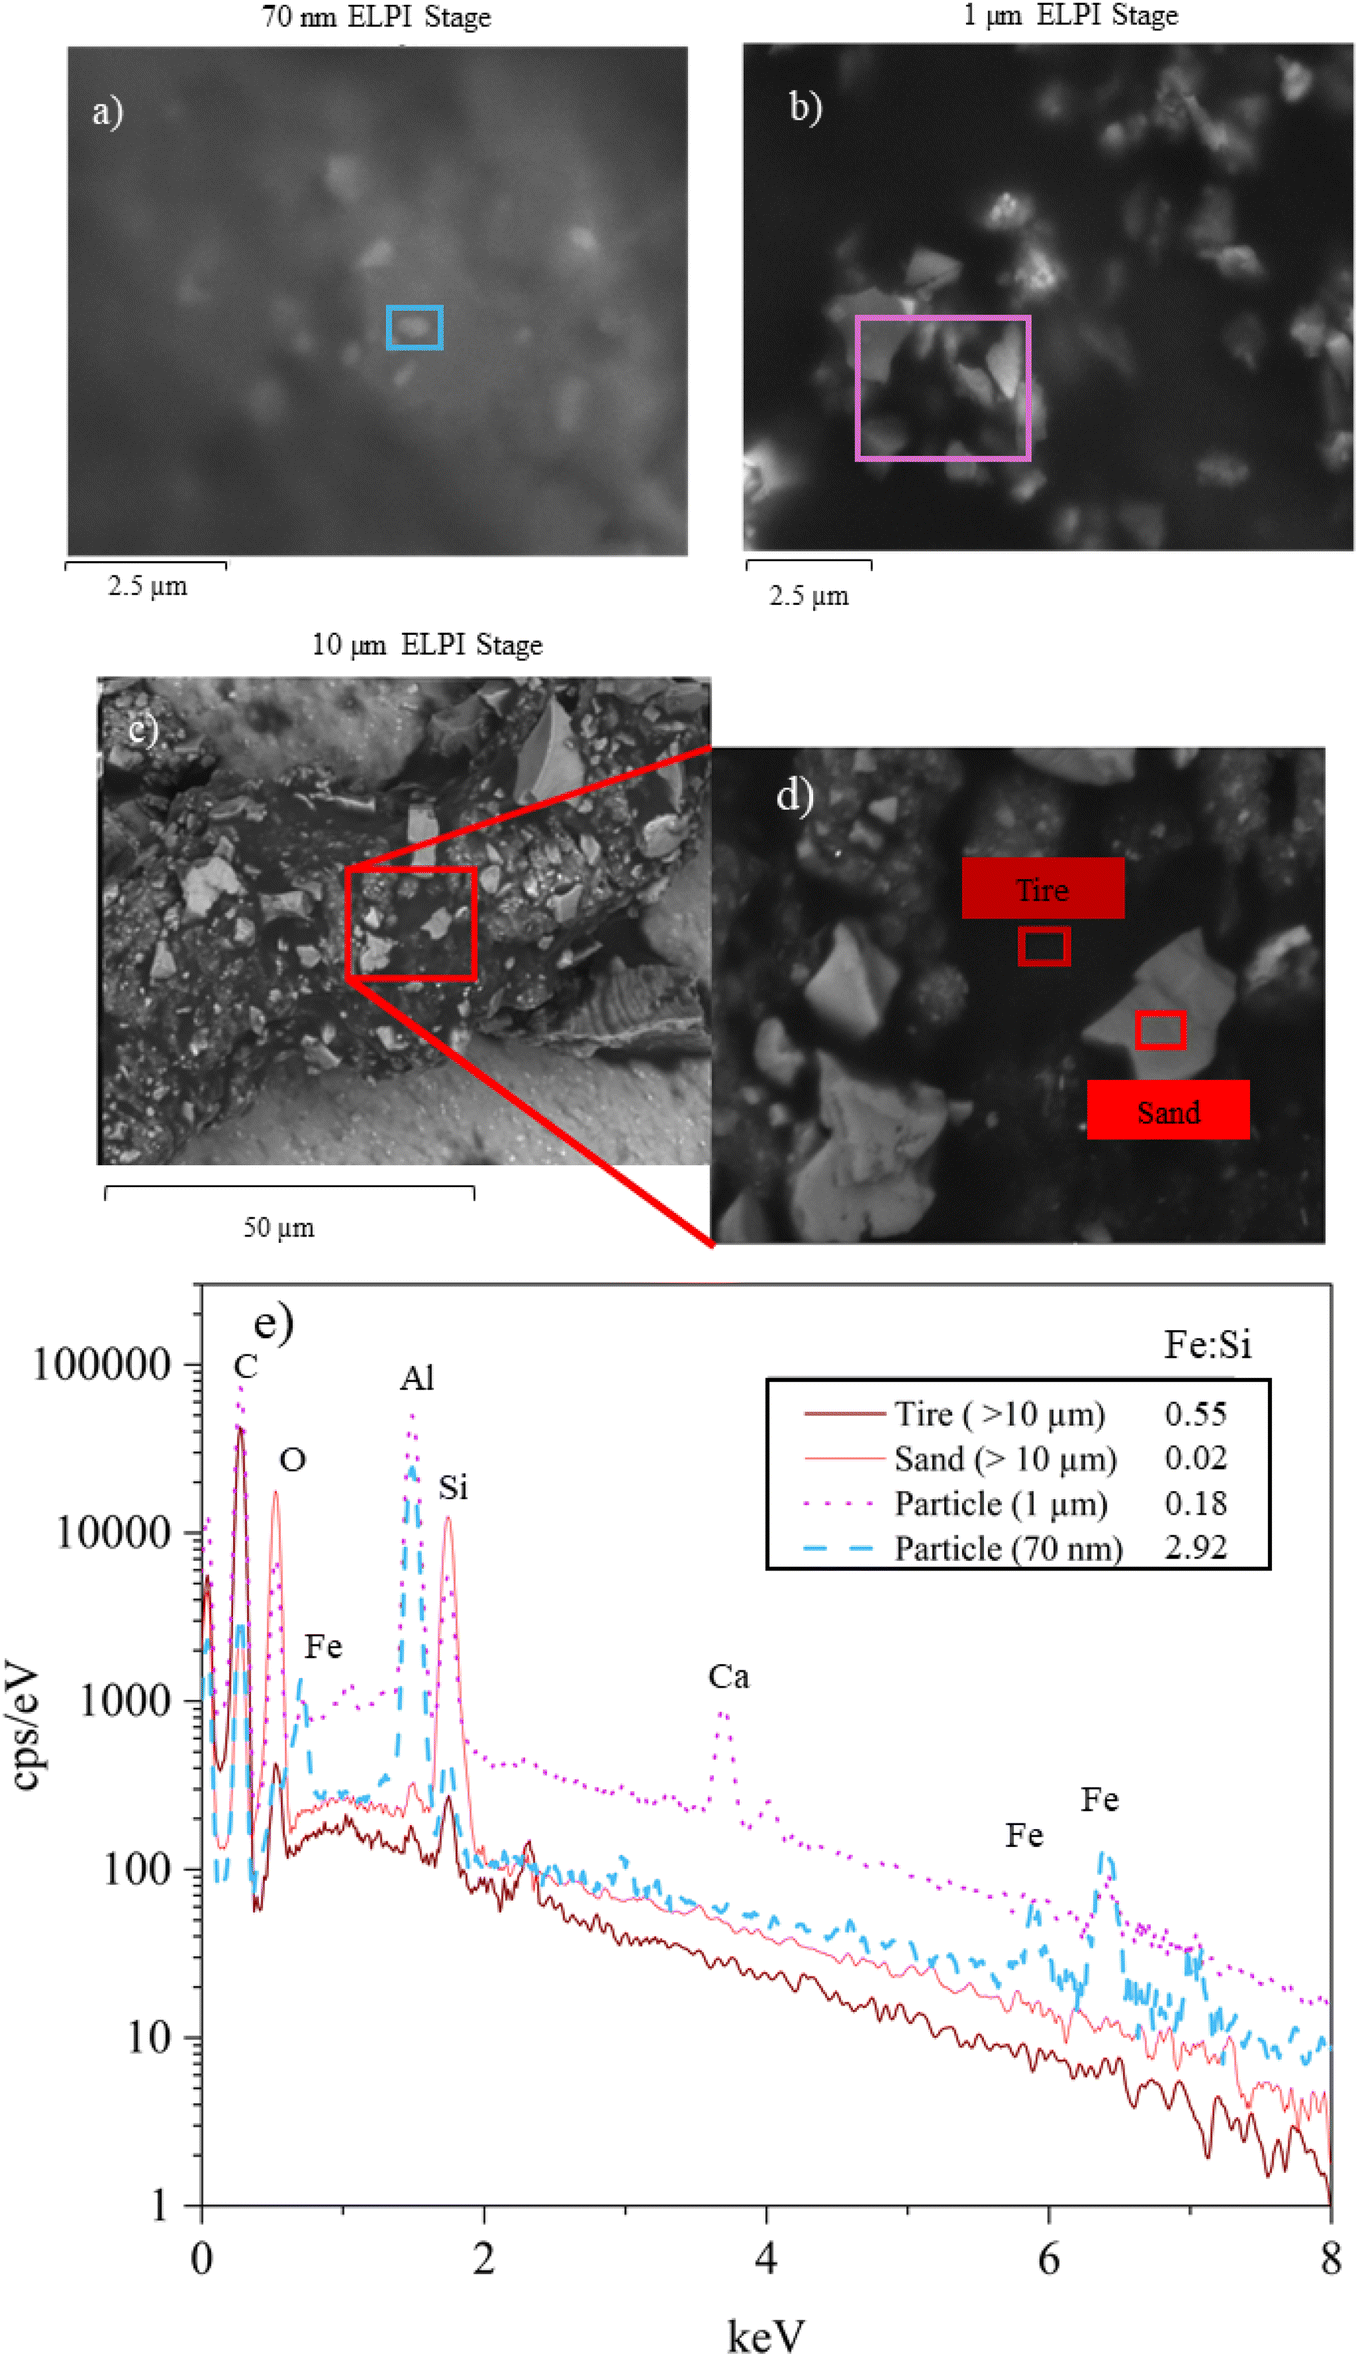 | ||
| Fig. 8 SEM images for the chemical composition of (a) a 70 nm stage particle (blue) and background (grey), (b) a 1 μm stage particle (purple) and (c) a >10 μm stage particle highlighting the (d) tire (maroon) and sand (red) components. The EDX spectrum is shown (e) with present elements noted. | ||
The EDX spectrum of the particle noted as “sand” has a Si:O signal that is ∼1:1 and an Fe:Si signal of 0.02. The 70 nm particle has no quantifiable O signal and has multiple Fe peaks, and the Fe:Si ratio is two orders of magnitude higher than the Fe:Si ratio for sand. The quantifiable differences between the 70 nm particle and sand particles indicate that the nanoparticles are TRWPs rather than third body particles, which corroborates the CS-ELPI results. The 1 μm particle has an O signal and an Fe:Si ratio indicative of a particle that is likely a mixture of third body sand and TRWPs. Comparatively, the >10 μm tire particle has an Fe:Si ratio that is over an order of magnitude higher than the sand Fe:Si ratio, and may have other components contributing to the signal due to tire particle agglomeration. The SEM results along with EDX results demonstrate the complexity of TRWPs, where it is evident that micron-sized particles are both internally and externally mixed (see Fig. S8 and S9†). It is not possible to differentiate the tire and asphalt components of these particles, and thus must be referred to as a collective TRWP. The nanoparticles appear primarily to be organic based on the CS-ELPI results (>95% removal in the CS), but there do appear to be non-organic signals in the EDX spectrum, which are distinct from the micron-sized TRWP materials.
Conclusions
This study conducted an investigation on the complex nature of submicron emissions from tire wear, focusing on (1) generating particles that represent real-world conditions in a controlled setting, (2) finding the optimal location for submicron particle collection and (3) analysing the collected particles through online and offline techniques. The following conclusions can be drawn from the resulting data:Firstly, it was observed that milled stone dust significantly interfered with nanoparticle size bins, as evident from the high concentrations within the ELPI. The interference made the differentiation of submicron emissions that were tire-based vs. third-body-based difficult to quantify, whereas the sand interference was comparatively lower, allowing for reduced background noise during particle generation studies. The use of previously used drive cycles provided insights into tire emissions under simulated real-world driving conditions, although the high rate of force changes posed challenges in attributing specific force events to particle generation events. Therefore, steady-state cycles were used for a more nuanced understanding of generation events, revealing that high lateral forces (>2 kN) generated the highest submicron concentrations, over 2 orders of magnitude higher than background submicron concentrations.
The online and offline methods together supported the conclusion that the majority of nanoparticles, ∼70% of emitted submicron particles over the entire drive cycle, were semi-volatile emissions. This remains true when considering any diffusional or thermophoretic losses within the catalytic stripper. The exact chemical speciation of the emitted particles could not be concluded, but it is likely that these particles originate from vaporization events throughout the drive cycle. SEM results indicated the presence of sand particles in larger sizes but there was an absence of SiO in sub-100 nm particles. ICP-MS of submicron impactor substrates confirmed the presence of tire-related elements in the generated nanoparticles. However, definitive attribution to the tire or road surface was challenging and more work is needed in this area. With the conclusions from the SEM with EDX spectra, this work demonstrates a viable way to generate TRWP nanoparticles, which limits the interference of vital third body particles within the nanoparticle size range, while providing a new mechanism of sampling non-exhaust emissions with a catalytic stripper.
This study highlights the complexities involved in generating, collecting and assessing submicron tire wear particles. The generation method created here can be used. This work paves the way for future investigations to address remaining uncertainties and refine emission estimation methodologies.
Data availability
All data are available upon request from the corresponding author.Conflicts of interest
The work presented here was funded by the Tire Industry Project (TIP), an international consortium of 11 tire manufacturers collaborating to understand the human health and environmental impact of tires, under the oversight of the World Business Council for Sustainable Development. The authors of this manuscript were retained as consultants to the TIP.Acknowledgements
We thank the Karlsruhe Institute for Technology technicians for their support and flexibility throughout the trials and Jason Day from the Department of Earth Sciences at the University of Cambridge. The authors would like to thank the Tire Industry Project, part of the World Business Council for Sustainable Development, for their support of this work.References
- D. Hesse, T. Feißel, M. Kunze, E. Bachmann, T. Bachmann and S. Gramstat, Comparison of Methods for Sampling Particulate Emissions from Tires under Different Test Environments, Atmosphere, 2022, 13(8), 1262 CrossRef CAS.
- T. Grigoratos and G. Martini, Non-exhaust Traffic Related Emissions. Brake and Tyre Wear PM, 2014 [cited 2022 Nov 29], available from: https://core.ac.uk/download/pdf/38628016.pdf Search PubMed.
- J. A. Carrero, G. Arana and J. M. Madariaga, Chapter 6 Use of Raman spectroscopy and scanning electron microscopy for the detection and analysis of road transport pollution, In: Spectroscopic Properties of Inorganic and Organometallic Compounds, The Royal Society of Chemistry; 2014 Search PubMed.
- N. Fillot, I. Iordanoff and Y. Berthier, Wear modeling and the third body concept, Wear, 2007, 262(7–8), 949–957 CrossRef CAS.
- Transportation Research Board and Fahrwerk, Reifen, Fahrbahn im Spannungsfeld von Sicherheit und Umwelt, VDI-FVT, 2022 Search PubMed.
- I. Park, H. Kim and S. Lee, Characteristics of tire wear particles generated in a laboratory simulation of tire/road contact conditions, J. Aerosol Sci., 2018, 124, 30–40 CrossRef CAS.
- G. Kim and S. Lee, Characteristics of Tire Wear Particles Generated by a Tire Simulator under Various Driving Conditions, 2018 [cited 2022 Nov 8], available from: https://pubs.acs.org/sharingguidelines.
- M. J. Foitzik, H. J. Unrau, F. Gauterin, J. Dörnhöfer and T. Koch, Investigation of ultra fine particulate matter emission of rubber tires, Wear, 2018, 394–395, 87–95 CrossRef CAS.
- X. dong Chang, H. bo Huang, R. nan Jiao and J. peng Liu, Experimental investigation on the characteristics of tire wear particles under different non-vehicle operating parameters, Tribol. Int., 2020, 150, 106354 CrossRef.
- M. Mathissen, V. Scheer, R. Vogt and T. Benter, Investigation on the potential generation of ultrafine particles from the tire-road interface, Atmos. Environ., 2011, 45(34), 6172–6179 CrossRef CAS.
- C. A. Alves, A. M. P. Vicente, A. I. Calvo, D. Baumgardner, F. Amato and X. Querol, et al., Physical and chemical properties of non-exhaust particles generated from wear between pavements and tyres, Atmos. Environ., 2020, 224, 117252 CrossRef CAS.
- T. Feißel, F. Büchner, M. Kunze, J. Rost, V. Ivanov and K. Augsburg, et al., Methodology for Virtual Prediction of Vehicle-Related Particle Emissions and Their Influence on Ambient PM10 in an Urban Environment, Atmosphere, 2022, 13, 1924 CrossRef . Available from: https://www.mdpi.com/2073-4433/13/11/1924/htm.
- J. Kwak, S. Lee and S. Lee, On-road and laboratory investigations on non-exhaust ultrafine particles from the interaction between the tire and road pavement under braking conditions, Atmos. Environ., 2014, 97, 195–205 CrossRef CAS.
- K. M. Unice, M. P. Weeber, M. M. Abramson, R. C. D. Reid, J. A. G. van Gils and A. A. Markus, et al., Characterizing export of land-based microplastics to the estuary – Part I: Application of integrated geospatial microplastic transport models to assess tire and road wear particles in the Seine watershed, Sci. Total Environ., 2019, 646, 1639–1649 CrossRef CAS PubMed.
- Catalytic Instruments, Applications for the Catalytic Stripper. 2020 Search PubMed.
- J. Swanson and D. Kittelson, Evaluation of thermal denuder and catalytic stripper methods for solid particle measurements, J. Aerosol Sci., 2010, 41, 1113–1122 CrossRef CAS . available from: www.elsevier.com/locate/jaerosci.
- I. S. Abdul-Khalek and D. B. Kittelson, Real Time Measurement of Volatile and Solid Exhaust Particles Using a Catalytic Stripper, J. Engines, 1995, 104, 462–478 Search PubMed . Available from: https://www.jstor.org/stable/44633232.
- M. J. Haugen, A. Singh, D. Bousiotis, F. D. Pope, A. M. Boies and M. J. Haugen, et al., Differentiating Semi-Volatile and Solid Particle Events Using Low-Cost Lung-Deposited Surface Area and Black Carbon Sensors, Atmosphere, 2022, 13, 747 CrossRef CAS . Available from: https://www.mdpi.com/2073-4433/13/5/747/htm.
- M. Kovochich, M. Liong, J. A. Parker, S. C. Oh, J. P. Lee and L. Xi, et al., Chemical mapping of tire and road wear particles for single particle analysis, Sci. Total Environ., 2021, 25, 757 Search PubMed.
- J. F. P. Cornette, J. Blondeau and S. Bram, Influence of the dynamic behaviour of impactor surfaces on particulate matter emission measurements with electrical low pressure impactors, Powder Technol., 2023, 419, 118333 CrossRef CAS.
- S. Saari, A. Arffman, J. Harra, T. Rönkkö and J. Keskinen, Performance evaluation of the HR-ELPI + inversion, Aerosol Sci. Technol., 2018, 52(9), 1037–1047 CrossRef CAS.
- Dekati, Dekati ELPI+ User Manual Ver 1.6, 2021 Search PubMed.
- U. Pujala, V. Subramanian, S. Anand and B. Venkatraman, Effect of morphological properties on the particle size distribution measurements and modelling of porous and nonspherical aerosol behaviour, Prog. Nucl. Energy, 2023, 163 Search PubMed.
- D. P. O. Loughlin, M. J. Haugen, J. Day, A. S. Brown and E. C. Braysher, Multi-element Analysis of Tyre Rubber for Metal Tracers Multi-element analysis of tyre rubber for metal tracers, Environ. Int., 2023, 178, 108047 CrossRef PubMed.
- Catalytic Instruments, Note 00090 - Losses in the Catalytic Stripper, [cited 2024 Jun 18], available from: https://catalytic-instruments.com/?product_cat=catalytic-stripper.
- M. Woo, G. Giannopoulos, M. M. Rahman, J. Swanson, M. E. J. Stettler and A. M. Boies, Multiscale numerical modeling of solid particle penetration and hydrocarbons removal in a catalytic stripper, Aerosol. Sci. Technol., 2021, 55(9), 987–1000 CrossRef CAS.
- T. Grigoratos, M. Giorgio and S. Heinz, Analysis of WLTP typical driving conditions that affect non-exhaust particle emissions [Internet], 2016, available from: https://ec.europa.eu/jrc.
- S. Schläfle, H. Unrau and F. Gauterin, Influence of Load Condition, Tire Type, and Ambient Temperature on the Emission of Tire–Road Particulate Matter, Atmosphere, 2023, 14(7), 1095 CrossRef.
Footnote |
| † Electronic supplementary information (ESI) available. See DOI: https://doi.org/10.1039/d4ea00048j |
| This journal is © The Royal Society of Chemistry 2024 |