
 Open Access Article
 This Open Access Article is licensed under a
 Creative Commons Attribution 3.0 Unported Licence
Ultrafine particle emissions from dry clutches: number concentration, size distribution and chemical composition
Rikard
Hjelm
 *a,
Yezhe
Lyu
a,
Alessandro
Mancini
b,
Bozhena
Tsyupa
b,
Minghui
Tu
c,
Ulf
Olofsson
c and
Jens
Wahlström
a
*a,
Yezhe
Lyu
a,
Alessandro
Mancini
b,
Bozhena
Tsyupa
b,
Minghui
Tu
c,
Ulf
Olofsson
c and
Jens
Wahlström
a
aLTH, Lund University, Lund, Sweden. E-mail: rikard.hjelm@lth.lu.se
bMaterials Engineering & Laboratories, Research & Development Dept., Brembo S.p.A., Viale Europa 2, 24040 Stezzano, Bergamo, Italy
cKTH Royal Institute of Technology, Stockholm, Sweden
First published on 21st November 2023
Abstract
Non-exhaust sources, such as brakes, tyres, roads, and clutches, emit a large portion of airborne particles in road transportation, from ultrafine to coarse sizes. While airborne wear particle emissions from brakes and road-tyre contacts have been studied extensively, emissions from clutches have been overlooked. A preliminary study using a novel test rig has indicated that dry clutches also emit airborne wear particles. This paper presents a multi-method for the assessment of ultrafine particles from dry clutches regarding the number concentration, size distribution and chemical composition. The results show that ultrafine particles are emitted both during run-in and at the steady state, featuring a bi-modal size distribution. Elementary analysis shows that the particles consist of several elements, predominately iron, silicon, and sulfur. It can be concluded from this study that ultrafine particles are always generated when the clutch is operated.
Environmental significanceNon-exhaust emissions are generated from sliding interfaces in the transport sector. Sources such as road–tyre, rail–wheel, and brake pad–brake disc have been thoroughly investigated, whereas clutches have been neglected. Ultrafine particles generated from clutches impact the environment by becoming airborne and are ultimately deposited in human lungs. These particles tend to aggravate a variety of diseases. It is of further significance for the human environment that the majority of particles are generated in urban environments, i.e., close to people, compared to other particle sources from the transport sector. In the present paper, particles are generated in a test rig, and their size distribution is measured, and inorganic fraction chemical characterization is performed. |
Introduction
Airborne particle emissions have gained much attention during the last decade due to their detrimental impact on many aspects of health among humans. Apart from lung-related health issues, such as obstructive lung diseases,1 they cause or contribute to a wide variety of health problems. Balboni et al.2 linked exposure to particulate matter, mainly PM2.5, from air pollution to cognitive decline, memory loss and dementia. Fernandes et al.3 suggested an increase in the frequency and severity of seizures in epilepsy patients due to high air pollution, with particles entering the body causing inflammation. Airborne wear particles are also linked to cardiovascular and metabolic diseases,4 diabetes,5 and cancer,6–8 and have been estimated to have contributed to 5 million deaths worldwide.9To mitigate these problems, new regulations have been introduced. The European Commission proposed the new Euro 7 standards [Euro7] to reduce pollutant emissions from vehicles and improve air quality. A large portion of the emissions from vehicles are constituted from non-exhaust sources.10 These sources include brakes,11,12 road-tyre contact,13,14 and wheel-rail contact,15,16 which have all been thoroughly investigated. Special attention has been paid to ultrafine particles (aerodynamic diameter no larger than 100 nm) from different transport modes due to their very strong penetration effects and potential toxicities.17
A dry clutch is a typical sliding contact as a potential non-exhaust emission source that has not been studied systematically.
Clutch emissions were investigated by Jacko et al.18 in 1973, but with a focus on asbestos, which is no longer prevalent in clutches.
While electric vehicles constitute an increasing share of new car sales, the majority of both new sales and the existing vehicle fleet are petrol and diesel vehicles in Europe as well as other markets. Of these vehicles, the majority have manual transmissions with a dry clutch.
In a recent study, Hjelm et al.19 designed a clutch test rig in which the friction material of a dry clutch can slip against the pressure plate under controlled conditions, and the results indicated emissions of airborne wear particles with a run-in phase and a steady state phase similar to brake emissions. Moreover, the generated particle emissions show a bimodal size distribution with a geometric mean diameter of approximately 70 nm.
However, this study only used one particle instrument and got preliminary results without investigating the ultrafine particle number concentration and chemical composition.19 Thus, it is still necessary to (1) verify the results, using a second measurement setup, as well as (2) continue the analysis by performing an inorganic fraction chemical characterization of the particulate matter emitted from the clutch. Therefore, this paper presents a multi-method assessment using two spectrometers, namely MiniWRAS® (optical and electrical), and ELPI+ (electrical), together with inorganic fraction chemical characterization from filter samples.
Method
Clutch test rig
The clutch test rig has been designed and used in recent work by some of the authors.19 It uses an unmodified clutch found in typical European compact cars, such as the Volkswagen Golf, Audi A3, and Seat Ibiza.A sketch of the clutch test rig can be seen in Fig. 1. In the test rig, a friction plate, with friction material on both sides, is mounted and axially fixed on a shaft driven by an electric motor. Two cast iron pressure plates, one on each side of the friction plate, can slide axially on pins, but are prevented from rotating. They are pressed against the friction plate by springs. Thus, when the shaft rotates, the friction plate slides against the pressure plate, causing slipping of the clutch.
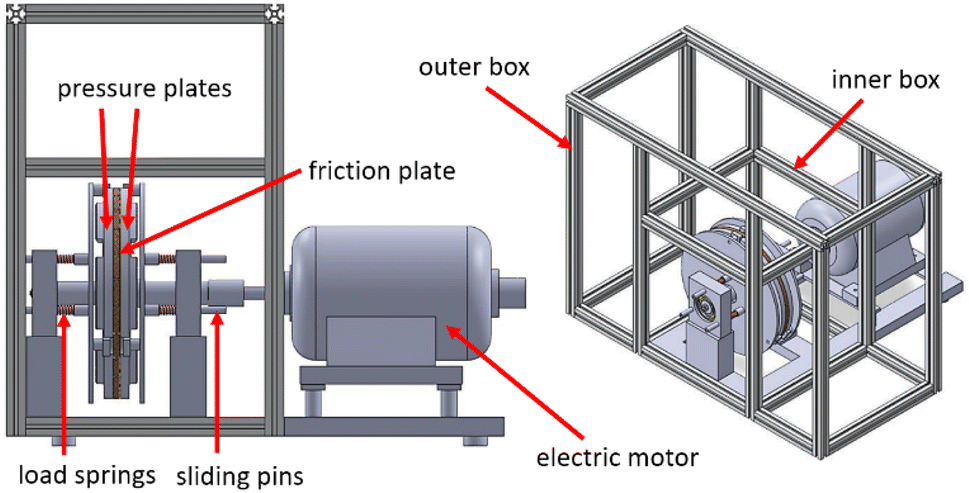 | ||
| Fig. 1 Sketch of the clutch test rig with its main components. | ||
In all tests, the friction plates rotate at 1100 rpm. The total spring force is 16 N. This allows a slow and easily monitored temperature increase in the pressure plates.
An inner box encapsulates the friction and pressure plates. This box represents the housing of the clutch (and gearbox) in an automobile. This box has the ability to be completely sealed or fully open, replicating the closed or partially open clutch housings found in different applications. In the current study, the inner box is in its open configuration, i.e., the top lid is removed, to allow good airflow within the outer box.
A key design feature of the clutch test rig is that the friction plates and pressure plates are intact OEM parts, as used in automobiles, i.e., no samples are cut out.
Experimental setup
The experimental setup consists of the clutch test rig shown in Fig. 1 and several instruments for particle pre-filtration as well as particle and temperature measurements. A schematic depiction of the setup can be seen in Fig. 2. Air is supplied to the outer box from an Allentown Ecoflo™ fan with a built-in HEPA filter, at a constant airflow of 4 m3 h−1. Airborne wear particles generated by the clutch test rig are carried by the air stream to the outlet of the outer box, where they are sampled by the MiniWRAS® and EPLI+. Temperature is measured for both pressure plates using thermocouples, mounted about 1 mm below the surface, i.e., 1 mm into the pressure plate in the axial direction from the contact with the friction material. The temperature is logged at 1 Hz using a PICO® TC-08 thermocouple data logger.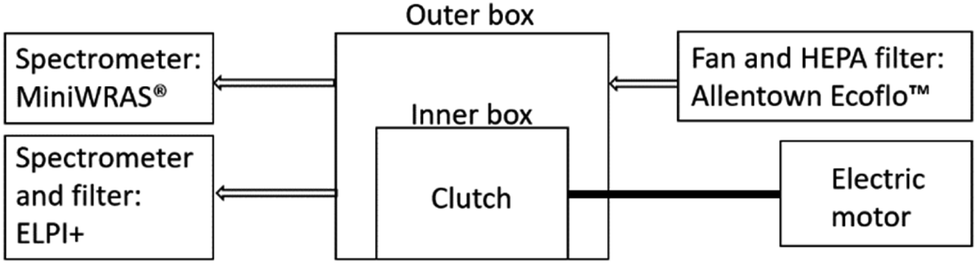 | ||
| Fig. 2 Schematic depiction of the experimental setup. | ||
MiniWRAS
The first spectrometer is a GRIMM Mini Wide-Range Aerosol Spectrometer (MiniWRAS®) Model 1371. It measures particles with an electrical particle detector in the range of 10–193 nm and an optical aerosol spectrometer in the range of 0.253–35 μm, giving a wide particle size range from 10 nm to 35 μm. The output of the MiniWRAS® includes particle mass and number concentration, as well as the particle size distribution at 41 size channels. The airflow rate of the MiniWRAS® is 1.2 lpm and the measurement interval is 1 min.ELPI+
The second spectrometer is an electrical low pressure impactor (ELPI+, DEKATI®), which measures particles from 6 nm to 10 μm. It can also collect particles at 14 size-resolved stages with aluminum or polycarbonate foils for offline characterization. In these 14 stages, stages 1 to 5 have D50% values from 6 nm to 94 nm, within the ultrafine particle size range (<0.1 μm). Stages 6 to 14 have D50% values from 0.15 μm to 10 μm, covering both the fine (0.1 μm−2.5 μm) and coarse (2.5 μm–10 μm) particle size ranges. The ELPI+ has a flow rate of 10 lpm and sampling rate of 1 Hz. In this study, pre-greased polycarbonate collection substrates were used to collect the emitted airborne particles.Particle filter – inorganic fraction chemical characterization
The elemental composition of the collected particles on ELPI+ stage 4 (D50% – 54 nm) and stage 5 (D50% – 94 nm) is qualitatively analyzed using a Bruker® M4 Tornado Energy Dispersive micro-X-ray Fluorescence Spectrometer (μ-ED-XRF). The spectrometer is equipped with an X-ray source with a Rh source (a polycapillary X-ray optic) with a spot size below 20 μm. The X-ray source working parameters are set to a voltage of 50 kV and current intensity of 200 μA. The μ-ED-XRF can only detect elements with atomic number Z > 10, but it is a non-destructive method, so the substrates can be used for other analyses.Results
Temperature
The results of the temperature measurements can be seen in Fig. 3.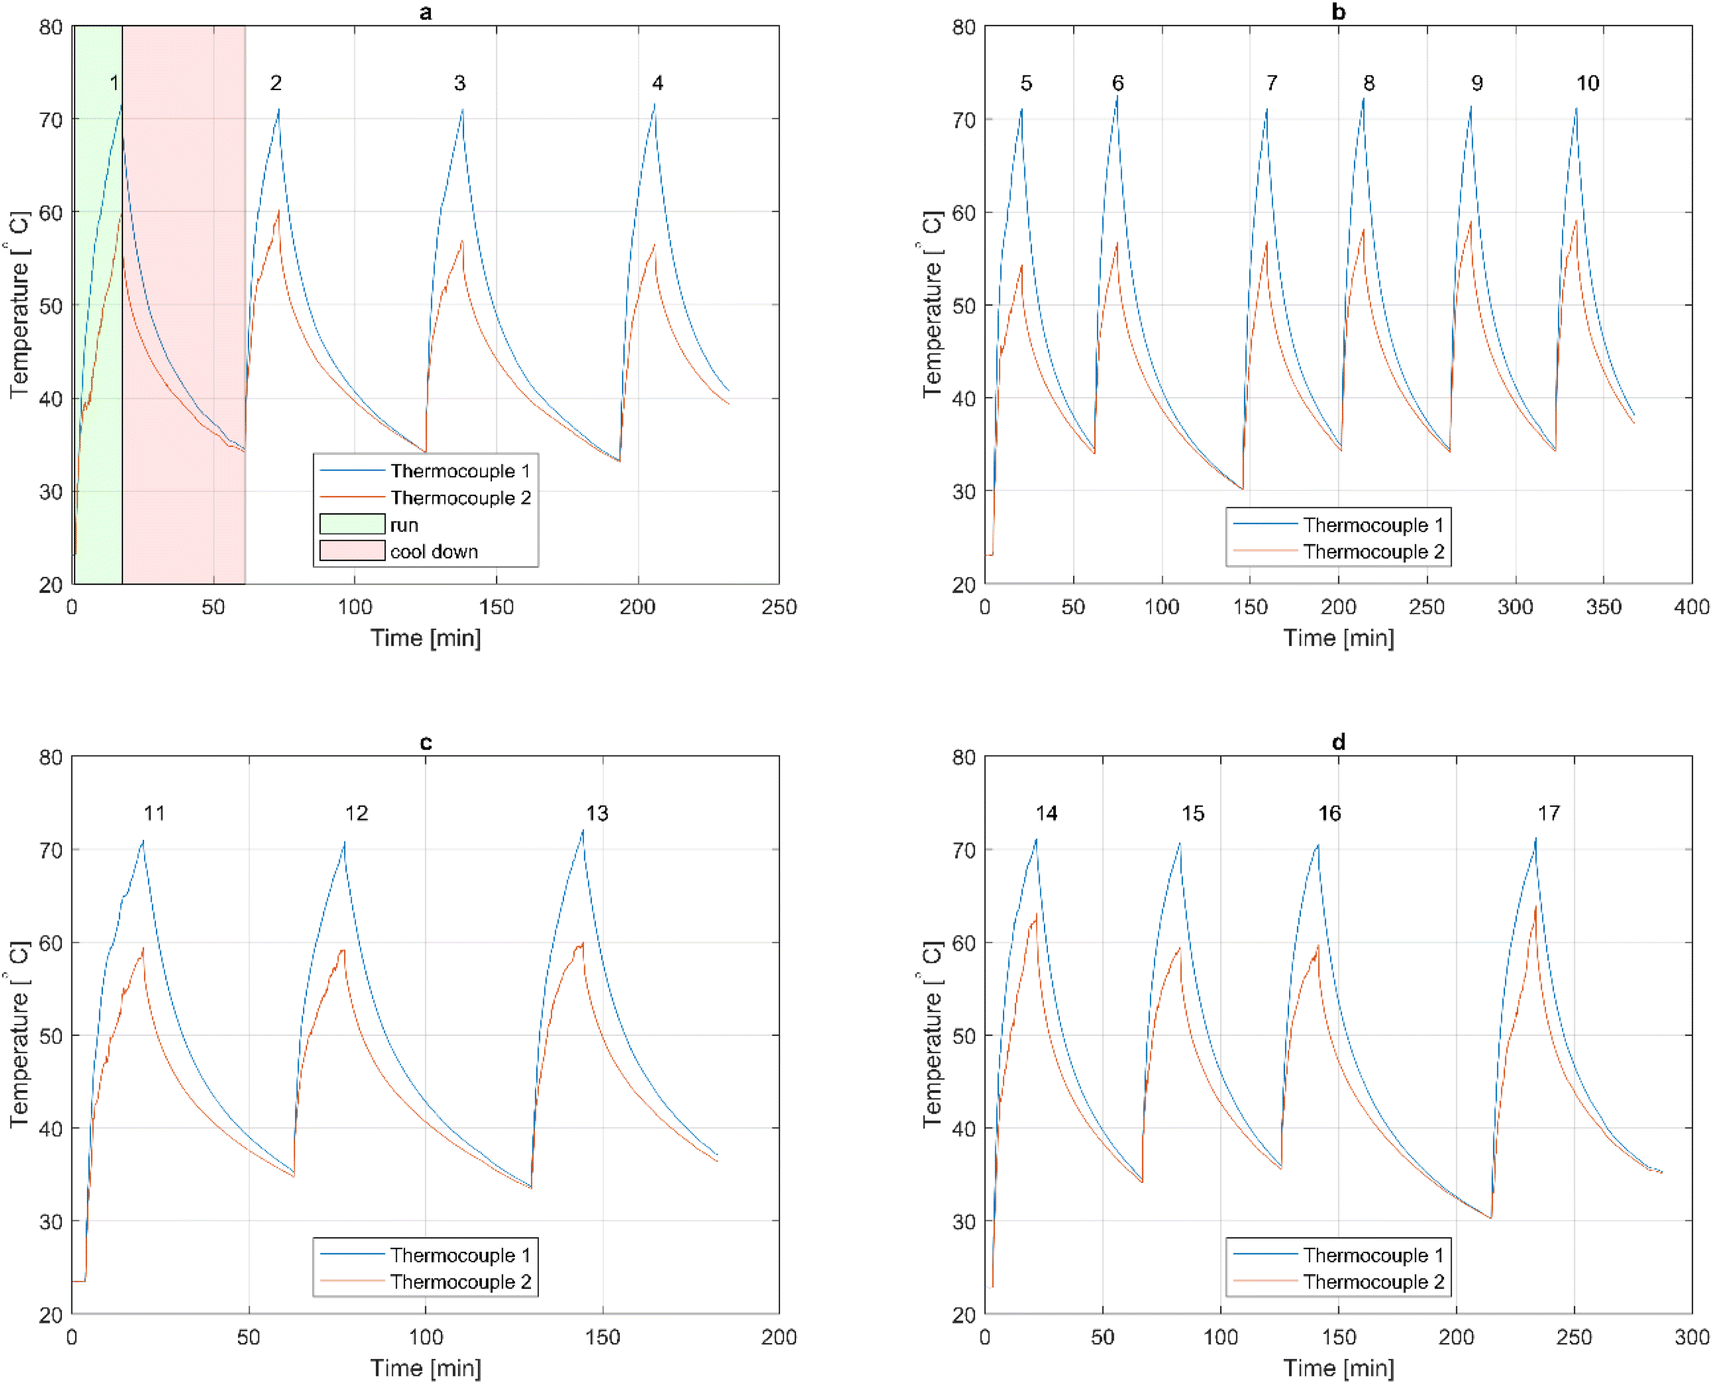 | ||
| Fig. 3 Temperature in the pressure plates as measured by thermocouples 1 and 2. Shaded regions correspond to run (green shade) and cool-down (pink shade), respectively. (a) First day, with tests 1–4, (b) second day, with tests 5–10, (c) third day, with tests 11–13, and (d) fourth day, with tests 14–17. | ||
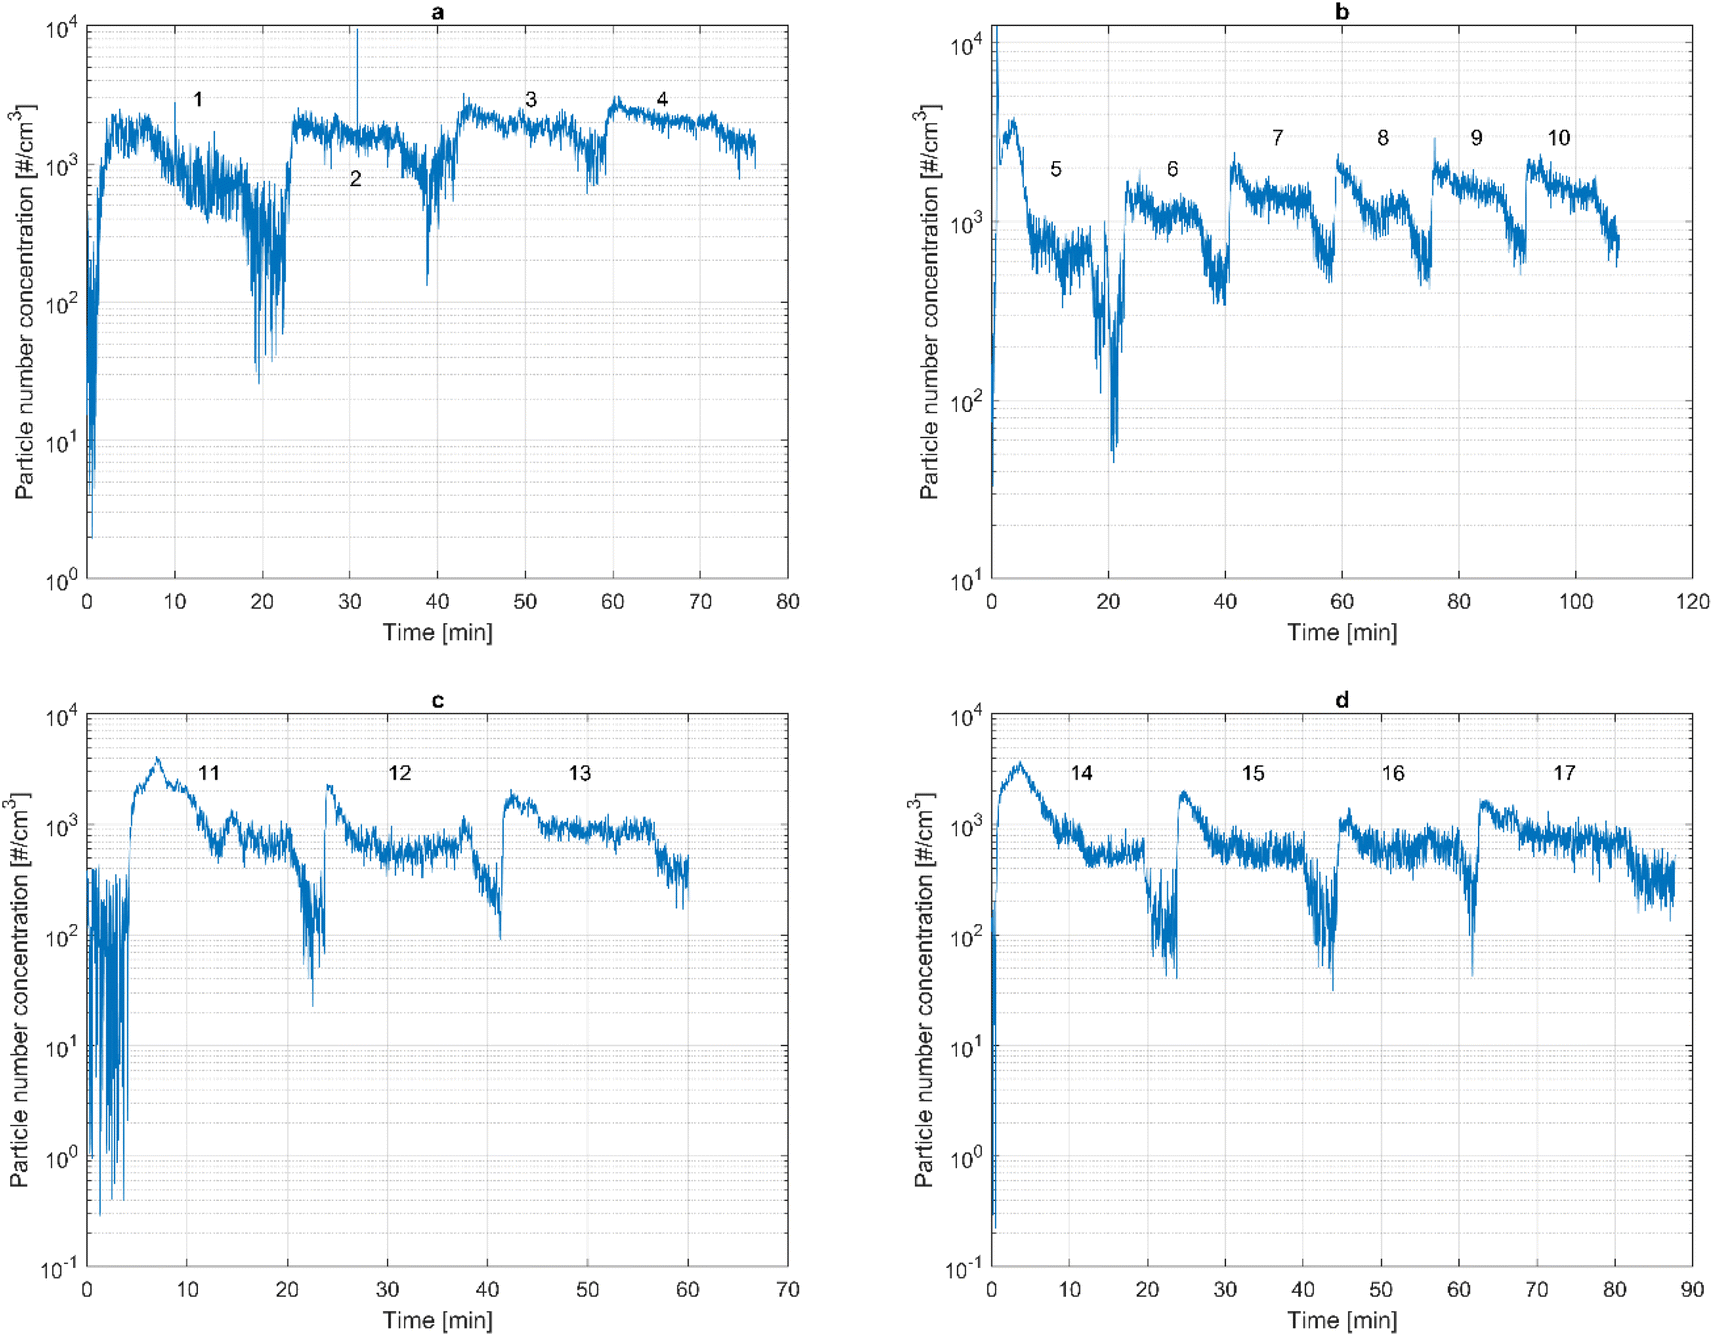
Particle number concentration
Particle number concentration (PNC) measured using the MiniWRAS® can be seen in Fig. 4.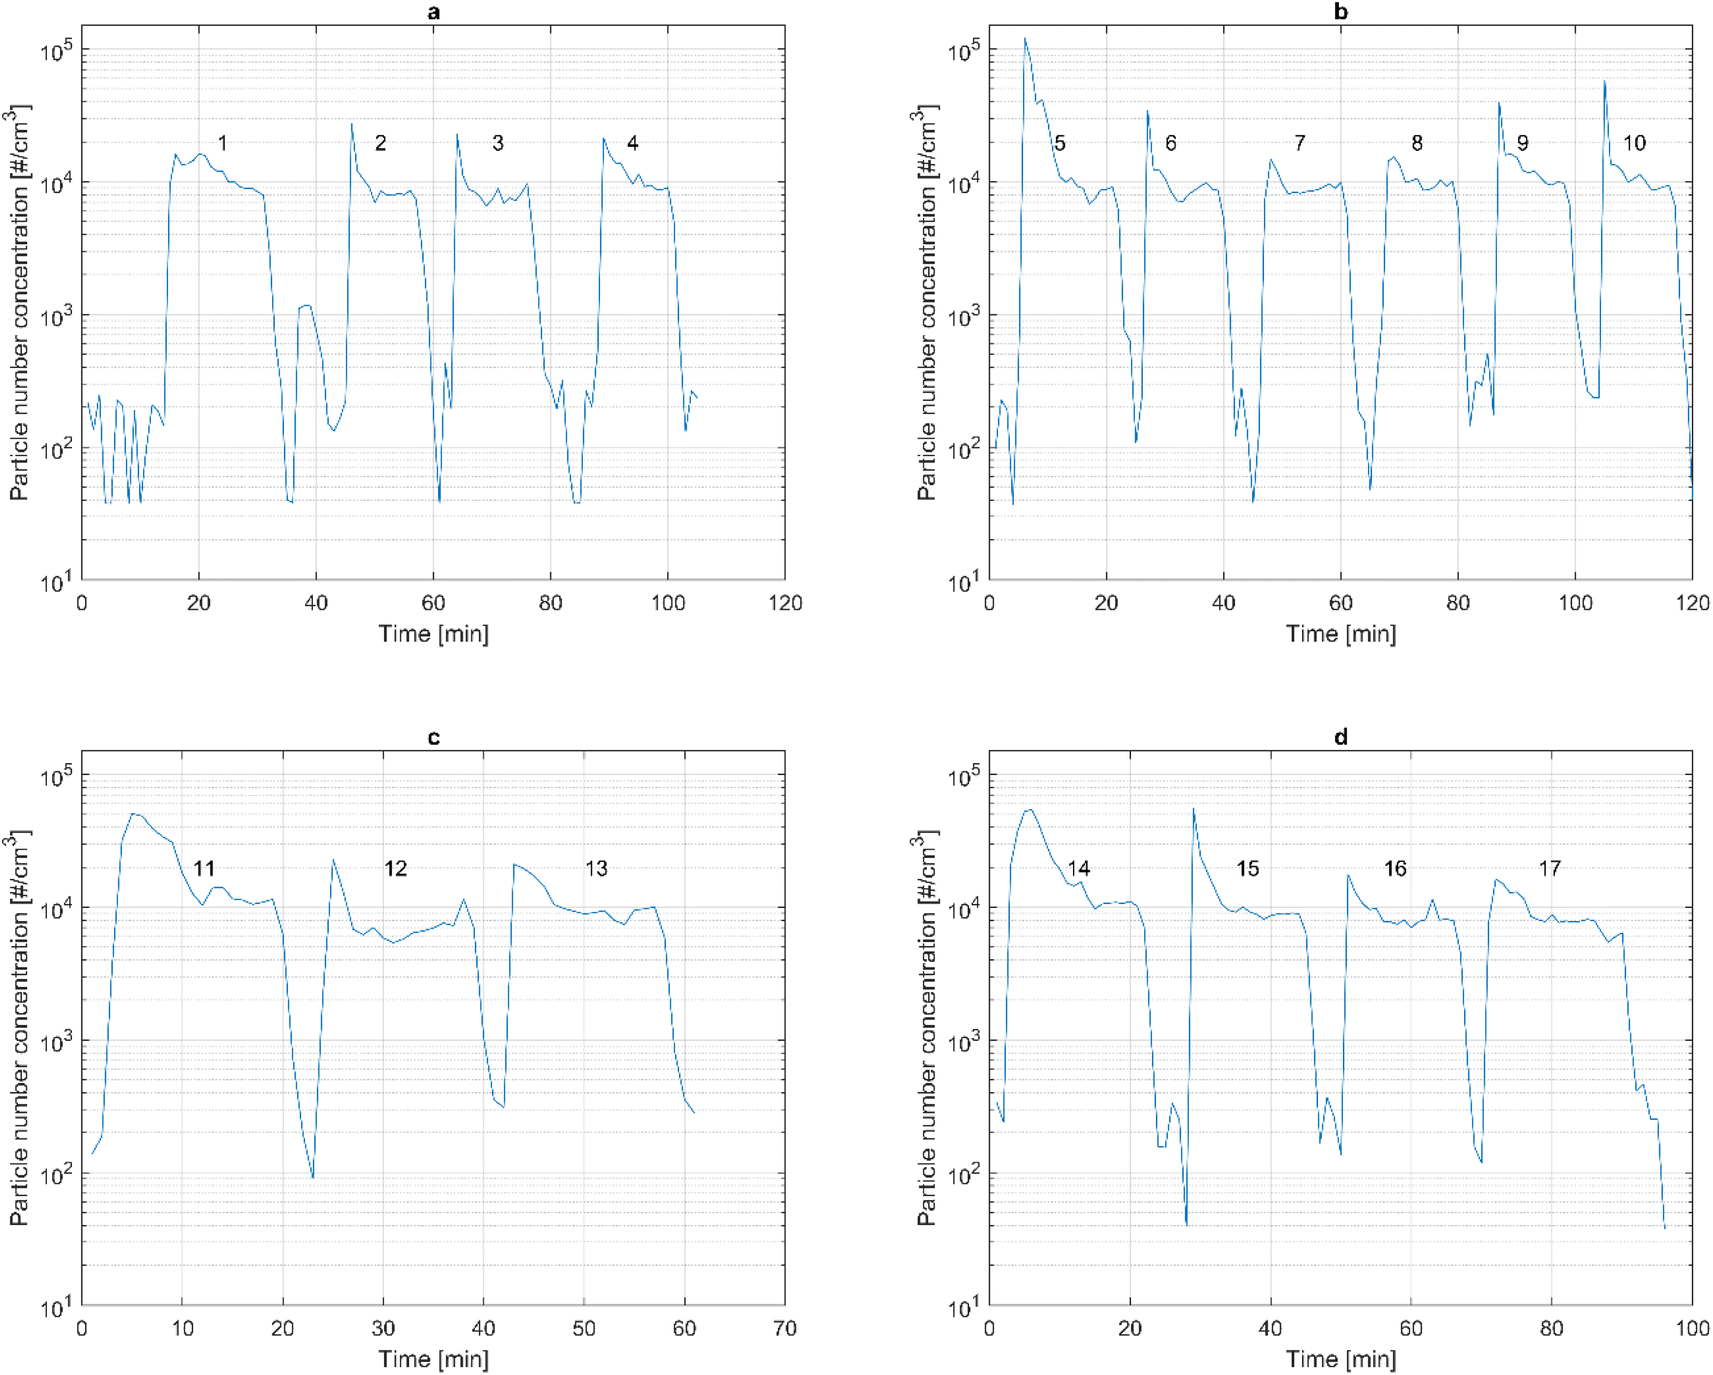 | ||
| Fig. 4 Particle number concentration as measured by the MiniWRAS®. Note the logarithmic scale on the ordinate. (a) First day, with tests 1–4, (b) second day, with tests 5–10, (c) third day, with tests 11–13, and (d) fourth day, with tests 14–17. | ||
The results in Fig. 4 all exhibit similar behavior. When the clutch rig begins to rotate, the PNC increases quickly, reaching a distinct peak, and subsequently decreases to a slightly lower and more stable level. These phases correspond to run-in and steady state. Once the clutch rig is turned off, the PNC quickly drops.
From Fig. 4 it can be seen qualitatively that all measurements display a similar behavior, and that the test procedure is stable. However, for a more quantitative analysis, the measurement results from the ELPI+ in the same test runs are shown in Fig. 5.
 | ||
| Fig. 5 Particle number concentration as measured by the ELPI+. Note the logarithmic scale on the ordinate. (a) First day, with tests 1–4, (b) second day, with tests 5–10, (c) third day, with tests 11–13, and (d) fourth day, with tests 14–17. | ||
Similar behaviors with run-in and steady state can be seen from Fig. 5. It is worth noting that there is a quantitative difference between the MiniWRAS® and ELPI+ measurements. For all tests, the MiniWRAS® displays a PNC about ten times as high as that of the ELPI+. A possible explanation for this is electric charge of the particles; see the Discussion section.
To investigate whether ultrafine particles are generated during the run-in and steady state phases, Test 13 in Fig. 5c is further analyzed. This measurement shows a clear distinction between run-in and steady state, as seen in Fig. 6.
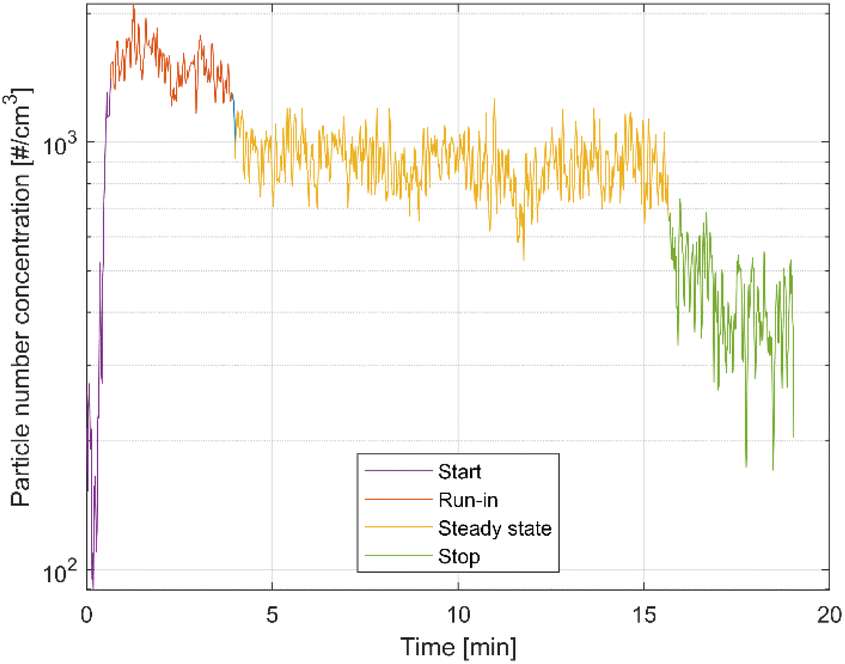 | ||
| Fig. 6 Run-in and steady state of a particle number concentration measurement using the ELPI+. | ||
For this measurement, the particle size distribution is plotted for run-in and steady state (see Fig. 7a and b), respectively.
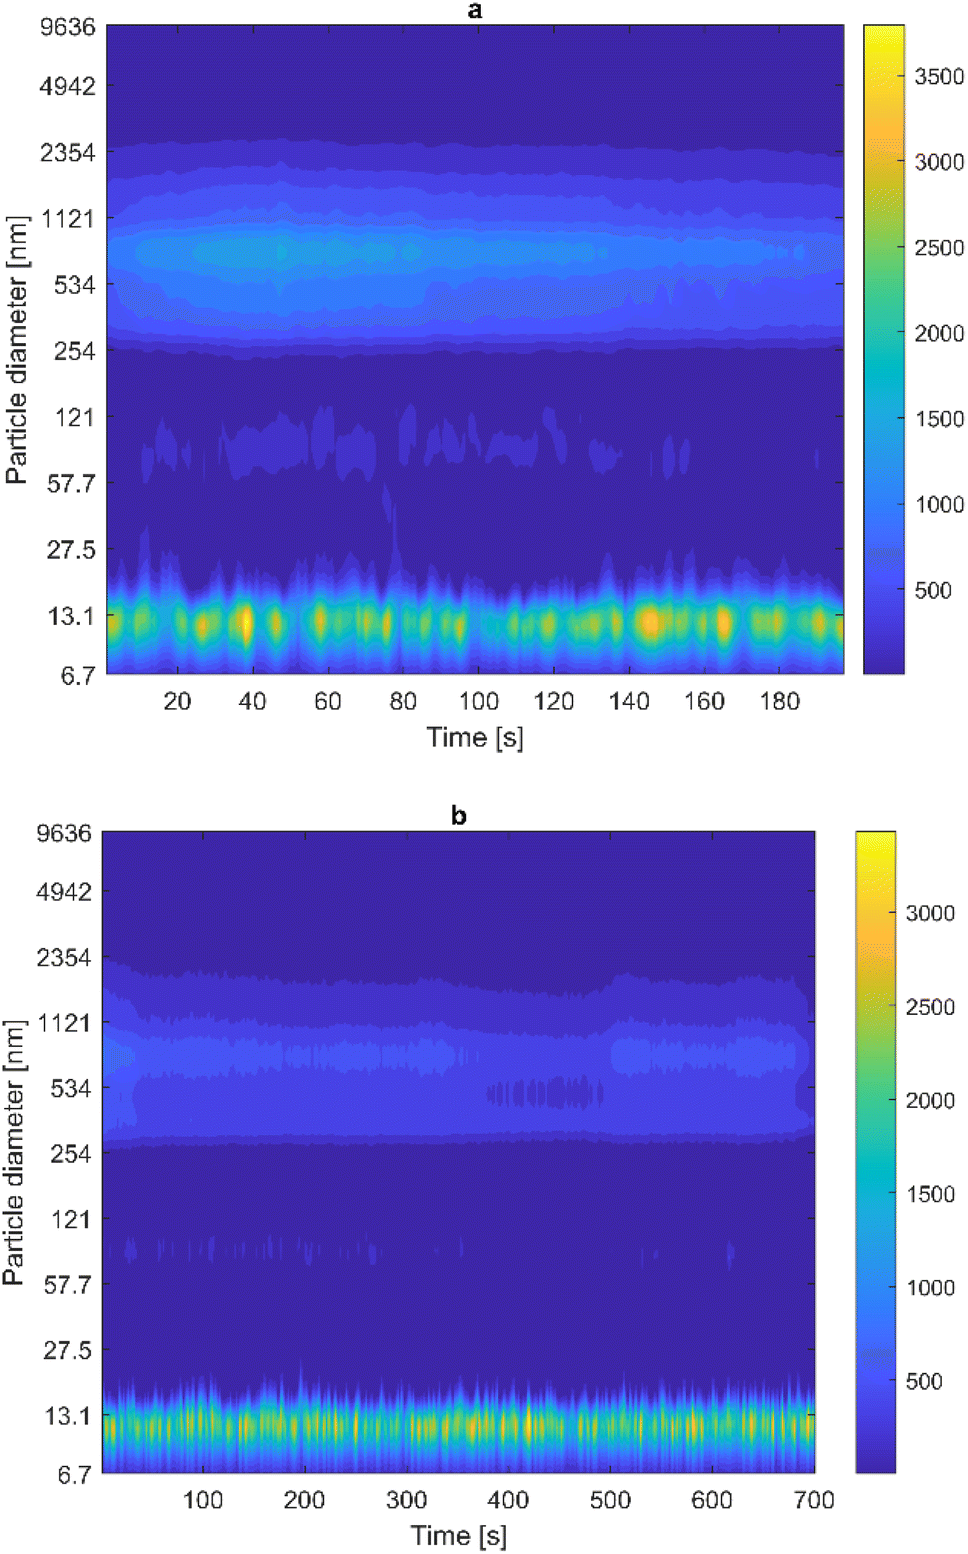 | ||
| Fig. 7 Particle size distribution of the phases in Fig. 6. (a) Run-in, and (b) steady state. Note the bi-modal size distribution for both phases. | ||
It can be seen in Fig. 7 that ultrafine particles, with size around 10 nm, are generated both during run-in and the steady state. Larger particles, of size around 0.5–1 μm, are also generated. Both run-in and steady state thus exhibit a bi-modal size distribution. This can be seen more clearly in Fig. 8.
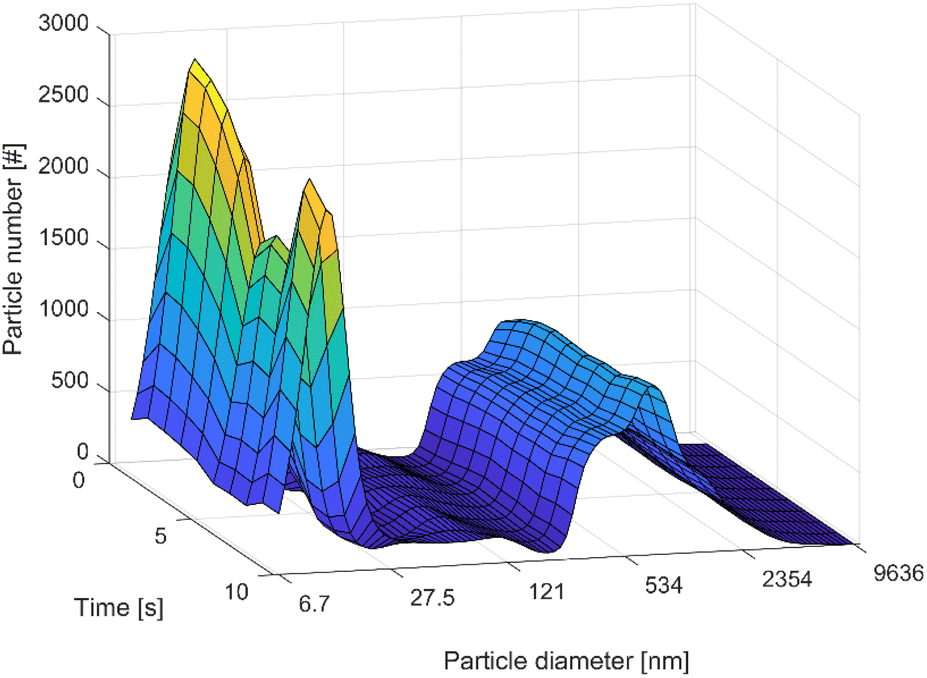 | ||
| Fig. 8 Bimodal size distribution. Data correspond to the first ten seconds during run-in. | ||
Fig. 8 shows the particle size distribution for the first ten seconds during the run-in phase of the test in Fig. 7. This short time is used for better visibility; however, the trend is similar for other times. Ultrafine particles thus constitute the largest portion of the particles generated by the clutch.
The geometric mean value of the particle diameters is calculated for each time in the steady state phase in Fig. 7. The arithmetic mean value of these values is then calculated, which gives an average mean diameter of 65 nm.
Material characterization
The results from elemental distribution measurements can be seen in Fig. 9. From a total of 19 particle accumulation areas (P1–P19), six were chosen to create intensity spectra.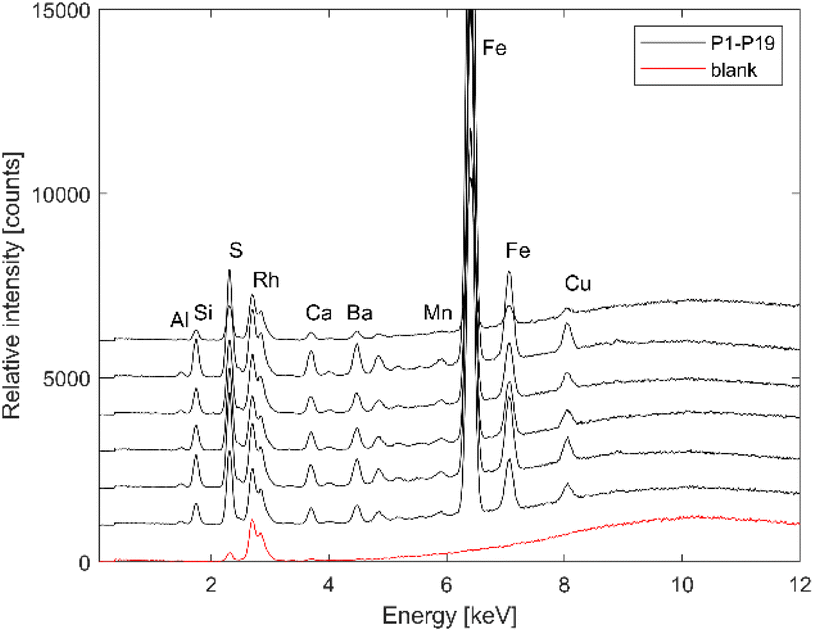 | ||
| Fig. 9 Elemental composition of six particle accumulation areas as measured by μ-ED-XRF. The composition of a blank filter is also shown as a reference. | ||
Several elements can be clearly distinguished in the particulate matter emitted from the clutch test, predominately iron. The weight distribution from the filters can be seen in Tables 1 and 2 (see Appendix). This can be seen graphically in Fig. 10.
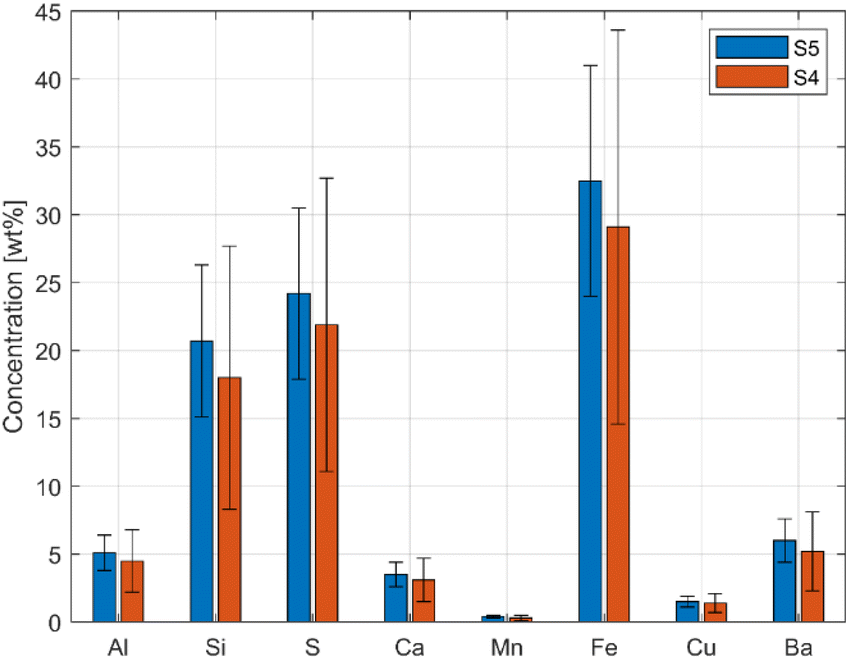 | ||
| Fig. 10 Concentration expressed as weight percentage (wt%) of inorganic fractions detected in the collected particulates. | ||
From Fig. 10 it can be seen that there is no significant difference in inorganic fraction between filters S4 and S5. There was not enough material on the minor filters (S1 to S3) to obtain reliable ED-XRF analysis.
Discussion
While the geometry of the friction plate and pressure plate resemble the pad and disc of a disc brake, the clutch also resembles a drum brake by means of the housing. Grigoratos et al.20 found lower particulate matter mass emission from drum brakes than from disc brakes; however, the ratio of PM2.5 to PM10 was significantly higher. This can be explained by smaller particles escaping the drum more easily. It is reasonable to assume that the same holds true for clutches, i.e., the housing is more effective in preventing larger particles from escaping. It is also possible that this effect is applicable to PM1 and finer. It remains as future work to investigate particle emissions from the clutch where the inner box is opened and closed to different degrees.Similarly, Storch et al.21 reported that wear particles from drum brakes initially accumulated in the drum but began escaping from the drum once saturation of the accumulation was reached. This resulted in a steady state level of emissions after an initial phase.
Just like brakes,22–26 the clutch in these experiments exhibits a run-in and a steady state phase. However, contrary to brakes where ultrafine particles are predominately generated during the run-in phase,27 the clutch emits ultrafine particles both during run-in and in the steady state, as seen in Fig. 7. Thus, it can be concluded that ultrafine particles are generated at all times when the clutch slips.
While the focus of this paper lies on particle number concentration, particle mass concentration was also measured. In the first test run for each day, an increase in particle mass concentration was seen. Typically, this increase was two- or threefold compared to the succeeding tests of that day. The corresponding particle number concentration increase is less pronounced. The increase, in mainly particle mass concentration, is believed to be due to aging of the surfaces, such as formation of oxides due to open-air exposure.
The average mean diameter of the particles in the steady state phase was 65 nm. This corresponds well to the value of 70 nm according to the MiniWRAS®. However, due to the bimodal distribution, most particle diameters are around either 10 nm or 700 nm.
Several inorganic elements, predominately iron, can be detected on filter samples. It remains as future work to compare these results with field measurement. It is, however, difficult to distinguish clutch emissions from other non-exhaust emission sources in the field.
Clutch operation differs from that of brakes. While fully engaged, there is no wear of the clutch. Instead, all wear takes place during gear shifting, such as driving in cities during rush hour, traffic congestion, and parking. Thus, the majority of clutch use, and consequently wear, takes place in environments close to humans, such as pedestrians. Conversely, in more deserted areas, such as highways, there is very little clutch wear. This means that the majority of clutch particle emissions are in the vicinity of humans, which increases the impact of clutch wear particles on human health. Brakes are, on the other hand, not very heavily applied in situations like traffic congestion, where vehicles are traveling at low speed.
The agreement between the MiniWRAS® and the ELPI+ measurements is good qualitatively, where the same behavior of the particle number concentration is shown by both spectrometers. Quantitatively, however, the MiniWRAS® reports a particle number concentration about ten times as high as the ELPI+ throughout the tests. This is believed to be due to the electric charge of the emitted particles. When metal particles are generated due to wear, they can obtain a certain charge. A charged particle is then counted by the instrument as several particles. To avoid these erroneous counts, a neutralizer can be used. For this reason, the ELPI+ measurements are believed to be more reliable. It remains as future work to further explore this disagreement between the spectrometers.
In this paper it was investigated what particles are generated and emitted from clutches in terms of number, size, and chemical composition. To further increase the understanding of wear particle generation mechanisms, it remains to be answered how particles are generated. In ongoing work, the authors will study the friction material surface before and after testing using scanning electron microscopy (SEM), as done by, e.g., Papa et al.28
Using results from the ELPI+ measurements, a first step towards emission factors for clutches can be taken. Under the test conditions, a flow rate of 4 m3 h−1 and a particle number concentration of around 1000 cm−3 yield four billion particles per hour. The total sliding distance during an hour, with a mean dimeter of 190 mm and a rotational speed of 1100 rpm, is about 1 km. This corresponds to roughly 2–4 million particles per meter of sliding distance of the clutch. This is comparable to emissions from disc brakes.26
Conclusions
This paper presents spectrometer measurements and material characterization of airborne wear particles from dry clutches. In brief, the following conclusions can be drawn.• Ultrafine particles are emitted during both the run-in and steady state phases of clutch operation.
• Run-in and steady state both exhibit a bi-modal size distribution, with a primary peak around 10 nm particle size.
• Several elements could be distinguished from the chemical composition, predominantly iron, but also aluminum, silicon, sulfur, barium, and others.
Author contributions
Conceptualization: RH, YL, AM, JW; methodology: RH, YL, AM, JW; software: RH; validation: RH, YL, AM, BT, MT, UO, JW; formal analysis: RH, YL, AM, BT; investigation: RH, YL, AM, BT, MT, UO, JW; resources: UO, JW; writing – original draft: RH, YL; writing – review & editing: RH, YL, AM, BT, MT, UO, JW; visualization: RH, YL, AM; project administration: YL, UO, JW; funding acquisition: YL, UO, JW.Appendix
Several elements can be clearly distinguished in the particulate matter emitted from the clutch test, predominately iron. The weight distribution from the filters can be seen in Tables 1 and 2.| S4/wt% | Al | Si | S* | Ca* | Mn | Fe | Cu | Ba |
|---|---|---|---|---|---|---|---|---|
| a Partially or minimally due to the collection substrate. | ||||||||
| P11 | 9.99 | 12.11 | 25.08 | 23.39 | 1.46 | 24.11 | 0.40 | 3.45 |
| P10 | 9.39 | 18.56 | 25.79 | 9.83 | 1.06 | 30.34 | 0.46 | 4.56 |
| P9 | 8.63 | 17.31 | 26.98 | 10.13 | 0.62 | 30.48 | 0.88 | 4.98 |
| P8 | 6.67 | 21.42 | 22.05 | 7.57 | 0.54 | 34.73 | 1.24 | 5.78 |
| P7 | 7.08 | 20.94 | 26.09 | 7.54 | 0.53 | 31.26 | 0.98 | 5.57 |
| P6 | 5.78 | 18.53 | 21.71 | 12.35 | 0.47 | 33.72 | 1.46 | 5.99 |
| P5 | 7.64 | 21.42 | 23.97 | 6.81 | 0.75 | 32.67 | 0.89 | 5.85 |
| P4 | 11.97 | 6.37 | 26.69 | 26.69 | 1.42 | 25.36 | 0.00 | 1.51 |
| P3 | 8.59 | 11.32 | 33.84 | 19.88 | 0.94 | 23.37 | 0.00 | 2.06 |
| P1 | 7.63 | 17.87 | 24.59 | 14.38 | 0.54 | 28.68 | 0.70 | 5.61 |
| Average | 8.34 | 16.59 | 26.68 | 13.86 | 0.83 | 29.47 | 0.70 | 4.54 |
| SD | 1.80 | 5.03 | 3.38 | 7.10 | 0.37 | 4.01 | 0.49 | 1.64 |
| S5/wt% | Al | Si | S* | Ca* | Mn | Fe | Cu | Ba |
|---|---|---|---|---|---|---|---|---|
| a Partially or minimally due to the collection substrate. | ||||||||
| P19 | 5.43 | 21.92 | 28.61 | 4.26 | 0.30 | 31.37 | 1.63 | 6.48 |
| P18 | 5.49 | 22.90 | 28.50 | 4.47 | 0.44 | 30.79 | 1.46 | 5.96 |
| P17 | 6.74 | 18.89 | 37.27 | 4.49 | 0.30 | 24.73 | 1.02 | 6.56 |
| P16 | 7.03 | 23.48 | 27.68 | 4.44 | 0.29 | 29.71 | 1.16 | 6.20 |
| P15 | 5.70 | 23.05 | 26.25 | 3.94 | 0.33 | 33.14 | 1.53 | 6.05 |
| P14 | 5.99 | 23.18 | 25.82 | 4.23 | 0.33 | 32.70 | 1.54 | 6.21 |
| P13 | 5.77 | 21.91 | 23.66 | 3.55 | 0.36 | 36.50 | 1.77 | 6.48 |
| P12 | 5.74 | 22.84 | 23.23 | 3.78 | 0.33 | 34.09 | 1.57 | 6.41 |
| P11 | 5.11 | 22.39 | 24.16 | 3.68 | 0.40 | 36.04 | 1.74 | 6.49 |
| P10 | 5.33 | 21.91 | 25.36 | 3.70 | 0.36 | 35.37 | 1.64 | 6.32 |
| P9 | 5.44 | 22.82 | 25.74 | 3.73 | 0.36 | 34.09 | 1.60 | 6.22 |
| P8 | 5.15 | 23.48 | 25.99 | 3.76 | 0.35 | 33.64 | 1.55 | 6.09 |
| P7 | 5.02 | 21.30 | 27.11 | 3.64 | 0.39 | 34.21 | 1.55 | 6.78 |
| P6 | 5.98 | 22.46 | 27.55 | 4.04 | 0.38 | 31.79 | 1.51 | 6.29 |
| P5 | 5.22 | 21.96 | 26.73 | 3.80 | 0.37 | 34.00 | 1.59 | 6.33 |
| P4 | 5.50 | 21.78 | 24.43 | 3.71 | 0.40 | 36.99 | 1.71 | 6.48 |
| P3 | 5.45 | 21.68 | 25.22 | 3.61 | 0.39 | 35.82 | 1.71 | 6.11 |
| P2 | 5.22 | 22.33 | 24.62 | 3.74 | 0.39 | 35.61 | 1.72 | 6.37 |
| P1 | 5.39 | 20.34 | 27.55 | 3.61 | 0.40 | 34.60 | 1.66 | 6.44 |
| Average | 5.62 | 22.14 | 26.71 | 3.90 | 0.36 | 33.38 | 1.56 | 6.33 |
| SD | 0.53 | 1.11 | 2.93 | 0.32 | 0.04 | 2.83 | 0.19 | 0.20 |
Conflicts of interest
There are no conflicts to declare.Acknowledgements
The authors gratefully acknowledge the financial support from the European Union's Horizon 2020 research and innovation programme (No. 954377; nPETS project). This study also received funding from FORMAS: Swedish Research Council for Sustainable Development (No. 2020-02302; Nescup project).References
- P. Misiukiewicz-Stepien and M. Paplinska-Goryca, Biological effect of PM10 on airway epithelium-focus on obstructive lung diseases, Clin. Immunol., 2021, 227, 108754 CrossRef CAS PubMed.
- E. Balboni, T. Filippini, M. Crous-Bou, M. Guxens, L. D. Erickson and M. Vinceti, The association between air pollutants and hippocampal volume from magnetic resonance imaging: A systematic review and meta-analysis, Environ. Res., 2022, 204, 111976 CrossRef CAS PubMed.
- M. Fernandes, C. Carletti, L. S. de Araújo, R. Santos and J. Reis, Respiratory gases, air pollution and epilepsy, Rev. Neurol., 2019, 175, 604–613 CrossRef CAS PubMed.
- E. H. Shamsa, Z. Song, H. Kim, F. Shamsa, L. D. Hazlett and K. Zhang, The links of fine airborne particulate matter exposure to occurrence of cardiovascular and metabolic diseases in Michigan, USA, PLOS Global Public Health, 2022, 2, e0000707 CrossRef PubMed.
- A. Di Ciaula and P. Portincasa, Relationships between emissions of toxic airborne molecules and type 1 diabetes incidence in children: An ecologic study, World J. Diabetes, 2021, 12, 673 CrossRef PubMed.
- L. Bai, S. Shin, R. T. Burnett, J. C. Kwong, P. Hystad, A. van Donkelaar, M. S. Goldberg, E. Lavigne, S. Weichenthal and R. V. Martin, Exposure to ambient air pollution and the incidence of lung cancer and breast cancer in the Ontario Population Health and Environment Cohort, Int. J. Cancer, 2020, 146, 2450–2459 CrossRef CAS PubMed.
- D. Roy, S. H. Ahn, T. K. Lee, Y.-C. Seo and J. Park, Cancer and non-cancer risk associated with PM10-bound metals in subways, Transp. Res. D Transp. Environ., 2020, 89, 102618 CrossRef.
- S. Dehghani, R. Moshfeghinia, M. Ramezani, M. Vali, V. Oskoei, E. Amiri-Ardekani and P. Hopke, Exposure to air pollution and risk of ovarian cancer: a review, Rev. Environ. Health, 2023, 38(3), 439–450 CrossRef CAS PubMed.
- Health Effects Institute, State of global air 2019, Special Report, 2019 Search PubMed.
- R. M. Harrison, J. Allan, D. Carruthers, M. R. Heal, A. C. Lewis, B. Marner, T. Murrells and A. Williams, Non-exhaust vehicle emissions of particulate matter and VOC from road traffic: A review, Atmos. Environ., 2021, 262, 118592 CrossRef CAS.
- M. Rahimi, D. Bortoluzzi and J. Wahlström, Input parameters for airborne brake wear emission simulations: A comprehensive review, Atmosphere, 2021, 12, 871 CrossRef CAS.
- J. Kukutschová and P. Filip, Review of brake wear emissions: a review of brake emission measurement studies: identification of gaps and future needs, Non-exhaust emissions, 2018, 123–146 Search PubMed.
- B. Baensch-Baltruschat, B. Kocher, F. Stock and G. Reifferscheid, Tyre and road wear particles (TRWP)-A review of generation, properties, emissions, human health risk, ecotoxicity, and fate in the environment, Sci. Total Environ., 2020, 733, 137823 CrossRef CAS PubMed.
- M. Mattonai, T. Nacci and F. Modugno, Analytical strategies for the quali-quantitation of tire and road wear particles–A critical review, TrAC, Trends Anal. Chem., 2022, 116650 CrossRef CAS.
- U. Olofsson and Y. Lyu, Open system tribology in the wheel–rail contact—a literature review, Appl. Mech. Rev., 2017, 69(6), 060803 CrossRef.
- S. Abbasi, A. Jansson, U. Sellgren and U. Olofsson, Particle emissions from rail traffic: A literature review, Crit. Rev. Environ. Sci. Technol., 2013, 43, 2511–2544 CrossRef CAS.
- N. S. Vallabani, O. Gruzieva, K. Elihn, A. T. Juárez-Facio, S. S. Steimer, J. Kuhn, S. Silvergren, J. Portugal, B. Piña and U. Olofsson, Toxicity and health effects of ultrafine particles: Towards an understanding of the relative impacts of different transport modes, Environ. Res., 2023, 116186 CrossRef CAS PubMed.
- M. G. Jacko, R. T. DuCharme and J. H. Somers, Brake and clutch emissions generated during vehicle operation, SAE Trans., 1973, 1813–1831 Search PubMed.
- R. Hjelm, J. Wahlström, I. Yenibayrak, D. Sabani, P. Runsten and Y. Lyu, Airborne Wear Particles from Dry Clutches, Atmosphere, 2022, 13, 1700 CrossRef.
- T. Grigoratos, M. Mathissen, R. Vedula, A. Mamakos, C. Agudelo, S. Gramstat and B. Giechaskiel, Interlaboratory Study on Brake Particle Emissions—Part I: Particulate Matter Mass Emissions, Atmosphere, 2023, 14, 498 CrossRef.
- L. Storch, C. Hamatschek, D. Hesse, F. Feist, T. Bachmann, P. Eichler and T. Grigoratos, Comprehensive Analysis of Current Primary Measures to Mitigate Brake Wear Particle Emissions from Light-Duty Vehicles, Atmosphere, 2023, 14, 712 CrossRef.
- M. Leonardi, C. Menapace, V. Matějka, S. Gialanella and G. Straffelini, Pin-on-disc investigation on copper-free friction materials dry sliding against cast iron, Tribol. Int., 2018, 119, 73–81 CrossRef CAS.
- Y. Lyu, M. Leonardi, J. Wahlström, S. Gialanella and U. Olofsson, Friction, wear and airborne particle emission from Cu-free brake materials, Tribol. Int., 2020, 141, 105959 CrossRef CAS.
- W. Österle, I. Dörfel, C. Prietzel, H. Rooch, A. L. Cristol-Bulthé, G. Degallaix and Y. Desplanques, A comprehensive microscopic study of third body formation at the interface between a brake pad and brake disc during the final stage of a pin-on-disc test, Wear, 2009, 267, 781–788 CrossRef.
- J. Wahlström, Y. Lyu, V. Matjeka and A. Söderberg, A pin-on-disc tribometer study of disc brake contact pairs with respect to wear and airborne particle emissions, Wear, 2017, 384–385, 124–130 CrossRef.
- J. Wahlström, V. Matejka, Y. Lyu and A. Söderberg, Contact pressure and sliding velocity maps of the friction, wear and emission from a low-metallic/cast-iron disc brake contact pair, Tribol. Ind., 2017, 39, 460 CrossRef.
- Y. Lyu, A. Sinha, U. Olofsson, S. Gialanella and J. Wahlström, Characterization of ultrafine particles from hardfacing coated brake rotors, Friction, 2023, 11, 125–140 CrossRef CAS.
- G. Papa, K. Power, B. Forestieri, G. Capitani, P. Maiolino and I. Negri, Effects of oral exposure to brake wear particulate matter on the springtail Orthonychiurus folsomi, Environ. Pollut., 2023, 329, 121659 CrossRef CAS PubMed.
| This journal is © The Royal Society of Chemistry 2024 |