 Open Access Article
An innovative synthesis of carbon-coated TiO2 nanoparticles as a host for Na+ intercalation in sodium-ion batteries
Tanguy
Soudant
 ,
Solenne
Fleutot
,
Stéphanie
Bruyère
,
Lucie
Speyer
,
Sébastien
Hupont
,
Mickaël
Bolmont
,
Thomas
Girardet
,
Solenne
Fleutot
,
Stéphanie
Bruyère
,
Lucie
Speyer
,
Sébastien
Hupont
,
Mickaël
Bolmont
,
Thomas
Girardet
 ,
Loris
Raspado
,
Claire
Hérold
and
Sébastien
Cahen
,
Loris
Raspado
,
Claire
Hérold
and
Sébastien
Cahen
 *
*
Institut Jean Lamour, CNRS UMR 7198, Université de Lorraine, 54000 Nancy, France. E-mail: sebastien.cahen@univ-lorraine.fr
First published on 19th April 2024
Abstract
In this work, an innovative route to synthesize an anatase TiO2@C composite is presented. The synthesis was conducted using a soft chemistry microwave-assisted method using titanium(IV) butoxide as a titanium precursor. The residual (un)converted titanium precursor remaining after TiO2 synthesis was used as a carbon precursor and thermally treated under H2 to obtain nanoparticles of the TiO2@C composite. A superior reversible specific capacity was obtained with TiO2@C (120 mA h g−1 at a C/20 rate, 3rd cycle) compared to that with pristine TiO2 (66.5 mA h g−1 at a C/20 rate, 3rd cycle), in agreement with the importance of carbon coating addition to TiO2 nanoparticles as negative electrode materials for sodium-ion batteries.
Introduction
Currently, considering the environmental crisis, governments want to reduce greenhouse gas emissions. Therefore, electrification of the society is a way to free ourselves from the dependence on fossil fuels. The corresponding technological changes cause a very important demand for energy storage devices especially for electric vehicles (full electric or hybrid). Indeed, in 2016, the demand for batteries was around 41 GW h per year, which reached 550 GW h per year in 2022.1 Nowadays, Li-ion batteries (LIBs) are widely used in mobile devices especially in electric vehicles thanks to their high energy density storage. Among the elements used for batteries, lithium, cobalt, nickel, copper and even carbon (graphite) will become critical elements in the medium term (2025–2035).2 Moreover, lithium exploitation is not environmentally friendly, so it is necessary to develop sustainable alternatives for electrochemical storage technologies. Sodium-ion batteries (SIBs) appear as an interesting solution to free ourselves from the use of some critical elements cited previously. Unlike in LIBs, graphite cannot be used as a negative electrode material in SIBs due to poor sodium intercalation with a very low theoretical mass capacity of 35 mA h g−1 for NaC64 (372 mA h g−1 for LiC6).3–5 Consequently, hard carbons remain the most widely studied anode materials because they are very good candidates for sodium ion storage. They present several advantages such as the abundance of the carbon element, the low elaboration cost of hard carbons and their expected electrochemical performances (300 mA h g−1) for an energy density of 300 W h kg−1 for fully sodiated hard carbons.6–8 Elsewhere, transition metal oxides are another possible class of anode materials and are considered for both LIBs and SIBs.9–11 Among them, titanium dioxide (TiO2) is an attractive alternative negative electrode material owing to the titanium abundance, its non-toxicity and cost-effectiveness. Such anodes could be envisaged in stationary application where high mass/volume capacities are not required. Another interesting feature of titanium dioxide compared with hard carbons is the safety aspect of TiO2 as the nominal voltage of such an anode is 0.7 versus 0.1–0.05 V (vs. Na+/Na)8, avoiding Na plating risks12 with increased cyclability.13 TiO2 is a highly studied inorganic material due to its numerous applications in photocatalysis, cosmetics as a white pigment, optics, sensors and rechargeable batteries.14 Many polymorphs of TiO2 exist but the most common phases are rutile (tetragonal, P42/mnm), brookite (orthorhombic, Pbca) and anatase (tetragonal, I41/amd). The anatase polymorph is the most studied for applications in batteries due to its easy synthesis and electrochemical stability.15–18 In particular, the anatase polymorph shows the highest sodium storage13,19,20 as described in eqn (1), where y corresponds to the number of inserted Na+:| TiO2 + yNa+ + ye− ↔ NayTiO2 | (1) |
The nanoscale allows us to achieve better storage performance than the macroscale due to reduced diffusion lengths, a large specific surface area and high kinetic properties.21–23 In the literature, Titanium NanoParticles (TNPs) are mostly synthesized by a hydrothermal route.24,25 In this work, syntheses have been performed using a microwave-assisted procedure due to many advantages such as time gain, reduced power consumption, homogeneous heat and smaller sized particles obtained compared to the hydrothermal route.26 Unfortunately, TNPs are electrochemically unstable toward electrolyte due to their huge specific surface area which causes an important irreversible consumption of Na+ during the formation of the solid electrolyte interphase (SEI) at the electrode/electrolyte interface.19,27 Therefore, many studies have been focused on the improvement of the electrochemical stability of TNPs. Indeed, when a three-dimensional TiO2 anatase structure exhibits open galleries favourable for Na+ insertion/deinsertion,28 it suffers from low conductivity and slow ion diffusion.29
One cost-effective approach used for improving the capacity and rate capability is the formation of carbon coating surrounding TNPs. A porous carbon matrix will create preferential sites for Na+ insertion/deinsertion, improving the contact between the active material and the electrolyte due to electrolyte penetration through pores and optimizing conduction paths for fast electron transport.30,31
It is expected that the carbon will add a synergetic effect, providing a conductive network that will also stabilize the SEI, improving the initial coulombic efficiency together with increased capacity and rate performances. Indeed, it has been demonstrated that the carbon coating allows improving the electronic conductivity of TNPs through the formation of a Ti–C bond, contributing to better electrochemical performances.27,30 To coat nanoparticles, many routes exist such as sol–gel,31,32 hydrothermal33,34 or microwave-assisted35 routes. In this work, we employed an one-pot TNP synthesis followed by direct thermal treatment without adding supplementary reactants. This original approach is assumed to improve the stability of TNPs by using Ti(OCH2CH2CH2CH3)4 (TetraButOxyTitanium TBOT) as both titanium and carbon precursors. To do so, the as-prepared TNPs were thermally treated under H2 flow.
Experimental
Synthesis of TiO2@C nanoparticles
Usually, TiO2 nanoparticles (TNPs) are mainly synthesized by the hydrothermal route.24,25 In this work, all syntheses have been conducted using the microwave-assisted method which allows energy and time gains compared to the hydrothermal route.26 To synthesize TNPs, samples were prepared in a glove bag under an argon atmosphere to prevent hydrolysis of TBOT. 4 mL of TBOT (Aldrich Chemical, 97%, CAS: 5593-70-4) and 8 mL of acetic acid (Sigma Aldrich, ≥99.8%, CAS: 64-19-7) were introduced into a microwave vial, then transferred into a single-mode microwave (Monowave 400 from Anton Paar) for thermal treatment at a temperature between 180 °C and 240 °C for 30 minutes and finally cooling at 55 °C. The reaction mechanisms involved can be described by the following reactions:36| Ti(OBu)4 + 4H2O → Ti(OH)4 + 4BuOH | (2) |
| Ti(OH)4 → TiO2 + 2H2O | (3) |
The obtained mixture containing TiO2 nanoparticles was then washed once with absolute ethanol (VWR, 99.95%, CAS: 64-17-5) and twice with ultra-pure water (resistivity: 18.2 MΩ cm) by centrifugation for 5 minutes for each washing and then dried at 80 °C. The TNPs powder with the carbon precursor was loaded in a silica boat and thermally treated under H2 flux (70 mL min−1) for 4 h at 400 °C (5 °C min−1) in a horizontal furnace.
Characterization
The TNPs phase was identified by powder X-ray diffraction (pXRD) using a Bruker diffractometer (D8 Advance) with Mo Kα radiation (0.70926 Å) in transmission mode and Cu Kα radiation (1.54060 Å) in reflection mode (θ–θ geometry). Thermogravimetric analyses (Setaram – Setsys EV1750) coupled with mass spectroscopy (Pfeiffer Vacuum – Omnistar GSD 301 C) were conducted at a heating rate of 5 °C min−1 from room temperature to 800 °C and a cooling rate of 10 °C min−1. Carbon in the samples was evidenced by Raman spectroscopy using a Horiba spectrometer (Labram HR800) operating at 457 nm wavelength. High-resolution transmission electron microscopy (HR-TEM) was performed (JEOL – ARM 200F) to study the morphology, size, and crystallinity of particles. Scanning TEM (STEM) mode was used for chemical analysis by electron energy loss spectroscopy (EELS).Electrochemical characterization
To perform electrochemical characterization, a 70/10/20 slurry (70 wt% active material, 10 wt% carboxymethyl cellulose as a binder and 20 wt% carbon black as a conductive material) was prepared in deionized water and then coated on aluminium foil.37 Once the slurry dried, the material was assembled on a current collector in coin cell CR2032 or in powder in a Swagelok® half-cell versus Na metallic foil with 1 M NaClO4 in EC–DMC 1![[thin space (1/6-em)]](https://www.rsc.org/images/entities/char_2009.gif) :
:![[thin space (1/6-em)]](https://www.rsc.org/images/entities/char_2009.gif) 1 in mass. Galvanostatic cycling with potential limitation (GCPL) tests were conducted on a Biologic – BCS-810 between 0 and 3 V vs. Na+/Na at a C/20 rate.
1 in mass. Galvanostatic cycling with potential limitation (GCPL) tests were conducted on a Biologic – BCS-810 between 0 and 3 V vs. Na+/Na at a C/20 rate.
Results and discussion
Effect of the synthesis temperature
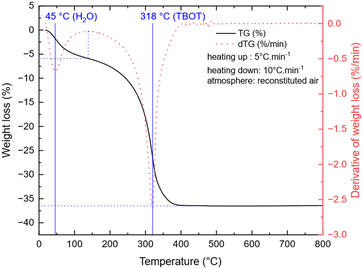
To study the temperature influence on the TNP crystallinity, four different synthesis temperatures were tested. In the XRD patterns shown in Fig. 1, the diffraction peaks can all be indexed to anatase TiO2 only (COD no. 96-900-8216). The FWHM of the peaks decreases from 0.3149 to 0.2558 for 101 reflection and from 0.6298 to 0.3149 for the 200 reflection when the temperature increases, which characterizes a higher crystallite size (from 16 nm for 180 °C to 27 nm for 240 °C, calculated using the Scherrer equation from the 101 peak). Moreover, a low angle background signal is detected due to the presence of residual amorphous material. This background decreases progressively upon increasing the temperature in agreement with the sharpening of the Bragg peaks accordingly to the higher crystallinity. Fig. 2 presents the ThermoGravimetric Analyses (TGA) of the sample synthesized at 180 °C. This thermogram is considered a representative of all samples of the study (data retrieved from other ones are summarized in Table 1). Such an analysis allows the quantification of the residual quantity of the titanium precursor after synthesis. Two mass loss signals are present: the first one is attributed to H2O outgassing at 45 °C and the second one to the combustion of residual TBOT at 318 °C. Whatever the synthesis temperature was considered, the TBOT mass loss did not change, in agreement with a reaction yield close to 70%.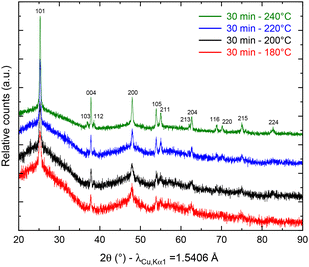 | ||
| Fig. 1 pXRD patterns of anatase TiO2 after synthesis at 180 (red), 200 (black), 220 (blue) and 240 °C (green). | ||
| Synthesis temperature (°C) | H2O weight loss (%) | Weight loss temperature (°C) | TBOT weight loss (%) | Decomposition temperature (°C) |
|---|---|---|---|---|
| 180 | 6 | 45 | 31 | 318 |
| 200 | 7 | 43 | 30 | 317 |
| 220 | 6 | 42 | 30 | 318 |
| 240 | 4 | 54 | 27 | 314 |
Thermal treatment
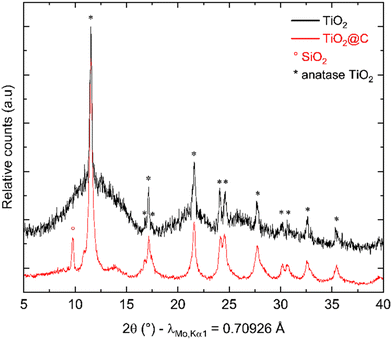
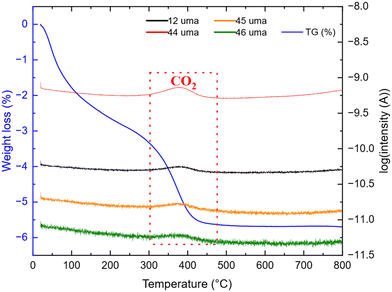
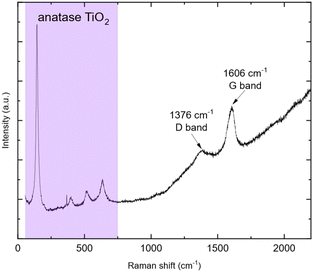
After synthesis, thermal treatment of TNPs under H2-flux at 400 °C was carried out to remove TBOT residues and integrate TiO2 into carbon. Indeed, residual TBOT present at around 30 wt% is assumed to be usable as a carbon precursor to form the carbon coating. pXRD patterns (Fig. 3) were recorded before and after thermal treatment under H2 using a diffractometer with Mo Kα1 radiation in order to probe the sample in transmission mode. pXRD patterns show no-TiO2 reduction into Ti, as thermodynamically expected up to 500 °C. It should be noted that the TiO2 polymorph is preserved, and the crystalline phase ratio is improved after thermal treatment. The SiO2 reflection peak at 9.78°(2θ) is attributed to the silica boat used for the thermal treatment. Finally, the splitting of the peak around 11°(2θ) could be due to the 002 reflection of a poorly crystallized carbon. To confirm the presence of carbon after this step, TG-MS analysis was performed, and the results are presented in Fig. 4.The weight loss can be decomposed into two phenomena as previously observed. The first one at around 45 °C is still attributed to H2O outgassing, and the second one at around 370 °C (higher than for pristine TiO2 nanoparticles) is correlated with CO2 detected by mass spectroscopy. This second weight loss can be assigned to the combustion of around 3 wt% carbon. This carbon amount is in accordance with the amount reported by Devina et al. who obtained 0.2–4.1 wt% carbon depending on the carbon impregnation method.38 The low combustion temperature is probably due to the amorphous nature of the carbon material formed on the surface of the particles.39 Complementary to mass spectroscopy, Raman spectroscopy was performed to evidence the formation of carbon. Indeed, it is a powerful tool to characterize carbon materials. Six active Raman vibration modes due to the D2d local symmetry of anatase TiO2 are observed in the spectrum (Fig. 5): 1Ag + 2B1g + 3Eg![[thin space (1/6-em)]](https://www.rsc.org/images/entities/char_2009.gif) 40,41 in the range of 100–750 cm−1 is identified using a purple zone.
40,41 in the range of 100–750 cm−1 is identified using a purple zone.
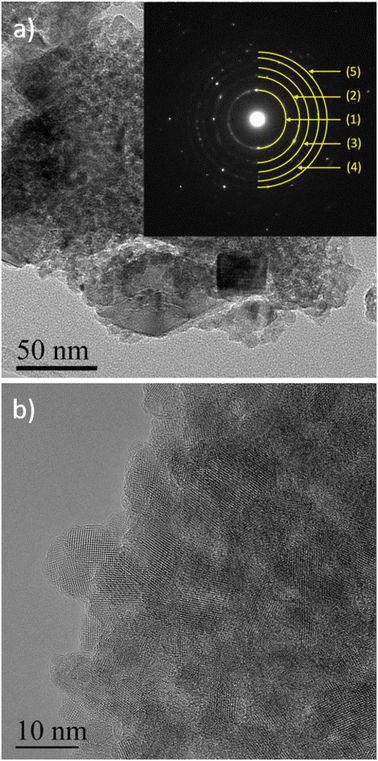
D and G bands present at 1376 and 1606 cm−1, respectively, corroborate the presence of carbon materials as revealed after TGA analysis. The D band (disordered sp2 carbon) is expected around 1350 cm−1 (ref. 31 and 42–45) but a shift is observed due to the excitation wavelength used.46 Here, the ID/IG ratio is 0.22 but due to its parabolic evolution, it is not possible to conclude about carbon crystallinity. Indeed, as described by Merlen et al., the D band intensity increases with disorder, reaches a maximum and then, decreases when carbon is close to amorphous.47 High-resolution transmission electronic microscopy (HR-TEM) was used to study the carbon morphology. Selected area electron diffraction (SAED) reveals the diffraction planes of anatase TiO2 (Table 2) in accordance with the XRD measurement, and the good crystallinity of the particles. First, the TEM micrograph (Fig. 6(a)) exhibits particles aggregated into an amorphous matrix. The HR-TEM micrograph (Fig. 6(b)) evidences the atomic planes of the particles demonstrating the crystallinity of titanium dioxide and allows us to determine the size of the crystals, which is 8.5 ± 1.4 nm in accordance with XRD calculation. STEM-EDX elemental mapping images highlight the presence of carbon (Fig. 7). Thus, TG-MS, Raman spectroscopy and HR-TEM confirm the presence of carbon in samples thermally treated under H2 using TBOT as a carbon precursor.
| Yellow half-circle (#) | d-Spacing (nm) | (hkl) |
|---|---|---|
| (1) | 0.3524 | (101) |
| (2) | 0.2394 | (004) |
| (3) | 0.1908 | (200) |
| (4) | 0.1711 | (105) |
| (5) | 0.1499 | (213) |
Electrochemical characterization
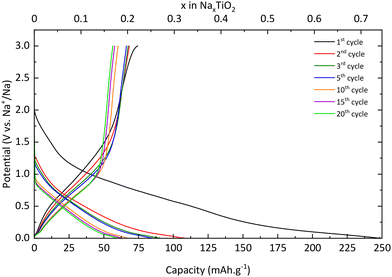
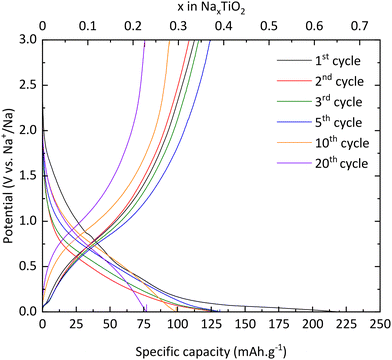
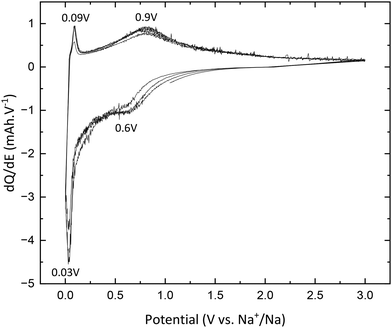
| xNa+ + xe− + TiO2 → NaxTiO2 | (4) |
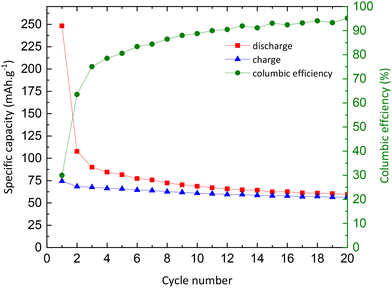 | ||
| Fig. 9 Evolution of charge (blue) and discharge (red) capacities, and columbic efficiency (green) as a function of the number of cycles. | ||
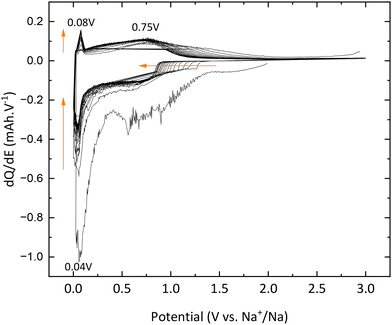
The desodiation reaction takes place at the same potential as the sodiation reaction i.e., 0.75 V vs. Na+/Na (eqn (5)):
| NaxTiO2 → xNa+ + xe− + TiO2 | (5) |
In addition, the peaks at 0.04 V vs. Na+/Na in reduction and 0.08 V vs. Na+/Na are also attributed to electrolyte decomposition according to Wu et al.13 Finally, the signal between 1.3 and 0.9 V vs. Na+/Na, which shifts to lower and lower potential values, is due to SEI formation, which corroborates the results previously mentioned and demonstrates the electrochemical instability of TNPs toward the electrolyte.
| Q discharge (mA h g−1) – xNa | Q charge (mA h g−1) – xNa | Efficiency (%) | |
|---|---|---|---|
| Pristine TiO 2 | |||
| Cycle 1 | 248.3–0.74 | 74.1–0.22 | 30 |
| Cycle 3 | 90–0.27 | 67.5–0.20 | 75 |
| Cycle 5 | 81.6–0.24 | 65.8–0.20 | 80.6 |
| Cycle 10 | 68.6–0.20 | 60.9–0.18 | 88.8 |
| Cycle 20 | 59.3–0.18 | 56.5–0.17 | 95.2 |
| TiO 2 @C | |||
| Cycle 1 | 219.8–0.65 | 112.6–0.34 | 51.2 |
| Cycle 3 | 129.5–0.39 | 115.7–0.34 | 89.3 |
| Cycle 5 | 131.3–0.39 | 124.2–0.37 | 94.6 |
| Cycle 10 | 128.7–0.38 | 128.2–0.38 | 99.6 |
| Cycle 20 | 77.1–0.23 | 75.7–0.22 | 98.2 |
Conclusions
Titanium dioxide nanoparticles were successfully obtained by the microwave-assisted method. TBOT residues were used as a carbon precursor to prepare carbon-embedded TNPs. TNPs@C exhibits electrochemical stabilization by improving the efficiency during the first cycle which corresponds to a decrease in the SEI formation. Upon carbon addition, the capacity reached 115 mA h g−1 in the 3rd cycle against the 67 mA h g−1 for pristine TNPs. The electrochemical performances of TiO2@C presented in this work are still lower than those mentioned in other studies.11,31,48 Even though our results are promising, with an ICE of only 51% and a capacity retention of 67%, the materials need further optimization (size and shape of TiO2 nanoparticles; anchorage, thickness and porosity of the carbon matrix) before widespread commercialisation. The goal of this work is not the full optimization of the electrochemical performances and cycle life of TiO2 as an anode for sodium-ion batteries, but mainly to provide a proof-of-concept for the innovative and simple synthesis of TiO2@C intercalation materials. Here, this work presents an original way for synthesizing TiO2 nanoparticles by a fast microwave-assisted route. Moreover, it constitutes an advanced demonstration of the possibility of using one precursor as both Ti and C precursors. Nevertheless, the optimization of the TiO2@C material can be considered on several points: control of the residual amorphous material after the microwave-assisted step, morphology and crystallinity of TiO2 anatase, carbon matrix optimization, etc.Moreover, the electrochemical stabilization of TiO2 nanoparticles toward the electrolyte was proved thanks to carbon addition.
Author contributions
Tanguy Soudant: formal analysis, investigation, writing – original draft, writing – review & editing, and visualization. Solenne Fleutot: conceptualization, methodology, validation, investigation, review & editing, visualization, and supervision. Stephanie Bruyère: formal analysis and review & editing. Lucie Speyer: formal analysis and review & editing. Mickaël Bolmont: methodology and review & editing. Thomas Girardet: methodology and review & editing. Loris Raspasdo: methodology and review & editing. Claire Hérold: conceptualization, writing – review & editing, and visualization. Sébastien Cahen: conceptualization, methodology, validation, formal analysis, resources, writing – review & editing, visualization, funding acquisition, supervision, and project administration.Conflicts of interest
There are no conflicts to declare.Acknowledgements
The authors would like to thank the ORION program for its contribution to the funding of TS's research internship. This work has benefited from a French government grant managed by the Agence Nationale de la Recherche with the reference ANR-20-SFRI-0009.References
- Battery demand by region, 2016–2022 – Charts – Data & Statistics, https://www.iea.org/data-and-statistics/charts/battery-demand-by-region-2016-2022, (accessed January 24, 2024).
- H. Kim, ACS Mater. Au, 2023, 3, 571–575 CrossRef CAS PubMed.
- D. A. Stevens and J. R. Dahn, J. Electrochem. Soc., 2001, 148, A803 CrossRef CAS.
- M. M. Doeff, Y. Ma, S. J. Visco and L. C. D. Jonghe, J. Electrochem. Soc., 1993, 140, L169 CrossRef CAS.
- P. Ge and M. Fouletier, Solid State Ion., 1988, 28–30, 1172–1175 CrossRef.
- V. Palomares, P. Serras, I. Villaluenga, K. B. Hueso, J. Carretero-González and T. Rojo, Energy Environ. Sci., 2012, 5, 5884 RSC.
- S. Tan, H. Yang, Z. Zhang, X. Xu, Y. Xu, J. Zhou, X. Zhou, Z. Pan, X. Rao, Y. Gu, Z. Wang, Y. Wu, X. Liu and Y. Zhang, Molecules, 2023, 28, 3134 CrossRef CAS PubMed.
- W. Lu, Z. Wang and S. Zhong, J. Phys.: Conf. Ser., 2021, 2109, 012004 CrossRef.
- H. Pan, Y.-S. Hu and L. Chen, Energy Environ. Sci., 2013, 6, 2338–2360 RSC.
- S.-W. Kim, D.-H. Seo, X. Ma, G. Ceder and K. Kang, Adv. Energy Mater., 2012, 2, 710–721 CrossRef CAS.
- Y. Xu, E. M. Lotfabad, H. Wang, B. Farbod, Z. Xu, A. Kohandehghan and D. Mitlin, Chem. Commun., 2013, 49, 8973 RSC.
- D. Aurbach, Solid State Ionics, 2002, 148, 405–416 CrossRef CAS.
- L. Wu, D. Bresser, D. Buchholz, G. A. Giffin, C. R. Castro, A. Ochel and S. Passerini, Adv. Energy Mater., 2015, 5, 1401142 CrossRef.
- U. Diebold, Surf. Sci. Rep., 2003, 48, 53–229 CrossRef CAS.
- D. Deng, M. G. Kim, J. Y. Lee and J. Cho, Energy Environ. Sci., 2009, 2, 818 RSC.
- S. Liang, X. Wang, Y.-J. Cheng, Y. Xia and P. Müller-Buschbaum, Energy Storage Mater., 2022, 45, 201–264 CrossRef.
- O. Eroglu and H. Kizil, J. Phys. Chem. Solids, 2023, 178, 111352 CrossRef CAS.
- Y.-X. Wu, S.-F. Liu, R. Lu, C. Liu and Q. Sun, Ionics, 2023, 29, 2723–2733 CrossRef CAS.
- W. Wang, Y. Liu, X. Wu, J. Wang, L. Fu, Y. Zhu, Y. Wu and X. Liu, Adv. Mater. Technol., 2018, 3, 1800004 CrossRef.
- J. Patra, S.-C. Wu, I.-C. Leu, C.-C. Yang, R. S. Dhaka, S. Okada, H.-L. Yeh, C.-M. Hsieh, B. K. Chang and J.-K. Chang, ACS Appl. Energy Mater., 2021, 4, 5738–5746 CrossRef CAS.
- J. Jamnik and J. Maier, Chem. Phys., 2003, 5, 5215 CAS.
- K. T. Lee and J. Cho, Nano Today, 2011, 6, 28–41 CrossRef CAS.
- J.-Y. Shin, D. Samuelis and J. Maier, Adv. Funct. Mater., 2011, 21, 3464–3472 CrossRef CAS.
- S. Y. Chae, M. K. Park, S. K. Lee, T. Y. Kim, S. K. Kim and W. I. Lee, Chem. Mater., 2003, 15, 3326–3331 CrossRef CAS.
- H.-G. Jung, S. W. Oh, J. Ce, N. Jayaprakash and Y.-K. Sun, Electrochem. Commun., 2009, 11, 756–759 CrossRef CAS.
- F. Dufour, S. Cassaignon, O. Durupthy, C. Colbeau–Justin and C. Chanéac, Eur. J. Inorg. Chem., 2012, 2012, 2707–2715 CrossRef CAS.
- Y. Ge, H. Jiang, J. Zhu, Y. Lu, C. Chen, Y. Hu, Y. Qiu and X. Zhang, Electrochim. Acta, 2015, 157, 142–148 CrossRef CAS.
- D. Su, S. Dou and G. Wang, Chem. Mater., 2015, 27, 6022–6029 CrossRef CAS.
- Y. Yang, X. Ji, M. Jing, H. Hou, Y. Zhu, L. Fang, X. Yang, Q. Chen and C. E. Banks, J. Mater. Chem. A, 2015, 3, 5648–5655 RSC.
- X. Ma, Z. Zhang, J. Tian, B. Xu, Q. Ping and B. Wang, Funct. Mater. Lett., 2018, 11, 1850021 CrossRef CAS.
- H. Tao, M. Zhou, K. Wang, S. Cheng and K. Jiang, Sci. Rep., 2017, 7, 43895 CrossRef PubMed.
- A. C. Martins, A. L. Cazetta, O. Pezoti, J. R. B. Souza, T. Zhang, E. J. Pilau, T. Asefa and V. C. Almeida, Ceram. Int., 2017, 43, 4411–4418 CrossRef CAS.
- K. Olurode, G. M. Neelgund, A. Oki and Z. Luo, Spectrochim. Acta, Part A, 2012, 89, 333–336 CrossRef CAS PubMed.
- M. Maletić, M. Vukčević, A. Kalijadis, I. Janković-Častvan, A. Dapčević, Z. Laušević and M. Laušević, Arabian J. Chem., 2019, 12, 4388–4397 CrossRef.
- C. Coromelci-Pastravanu, M. Ignat, E. Popovici and V. Harabagiu, J. Hazard. Mater., 2014, 278, 382–390 CrossRef CAS PubMed.
- M. J. Velasco, F. Rubio, J. Rubio and J. L. Oteo, Spectrosc. Lett., 1999, 32, 289–304 CrossRef CAS.
- L. Wu, D. Buchholz, D. Bresser, L. Gomes Chagas and S. Passerini, J. Power Sources, 2014, 251, 379–385 CrossRef CAS.
- W. Devina, D. Nam, J. Hwang, C. Chandra, W. Chang and J. Kim, Electrochim. Acta, 2019, 321, 134639 CrossRef CAS.
- K. Judai, N. Iguchi and Y. Hatakeyama, J. Chem., 2016, 2016, 1–6 CrossRef.
- K. Gao, Phys. B, 2007, 398, 33–37 CrossRef CAS.
- A. Orendorz, A. Brodyanski, J. Lösch, L. H. Bai, Z. H. Chen, Y. K. Le, C. Ziegler and H. Gnaser, Surf. Sci., 2007, 601, 4390–4394 CrossRef CAS.
- Q. Zhang, H. He, X. Huang, J. Yan, Y. Tang and H. Wang, J. Chem. Eng., 2018, 332, 57–65 CrossRef CAS.
- F.-F. Cao, X.-L. Wu, S. Xin, Y.-G. Guo and L.-J. Wan, J. Phys. Chem. C, 2010, 114, 10308–10313 CrossRef CAS.
- H. He, Q. Gan, H. Wang, G.-L. Xu, X. Zhang, D. Huang, F. Fu, Y. Tang, K. Amine and M. Shao, Nano Energy, 2018, 44, 217–227 CrossRef CAS.
- Z. Luo, S. Liu, Y. Cai, S. Li, A. Pan and S. Liang, Energy Technol., 2018, 6, 759–765 CrossRef CAS.
- O. Beyssac and M. Lazzeri, in Raman spectroscopy applied to Earth sciences and cultural heritage, ed. G. Ferraris, J. Dubessy, M.-C. Caumon and F. Rull, European Mineralogical Union, 2012, pp. 415–454 Search PubMed.
- A. Merlen, J. Buijnsters and C. Pardanaud, Coatings, 2017, 7, 153 CrossRef.
- M. N. Tahir, B. Oschmann, D. Buchholz, X. Dou, I. Lieberwirth, M. Panthöfer, W. Tremel, R. Zentel and S. Passerini, Adv. Energy Mater., 2016, 6, 1501489 CrossRef PubMed.
| This journal is © The Royal Society of Chemistry 2024 |

