
 Open Access Article
 This Open Access Article is licensed under a
 Creative Commons Attribution 3.0 Unported Licence
Effect of substituents on the 1O2 production and biological activity of (N^N^N)Pt(py) complexes†
Guillermo
Romo-Islas
ab,
María
Gil-Moles
cd,
Arnav
Saxena
 a,
Antonio
Frontera
e,
M. Concepción
Gimeno
*c and
Laura
Rodríguez
*ab
a,
Antonio
Frontera
e,
M. Concepción
Gimeno
*c and
Laura
Rodríguez
*ab
aDepartament de Química Inorgànica i Orgànica, Secció de Química Inorgànica, Universitat de Barcelona, Martí i Franquès 1-11, 08028 Barcelona, Spain. E-mail: laurarodriguezr@ub.edu
bInstitut de Nanociència i Nanotecnologia (IN2UB), Universitat de Barcelona, 08028 Barcelona, Spain
cInstituto de Síntesis Química y Catálisis Homogénea (ISQCH), CSIC-Universidad de Zaragoza, Pedro Cerbuna 12, 50009 Zaragoza, Spain. E-mail: gimeno@unizar.es
dDepartamento de Química, Centro de Investigación de Síntesis Química (CISQ), Universidad de la Rioja. Complejo Científico-Tecnológico, 26004, Logroño, Spain
eDepartament de Química, Universitat de les Illes Balears, 07122 Palma de Mallorca, Spain
First published on 18th December 2023
Abstract
Twelve (N^N^N)platinum pyridyl complexes, (N^N^N)Pt(pyF), were synthesised and investigated for their singlet oxygen generation and potential biological activities. They exhibited 1IL and 1MLCT absorption transitions at approximately 325 and 360 nm, identified through TD-DFT calculations. Luminescence was observed only in the L1-derived compounds in solution, with a dual emission with the main contribution of phosphorescence under deaerated conditions. Room temperature phosphorescence was detected in all solid-state cases. Electron-withdrawing substituents at specific positions (R1 and X) and the number of fluorine atoms in R2 were found to enhance the photosensitizing capabilities of these compounds. Biological assessments, including cytotoxicity and photocytotoxicity, were conducted to evaluate their potential as chemotherapeutic agents and photosensitizers. Complexes with chloro substitution in the N^N^N tridentate ligand of the central pyridine ring exhibited promising chemotherapeutic properties. Ancillary pyridine ring substitution became significant under irradiation conditions, with fluoromethylated substituents enhancing cytotoxicity. Complex 2-CF3 was the most efficient singlet oxygen producer and a highly effective photosensitizer. CHF2-substituted complexes also showed improved photosensitizing activity. DNA binding studies indicated moderate interactions with DNA, offering insights into potential biological applications.
Introduction
Coordination and organometallic compounds based on transition metals (TMs) have attracted increasing attention in the last few decades for both fundamental and more applied investigations. In particular, TM complexes (TMCs) with d8 electronic configuration, e.g. Pt(II) or d10, e.g. Au(I), are widely explored due to their intrinsic photophysical properties ascribed not only to the chemical structure of the ligands but also to the particularity of these metals and their key role in luminescence. These types of luminescent TMCs are currently attracting a great deal of attention for their use as sensors, luminescent markers for bioimaging and catalysts among others.1–5The particularity of these d8 and d10 specific metals is what is called the “heavy atom effect” that favours the intersystem crossing between the S1 and T1 excited states. The electrons located at this T1 level can return to the ground state through different processes, such as radiative processes, giving rise to phosphorescent systems (or those presenting dual emission, fluorescence + phosphorescence). Nevertheless, this emission is frequently quenched by the presence of oxygen, which can be ascribed to energy transfer between the TMC and the oxygen molecules, that is, a triplet, 3O2, in the ground state. The molecules that produce this energy transfer efficiently are called photosensitizers, PS.
The energy transfer from these PS to the 3O2 generates singlet oxygen, 1O2, that is a highly reactive species (ROS).6 In fact, the generation of singlet oxygen through a PS is a research area with really increasing interest due to its wide range of versatile applications in several fields such as the synthesis of organic molecules as fine chemicals, pollution control, and photodynamic therapy, or waste treatment of contaminants.6–10 Thus, the study of 1O2 production and reactivity has emerged as an important interdisciplinary field.
Some TMCs have been explored as PS, e.g. Ru(II) polypyridyl complexes,11 iridium(III),12 gold(I) complexes,13–15 and platinum(II) complexes.16–19
Focusing on platinum compounds, it is well known that these types of TMCs have been extensively explored as anticancer drugs since the discovery of cisplatin.20 However, several toxic side effects such as ototoxicity, nephrotoxicity, and neurotoxicity of cisplatin have been detected during the illness treatment and some improvements are strongly required. In order to overcome these drawbacks, phototherapy (also called photodynamic therapy, PDT) has emerged as a non-invasive and controllable strategy for precise tumour ablation.21 PDT requires the use of a PS able to transform the oxygen present in the environment into cytotoxic 1O2 upon irradiation with light. This causes the destruction of organelles and leads to cancer cell death. The presence of the Pt heavy atom, which is suitable to populate the T1 excited state, makes Pt(II) compounds adequate to potentially react with 3O2. Hence, the well-known anticancer activity of Pt(II) compounds together with their potential behaviour as PS make them suitable candidates to be explored not only as anticancer drugs but also to analyse the effect of light to generate a Pt(II) PS with improved anticancer activity.
There is still a lot to be explored in this field, mainly if we take into consideration that small variations in the chemical structure of the Pt(II) compounds can significantly impact their resulting photophysical properties. This will affect the T1 population and the energy transfer process with oxygen. For this reason, in this work we have designed and synthesized different series of Pt(II) compounds, which feature a N^N^N tridentate ligand driving the planar geometry of the complexes and incorporating a pyridyl ligand at the fourth coordination position. Small variations have been introduced both in the chemical structure of the N^N^N ligand and in the pyridyl group to gain insight into the factors that can affect the photophysical properties, singlet oxygen production and biological activity of the compounds. Fluorine ligands have been considered in this work, as previous studies have shown that incorporating these atoms into the structure of the compounds significantly enhances biological activity in potential anticancer drugs.22 The introduction of several numbers of fluorine atoms can be easily performed through the selected pyridyl ligands, which is a direct tool to evaluate the effect of fluorine ligands on the biological activity of the studied compounds. Therefore, this systematic study holds great relevance for understanding and designing promising new drugs that can serve both as chemotherapeutic agents and PS in PDT.
Results and discussion
Synthesis and characterization
The synthesis of the (N^N^N)platinum pyridyl complexes (from now on, (N^N^N)Pt(pyF)) was carried out following the different steps displayed in Scheme 1. The synthesis of the bis(triazole) N^N^N H2L1–H2L4 ligands and [Pt(DMSO)(L)] precursors was recently reported by us.23 The [Pt(DMSO)(L)] compounds were reacted with the p-R2-pyridyl ligand (R2 = CF3, CHF2 and CH3) to obtain the final products in moderate to high yields (45–85%).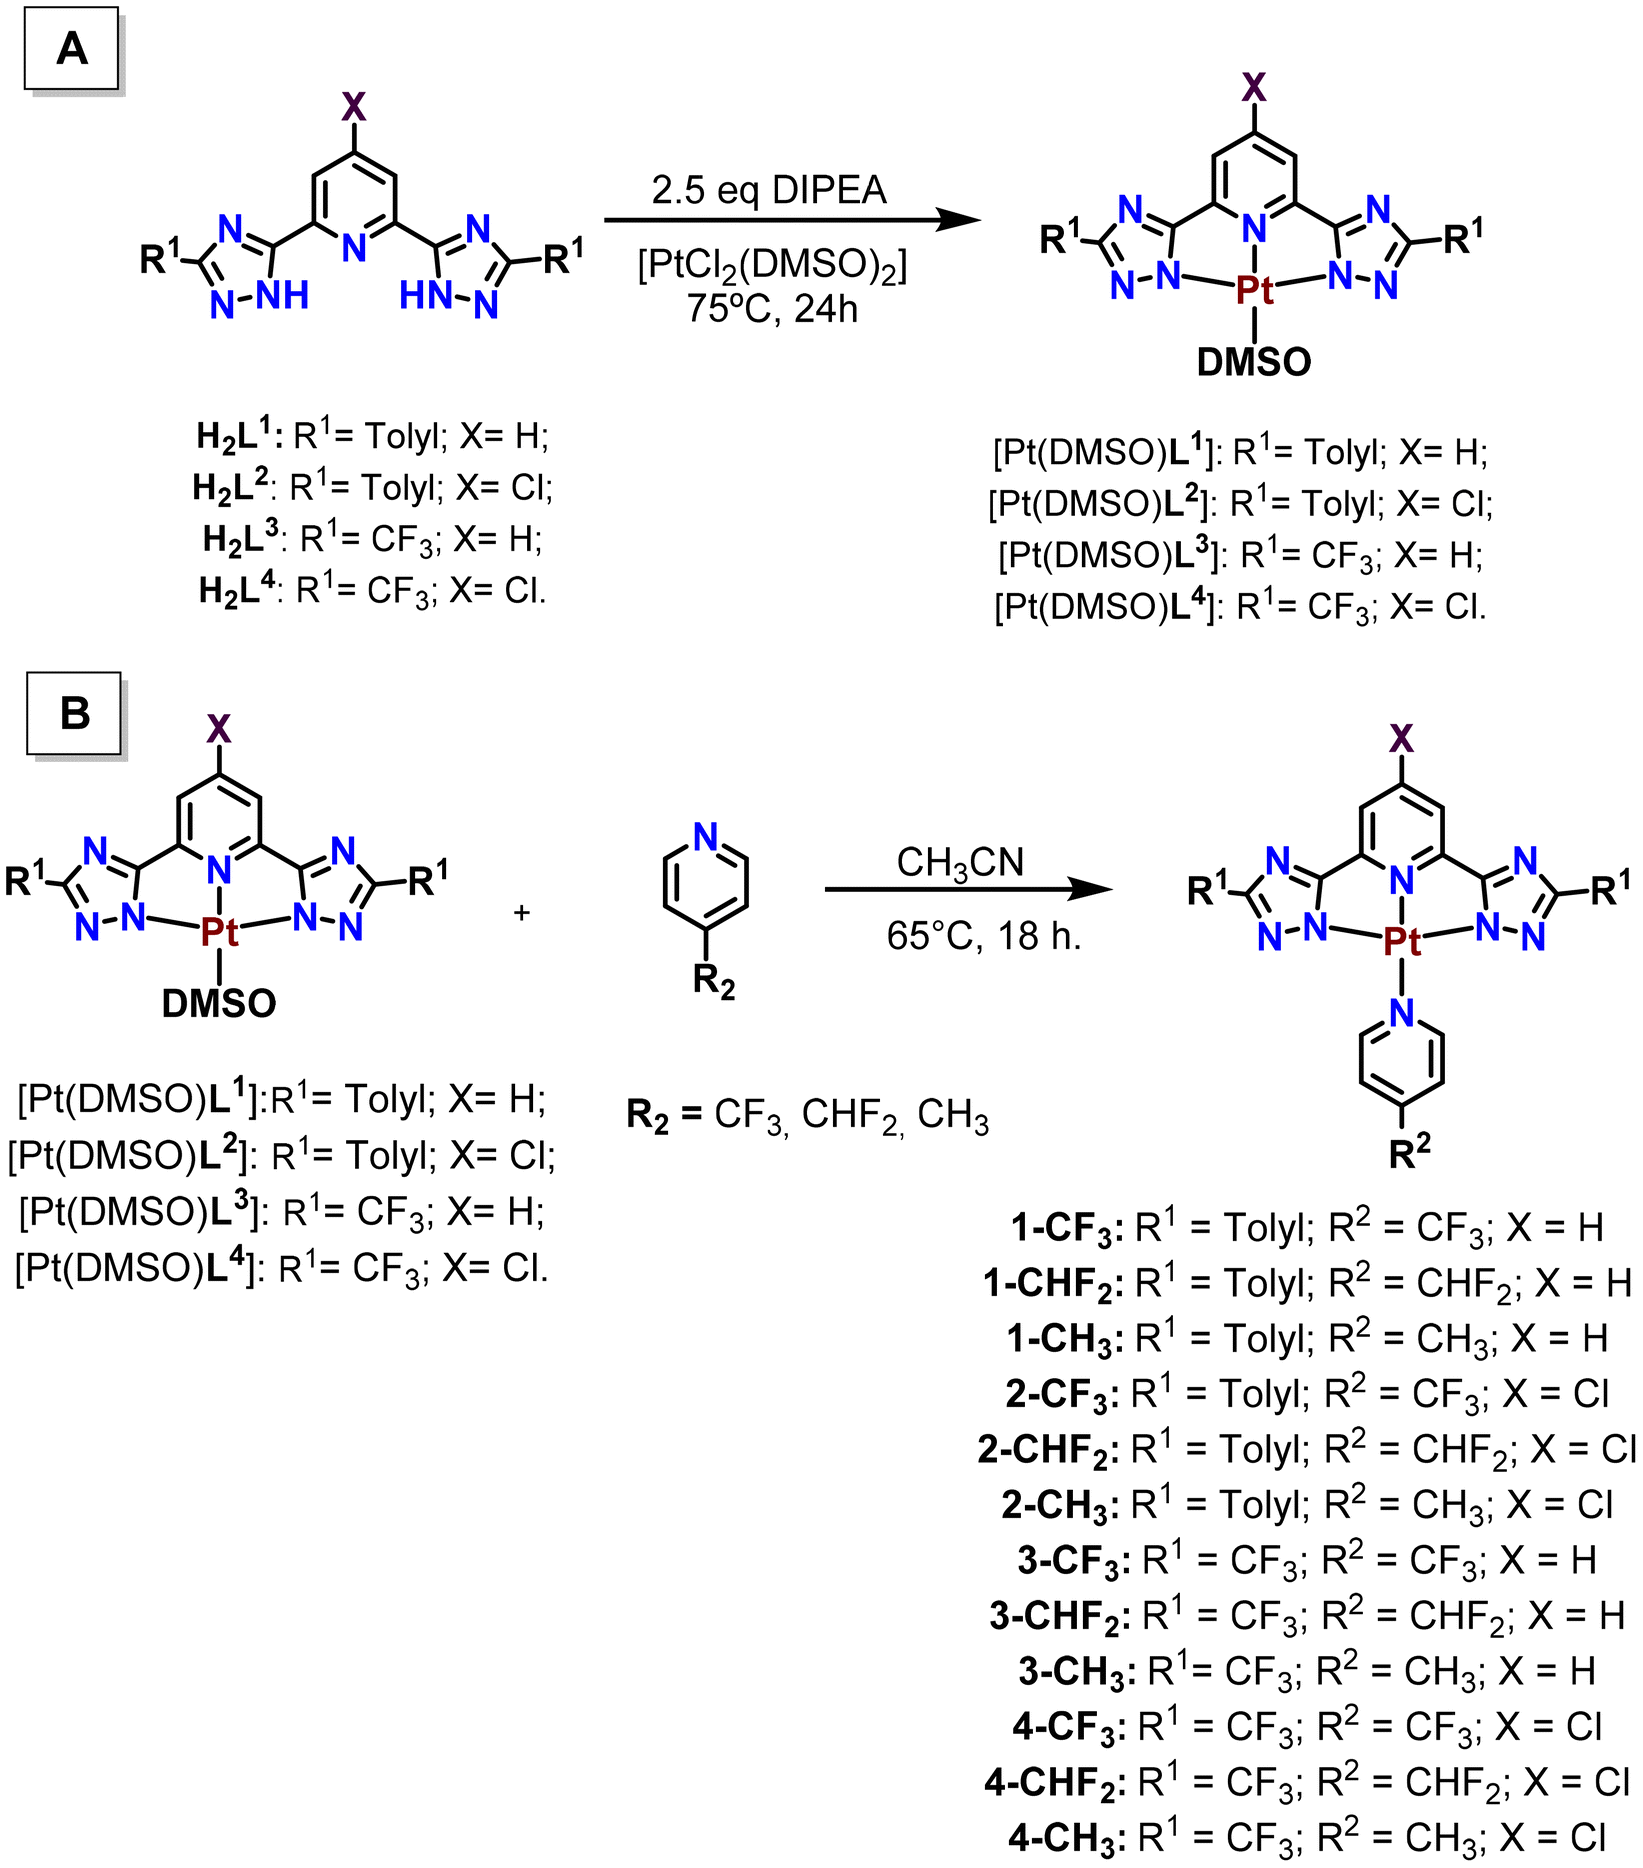 | ||
| Scheme 1 Synthetic procedure to obtain the (N^N^N)Pt precursors (A) and (N^N^N)Pt(pyF) complexes (B). | ||
The 1H NMR spectra of the final products show the presence of the corresponding protons of the pyridyl groups that are 0.40–0.23 ppm downfield shifted with respect to the [Pt(DMSO)L] precursors. A triplet centered at 6.95–6.65 ppm, which corresponds to the hydrogen atom of the –CHF2 substituent of the pyridine ligand, can also be observed for the x-CHF2 (x = 1–4) compounds. The signals corresponding to the –CF3 and –CHF2 moieties are also detected in the 19F NMR spectra of the corresponding compounds and in their IR spectra with a well-defined vibration band between 1183 and 1061 cm−1 corresponding to the ν(C–F). The final evidence of the correct formation of the compounds has been obtained from the high-resolution mass spectra with the identification of the molecular peaks corresponding to [M + H+] or [M + Na+].
Photophysical characterization
Absorption and emission spectra of the compounds were recorded in 10−5 M DMSO solutions at room temperature. DMSO was chosen for analogy to the biological assays performed with these compounds (see below), although we are aware that it is not the best option for recording absorption spectra due to the long wavelength cut-off of this solvent that hinders the main absorption transitions in the ground state. Low-intensity absorption bands at around 325 and 360 nm were recorded for all the compounds (Table 1) that have been assigned to 1IL and 1MLCT transitions as reported and studied for similar compounds in the literature.23–32| Compound | A (ε, 103 cm−1 m−1) | λ max Em (nm) |
|---|---|---|
| 1-CF3 | 324 (30.0), 365 (10.3) | 452, 536 |
| 1-CHF2 | 324 (29.1), 365 (9.5) | 445, 536 |
| 1-CH3 | 324 (29.5), 365 (10.0) | 425, 536 |
| 2-CF3 | 322 (13.4) | |
| 2-CHF2 | 322 (12.6) | |
| 2-CH3 | 322 (11.2) | |
| 3-CF3 | 342 (17.5) | |
| 3-CHF2 | 342 (10.6) | |
| 3-CH3 | 342 (9.9) | |
| 4-CF3 | 361 (8.0) | |
| 4-CHF2 | 312 (22.1), 361 (7.3) | |
| 4-CH3 | 312 (26.6), 361 (12.2) |
TD-DFT calculations were performed on all complexes to further support the band assignments. We have calculated the first 20 excited states using the CAM-B3LYP/def2-TZVP level of theory in DMSO treated as a continuum model. The results are shown in Fig. 1 for 1-CF3 as an exemplifying compound and Table S1† as well as Fig. S39–S49† for the rest of the compounds. The two lowest and detectable energy bands of compound 1-CF3 correspond to the S0 → S1 excitation (λexc = 376 nm, 3.298 eV, f = 0.0170) and the S0 → S2 excitation (λexc = 305 nm, 4.060 eV, f = 0.0160). These values are in reasonable agreement with the experimental values (365 and 324 nm). For convenience and simplicity, the natural transition orbitals (NTOs) have been computed and represented in Fig. 1 to provide a qualitative description of the electronic transitions. The S0 → S1 excitation consists of one NTO pair (98%) with the highest occupied transition orbital (HOTO) located at the metal center and the tridentate ligand. The lowest unoccupied transition orbital (LUTO) is mainly located in the tridentate ligand, thus revealing that the lowest energy band is a mixture of metal–ligand and inter-ligand charge transfer. The second band corresponds to the S0 → S2 excitation consisting mainly of two NTO pairs (other less dominant NTO pairs have been omitted). The most dominant NTO pair (70%) is basically formed due to an electron transfer from the dz2 orbital of Pt (HOTO) to a σ*(Pt–N) antibonding orbital (LUTO) that covers the whole PtN4 core (see Fig. 1). The second pair of the S0 → S2 excitation (17%) is very similar to the one observed in the S0 → S1 excitation, where the “hole” orbital is localized at the Pt atom and the tridentate ligand and the “electron” orbital is localized mainly in the pyridine moiety of the tridentate ligand.
 | ||
| Fig. 1 Representation of the NTOs involved in the S0 → S1 (left) and S0 → S2 (right) excitation of compound 1-CF3, with indication of the theoretical λexc, oscillator strength and relative contribution of each NTO pair. | ||
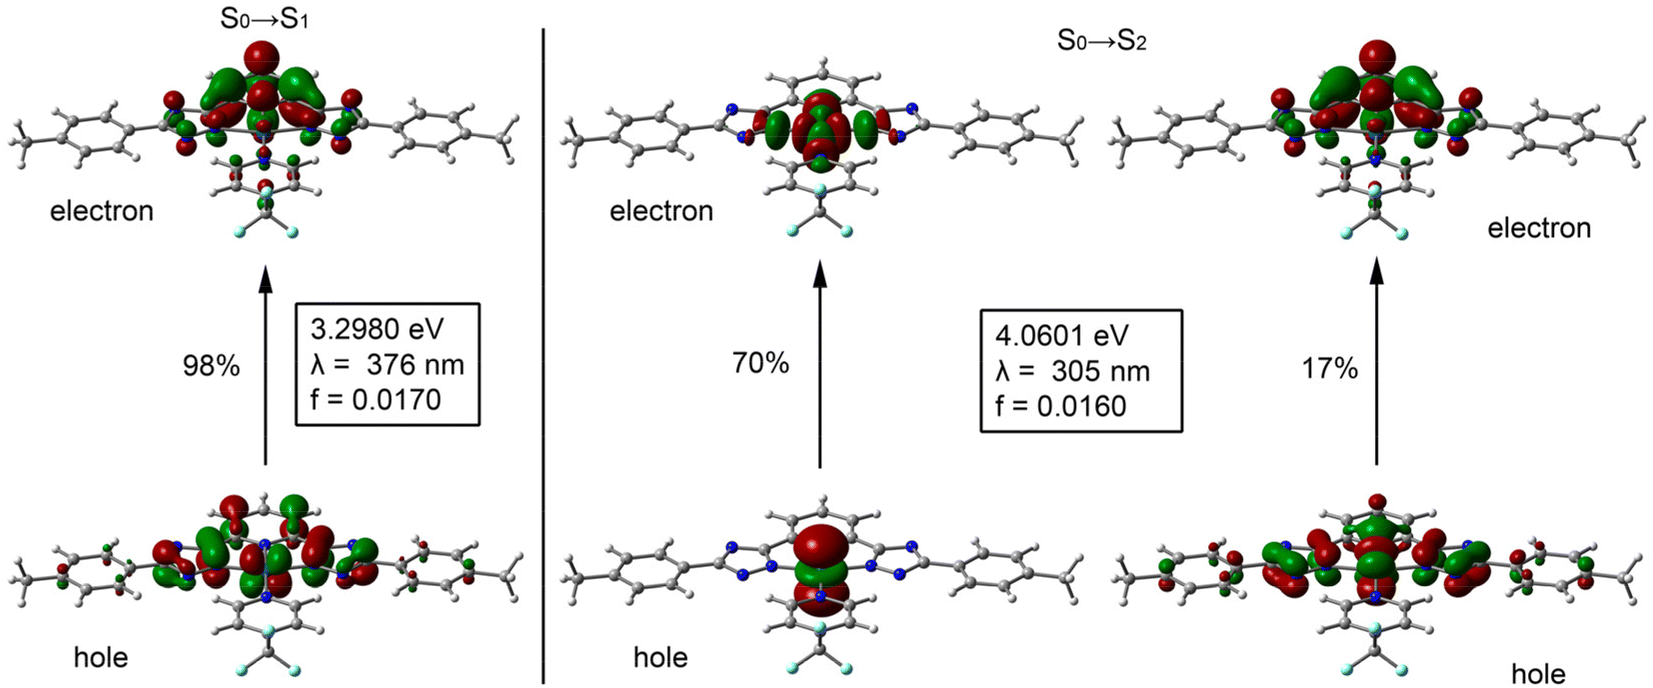
The emission spectra of all compounds were also recorded under the same conditions upon excitation of the samples at 330 nm. We have observed that only the compounds derived from L1 (1-CF3, 1-CHF2 and 1-CH3) display significant luminescence in solution and dual emission (fluorescence + phosphorescence bands, Fig. 2A). Phosphorescence emission is clearly predominant when oxygen is removed from the solutions (Fig. 2B). The corresponding excitation spectra collected at ca. 550 nm (see the ESI†) display in all cases two bands, one centered at 330 nm corresponding to 1IL/1MLCT transitions and another one of weaker intensity at ca. 420 nm, which may be ascribed to the formation of some aggregates, as previously observed for the [Pt(N^N^N)(diphos)] complexes recently reported by us based on previous data reported in the literature.23 The corresponding emissions are ascribed to metal perturbed 1IL/1MLCT transitions and 3MLCT/3MMLCT transitions.23–32 The influence of the apparent innocent chlorine substituent on the resulting emission responsible for the quenching recorded for L2-derivatives was also previously observed for other analogous Pt(N^N^N) complexes.23
 | ||
| Fig. 2 Emission spectra of compounds 1-CF3, 1-CHF2 and 1-CH3 in 10−5 M air-eq. (A) and N2 sat. (B) DMSO solutions (λexc = 330 nm), respectively. | ||
The corresponding emission quantum yields corresponding both to the fluorescence and to the phosphorescence band were recorded with low values of 1–2% for the fluorescence being about double for the phosphorescence emission (Table 2). As expected, the latter value, the phosphorescence quantum yield, increases in the absence of oxygen up to ca. 4%. Emission lifetimes were also measured for the fluorescence band using a band-pass filter of 420 nm and the obtained values of 1.59–2.57 ns agree with a singlet origin transition. In the same way, the phosphorescence radiative decay times were collected using a band-pass filter of 550 nm obtaining lifetime values in the range of 0.5–1.2 μs that, together with a large Stokes’ shift, agree with a triplet state origin emission band (phosphorescence). A point to retain is that, according to the values in Table 2, the substituent of the pyridyl ligand does not seem to affect substantially the resulting photophysical properties of the compounds, and just a small effect on the fluorescence is observed that is less favoured for the p-methyl substituted pyridyl ligand (1-CH3).
| Compound | Φ fl (air-eq./N2 sat.) | τ (air-eq./N2 sat., ns) | Φ phos (air-eq./N2 sat.) | τ (air-eq./N2 sat., μs) |
|---|---|---|---|---|
| 1-CF3 | 0.01/0.01 | 0.02/0.03 | 0.77/1.26 | |
| 1-CHF2 | 0.01/0.01 | 0.02/0.04 | 0.53/1.23 | |
| 1-CH3 | —/— | 0.02/0.04 | 0.47/1.08 |
The radiative (kr) and non-radiative (knr) rate constants were retrieved from the corresponding emission lifetimes and QY values and the results are displayed in Table 3.
| Complex | k r (air-eq.) × 105 s−1 | k nr (air-eq.) × 105 s−1 | k r (N2 sat.) × 105 s−1 | k nr (N2 sat.) × 105 s−1 |
|---|---|---|---|---|
| 1-CF3 | 0.26 | 12.70 | 0.24 | 7.70 |
| 1-CHF2 | 0.38 | 18.50 | 0.32 | 7.80 |
| 1-CH3 | 0.42 | 20.90 | 0.37 | 8.89 |
With these values we can affirm that the increase in the quantum yields and emission lifetimes in deoxygenated samples is due to a decrease in the non-radiative processes, as reflected in the lower values of knr in nitrogen saturated samples, while the radiative processes, reflected in the kr values, are not substantially affected by the presence of oxygen in the solutions. This relevant information encouraged us to analyze the potential use of our systems in the energy transfer process from the populated triplet excited states to the triplet ground state of the dioxygen molecule (see below). In the event of success, our compounds may be of potential interest in acting as photosensitizers.
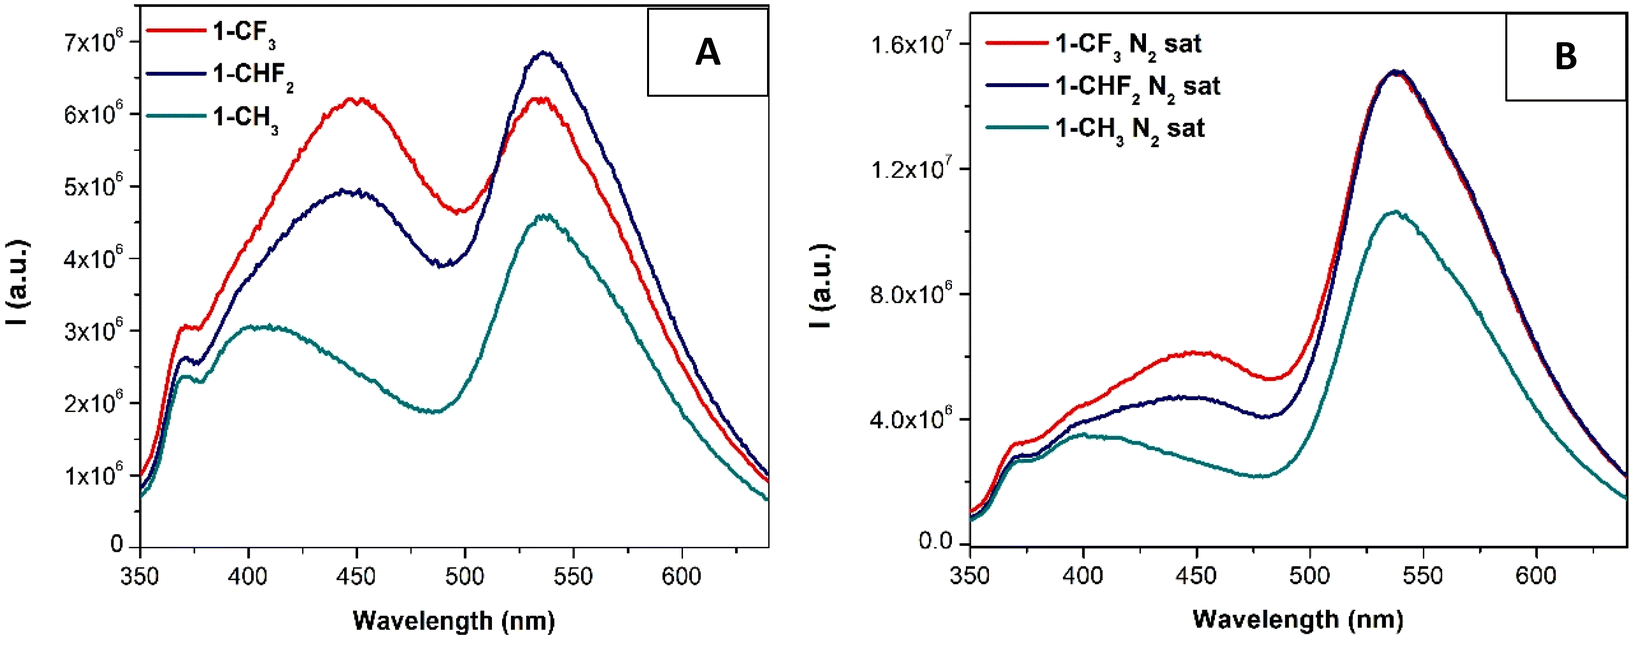
Interestingly, the emission properties of the compounds were improved in the solid state since almost all of them (except those derived from the L2 ligand) are emissive in this medium (see Fig. 3 and Table 4).
 | ||
| Fig. 3 Normalized emission spectra of compounds x-CF3, x-CHF2 and x-CH3 (x = 1, A; x = 3, B and x = 4, C) in the solid-state (λexc = 400 nm). | ||
| Complex | λ max Em (nm) | Φ | τ (μs) | χ2 | k r (× 105 s−1) | k nr (× 105 s−1) |
|---|---|---|---|---|---|---|
| 1-CF3 | 573 | 0.01 | 0.38 | 1.2 | 0.3 | 26.0 |
| 1-CHF2 | 575 | 0.01 | 0.69 | 1.2 | 0.2 | 14.3 |
| 1-CH3 | 598 | 0.01 | 0.34 | 1.1 | 0.3 | 29.1 |
| 3-CF3 | 569 | 0.004 | 0.40 | 1.1 | 0.1 | 24.9 |
| 3-CHF2 | 578 | 0.003 | 0.29 | 1.3 | 0.1 | 34.4 |
| 3-CH3 | 572 | 0.02 | 0.28 | 1.1 | 0.5 | 35.2 |
| 4-CF3 | 618 | 0.005 | 0.23 | 1.1 | 0.2 | 43.3 |
| 4-CHF2 | 595 | 0.02 | 0.20 | 1.0 | 1.0 | 49.0 |
| 4-CH3 | 595 | 0.01 | 0.15 | 0.8 | 0.9 | 65.8 |
In general, the emission in the solid state depends slightly on the para-substituted pyridyl ligands, except for the cases of 1-CH3 and 4-CF3, where the compounds display the most red-shift compared to the other two complexes of the same series. This can be due to more efficient packing that favors Pt⋯Pt and/or π⋯π or Pt⋯π contacts. In the first case, this packing can be more favored due to the presence of lower bulky and more planar substituents (X = H, R1 = p-tolyl and R2 = CH3), while the presence of all the electron-withdrawing substituents in 4-CF3 can be the reason for this more efficient packing due to the resulting lower electron density at the Pt center that can be compensated by these intermolecular contacts. Regarding this, the series derived from L4 (4-CF3, 4-CHF2 and 4-CH3) displays a more red-shifted emission wavelength with respect to the other complexes. We must remember that this series contains electron-withdrawing substituents at the N^N^N ligand (X = Cl and R2 = CF3), supporting the direct relationship between the deficient electron density and the recorded red-shift.
The origin of these emission bands has been attributed to 3MMLCT transitions.24,28,29,31–36 The recorded emission quantum yields are on the same order as those previously recorded in solution while the emission lifetimes are slightly shorter and on the order of hundreds of nanoseconds (0.15–0.69 μs), supporting the triplet origin of the emission (see the ESI†).
The lower lifetime values recorded in the solid state compared to those in solution can be due to the more favored non-radiative processes (knr values in Table 4) since the radiative deactivation pathways (kr values in Table 4) are quite close to those recorded previously in solution (Table 3).
Singlet oxygen production
As stated above, the phosphorescence emission of the compounds in solution is clearly affected by the presence of oxygen and this was an initial motivation to analyze their potential to react with O2 (that is, a triplet in the ground state) to produce singlet oxygen, 1O2, with potential applications as photosensitizers, PS. The experiments were carried out in dichloromethane where the concentration of oxygen can be higher in order to obtain a more rigorous analysis of the calculated singlet oxygen production quantum yields, ΦΔ, and using perinaphthenone as a reference. The obtained results are shown in Table 5.| Complex | Φ Δ (%) | Complex | Φ Δ (%) |
|---|---|---|---|
| 1-CF3 | 31 | 3-CF3 | 15 |
| 1-CHF2 | 22 | 3-CHF2 | 17 |
| 1-CH3 | 12 | 3-CH3 | 24 |
| 2-CF3 | 42 | 4-CF3 | 28 |
| 2-CHF2 | 12 | 4-CHF2 | 20 |
| 2-CH3 | 19 | 4-CH3 | 33 |
The obtained data are in the range 12–42%, being the majority in the top-range order compared to other values previously reported in the literature for Pt(II) PS.23,37–41 We can observe that in this case, the R2 substituent at the pyridyl ligand does affect the resulting ΦΔ but some trends can be found. The R2 = CF3 substituent improves the behaviour of the compound as PS in the 1 and 2-series with R1 = p-tolyl. In contrast, when the N^N^N ligand is electron deficient with R1 = CF3, the best 1O2 production is recorded for the methyl substituted pyridyl ligands (R2 = CH3). Additionally, the chloride substituent at the N^N^N ligand (X = Cl) led to a general increase of the ΦΔ. A higher population of the T1 triplet excited state in the chlorinated derivatives may be the reason for a more effective energy transfer to the triplet state of the oxygen, thus allowing the formation of this 1O2 reactive species.
We can also observe that there is not a direct correlation between the number of fluorine atoms in R2 and the resulting ΦΔ. However, in the case of the compounds with R2 = CH3 (that is, with zero fluorine atoms at the pyridyl ligand), we can observe a clear increase in the production of singlet oxygen, following the L4 > L3 > L2 > L1 trend. Hence, there is some influence of the presence of electron-withdrawing substituents at the R1 and X positions of the complex structure on the production of singlet oxygen. Finally, the number of fluorine atoms in R2 with those complexes without electron-withdrawing substituents at the N^N^N ligand (red bars in Fig. 4) improves the behavior of the compounds as PS (higher ΦΔ).
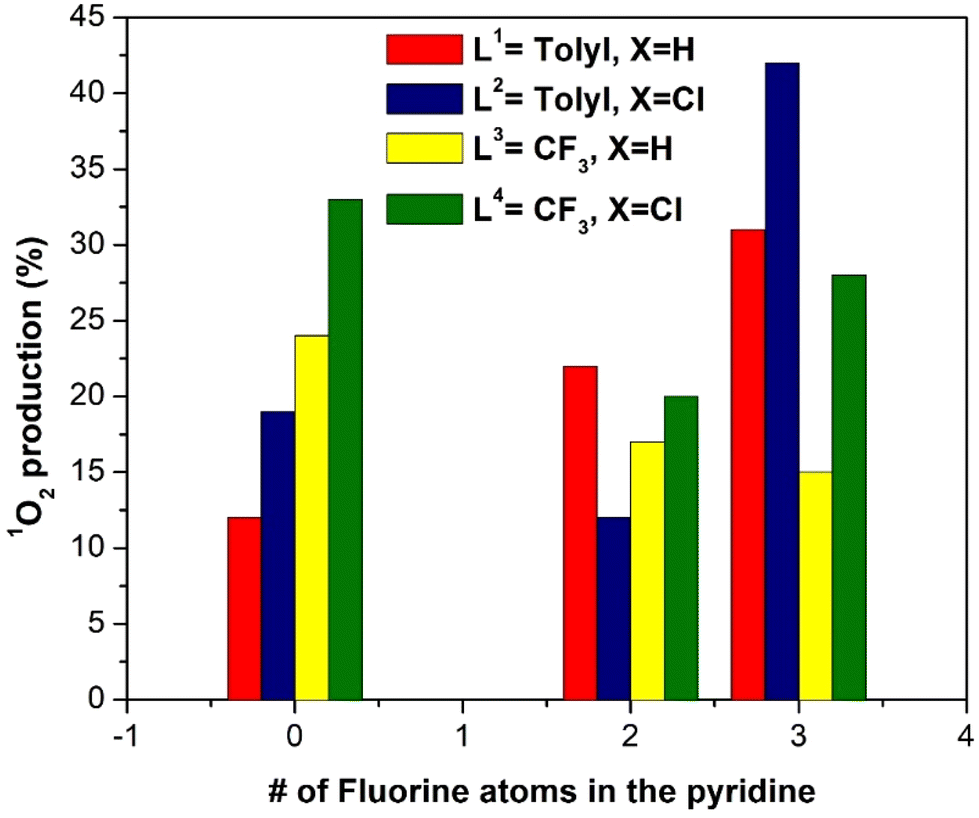 | ||
| Fig. 4 Plot of singlet oxygen production quantum yield, ΦΔ, of the (N^N^N)Pt(pyF) complexes as a function of the N^N^N ligand and the pyridine used. | ||
Biological assays
The initial phase of investigating the biological potential of these compounds involved conducting in vitro bioactivity assessments through MTT-reduction assays. A549 cells, a human non-small cell lung cancer cell line, were exposed to various platinum complexes under different conditions to evaluate their potential as both chemotherapeutic agents (tested in the absence of light) and photosensitizers (under photoactivation). The results obtained are presented in Table 6. For comparison purposes the reference compound for cancer treatment, cisplatin, has been included and measured at 72 h.42
| Complex | IC50 dark | IC50 405 nm (24 h) | IC50 405 nm (1 h) | PIa |
|---|---|---|---|---|
| a Best conditions. | ||||
| 1-CF3 | >50 | >50 | >50 | — |
| 1-CHF2 | >50 | >50 | 28.88 ± 3.05 | >2 |
| 1-CH3 | >50 | >50 | >50 | — |
| 2-CF3 | 14.61 ± 2.26 | 2.1 ± 1.17 | 2.33 ± 1.76 | 6.9 |
| 2-CHF2 | 11.36 ± 0.17 | 1.92 ± 0.51 | 1.51 ± 0.89 | 7.5 |
| 2-CH3 | 2.95 ± 0.21 | 2.85 ± 0.46 | 3.03 ± 0.74 | 1 |
| 3-CF3 | >50 | >50 | >50 | — |
| 3-CHF2 | >50 | >50 | >50 | — |
| 3-CH3 | >50 | >50 | >50 | — |
| 4-CF3 | >50 | ≈50 | >50 | — |
| 4-CHF2 | >50 | >50 | 36.13 ± 3.25 | >2 |
| 4-CH3 | >50 | >50 | 39.70 ± 8.94 | >2 |
| Cisplatin | 1.9 ± 0.8 | — | — | — |
In the absence of light, only complexes 2-CF3, 2-CHF2, and 2-CH3, which were incubated for 72 hours, demonstrated cytotoxic activity. Given the efficiency of these complexes as singlet oxygen generators, they were subjected to testing under irradiation at 405 nm under two distinct conditions. Initially, cells were incubated with the complexes for 24 hours, followed by 10 minutes of irradiation, and then allowed to incubate for a total of 72 hours. Under these conditions, only complexes 2-CF3 and 2-CHF2 improved their activity with a phototherapeutic index of 6.9 and 5.9, respectively, exhibiting IC50 values in the low micromolar range. In a second experiment, the cells were incubated with the complexes for 1 hour, followed by 10 minutes of irradiation, and then left to incubate for a total of 72 hours. Under these conditions very similar values were obtained for the initially active complexes, and some of the previous inactive complexes, such as complexes 1-CHF2, 4-CHF2 and 4-CH3, began to exhibit moderate activity.
In an attempt to establish a structure–activity relationship, it appears that within the N^N^N tridentate ligand, both the chloro substituent in the para position of the central pyridyl group and the tolyl substituent in the triazole ring enhance activity, as only the family series 2 exhibited activity. However, the substitution in the ancillary pyridine ligand with either methyl or fluoromethylated groups does not seem to be critical for activity. Nevertheless, under irradiation conditions, this pyridine ring substitution becomes more significant. Only the fluoromethylated species improved cytotoxicity, although making a direct comparison with singlet oxygen production is not straightforward. Complex 2-CF3 is the highest singlet oxygen producer and has one of the highest phototherapeutic indices, while complex 2-CHF2 is not, but it still shows a high PI. Independently, the CHF2-substituted complexes appear to be the most effective in enhancing activity as photosensitizers. In summary, it can be asserted that the generation of singlet oxygen is not the sole determinant of cytotoxicity. While not all complexes demonstrate cytotoxicity, it is evident that the increased production of singlet oxygen enhances their overall activity. Consequently, the observed activity of these complexes represents a synergistic blend of both chemotherapy and photodynamic therapy.
DNA-binding
In order to know the potential biological target of these platinum complexes and in view of the fact that DNA is the preferred target for platinum complexes, we investigated the DNA binding of some of the complexes.Absorption spectral titration experiments were performed at a constant concentration of Pt complexes (1-CF3, 2-CF3, 3-CF3, and 4-CF3) of 20 μM, while the concentration of calf thymus CT-DNA ranged from 0 to 200 μM. The absorbance (A) of the complex's most significantly affected band was measured after incremental additions of CT-DNA. To eliminate absorbance attributable to DNA at the specific wavelength, a reference cell containing DNA and a solvent mixture of 1% DMSO and PBS buffer at pH 7.4 was employed. Utilizing the data obtained from the absorption titration, we calculated the binding constant (Kb) of the Pt(II) complexes with CT-DNA, applying the Wolfe–Shimer equation:

In this analysis, we used various coefficients to describe the spectral changes observed. Specifically, εa represents A/[Pt(II) complex], εf stands for the extinction coefficient of the free Pt(II) compound, and εb signifies the extinction coefficient of the fully bound platinum(II) complex. By plotting [DNA]/(εa − εf) against [DNA], we can determine Kb as the ratio of the slope to the intercept. The calculated Kb values are detailed in Table 7.
Fig. 5 provides visual insight into the UV-vis spectra generated by the incremental addition of DNA to the solutions of 1-CF3, 2-CF3, 3-CF3, and 4-CF3. In all cases, a reduction in the intensity of the entire wavelength range is observed, and, in some instances, a subtle red shift is evident. This red shift may suggest that the complexes interact with the DNA through an intercalation mode.
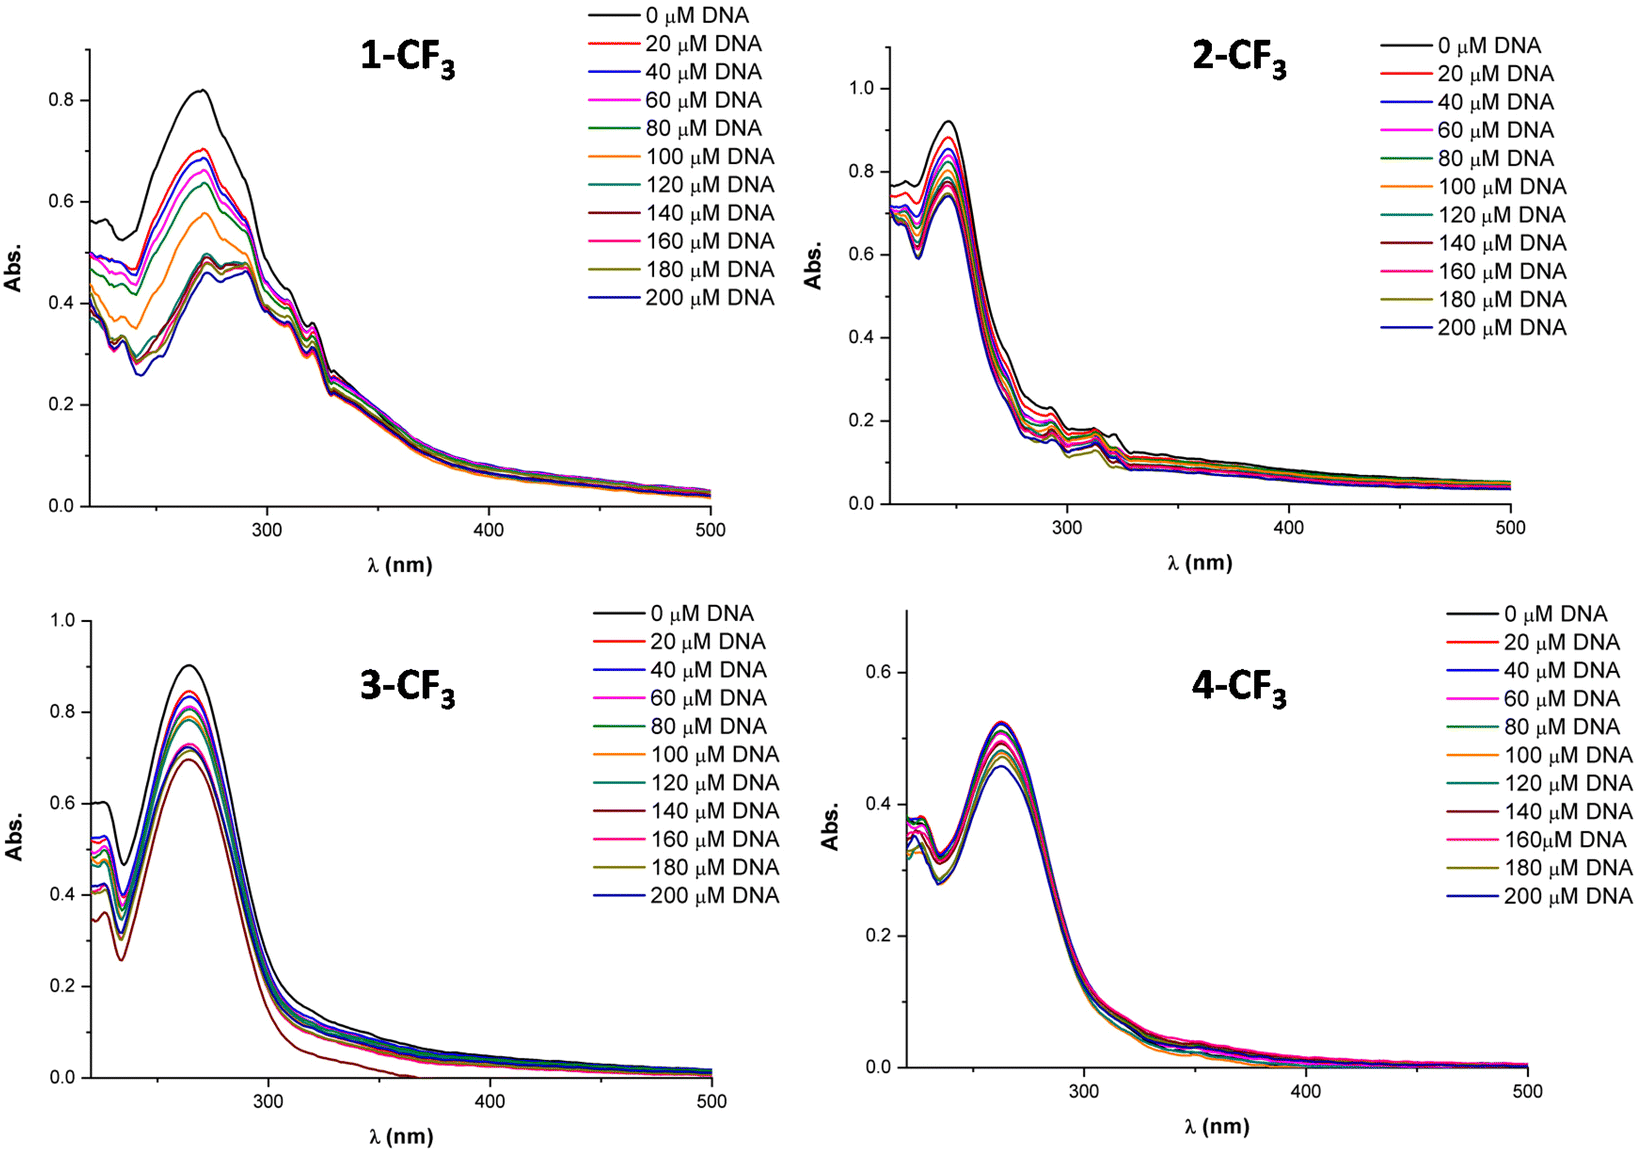 | ||
| Fig. 5 Absorption spectral titration experiment for complexes 1-CF3, 2-CF3, 3-CF3, and 4-CF3. | ||
When the complex–DNA interaction occurs via intercalation, it likely involves weak interactions between the ligand and the DNA base pairs. This combination of π electrons from the compound and the π electrons from the DNA nitrogenous bases results in a decrease in the energy of the electronic transition π–π*, leading to bathochromism. Conversely, the π orbitals of the DNA base pairs become partially occupied, reducing the likelihood of the transition and causing hypochromism. Typically, interactions involving intercalation exhibit both hypochromism and bathochromism, although a pronounced red shift is not always observed.
The DNA-binding constants (Kb) determined in this study are on the order of 104 M−1, indicating a moderate interaction with DNA. Regarding this aspect, it can be stated that while DNA interaction plays a role in the activity of some of these complexes, it is not the sole factor. Other targets may also contribute to their cytotoxic effects.
Conclusions
Electron-withdrawing substituents in (N^N^N)Pt(pyF) ligands impact photophysical and biological behaviors. Methyl-substituted pyF ligands exhibit notable emission in solution after excitation at 1IL and 1MLCT transitions, as confirmed by TD-DFT calculations. In the solid state, all samples show enhanced phosphorescence emission. The electron nature of the ligand substituents influences singlet oxygen generation. The most potent photosensitizers had CF3 and Cl groups on the N^N^N ligand. In cytotoxicity studies, family series 2 complexes with specific N^N^N tridentate ligand substituents showed notable cytotoxicity. Under light, their activities generally increase, with fluoromethylated species notably increasing photocytotoxicity. Complex 2-CF3 was particularly effective in oxygen production and the phototherapeutic index, while CHF2-substituted complexes emerged as top photosensitizers. These complexes exhibit moderate DNA binding, likely through intercalation. This interaction probably intensifies under light, aided by singlet oxygen generation. To conclude, the study reveals the importance of electron-based ligand modifications in platinum complexes, shaping their photophysical traits and bioactivity, and hinting at innovative chemotherapeutic and PDT drug designs.Experimental section
General information
Solvents were purchased from commercial sources and dried by distillation under a nitrogen atmosphere. Reagents 2,6-pyridinedicarbonitrile, 4-chloropyridine-2,6-carbonitrile, N,N-diisopropylethylamine (DIPEA), 4-methylpyridine, 4-(trifluoromethyl)pyridine, 4-(difluoromethyl)pyridine, hydrazine hydrate, p-toluoyl chloride, and trifluoroacetic acid were purchased from commercial sources and used without further purification. The [PtCl2(DMSO)2] precursor was prepared following the procedure described in the literature.43Physical measurements
Infrared spectra were recorded on an FT-IR 520 Nicolet spectrophotometer. 1H NMR (δ(TMS) = 0.0 ppm), 19F NMR (δ(CFCl3) = 0.0 ppm), and 31P NMR (δ(85% H3PO4) = 0.0 ppm) spectra were obtained on Bruker 400 and Bruker 500 (Universitat de Barcelona) instruments. High resolution electrospray mass spectra (+) were recorded on a Fisons VG Quatro spectrometer (Universitat de Barcelona). Absorption spectra were recorded in a 2 mm or 4 mm quartz cuvette in DMSO on a Cary 5000 UV–Vis–NIR or Shimadzu UV-2450 spectrophotometer. The emission spectra of the compounds in solution were recorded in a fluorescence quartz cuvette of 2 mm or 4 mm length path using a Horiba–Jobin–Yvon SPEX Nanolog spectrofluorimeter. Emission quantum yields were determined with a Hamamatsu Quantaurus QY absolute photoluminescence quantum yield spectrometer C11347. Luminescence lifetimes were measured on JYF-DELTAPRO-NL equipment upon excitation of the samples with a 390 nm NanoLED and collecting the decays through a band pass filter of 550 nm.Singlet oxygen quantum yield measurements
Room-temperature singlet oxygen phosphorescence was detected at 1270 nm with a Horiba Jobin Yvon SPEX Nanolog spectrofluorometer (Universitat de Barcelona) using the DSS-IGA020L detector. The use of a Schott RG 1000 filter was essential to eliminate from the infrared signal all the first harmonic contributions of sensitizer emission in the region below 850 nm. The singlet oxygen formation quantum yield was then determined by direct measurement of phosphorescence at 1270 nm following irradiation of the aerated aqueous solution of the samples. The samples were adjusted to an absorption of nearly 1 concerning the excitation wavelength to increase the sensitivity of the detection.Theoretical calculations
The geometries of the complexes were fully optimized without symmetry constraints at the CAM-B3LYP44/def2-TZVP45,46 level of theory by means of the Gaussian-09 program.47 The basis set includes scalar relativistic effects for Pt in the definition of the ECPs.46 Solvent effects were taken into consideration using the PCM method48 as implemented in the Gaussian-16 program.49 The TD-DFT calculations were computed using 20 excited states at the CAM-B3LYP(solvent = DMSO)/def2-TZVP level of theory using the Gaussian-16 program.Cell culture
The human lung carcinoma A549 cell line (from the ATCC, USA) was cultured in high glucose Dulbecco's modified Eagle's medium (DMEM) supplemented with 10% fetal bovine serum (FBS) as well as L-glutamine and penicillin/streptomycin at 37 °C under a humidified atmosphere of 95% air and 5% CO2.Cell viability assays
Cell metabolic activity was analyzed by an MTT-reduction assay to assess the A549 cell sensitivity to the complexes. Thus, 4000 cells (A549) per mL were seeded in flat-bottom 96-well plates (100 μL per well) in complete medium and allowed to attach for 24 h. A stock solution of the complexes was prepared in 0.1 M DMSO. Subsequent dilutions of the different stock solutions from the complexes using DMEM were prepared. 100 μL per well were added to the cells at concentrations ranging from 0.2 to 50 μM (final concentration: 0.1% DMSO); each concentration was performed in quadruplicate. After 1 h or 24 h of incubation with the complexes, duplicates of each concentration were irradiated with an LED lamp of 405 nm with a light dose of 6.5 and 15.1 J m−2, respectively, for 10 min. The cells were cultured for a total of 72 h. 10 μL of MTT (5 mg ml−1 in PBS) were added to each well and then further 2 h incubation was allowed at 37 °C. Finally, after removing the culture medium, DMSO (100 μL per well) was added to dissolve the formazan crystals. A 96-well FLUOstar Omega (BMG LABTECH) was used to determine the optical density at 550 nm, and the IC50 was calculated. Each experiment was repeated in at least three independent analyses.DNA binding
The complexes were dissolved in DMSO and diluted with PBS buffer (10 mM, pH = 7.4). The absorption spectra were recorded in a fixed concentration of metal complexes (20 μM) while gradually increasing the concentration of CT-DNA from 0 to 200 μM. To obtain the absorption spectra, the required amount of CT-DNA was added to both the compound solution and the reference solution to eliminate the absorbance of CT-DNA itself. Each sample solution was allowed to equilibrate for 5 min before the spectra were recorded with a Thermo Scientific Evolution 6000. Using the absorption titration data, the binding constant Kb was determined using the Wolfe–Shimer equation:where [DNA] is the concentration of CT-DNA, εa corresponds to the extinction coefficient observed (Aobsd/[M]), εf corresponds to the coefficient of the free compound, εb is the extinction coefficient of the compound fully bound to CT-DNA, and Kb is the intrinsic binding constant. The Kb value was given by the ratio of the slope to the intercept in the plot of [DNA]/(εa − εf) versus [DNA].

Synthesis and characterization
![[double bond, length as m-dash]](https://www.rsc.org/images/entities/char_e001.gif) C) 1183 (–CF3), 827 (Pt–N).
C), 745 (Pt–N).
C), 1429 (–CH3), 824 (Pt–N), 745 (C–Cl).
C), 1154 (–CF3), 813 (Pt–N).
C), 1150 (–CF3), 833 (Pt–N), 789 (C–Cl).
C), 1133 (–CF3), 1001 (C–F), 822 (Pt–N), 745 (C–Cl).
C) 1183 (–CF3), 827 (Pt–N).
C), 745 (Pt–N).
C), 1429 (–CH3), 824 (Pt–N), 745 (C–Cl).
C), 1154 (–CF3), 813 (Pt–N).
C), 1150 (–CF3), 833 (Pt–N), 789 (C–Cl).
C), 1133 (–CF3), 1001 (C–F), 822 (Pt–N), 745 (C–Cl).
Conflicts of interest
There are no conflicts to declare.Acknowledgements
The authors are grateful to Project PID2019-104121GB-I00, PID2020-115637GB-I00, PID2022-139296NB-I00 and PID2022-136861NB-I00 funded by the Ministerio de Ciencia e Innovación of Spain MCIN/AEI/10.13039/501100011033. This article is based on a work from COST Action CA22131, LUCES – Supramolecular LUminescent Chemosensors for Environmental Security, supported by COST (European Cooperation in Science and Technology). The authors would also like to acknowledge the International Research Network Hetero-elements and Coordination Chemistry: from Concepts to Applications (HC3A) and the Spanish network, Organometallic Chemistry for Sustainable Solutions – OASIS (RED2022-134074-T). A. F. is grateful to the Alexander von Humboldt Foundation for the J. C. Mutis Award. G. R.-I. acknowledges Fundación Carolina and Secretaría de Relaciones Exteriores de México for the PhD scholarship.References
- M. Mauro, A. Aliprandi, D. Septiadi, N. S. Kehr and L. De Cola, Chem. Soc. Rev., 2014, 43, 4144–4166 RSC.
- M. Casciotti, G. Romo-Islas, M. Álvarez, F. Molina, J. M. Muñoz-Molina, T. R. Belderrain and L. Rodríguez, Dalton Trans., 2022, 51, 17162–17169 RSC.
- A. Haque, L. Xu, R. A. Al-Balushi, M. K. Al-Suti, R. Ilmi, Z. Guo, M. S. Khan, W. Y. Wong and P. R. Raithby, Chem. Soc. Rev., 2019, 48, 5547–5563 RSC.
- M. Albrecht and G. Van Koten, Angew. Chem., Int. Ed., 2001, 40, 3750–3781 CrossRef CAS PubMed.
- M. J. Bryant, J. M. Skelton, L. E. Hatcher, C. Stubbs, E. Madrid, A. R. Pallipurath, L. H. Thomas, C. H. Woodall, J. Christensen, S. Fuertes, T. P. Robinson, C. M. Beavers, S. J. Teat, M. R. Warren, F. Pradaux-Caggiano, A. Walsh, F. Marken, D. R. Carbery, S. C. Parker, N. B. McKeown, R. Malpass-Evans, M. Carta and P. R. Raithby, Nat. Commun., 2017, 8, 1800 CrossRef CAS PubMed.
- M. C. Derosa and R. J. Crutchley, Coord. Chem. Rev., 2002, 233–234, 351–371 CrossRef CAS.
- J. Bonelli, E. Ortega-Forte, A. Rovira, M. Bosch, O. Torres, C. Cuscó, J. Rocas, J. Ruiz and V. Marchán, Biomacromolecules, 2022, 23, 2900–2913 CrossRef CAS PubMed.
- L. Wang, J. Karges, F. Wei, L. Xie, Z. Chen, G. Gasser, L. Ji and H. Chao, Chem. Sci., 2023, 14, 1461–1471 RSC.
- R. Ossola, O. M. Jönsson, K. Moor and K. McNeill, Chem. Rev., 2021, 121, 4100–4146 CrossRef CAS PubMed.
- C. Colomban, V. Martin-Diaconescu, T. Parella, S. Goeb, C. García-Simón, J. Lloret-Fillol, M. Costas and X. Ribas, Inorg. Chem., 2018, 57, 3529–3539 CrossRef CAS PubMed.
- F. Heinemann, J. Karges and G. Gasser, Acc. Chem. Res., 2017, 50, 2727–2736 CrossRef CAS PubMed.
- H. Huang, S. Banerjee and P. J. Sadler, ChemBioChem, 2018, 19, 1574–1589 CrossRef CAS PubMed.
- L. Huang, M. Rudolph, F. Rominger and A. S. K. Hashmi, Angew. Chem., 2016, 128, 4888–4893 CrossRef.
- A. Pinto, A. Llanos, R. M. Gomila, A. Frontera and L. Rodríguez, Inorg. Chem., 2023, 62, 7131–7140 CrossRef CAS PubMed.
- G. Romo-Islas, J. S. Ward, K. Rissanen and L. Rodríguez, Inorg. Chem., 2023, 62, 8101–8111 CrossRef CAS PubMed.
- M. Yang, J. Deng, D. Guo, J. Zhang, L. Yang and F. Wu, Org. Biomol. Chem., 2019, 17, 5367–5374 RSC.
- G. K. Couto, B. S. Pacheco, V. M. Borba, J. C. R. Junior, T. L. Oliveira, N. V. Segatto, F. K. Seixas, T. V. Acunha, B. A. Iglesias and T. Collares, J. Photochem. Photobiol., B, 2020, 202, 111725 CrossRef CAS PubMed.
- A. Lázaro, C. Cunha, R. Bosque, J. Pina, J. S. Ward, K. N. Truong, K. Rissanen, J. C. Lima, M. Crespo, J. S. Seixas De Melo and L. Rodríguez, Inorg. Chem., 2020, 59, 8220–8230 CrossRef PubMed.
- M. Li, Y. Xu, M. Zhao, F. Li, W. Feng, T. Feng, S. Liu and Q. Zhao, Inorg. Chem., 2020, 59, 17826–17833 CrossRef CAS PubMed.
- A. Salim Abu-Surrah and M. Kettunen, Curr. Med. Chem., 2006, 13, 1337–1357 CrossRef PubMed.
- Z. Xie, T. Fan, J. An, W. Choi, Y. Duo, Y. Ge, B. Zhang, G. Nie, N. Xie, T. Zheng, Y. Chen, H. Zhang and J. S. Kim, Chem. Soc. Rev., 2020, 49, 8065–8087 RSC.
- K. Jayanetti, K. Takemura, H. Bendale, A. Garg and I. Ojima, J. Fluorine Chem., 2023, 267, 110106 CrossRef CAS.
- G. Romo-Islas, R. M. Gomila, A. Frontera and L. Rodríguez, Inorg. Chem. Front., 2023, 10, 6204–6220 RSC.
- M. Mydlak, M. Mauro, F. Polo, M. Felicetti, J. Leonhardt, G. Diener, L. De Cola and C. A. Strassert, Chem. Mater., 2011, 23, 3659–3667 CrossRef CAS.
- S. C. Gangadharappa, I. Maisuls, I. P. Salto, S. Niemann, V. Bachtin, F. C. Herrmann and C. A. Strassert, J. Phys. Chem. C, 2021, 125, 5739–5747 CrossRef.
- D. Septiadi, A. Aliprandi, M. Mauro and L. De Cola, RSC Adv., 2014, 4, 25709–25718 RSC.
- Y. Li, K. M. C. Wong, H. L. Wong and V. W. W. Yam, ACS Appl. Mater. Interfaces, 2016, 8, 17445–17453 CrossRef CAS PubMed.
- L. Stegemann, J. Sanning, C. G. Daniliuc and C. A. Strassert, Z. Naturforsch., B: J. Chem. Sci., 2016, 71, 1087–1093 CrossRef CAS.
- S. Chakraborty, A. Aliprandi and L. De Cola, Chem. – Eur. J., 2020, 26, 11007–11012 CrossRef CAS PubMed.
- S. Sinn, F. Biedermann, M. Vishe, A. Aliprandi, C. Besnard, J. Lacour and L. De Cola, ChemPhysChem, 2016, 1829–1834 CrossRef CAS PubMed.
- A. Ruiz-Carretero, Y. Atoini, T. Han, A. Operamolla, S. Ippolito, C. Valentini, S. Carrara, S. Sinn, E. A. Prasetyanto, T. Heiser, P. Samorì, G. Farinola and L. De Cola, J. Mater. Chem. A, 2019, 7, 16777–16784 RSC.
- A. Aliprandi, D. Genovese, M. Mauro and L. De Cola, Chem. Lett., 2015, 44, 1152–1169 CrossRef CAS.
- A. Lázaro, R. Bosque, J. S. Ward, K. Rissanen, M. Crespo and L. Rodríguez, Inorg. Chem., 2023, 62, 2000–2012 CrossRef PubMed.
- C. Lochenie, A. Insuasty, T. Battisti, L. Pesce, A. Gardin, C. Perego, M. Dentinger, D. Wang, G. M. Pavan, A. Aliprandi and L. De Cola, Nanoscale, 2020, 12, 21359–21367 RSC.
- S. Sinn, F. Biedermann and L. De Cola, Chem. – Eur. J., 2017, 23, 1965–1971 CrossRef CAS PubMed.
- R. Soldati, A. Alipri, M. Mauro, L. De Cola and D. Giacomini, Eur. J. Org. Chem., 2014, 7113–7121 CrossRef CAS.
- S. Goswami, R. W. Winkel and K. S. Schanze, Inorg. Chem., 2015, 54, 10007–10014 CrossRef CAS PubMed.
- I. Toubia, C. Nguyen, S. Diring, L. M. A. Ali, L. Larue, R. Aoun, C. Frochot, M. Gary-Bobo, M. Kobeissi and F. Odobel, Inorg. Chem., 2019, 58, 12395–12406 CrossRef CAS PubMed.
- S. W. Lai, Y. Liu, D. Zhang, B. Wang, C. N. Lok, C. M. Che and M. Selke, Photochem. Photobiol., 2010, 86, 1414–1420 CrossRef CAS PubMed.
- E. Ortega, C. Pérez-Arnaiz, V. Rodríguez, C. Janiak, N. Busto, B. García and J. Ruiz, Eur. J. Med. Chem., 2021, 222, 113600 CrossRef CAS PubMed.
- A. Lázaro, C. Cunha, R. Bosque, J. Pina, J. S. Ward, K. N. Truong, K. Rissanen, J. C. Lima, M. Crespo, J. S. Seixas De Melo and L. Rodríguez, Inorg. Chem., 2020, 59, 8220–8230 CrossRef PubMed.
- M. Jóźwiak, M. Struga, P. Roszkowski, A. Filipek, G. Nowicka and W. Olejarz, Biomed. Pharmacother., 2019, 110, 618–630 CrossRef PubMed.
- J. H. Price, A. N. Williamson, R. F. Schramm and B. B. Wayland, Inorg. Chem., 1972, 11, 1280–1284 CrossRef CAS.
- T. Yanai, D. Tew and N. Handy, Chem. Phys. Lett., 2004, 393, 51–57 CrossRef CAS.
- F. Weigend and R. Ahlrichs, Phys. Chem. Chem. Phys., 2005, 7, 3297–3305 RSC.
- F. Weigend, Phys. Chem. Chem. Phys., 2006, 8, 1057–1065 RSC.
- M. J. Frisch, et al., Gaussian 09 (Revision D.1), Gaussian Inc., Wallingford CT, 2010 Search PubMed.
- J. Tomasi, B. Mennucci and R. Cammi, Chem. Rev., 2005, 105, 2999–3093 CrossRef CAS PubMed.
- M. J. Frisch, G. W. Trucks, H. B. Schlegel, G. E. Scuseria, M. A. Robb, J. R. Cheeseman, G. Scalmani, V. Barone, G. A. Petersson, H. Nakatsuji, X. Li, M. Caricato, A. V. Marenich, J. Bloino, B. G. Janesko, R. Gomperts, B. Mennucci, H. P. Hratchian, J. V. Ortiz, A. F. Izmaylov, J. L. Sonnenberg, D. Williams-Young, F. Ding, F. Lipparini, F. Egidi, J. Goings, B. Peng, A. Petrone, T. Henderson, D. Ranasinghe, V. G. Zakrzewski, J. Gao, N. Rega, G. Zheng, W. Liang, M. Hada, M. Ehara, K. Toyota, R. Fukuda, J. Hasegawa, M. Ishida, T. Nakajima, Y. Honda, O. Kitao, H. Nakai, T. Vreven, K. Throssell, J. A. Montgomery Jr., J. E. Peralta, F. Ogliaro, M. J. Bearpark, J. J. Heyd, E. N. Brothers, K. N. Kudin, V. N. Staroverov, T. A. Keith, R. Kobayashi, J. Normand, K. Raghavachari, A. P. Rendell, J. C. Burant, S. S. Iyengar, J. Tomasi, M. Cossi, J. M. Millam, M. Klene, C. Adamo, R. Cammi, J. W. Ochterski, R. L. Martin, K. Morokuma, O. Farkas, J. B. Foresman and D. J. Fox, Gaussian 16, Revision A.01, Gaussian, Inc., Wallingford CT, 2016 Search PubMed.
Footnote |
| † Electronic supplementary information (ESI) available: NMR and mass spectra of the synthesized compounds. Absorption spectra of the compounds in DMSO. Calculated wavelengths of absorption, transition energies, and oscillator strength. Representation of the NTOs involved in the lowest energy transitions. Emission lifetime decays and residuals. Stability of the compounds in PBS and DMSO (5%) at 37 °C measured by UV-Vis spectroscopy. See DOI: https://doi.org/10.1039/d3dt04050j |
| This journal is © The Royal Society of Chemistry 2024 |