
 Open Access Article
 This Open Access Article is licensed under a
 Creative Commons Attribution 3.0 Unported Licence
Repurposing quantum chemical descriptor datasets for on-the-fly generation of informative reaction representations: application to hydrogen atom transfer reactions†
Javier E.
Alfonso-Ramos
 a,
Rebecca M.
Neeser
bc and
Thijs
Stuyver
*a
a,
Rebecca M.
Neeser
bc and
Thijs
Stuyver
*a
aEcole Nationale Supérieure de Chimie de Paris, Université PSL, CNRS, Institute of Chemistry for Life and Health Sciences, 75 005 Paris, France. E-mail: thijs.stuyver@chimieparistech.psl.eu
bMassachusetts Institute of Technology, Department of Chemical Engineering, 02139 Cambridge, MA, USA
cETH Zürich, Institute of Pharmaceutical Sciences, 8093 Zürich, Switzerland
First published on 2nd April 2024
Abstract
In this work, we explore how existing datasets of quantum chemical properties can be repurposed to build data-efficient downstream machine learning models, with a particular focus on predicting the activation energy of hydrogen atom transfer (HAT) reactions. Starting from a valence bond (VB) analysis of a generic HAT process, a set of informative descriptors is identified. Next, a surrogate neural network model is constructed to predict an informative representation, based on the identified VB descriptors, with the help of a publicly available dataset of (pre-computed) quantum chemical properties of organic radicals. We demonstrate that coupling the resulting on-the-fly informative representation to a secondary machine-learning model for activation energy prediction outperforms various predictive model architectures starting from conventional machine-learning inputs by a wide margin, at no additional computational cost. By basing their final predictions on physically meaningful descriptors, our models enable the extraction of chemical insights, providing an additional benefit. Finally, because of the extreme data efficiency of our descriptor-augmented models, we are able to fine-tune and apply them to small datasets across various reaction conditions, settings and application domains, ranging from regular (liquid phase) synthesis, over metabolism and drug design, to atmospheric chemistry.
1 Introduction
In recent years, the interest in predictive (machine learning) models for chemical reactivity has soared. For tasks for which hundreds of thousands to millions of data points are available, e.g., forward and retrosynthesis prediction, significant strides towards accurate machine learning (ML) models have been made.1–7 In the absence of data scarcity, neural network architectures that learn from simple structural descriptions of molecules can be adapted to these respective tasks with great success. For example, both graph neural networks (GNNs) operating on 2D molecular graphs and Transformer models operating on Simplified Molecular Input Line Entry Specification (SMILES)8 strings can be trained to predict the main product of chemical reactions with roughly 90% accuracy on the popular USPTO benchmark dataset.1–3For more specialized reactivity tasks (the prediction of activation energies/reaction rates, yields, enantiomeric excess etc.), however, data tend to be scarce, and often number in the hundreds rather than in the hundreds of thousands. A straightforward application of the same type of data-hungry model architectures is generally not feasible in these cases, as training these models from scratch means that they must learn how to properly interpret a molecular structure. One potential approach to improve the data efficiency of machine learning models is introducing domain knowledge about the underlying physics/quantum chemistry into the model. Models starting from physically meaningful input representations, i.e., representations based on quantum mechanical (QM) reactivity descriptors, have been demonstrated to reach reasonable accuracy for datasets consisting of only a couple hundred or a few thousand data points,9–18 and they have been reported to be significantly more generalizable, i.e., they are significantly more accurate in out-of-sample predictions, than conventional, structure/graph-based, analogs.11,12,19
Unfortunately, QM descriptors tend to be computationally expensive – since they typically involve an elaborate workflow consisting of conformer generation, geometry optimization and finally a single-point density functional theory (DFT) calculation for each unique molecule – limiting their applicability in broad virtual screening campaigns. A promising strategy to circumvent this limitation is to use separate machine learning models to predict these QM reactivity descriptors on-the-fly, starting from a simple 2D (graph) or geometry-based representation. Some prominent examples of such descriptor prediction models are Chemprop, DeepMoleNet, SchNet and AIMNet.20–23 In 2020, Guan et al. proposed to directly integrate such a descriptor prediction model into a reactivity prediction model as a surrogate.24 In their approach, a directed message-passing neural network (D-MPNN) model20 was trained to predict various atom- and bond-level QM descriptors from input molecular structures. These QM descriptors were subsequently used to augment the hidden representations of a Weisfeiler–Lehman (WL) based GNN25 to predict regiochemical preferences for (aromatic) substitution reactions. For training sets as small as 200 data points, the resulting “QM-augmented” models reached accuracies of 85% and more on a random data split, outperforming regular GNN analogs by more than 10%. Furthermore, the developed models were extremely fast; individual predictions required 100 ms or less, implying that they could be readily employed in high-throughput screening campaigns. In a follow-up study, Stuyver et al. adapted this model to predict activation energies for competing (gas-phase) E2 and SN2 reactions26,27 and observed a remarkable improvement in accuracy for their GNN model upon QM-augmentation as well, particularly in the data-limited regime.28 It should be noted that the inclusion of a surrogate model for QM-derived descriptors has also recently been tried – with success – for the prediction of ADME properties for candidate drug molecules.29
Even when a surrogate model strategy is viable, initial training data for the model still needs to be generated, and in some situations, this may actually be more expensive than the explicit calculation of QM descriptors at inference time. For example, in their proof of principle study, Guan et al.24 generated a dataset of selected QM properties for 130k organic molecules, extracted from the ChEMBL30 and Pistachio31 databases.
A potential strategy to circumvent the expensive QM descriptors calculations altogether would be to use pre-existing datasets. In recent years, various general-purpose public datasets of computed QM properties of molecules have been released.32–38 While these datasets have found dual use as benchmarking targets,39–41 as well as training data for generative models,42–44 their repurposing for (indirectly related) downstream predictive tasks, e.g., the prediction of chemical reactivity, has remained largely unexplored up to this point.
Here, we will demonstrate that such a data repurposing strategy can be readily applied to efficiently learn activation energies for hydrogen atom transfer (HAT) reactions. Starting from a generic description of HAT reactivity within the valence bond perspective, we determine a set of qualitative characteristics that can be expected to capture the main trends for this type of reactivity. Based on this analysis, we identify the recently released dataset of QM properties for 40![[thin space (1/6-em)]](https://www.rsc.org/images/entities/char_2009.gif) 000 closed-shell organic molecules and 200000 radical analogs by Paton and co-workers, BDE-db,36 as a useful source of informative descriptors and build a surrogate model able to infer these descriptors on the fly across a broad chemical reaction space based on a simple SMILES string input.36 The QM representation emerging from this surrogate model is subsequently demonstrated to outperform traditional structure-based representations for various machine learning model architectures on a challenging, in-house generated dataset of diverse hydrogen abstraction reactions by a large margin. Most importantly, models based on the developed surrogate QM representation are extremely data efficient, approaching convergence for training dataset sizes of only a couple hundred points.
000 closed-shell organic molecules and 200000 radical analogs by Paton and co-workers, BDE-db,36 as a useful source of informative descriptors and build a surrogate model able to infer these descriptors on the fly across a broad chemical reaction space based on a simple SMILES string input.36 The QM representation emerging from this surrogate model is subsequently demonstrated to outperform traditional structure-based representations for various machine learning model architectures on a challenging, in-house generated dataset of diverse hydrogen abstraction reactions by a large margin. Most importantly, models based on the developed surrogate QM representation are extremely data efficient, approaching convergence for training dataset sizes of only a couple hundred points.
Finally, we demonstrate the practical usefulness of the developed representation by considering various real-world applications. HAT reactivity plays a central role in various sub-fields of chemistry. For example, HAT reactions constitute the starting point of many oxidation pathways in polymer, atmospheric and combustion chemistry.45–50 Additionally, they are key transformations giving rise to the breakdown of active pharmaceutical ingredients, so their kinetic and thermodynamic properties facilitate the prediction of the stability of these compounds,51,52 as well as the formation of potentially hazardous metabolites.53 Finally, HAT reactions also play a central role in various common synthesis strategies, e.g. in several flavors of C–H functionalization and photocatalysis, and a lot of effort has been devoted to gaining insights into the factors that affect their rates and yields.54–58 As a result, several small datasets have been produced for this reaction class in recent years, each with distinct reaction scopes and conditions, depending on the specific application for which they were designed.45,53,57,59–65 Because of their heterogeneity, these datasets cannot be combined easily. As will be demonstrated below, with our extremely data-efficient model architectures, we are able to meaningfully learn from these small datasets, and generate accurate predictions across the chemical spaces associated with the respective application domains, at both an unprecedented speed and an extremely low computational cost.
In essence, the proposed strategy rests on making the overall machine learning model architecture modular, with a core informative representation prediction part, followed by a fairly linear and extremely data-efficient downstream reactivity model part, that can be easily retrained on/finetuned to the specific application or dataset at hand. It should be noted that the presented strategy can also be regarded as an alternative to the more conventional approach of fine-tuning pre-trained models by modifying the prediction head.66 Overall, we believe that the presented work provides a blueprint for how – starting from physics/chemistry-inspired mechanistic insights – useful (existing) datasets of QM properties can be identified and leveraged for downstream predictive tasks. Furthermore, it underscores the importance of community efforts to generate and curate QM property datasets – and to include as many informative descriptors as possible in them. At the end of this contribution, we briefly reflect on the transferability of the approach to other reaction types.
2 The valence bond reactivity model as a source of inspiration for descriptor selection
As indicated in the introduction, to gain qualitative insights into the main factors driving HAT reactivity, we took inspiration from qualitative Valence Bond (VB) theory.67,68 In a VB reactivity analysis, reactivity diagrams, reflecting the shape of the potential energy surface (PES) associated with a given chemical system along a chosen reaction coordinate, are constructed. Usually, one starts by examining the evolution of the so-called “diabatic curves”, which represent the wave function associated with a limited number of VB structures; i.e., they correspond to a localized VB configuration (e.g., a specific Lewis structure of the reactants or products). These individual diabatic curves interact along the reaction coordinate, and collectively they give rise to the “adiabatic” curve, i.e., the full ground-state PES associated with the chemical system under consideration. The transition state then corresponds to the top of the hill of the adiabatic state, which usually lies in the same region as the crossing point between the reactant and product diabatic states. An in-depth discussion of the theory behind the construction VB reactivity diagrams is provided in ref. 68. In Fig. 1, a simplified sketch of such a diagram is presented for the model reaction between H2 and H˙.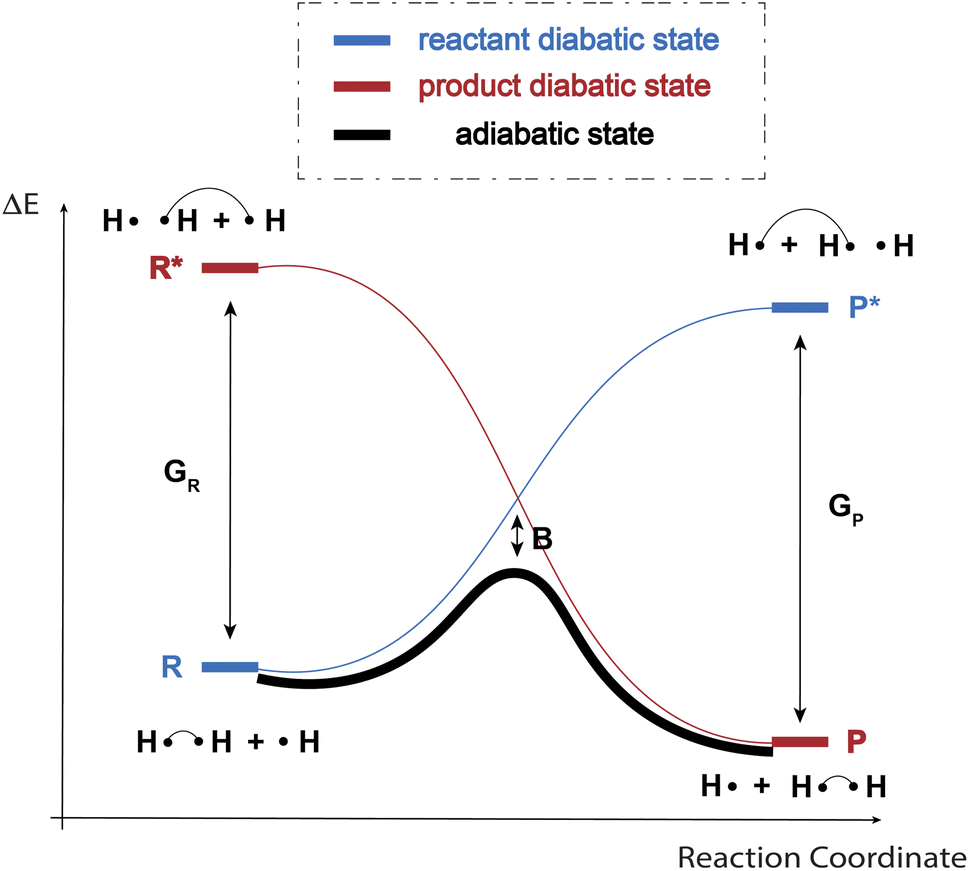 | ||
| Fig. 1 An example VB reactivity diagram for a model HAT reaction between H2 and H˙. Along the reaction coordinate, the reactant diabatic state (blue) rises in energy (since the hydrogen atoms contributing electrons to the formal covalent bond on the left become increasingly separated as the reaction proceeds), the product state (red) drops in energy, since the product covalent bond becomes increasingly stabilized as the associated hydrogens approach. The adiabatic state (black) is the full ground- (or adiabatic) state resulting from the mixing of the localized diabatic states. | ||
From a generic valence bond diagram, the following universally valid – yet approximate – expression for the barrier height can be derived:68
 | (1) |
Eqn (1) is an essentially linear – and inherently interpretable – one, and has been applied successfully to various areas of chemical reaction space, leading to robust and fairly accurate barrier estimates.69–76 Unfortunately, obtaining reliable values for each of the featured parameters is ambiguous and computationally expensive for some reaction types. For HAT reactions, however, most of the terms in the expression can straightforwardly be connected to unambiguous QM descriptors, which can be readily computed with high accuracy, hence our decision to focus on this type of reactivity in this proof of concept study.
More specifically, in HAT reactions, the promotion energies, Gr and Gp, are proportional to the vertical/frozen bond dissociation energy (BDE) – or, more accurately, the bond dissociation free energy (BDFE) – of the covalent bond being broken in the reactant and product geometries respectively.68 The thermodynamic driving force, ΔErp, in its turn corresponds to the (relaxed) BD(F)E by definition. f and B have been demonstrated to be fairly constant within narrow reaction families, e.g., when considering a carbon-based radical abstracting H atoms from a C sp3 bond.68 Since our ambition here is to generalize across the full space of (neutral) C, H, N, O containing organic radical reactions, this assumption can be expected not to hold perfectly. It has been demonstrated however that both of these parameters are connected to a variety of descriptors that can in fact be quantified straightforwardly.
First and foremost, f depends on the electrostatic interactions along the abstraction site–hydrogen–radical site point-charge array in the transition state (TS) geometry, which can be probed indirectly by considering atomic charges (in the reactant and product geometries).77 Additionally, f also depends on the sterics around the radical and abstraction sites – steric bulk around those sites can be expected to strain the transition state geometry and hence should result in a higher crossing-point between the reactant and product diabatic curves. Commonly, buried volume (Vbur) is used as a descriptor to quantify steric bulk around reactive sites.78 Finally, f has also been suggested to depend on the extent of delocalization in reactant and product, which can be probed through consideration of the spin density (ρ).68 However, an alternative viewpoint is that losses and/or gains in delocalization energy may already be fully reflected in the thermodynamic driving force term (ΔErp), so that the impact of delocalization on f may actually be negligible.73 As indicated above, B depends on the interaction between the various diabatic states, and has been connected primarily to the (local) ionization potentials and electron affinities – and/or electron negativities – at the radical/abstraction sites.68
The discussion in the previous paragraphs provides us with an ideal QM descriptor representation that should render the mapping function from reaction to HAT barriers as linear as possible. As already indicated in the introduction, computing this complete input representation would be complex and expensive – many different DFT calculations would be needed (for both charged and uncharged species) for every data point. At the same time, the literature suggests that even a subset of the descriptors mentioned above could be sufficient to build an informative representation: for small subsets of the chemical space we are interested in, various groups have previously constructed effective multivariate linear models, as well as some more advanced architectures (random forests, neural networks, etc.) with a subset of the descriptors listed above.53,59,60,79
As already indicated above, encouraged by these findings, we selected the BDE-db dataset as a suitable source of descriptors. This dataset contains (relaxed) BDFEs – at room temperature in the gasphase – and BDEs, (Mulliken) atomic charges, and (Mulliken) spin densities for over 200000 organic radical compounds.36 Additionally, since accurate geometries are included in this dataset, we were able to expand this descriptor list with buried volume values at a marginal computational cost. Finally, we also used these geometries to rapidly compute vertical, i.e., frozen or unrelaxed, BDE values at extended tight-binding (xTB) level of theory (these final low-level descriptors were found to be remarkably predictive – even at this low theory level – for activation energies of HAT reactions between P450 enzymes and organic compounds in a recent study by Gingrich et al.53 – see the Methodology section for more details).
With this dataset-derived representation selected, we set out to train a surrogate descriptor model, in combination with a top-level reactivity model, to probe HAT reactivity on the fly.
3 Methodology
3.1 Extracting and curating the descriptor data from the BDE-db dataset
As indicated in the introduction, the training data for the surrogate neural network (vide infra) was extracted from a dataset recently released by Paton and co-workers,36 consisting of QM properties for radicals and associated closed shell molecules of less than ten heavy atoms, without formal charges on any of the atoms, and containing exclusively C, H, N, and O atoms. We complemented the registered descriptors, i.e., BDFEs, spin densities, and partial charges, with Vbur values around the radical site and frozen BDE values computed at GFN2-xTB level of theory. Vbur values were computed with the help of the Morfeus package80 with a radius of 3.5 Å.81 Frozen BDEs were computed by re-optimizing the extracted geometries at GFN2-xTB level of theory and then performing single-point calculations on the bond fragments, i.e., the organic radical and a hydrogen radical respectively. In total, the complete set of descriptors could be obtained for 186240 dissociation reactions in this manner.
The entire dataset in its curated form can be accessed and downloaded from https://figshare.com/articles/dataset/dataset_surrogate_model_cs/24754341. It should be noted that during the preparation of this manuscript, an expanded version of the dataset, covering the elements S, Cl, F, P, Br and I as well was released.82 As such, the approach described here could be expanded straightforwardly to a much broader scope of HAT reactions in the near future.
3.2 Generation of the HAT dataset
To enable comparisons between various types of machine learning model architectures, a dataset of HAT reaction profiles was generated by combining multiple bond dissociation reactions included in the BDE-db dataset.A fully automated reaction profile computation workflow based on autodE83 and Gaussian16 (ref. 84) was set up to generate this dataset, starting from an input list of reaction SMILES. This workflow is analogous to the workflow recently developed for cycloaddition reactions by Stuyver et al.;85 an in-depth discussion can be found in Section S1 of the ESI.†
It should be noted that around 40 billion HAT reaction SMILES can in principle be constructed by making combinations between bond dissociation reactions in the BDE-db dataset. Most of these reactions are very similar, involving HAT among two carbon atoms. We aimed to select a tiny sample (2000 reactions) from this huge search space, covering maximal structural diversity, to compute explicitly. To this end, we iteratively sampled enumerated reactions in such a way that the differential reaction fingerprint (radius = 3; nbits = 2048)86 distances with all previously sampled reactions exceeded 0.85 (see Section S1† for more details).87
As the level of theory for the DFT calculations, we selected M06-2X/def2-SVP88,89 for optimizations and frequency calculations, i.e., thermal corrections. Single-point energy refinements were performed at M06-2X/def2-TZVP88,90 level of theory. The choice for the functional and basis set was inspired by the benchmarking results from Paton et al.91
One technical aspect where we decided to deviate in our workflow from the previous work on cycloaddition reactions is the conformer selection.85 Previously, the default number of conformers in autodE (300) would be generated for every species along the profile, a root mean squared deviation (RMSD) threshold of 0.3 Å would then be applied to remove very similar conformer geometries, after which the lowest energy conformer, computed at GFN2-xTB level of theory, would be selected. Remarkably, for HAT reactions, this methodology leads to poor reproducibility of the activation energies (mean absolute errors between successive runs on 30 randomly sampled reactions amounting to more than 2.1 kcal mol−1 for the activation energy, and ∼0.5 kcal mol−1 for the reaction energy; cf. Section S1†). After some benchmarking, we adapted these conformer selection settings, selecting 1000 conformers for every species, using an RMSD cut-off of 0.1 Å, and ranking conformers based on single-point M06-2X/def2-SVP88,89 energies. In this manner, two successive runs of the workflow on the same set of reaction SMILES result in an acceptable mean absolute error (MAE) of ∼1 kcal mol−1 for the activation energies and ∼0.6 kcal mol−1 for the reaction energies.
Tunneling corrections were computed based on the semi-classical approximation.92 In this approximation, the potential energy barrier is approximated by an Eckart potential, for which the tunneling probability is computed analytically and the tunneling transmission coefficient is integrated numerically. More details can be found in Section S1† and ref. 92.
In total, 1511 reaction profiles were successfully computed in this manner (75.6% success rate).
3.3 Surrogate neural network model for QM descriptor prediction
A graph neural network (GNN), consisting of a directed message-passing neural network (D-MPNN) encoder and a feed-forward neural network (FFNN), was selected for the fast prediction of the QM descriptors.20,24 The model architecture is an adaptation of the Chemprop model.20 Inference for an individual molecule starts by parsing its SMILES string, after which a graph-based input representation is constructed, with atoms as nodes and bonds as edges. The D-MPNN module subsequently encodes this molecular graph, resulting in learned atom and bond features. Finally, the learned representation of the molecule is used as input to the multitask FFNN, which yields the final predictions (cf.Fig. 2). A more detailed description of the model architecture can be found in Section S2 of the ESI.†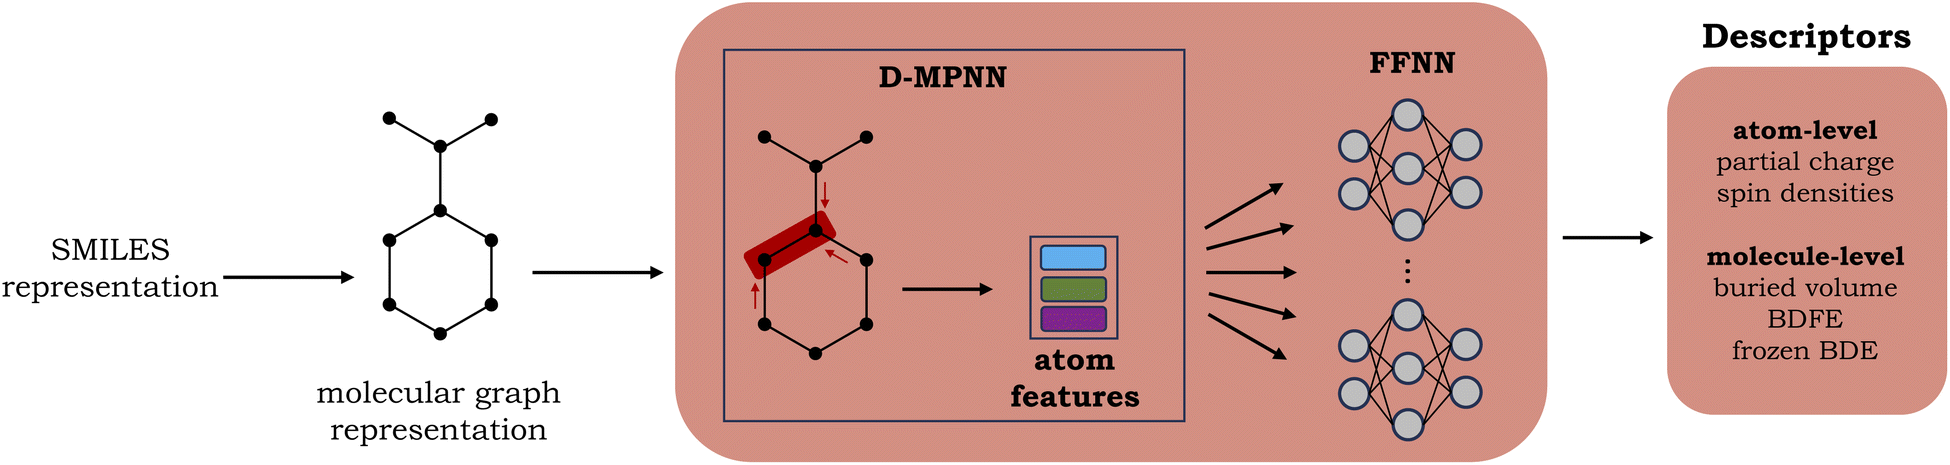 | ||
| Fig. 2 Schematic representation of the surrogate model used for the QM descriptor predictions. | ||
The surrogate model is trained to predict two atom-level descriptors (atomic Mulliken charges and spin densities), as well as three molecule-level descriptors (relaxed BDFEs, frozen BDEs, and Vbur of the radical sites). Based on a hyperparameter grid search, the depth was set to 5 for the D-MPNN and 4 for the FFNN. For the hidden size, 1200 neurons were selected for the D-MPNN and 900 for the FFNN (cf. Section S2.1 in the ESI†).
Once a reasonable set of hyperparameters was selected, the model was trained on a new data split, where all the radical species and molecules present in the constructed HAT reactivity dataset (vide supra) constitute the test set, and the remaining points are split between training (80%) and validation (20%) set.
3.4 Model architecture for the reactivity prediction
Various established model architectures for reactivity prediction have been considered, ranging from linear multivariate regression, k-nearest neighbors (KNN), random forests (RF), graph neural networks (GNN), XGBoost and FFNN, to geometry-based kernel ridge regression (KRR) An in-depth discussion of the characteristics of each model considered can be found in Sections S3.1 and S3.2 of the ESI.†Additionally, a couple of models inspired by “delta machine learning” (Δ-ML),93–95 were also designed. In this model architecture, the BDFE values, inferred by the surrogate model, are first used to generate an estimated thermodynamic driving force, and this driving force is correlated with the activation energy across the training set. Subsequently, an ML model is trained to predict the deviation of the activation energy, i.e., the target considered in this study, from the established thermodynamic-kinetic correlation trend line. For a more in-depth discussion of this model architecture, we refer to Section S3.3 of the ESI.†
3.5 Datasets
In total, 3 application domains have been considered to showcase the ability of our model architectures to efficiently learn barrier heights in various settings.In the first application domain, we focused on HAT predictions related to chemical synthesis. We started by analyzing a dataset consisting of 238 computed reaction profiles for alkoxy radicals abstracting hydrogens from hydrocarbons and heterosubstituted compounds in an acetonitrile solution.79 Geometry optimizations and frequency calculations were performed at ωB97X-D/6-31G(d) level of theory,96–99 single-point energy refinements at UωB97X-D/6-311++G(d,p) level of theory, and solvation was taken into account through the SMD model.100 Since two of the radicals involved in this dataset contain Cl and F atoms – elements that are not present in the training data of the surrogate model – we computed the descriptors for these species explicitly.
Subsequently, we considered a small dataset of experimentally reported selectivities for 6 hydrocarbons by CH3O˙ determined by Zuo et al.57 More specifically, we aimed to reproduce the observed selectivities by inferring the relative barrier heights associated with individual carbon attack positions (15 in total).
A second main dataset within this domain, consisting of reactions associated with photoredox-mediated HAT catalysis, was also considered. 564 reactions with various allylic, propargylic, benzylic, aldehyde and alkyl substrates (resulting in a collection of 182 distinctive C–H bonds positions) and O/N-based radical species, were extracted from the recently published dataset by Yang et al.60 The original computations of the activation energies were performed at B3LYP/6-31+G(d,p)//M06-2X/TZVPP;88,89,101–103 solvation energy corrections were included using the SMD model with M06-2X/6-31G(d) in acetonitrile.100
Finally, we aimed to apply our models to an experimental dataset of rate constants/activation energies for 45 HAT reactions from C(sp3)–H bonds by cumyloxyl radical (CumO˙), compiled by Bietti et al.62
In a second application domain, we focused on the prediction of metabolites of medicinally relevant compounds. As such, we considered a second dataset consisting of 24 activation energies for hydrogen atom transfer by the cytochrome P450 enzyme from organic compounds,53 computed at B3LYP/6-311++G(2d,2p)//B3LYP/6-31G(d) (Fe=SVP) level of theory.101–103 5 of the HAT reactions involve compounds with elements outside of the domain of the training data of our surrogate model and hence were discarded in our analysis. The models trained on the resulting extremely small dataset were subsequently applied to predict activation energies for 6 additional computed HAT reaction profiles for unseen substrates.
As a third application, we focus on HAT reactions encountered in atmospheric chemistry. To this end, around 300 HAT reactions were extracted from RMechDB. RMechDB is a database consisting of elementary radical reactions recently assembled by Tavakoli et al.45 In its current form, the dataset is dominated by gas-phase reactions of isoprene and other organic molecules. No labels, i.e., computed or predicted activation energies, are available for the reactions in this database, and hence we computed reaction profiles ourselves with the same high-throughput workflow used to generate the previously discussed in-house HAT dataset.
A summary with the main information of every dataset can be found in the Table 2.
4 Results and discussion
4.1 Performance of the surrogate model
In Fig. 3, the performance of the trained surrogate model on the held-out test set, i.e., the radicals and closed-shell molecules present in the BDE-db dataset, is presented. For (relaxed) BDFEs, atomic charges, spin densities, and buried volumes, excellent correlations between predicted and computed values are obtained (R2 ≥ 0.97); for frozen BDEs, the correlation is slightly worse (R2 = 0.89), but the quantitative trends are still largely retained. | ||
| Fig. 3 Correlation between the computed QM descriptors and those predicted by the surrogate model. Note that color brightness is inversely proportional to the density of the points here, i.e., dark patches correspond to a high point density and vice versa. | ||
4.2 Predicting activation energies for our in-house generated dataset
With a performant surrogate model at our disposal, we turned to the in-house generated HAT dataset. In Fig. 4, the distribution of the computed activation and reaction energies, as well as the correlation between both quantities, is presented. Remarkably, activation and reaction energies only correlate moderately (R2 = 0.71), indicating that the Bell–Evans–Polanyi principle104,105 on its own is not sufficient to fully explain the trends in the activation energies, and that building a predictive model including multiple descriptors is warranted for this dataset.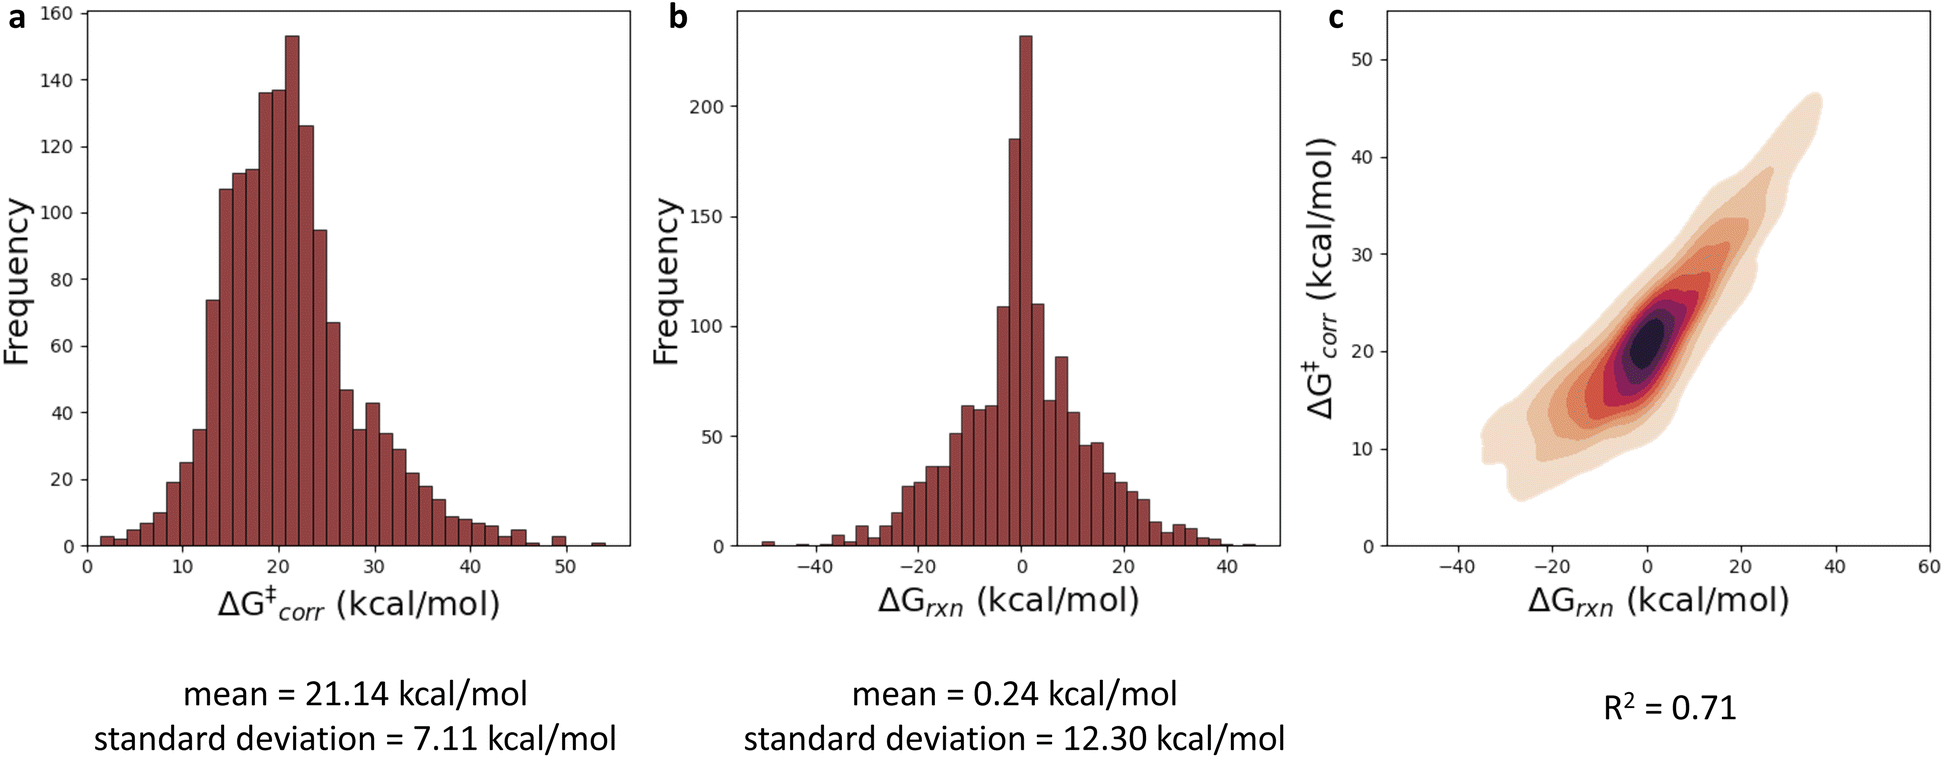 | ||
| Fig. 4 (a) Histogram presenting the distribution of the computed activation energies with tunneling corrections included (ΔG‡corr). (b) Histogram representing the distribution of the computed reaction energies (ΔGrxn). (c) Correlation plot between ΔG‡corr and ΔGrxn. | ||
Various baseline models, not making use of the informative representation predicted by our surrogate GNN, were considered as baselines. Due to the relatively small size and inherent diversity present in the constructed HAT dataset, all of these model architectures perform remarkably poorly. RF, KNN and XGBoost models taking structural fingerprints, i.e., differential reaction fingerprints (DRFP), as input, reach a mean absolute error (MAE) of 5.2–5.3 kcal mol−1 (corresponding to R2 around 0) in 10-fold cross-validation. This is barely any better than the standard deviation (7 kcal mol−1), i.e., the hypothetical accuracy that would be obtained for a model that always predicts the mean value for the dataset. The GNN architectures tested – a Weisfeiler–Lehmann (WL) one and Chemprop – perform somewhat better, but the MAE still amounts to ∼2.9–3.5 kcal mol−1 (R2 ∼ 0.65). The geometry-based kernel ridge regression model, based on the recently introduced bond-based reaction representation (B2R2l) reaches a similar performance (MAE = 3.55 kcal mol−1).106
The results quoted above are in great contrast to the results obtained when the predicted informative representation is used as the input for the reactivity model. Now, the MAEs amount to 1.9–2.3 kcal mol−1 (cf.Table 1) and the corresponding R2 scores amount to 0.80–0.85. There is still some non-linearity present in the relationship between the representation used and the activation energies but only to a limited extent: our best non-linear model architecture, the FFNN model, outperforms a multivariate linear regression model by only 0.30 and 0.36 kcal mol−1, in terms of MAE and RMSE, respectively (ensembling 4 FFNNs, the error can be reduced further by 0.02 and 0.03 kcal mol−1 respectively). In line with this observation, we also observe that fairly few data points are needed to reach this accuracy; already with 800 training points, the final accuracy is approached within 0.1 kcal mol−1 for most of the machine learning model architectures (Fig. 5). Reducing the training set size, the multivariate linear model takes over as the most accurate model when fewer than 400 training points are considered.
| Model architecture | MAE (kcal mol−1) | RMSE (kcal mol−1) |
|---|---|---|
| RF (fingerprint input) | 5.25 | 6.96 |
| XGBoost (fingerprint input) | 5.32 | 7.03 |
| Chemprop (CGR representation) | 2.94 | 4.15 |
| KRR (B2R2l representation) | 3.55 | 4.71 |
| Linear model (descriptor input) | 2.28 | 3.14 |
| RF (descriptor input) | 2.10 | 3.01 |
| XGBoost (descriptor input) | 2.24 | 3.13 |
| FFNN (descriptor input) | 1.98 | 2.78 |
| Δ-ML (descriptor input) | 1.97 | 2.76 |
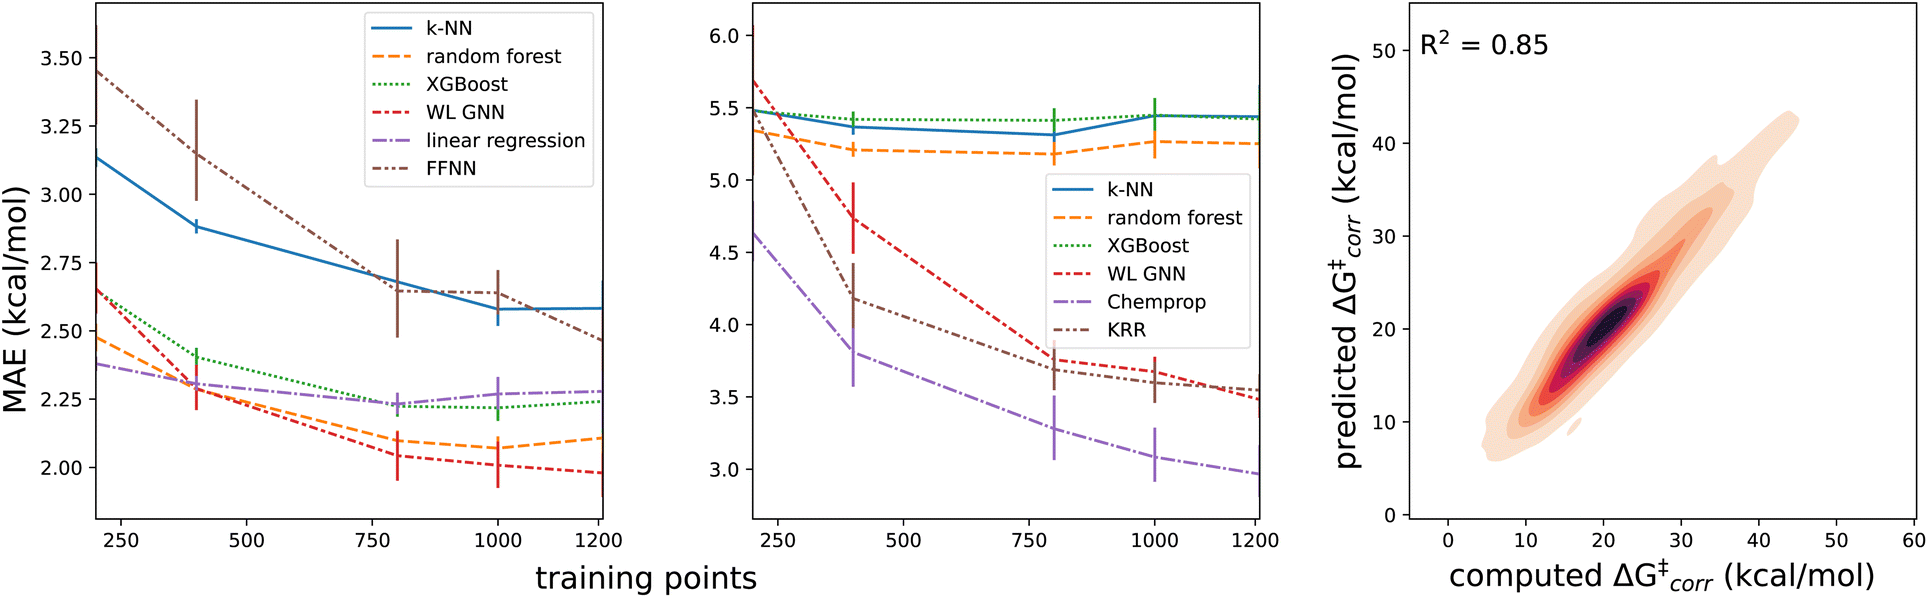 | ||
| Fig. 5 Learning curves for the ΔG‡corr for several models based in (a) an intermediate VB learned representation and (b) the differential reaction fingerprints (error bars were determined from the results for the individual folds in the cross-validation). (c) Correlation plot between the computed and predicted activation energies with tunneling corrections ΔG‡corr for the (in-sample) test sets considered during 10-fold cross-validation for the FFNN model with 4 ensembles. Note that color brightness is inversely proportional to the density of the points here, i.e., dark patches correspond to a high point density and vice versa. | ||
As discussed in Section S3.3 of the ESI,† Δ-ML models perfectly adhere to the trends established above. Because of the introduced thermodynamic-kinetic coupling, these models exhibit a better baseline, but we observe again that the accuracy improves significantly when switching from a fingerprint-based input to our surrogate-based informative representation (the MAE reduces from 2.84 to 1.97 kcal mol−1). Since the best Δ-ML does not outperform our regular FFNN, we decided to focus on the non-delta learning models in the remainder of this work.
In Fig. 6a, a schematic overview of the impact of the individual descriptors of the (predicted) informative representation on the accuracy of the multivariate linear model is provided. Our analysis indicates that each descriptor has at least some predictive power, i.e., they all correlate to some extent with the activation energies, so that the prediction accuracy for the corresponding univariate linear regression models exceeds the standard deviation across the dataset by a non-negligible margin. As could have been expected from the Bell–Evans–Polanyi analysis in Fig. 4, the (relaxed) BDFE values correlate extremely well; a linear regression model based exclusively on this (predicted) descriptor reaches an MAE of 2.84 kcal mol−1, which is not dramatically worse than the multivariate model based on all (predicted) descriptors. The descriptor that is most complementary to the BDFE, i.e., the descriptor whose inclusion in the linear model reduces the prediction errors the most, is the atomic charge (q), closely followed by the frozen bond dissociation energy (BDEfr). On their own, the spin density (ρ) values on the radical centers of reactants and products, also have significant predictive power, but they do not improve the model accuracy when the BDFE is already considered as an input descriptor. Note that this is in line with the point of view discussed above that changes in delocalization are fully encoded in the thermodynamic driving force: the information encoded in the spin densities overlaps with the information gained from consideration of the BDFE values.73 Remarkably, and in contrast to the results obtained for the smaller subsets of chemical space considered as part of the applications (vide infra), the inclusion of Vbur does not improve the prediction accuracy on this dataset.
 | ||
| Fig. 6 Performance on ΔG‡, in terms of mean absolute error (MAE), for multivariate linear models based on a subset of the descriptors. (a) Trained on our in-house HAT dataset. (b) Trained on the 238 reactions involving alkoxy radicals abstracting hydrogens. | ||
4.3 Applications
In this final section, we will showcase the usefulness of our approach by considering a set of applications. Particularly, we will exploit the data efficiency of models based on our VB-inspired representation to learn activation energies across some extremely small HAT datasets found in the literature (vide supra).As indicated above, the first application area focuses on HAT predictions related to chemical synthesis. More specifically, we started by considering a HAT dataset involving alkoxy radicals and hydrocarbons/heterosubstituted compounds (cf. “alkoxy dataset” entry in Table 2).79 In previous work, an empirical model based on five computed parameters, respectively describing the electronegativities and delocalization of the reactants and products, as well as the thermodynamic driving force, was proposed.59 Applying this empirical model to the full dataset, an MAE 0.85 kcal mol−1 (R2 = 0.84) is obtained on the training set, and 1.24 kcal mol−1 (R2 = 0.72) on the test set.
| Dataset | Samples | μ (σ) (kcal mol−1) | MAE (RMSE) (kcal mol−1) |
|---|---|---|---|
| In-house dataset | 1511 | 21.14 (7.11) | 1.95 (2.75) |
| Alkoxy dataset79 | 238 | 12.49 (2.78) | 1.11 (1.32) |
| Exp. alkoxy57 | 15 | 14.53 (2.16) | 0.97 (1.27) |
| Photoredox HAT60 | 564 | 16.39 (4.87) | 0.94 (1.42) |
| Exp. cumyloxyl62 | 45 | 12.82 (1.49) | 1.04 (1.26) |
| Cytochrome P450 (ref. 53) | 19 | 12.91 (1.65) | 0.94 (1.01) |
| Atmospheric HAT45 | 73 | 9.10 (5.29) | 1.20 (1.57) |
With the help of our on-the-fly predicted VB-inspired representation, MAEs of 1.02 kcal mol−1 (R2 = 0.76) and 1.25 kcal mol−1 (R2 = 0.66) are reached, respectively on the training and test set, with a simple multivariate linear model. Even though our linear regression model does not outperform the tailored, empirical expression by Liu et al.59 here, it is important to note that our predictions can be performed on a millisecond scale, whereas the computed descriptor inputs needed in the empirical model require geometry generation and a succession of tedious DFT calculations.
We also considered the performance of non-linear model architectures on this small dataset. Training a FFNN from scratch results in an MAE on the test set of 1.66 kcal mol−1 (R2 = 0.45). Taking a transfer learning approach, i.e., using the parameters from the FFNN model trained on the more extensive and diverse in-house HAT dataset to initialize the network, an MAE of 1.22 kcal mol−1 (R2 = 0.68) is reached on the test set; already marginally better than the linear model. Remarkably, an RF model based on the predicted representation now actually outperforms all other model architectures, with an MAE of 1.11 kcal mol−1 (R2 = 0.78).
Another remarkable observation is that the predictive power of the respective descriptors in our VB-inspired representation has changed significantly upon switching from the in-house HAT dataset, discussed in the previous section, to the current one (Fig. 6; cf. Section S5.2 in the ESI†). As mentioned before, in the diverse dataset constructed as part of this study, the inclusion of the predicted BDFEs reduced the MAE of the linear model the most, and the inclusion of Vbur had no observable effect on the model accuracy. In the small alkoxy radical dataset, however, BDFE values are not nearly as predictive. Atomic charges improve the model accuracy the most now, and the inclusion of Vbur leads to significant further improvements. These differences can be connected to the more pronounced polar effects in alkoxy radicals, due to the involvement of a more electronegative radical center.65,107–109 In more general terms, these findings about descriptor importance underscore that local correlations in small subsections of chemical space are not necessarily transferable and that caution is needed when aiming to draw universal conclusions about reactivity trends based purely on empirical trends.
Next, we attempted to predict the experimentally reported HAT selectivities reported by Zuo et al.,57 which were subsequently computationally recovered through DFT calculations by Ma and co-workers (cf. “Exp. alkoxy” entry in Table 2).79 In Fig. 7, the performances of the various model architectures are presented. For all models, the predictions are in qualitative agreement with the experimentally observed regioselectivity the majority of the time, with the RF and FFNN models each reaching 5 out of 6 correct predictions. Also quantitatively, our models reach good accuracy as compared to the computed DFT barriers in this application. The most accurate model is the FFNN (MAE = 0.97 kcal mol−1, RMSE = 1.27 kcal mol−1, R2 = 0.63).
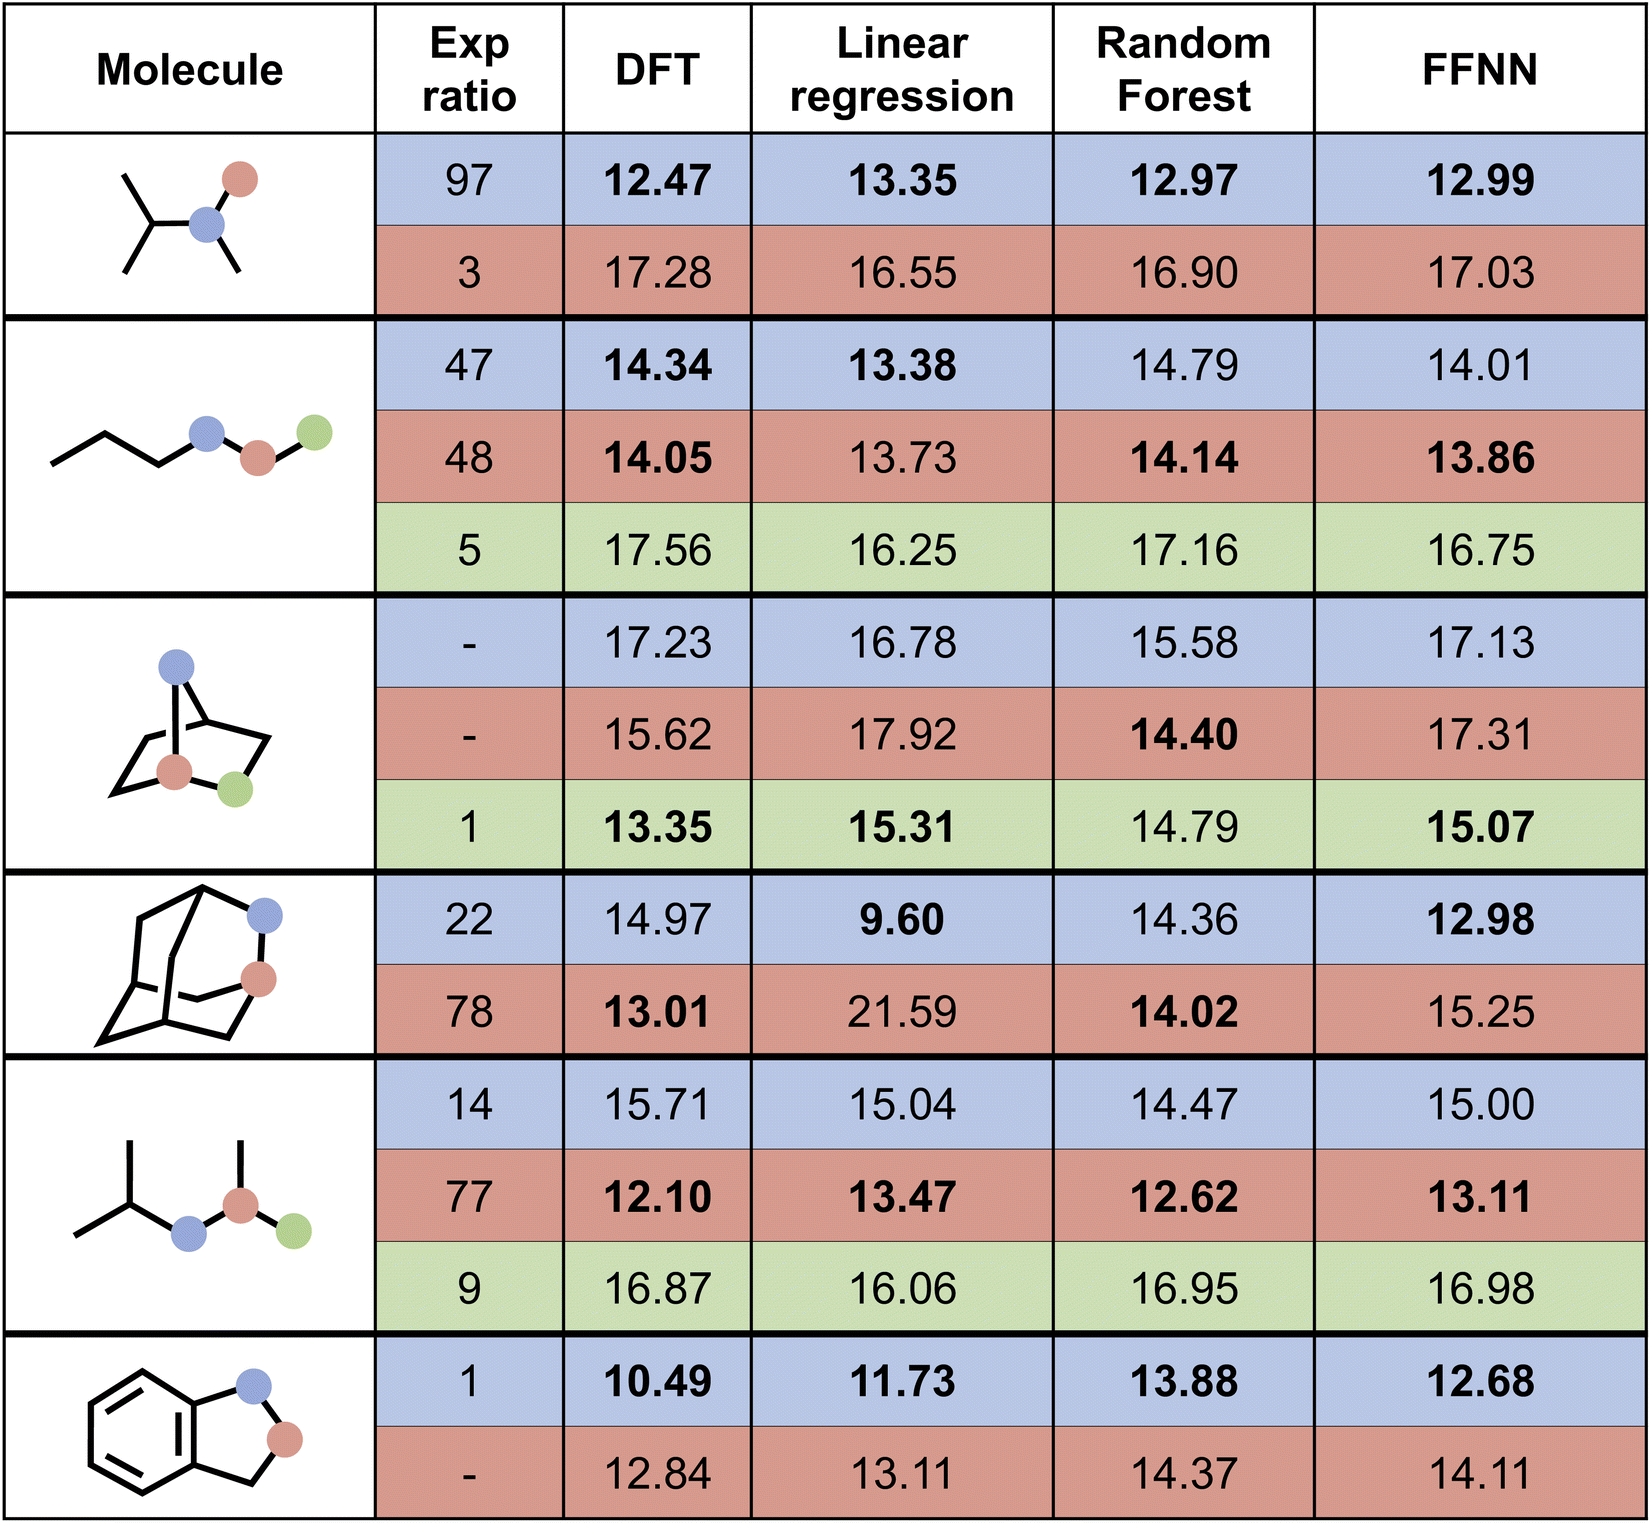 | ||
| Fig. 7 Prediction of selectivity and ΔG‡ for the compounds experimentally considered by Zuo et al.57 for the various model architectures trained on the alkoxy radical dataset. Bold values represent the major regioisomer. | ||
Subsequently, we focus on the dataset of photoredox C–H bond functionalization reactions generated by Yang et al. (cf. “photoredox HAT” entry in 2).60 On the full dataset of 500+ reactions, our approach results in excellent accuracy, regardless of the secondary reactivity model architecture (for the FFNN, an MAE of 1.06 kcal mol−1 and R2 of 0.90 is reached in 5-fold cross-validation, and for the RF, an MAE of 0.94 kcal mol−1 and R2 of 0.91 is obtained). It should be noted that with a heavily fine-tuned input representation of over 50 explicitly computed QM descriptors in combination with AdaBoost, Yang et al.60 achieved an even higher accuracy in the original work on this dataset (MAE = 0.64 kcal mol−1 and R2 = 0.96 in 5-fold cross-validation). Reducing the training set size to 25–50 data points causes this advantage compared to our models to vanish (see Section S6 in the ESI†), underscoring the merit of our approach in the extremely low data regime.
To end this first application area, we considered the experimental dataset of 45 HAT activation energies, assembled by Bietti and co-workers62 (cf. “Exp. cumyloxyl” entry in Table 2). Our models, trained on the photoredox dataset specified above, predict the (rescaled) activation energies in this experimental set with good accuracy (∼1 kcal mol; cf. Section S5.3 of the ESI†), correctly identifying all of the reaction barriers to be low. However, the coefficients of determination, i.e., the extent to which fine-grained trends across these 45 reactions are recovered, are essentially zero. The main reason for this failure to recover the reactivity trends is the distinct data distribution, i.e., the activation energies in this specific experimental dataset are “outliers” with respect to the reactions present in Ma et al.‘s79 dataset, and – to a lesser extent – the fairly low spread in the targets (the standard deviation amounts to only 1.5 kcal mol−1). This conjecture can be confirmed by retraining our models on the 45 data points by Bietti et al.: in 10-fold cross-validation (i.e., when only 36 in-distribution training points are considered), a significantly better R2 = 0.44 is now reached for our best model, the ensembled FFNN with transfer learning.
The second application area focuses on P450 metabolism of medicinally relevant compounds (cf. “Cytochrome P450” entry in Table 2). As discussed in the Methodology section, predictive models were trained on a tiny dataset of 19 HAT activation energies, and subsequently, these models were applied to predict 6 barriers for unseen substrates, in line with the work by Gingrich et al.53 We again started with a multivariate linear regression model, but we considered only (a subset of) the descriptors of the hydrocarbons to reduce collinearity and avoid overfitting (Section S6†). With the trained model, based only on the predicted spin density and buried volume, an MAE of 1.12 kcal mol−1 is obtained for the unseen substrates, in line with the accuracy reached by the predictive model proposed by Gingrich et al. (1.15 kcal mol−1).53 Adding more descriptors, the MAE of the model increases (Section S7†).
Subsequently, we also considered our FFNN architecture. Trained from scratch on the same subset of descriptors with two neurons, the model reaches an MAE of 1.04 kcal mol−1. With 4 ensembles, the model reaches an MAE of 0.94 kcal mol−1.
For the final application, we considered the HAT reactions found in RMechDB (Section S8 of the ESI†). In total, we were able to extract 268 reactions, falling within the scope of our surrogate model, from this database; primarily HAT reactions between organic compounds and HO˙ and HOO˙ radicals, i.e., the onset of atmospheric oxidation. With our autodE-based workflow for reaction profile computation, we only managed to successfully compute profiles for 73 of these reactions (failure sources are detailed in Section S8;† see also “atmospheric HAT” entry in Table 2).
At first, we tried to directly reproduce the computed activation energies with the predictive models trained on our in-house assembled HAT dataset, but even our best model (ensembled FFNN) reached an inadequate MAE of 4.58 kcal mol−1 (RMSE = 5.11 kcal mol−1, R2 = 0.05). A reasonable explanation for this poor performance is (once again) the distribution of the data: our in-house generated dataset contained no examples involving HO˙ or HOO˙ radicals, and the activation energies for the reactions extracted from RMechDB (mean ΔG‡corr = 9.10 kcal mol−1) tend to be at the lower edge of the activation energy distribution of our training data (cf.Fig. 4). Once more, upon re-training on the 73 computed RMechDB reaction profiles, an outstanding accuracy is recovered; in 10-fold cross-validation, our ensembled FFNN with transfer learning now reaches R2 = 0.88 (MAE = 1.29 kcal mol−1, RMSE = 1.51 kcal mol−1); our multivariate linear model reaches R2 = 0.88 as well (MAE = 1.20 kcal mol−1, RMSE = 1.57 kcal mol−1). With both of these fine-tuned models, we made predictions for the remaining reactions extracted from the database (cf.https://github.com/chimie-paristech-CTM/energy_predictor_HAT/tree/master/reactivity_model/RMechDB_pred).
The observations for this last application are yet another illustration that setting up a machine learning model for chemical reactivity, able to generalize across application domains, is hard and data-intensive, but that introducing QM-based descriptors in the model architecture – particularly in combination with transfer learning – can remedy this situation to a large extent.
5 Conclusions
The poor data-efficiency of generic machine learning models poses a major challenge to their application in chemical reactivity studies, since for most specialized predictive tasks in this domain, only limited training data is available. In this work, we have explored a strategy to make machine learning workflows for reactivity prediction significantly less data-hungry, by making use of an intermediate informative reaction representation. This informative representation was constructed based on a VB analysis for generic HAT reactions. A surrogate model, able to predict (most of) the identified quantum chemical informative descriptors was subsequently built based on a repurposed, publicly available dataset of descriptors and geometries of organic radicals. Combining the surrogate model with a secondary reactivity model, we achieved unequivocally superior performance on a medium-sized, in-house generated, dataset of DFT computed reaction profiles of diverse HAT reactions, compared to any other machine learning approach we tried. Because of the extreme data efficiency of our descriptor-augmented models, we were able to demonstrate that they can be fine-tuned and applied to small datasets across various reaction conditions, settings, and application domains, ranging from regular (liquid phase) synthesis, over metabolism and drug design, to atmospheric chemistry.The presented modular approach towards reactivity prediction has the potential to significantly expand the scope of machine learning workflows for focused reactivity predictions, as long as the reactivity type is qualitatively understood and can be modeled accurately, and high-quality descriptor datasets are available for surrogate model training. In this context, it is crucial to emphasize the necessity for careful curation of these property datasets, ensuring that the chosen descriptors are pertinent, i.e., relevant, to a diverse array of reaction types.
Data availability
The code used to generate/curate the different datasets as well as to generate the baseline modes can be found at https://github.com/chimie-paristech-CTM/bde_hat. The code associated with the final reactivity model, i.e., the surrogate model in combination with an FFNN, can be found at https://github.com/chimie-paristech-CTM/energy_predictor_HAT, a script to generate the main results reported in this paper can also be found there. The (generated/curated) datasets can be downloaded at https://figshare.com/projects/Hydrogen_atom_transfer_reactions/188007 and https://figshare.com/articles/dataset/dataset_surrogate_model_cs/24754341 respectively.Author contributions
JEAR: data curation, software, methodology, formal analysis, visualization, writing. RMN: software, methodology, writing (review), visualization. TS: conceptualization, methodology, formal analysis, writing, supervision, funding acquisition.Conflicts of interest
There are no conflicts to declare.Acknowledgements
JEAR and TS acknowledge the French National Agency for Research (ANR) for a CPJ grant (ANR-22-CPJ1-0093-01). This work was granted access to the HPC resources of IDRIS under the allocation 2023-100732 granted by GENCI. RMN thanks the Zeno Karl Schindler Foundation for their generous financial support, and Connor Coley and Gisbert Schneider for their guidance during her Master's thesis work.Notes and references
- C. W. Coley, R. Barzilay, T. S. Jaakkola, W. H. Green and K. F. Jensen, ACS Cent. Sci., 2017, 3, 434–443 CrossRef CAS PubMed.
- C. W. Coley, W. Jin, L. Rogers, T. F. Jamison, T. S. Jaakkola, W. H. Green, R. Barzilay and K. F. Jensen, Chem. Sci., 2019, 10, 370–377 RSC.
- P. Schwaller, T. Laino, T. Gaudin, P. Bolgar, C. A. Hunter, C. Bekas and A. A. Lee, ACS Cent. Sci., 2019, 5, 1572–1583 CrossRef CAS PubMed.
- C. W. Coley, L. Rogers, W. H. Green and K. F. Jensen, ACS Cent. Sci., 2017, 3, 1237–1245 CrossRef CAS PubMed.
- Y. Wang, C. Pang, Y. Wang, J. Jin, J. Zhang, X. Zeng, R. Su, Q. Zou and L. Wei, Nat. Commun., 2023, 14, 6155 CrossRef CAS PubMed.
- L. Fang, J. Li, M. Zhao, L. Tan and J.-G. Lou, Nat. Commun., 2023, 14, 2446 CrossRef CAS PubMed.
- A. Tripp, K. Maziarz, S. Lewis, M. Segler and J. M. Hernandez-Lobato, Retro-fallback: retrosynthetic planning in an uncertain world, 2023 Search PubMed.
- D. Weininger, J. Chem. Inf. Comput. Sci., 1988, 28, 31–36 CrossRef CAS.
- M. S. Sigman, K. C. Harper, E. N. Bess and A. Milo, Acc. Chem. Res., 2016, 49, 1292–1301 CrossRef CAS PubMed.
- A. F. Zahrt, J. J. Henle, B. T. Rose, Y. Wang, W. T. Darrow and S. E. Denmark, Science, 2019, 363, eaau5631 CrossRef CAS PubMed.
- D. T. Ahneman, J. G. Estrada, S. Lin, S. D. Dreher and A. G. Doyle, Science, 2018, 360, 186–190 CrossRef CAS PubMed.
- W. Beker, E. P. Gajewska, T. Badowski and B. A. Grzybowski, Angew. Chem., Int. Ed., 2019, 58, 4515–4519 CrossRef CAS PubMed.
- K. Jorner, T. Brinck, P.-O. Norrby and D. Buttar, Chem. Sci., 2021, 12, 1163–1175 RSC.
- X. Li, S.-Q. Zhang, L.-C. Xu and X. Hong, Angew. Chem., Int. Ed., 2020, 59, 13253–13259 CrossRef CAS PubMed.
- D. F. Nippa, K. Atz, R. Hohler, A. T. Müller, A. Marx, C. Bartelmus, G. Wuitschik, I. Marzuoli, V. Jost, J. Wolfard, et al., Enabling late-stage drug diversification by high-throughput experimentation with geometric deep learning, 2022 Search PubMed.
- K. Low, M. L. Coote and E. I. Izgorodina, J. Chem. Theory Comput., 2023, 19, 1466–1475 CrossRef CAS PubMed.
- K. Low, M. L. Coote and E. I. Izgorodina, J. Chem. Theory Comput., 2022, 18, 1607–1618 CrossRef CAS PubMed.
- K. Low, R. Kobayashi and E. I. Izgorodina, J. Chem. Phys., 2020, 153, 104101 CrossRef CAS PubMed.
- J. G. Estrada, D. T. Ahneman, R. P. Sheridan, S. D. Dreher and A. G. Doyle, Science, 2018, 362, eaat8763 CrossRef PubMed.
- K. Yang, K. Swanson, W. Jin, C. Coley, P. Eiden, H. Gao, A. Guzman-Perez, T. Hopper, B. Kelley and M. Mathea, et al. , J. Chem. Inf. Model., 2019, 59, 3370–3388 CrossRef CAS PubMed.
- Z. Liu, L. Lin, Q. Jia, Z. Cheng, Y. Jiang, Y. Guo and J. Ma, J. Chem. Inf. Model., 2021, 61, 1066–1082 CrossRef CAS PubMed.
- R. Zubatyuk, J. S. Smith, J. Leszczynski and O. Isayev, Sci. Adv., 2019, 5, eaav6490 CrossRef CAS PubMed.
- K. T. Schütt, H. E. Sauceda, P.-J. Kindermans, A. Tkatchenko and K.-R. Müller, J. Chem. Phys., 2018, 148, 241722 CrossRef PubMed.
- Y. Guan, C. W. Coley, H. Wu, D. Ranasinghe, E. Heid, T. J. Struble, L. Pattanaik, W. H. Green and K. F. Jensen, Chem. Sci., 2021, 12, 2198–2208 RSC.
- W. Jin, C. Coley, R. Barzilay and T. Jaakkola, Adv. Neural. Inf. Process. Syst., 2017, 30, 2607–2616 Search PubMed.
- G. F. von Rudorff, S. N. Heinen, M. Bragato and O. A. von Lilienfeld, Mach. Learn.: Sci. Technol., 2020, 1, 045026 Search PubMed.
- S. Heinen, G. F. von Rudorff and O. A. von Lilienfeld, J. Chem. Phys., 2021, 155, 064105 CrossRef CAS PubMed.
- T. Stuyver and C. W. Coley, J. Chem. Phys., 2022, 156, 084104 CrossRef CAS PubMed.
- M. A. Lim, S. Yang, H. Mai and A. C. Cheng, J. Chem. Inf. Model., 2022, 62, 6336–6341 CrossRef CAS PubMed.
- A. Gaulton, L. J. Bellis, A. P. Bento, J. Chambers, M. Davies, A. Hersey, Y. Light, S. McGlinchey, D. Michalovich and B. Al-Lazikani, et al. , Nucleic Acid Res., 2012, 40, D1100–D1107 CrossRef CAS PubMed.
- Pistachio (NextMove Software), https://www.nextmovesoftware.com/pistachio.html Search PubMed.
- R. Ramakrishnan, P. O. Dral, M. Rupp and O. A. Von Lilienfeld, Sci. Data, 2014, 1, 1–7 Search PubMed.
- M. Nakata and T. Shimazaki, J. Chem. Inf. Model., 2017, 57, 1300–1308 CrossRef CAS PubMed.
- M. Nakata, T. Shimazaki, M. Hashimoto and T. Maeda, J. Chem. Inf. Model., 2020, 60, 5891–5899 CrossRef CAS PubMed.
- A. Stuke, C. Kunkel, D. Golze, M. Todorović, J. T. Margraf, K. Reuter, P. Rinke and H. Oberhofer, Sci. Data, 2020, 7, 58 CrossRef CAS PubMed.
- P. C. St. John, Y. Guan, Y. Kim, B. D. Etz, S. Kim and R. S. Paton, Sci. Data, 2020, 7, 244 CrossRef CAS PubMed.
- C. Isert, K. Atz, J. Jiménez-Luna and G. Schneider, Sci. Data, 2022, 9, 1–11 CrossRef PubMed.
- R. M. Neeser, C. Isert, T. Stuyver, G. Schneider and C. W. Coley, Chem. Data Collect., 2023, 46, 101040 CrossRef CAS.
- K. Schütt, P.-J. Kindermans, H. E. Sauceda Felix, S. Chmiela, A. Tkatchenko and K.-R. Müller, Adv. Neural. Inf. Process. Syst., 2017, 30, 991–1001 Search PubMed.
- J. Gasteiger, S. Giri, J. T. Margraf and S. Günnemann, Fast and uncertainty-aware directional message passing for non-equilibrium molecules, 2020 Search PubMed.
- G. A. Pinheiro, J. Mucelini, M. D. Soares, R. C. Prati, J. L. Da Silva and M. G. Quiles, J. Phys. Chem. A, 2020, 124, 9854–9866 CrossRef CAS PubMed.
- N. De Cao and T. Kipf, MolGAN: An implicit generative model for small molecular graphs, 2018 Search PubMed.
- Y. Bian and X.-Q. Xie, J. Mol. Model., 2021, 27, 1–18 CrossRef PubMed.
- J. Westermayr, J. Gilkes, R. Barrett and R. J. Maurer, Nat. Comput. Sci., 2023, 3, 139–148 CrossRef CAS PubMed.
- M. Tavakoli, Y. T. T. Chiu, P. Baldi, A. M. Carlton and D. Van Vranken, J. Chem. Inf. Model., 2023, 63, 1114–1123 CrossRef CAS PubMed.
- Y. Zhang, J. Yu, H. Song and M. Yang, Structure-Based Reaction Descriptors for Predicting Rate Constants by Machine Learning: Application to Hydrogen Abstraction from Alkanes by CH3/H/O Radicals, 2023 Search PubMed.
- J. Yu, D. Shan, H. Song and M. Yang, Fuel, 2022, 322, 124150 CrossRef CAS.
- W. Nie, C. Yan, L. Yang, P. Roldin, Y. Liu, A. L. Vogel, U. Molteni, D. Stolzenburg, H. Finkenzeller and A. Amorim, et al. , Nat. Commun., 2023, 14, 3347 CrossRef CAS PubMed.
- L. De Keer, P. Van Steenberge, M.-F. Reyniers, G. Gryn'Ova, H. M. Aitken and M. L. Coote, Polym. Chem., 2022, 13, 3304–3314 RSC.
- G. Gryn'ova, J. L. Hodgson and M. L. Coote, Org. Biomol. Chem., 2011, 9, 480–490 RSC.
- A. Grinberg Dana, H. Wu, D. S. Ranasinghe, F. C. Pickard IV, G. P. Wood, T. Zelesky, G. W. Sluggett, J. Mustakis and W. H. Green, Mol. Pharmaceutics, 2021, 18, 3037–3049 CrossRef CAS PubMed.
- H. Wu, A. Grinberg Dana, D. S. Ranasinghe, F. C. Pickard IV, G. P. Wood, T. Zelesky, G. W. Sluggett, J. Mustakis and W. H. Green, Mol. Pharmaceutics, 2022, 19, 1526–1539 CrossRef CAS PubMed.
- P. W. Gingrich, J. B. Siegel and D. J. Tantillo, Chem.: Methods, 2022, 2, e202100108 CAS.
- H. Matsubara, T. Kawamoto, T. Fukuyama and I. Ryu, Acc. Chem. Res., 2018, 51, 2023–2035 CrossRef CAS PubMed.
- S. Sarkar, K. P. S. Cheung and V. Gevorgyan, Chem. Sci., 2020, 11, 12974–12993 RSC.
- L. Capaldo and D. Ravelli, Eur. J. Org Chem., 2017, 2017, 2056–2071 CrossRef CAS PubMed.
- Q. An, Z. Wang, Y. Chen, X. Wang, K. Zhang, H. Pan, W. Liu and Z. Zuo, J. Am. Chem. Soc., 2020, 142, 6216–6226 CrossRef CAS PubMed.
- Q. An, Y.-Y. Xing, R. Pu, M. Jia, Y. Chen, A. Hu, S.-Q. Zhang, N. Yu, J. Du, Y. Zhang, J. Chen, W. Liu, X. Hong and Z. Zuo, J. Am. Chem. Soc., 2023, 145, 359–376 CrossRef CAS PubMed.
- F. Liu, S. Ma, Z. Lu, A. Nangia, M. Duan, Y. Yu, G. Xu, Y. Mei, M. Bietti and K. Houk, J. Am. Chem. Soc., 2022, 144, 6802–6812 CrossRef CAS PubMed.
- L.-C. Yang, X. Li, S.-Q. Zhang and X. Hong, Org. Chem. Front., 2021, 8, 6187–6195 RSC.
- Y. Sun, F. Liu, J. N. Sanders and K. Houk, J. Org. Chem., 2023, 88, 12668–12676 CrossRef CAS PubMed.
- M. Salamone, M. Galeotti, E. Romero-Montalvo, J. A. van Santen, B. D. Groff, J. M. Mayer, G. A. DiLabio and M. Bietti, J. Am. Chem. Soc., 2021, 143, 11759–11776 CrossRef CAS PubMed.
- M. Finn, R. Friedline, N. K. Suleman, C. J. Wohl and J. M. Tanko, J. Am. Chem. Soc., 2004, 126, 7578–7584 CrossRef CAS PubMed.
- K. R. Korzekwa, J. P. Jones and J. R. Gillette, J. Am. Chem. Soc., 1990, 112, 7042–7046 CrossRef CAS.
- B. D. Groff, B. Koronkiewicz and J. M. Mayer, J. Org. Chem., 2023,(88), 16259–16269 CrossRef CAS PubMed.
- J. Han, Y. Kwon, Y.-S. Choi and S. Kang, J. Cheminf., 2024, 16, 25 Search PubMed.
- S. Shaik and A. Shurki, Angew. Chem., Int. Ed., 1999, 38, 586–625 CrossRef PubMed.
- S. S. Shaik and P. C. Hiberty, A chemist's guide to valence bond theory, John Wiley & Sons, 2007 Search PubMed.
- S. Shaik, D. Kumar and S. P. De Visser, J. Am. Chem. Soc., 2008, 130, 10128–10140 CrossRef CAS PubMed.
- W. Lai, C. Li, H. Chen and S. Shaik, Angew. Chem., Int. Ed., 2012, 51, 5556–5578 CrossRef CAS PubMed.
- L. Song, W. Wu, P. C. Hiberty and S. Shaik, Chem.–Eur. J., 2006, 12, 7458–7466 CrossRef CAS PubMed.
- G. N. Sastry and S. Shaik, J. Am. Chem. Soc., 1998, 120, 2131–2145 CrossRef CAS.
- T. Stuyver, F. De Proft, P. Geerlings and S. Shaik, J. Am. Chem. Soc., 2020, 142, 10102–10113 CrossRef CAS PubMed.
- T. Stuyver, D. Danovich, F. De Proft and S. Shaik, J. Am. Chem. Soc., 2019, 141, 9719–9730 CrossRef CAS PubMed.
- J. Joy, T. Stuyver and S. Shaik, J. Am. Chem. Soc., 2020, 142, 3836–3850 CrossRef CAS PubMed.
- J. Li, S. Zhou, J. Zhang, M. Schlangen, T. Weiske, D. Usharani, S. Shaik and H. Schwarz, J. Am. Chem. Soc., 2016, 138, 7973–7981 CrossRef CAS PubMed.
- T. Stuyver and S. Shaik, J. Am. Chem. Soc., 2020, 142, 20002–20013 CrossRef CAS PubMed.
- L. C. Gallegos, G. Luchini, P. C. St. John, S. Kim and R. S. Paton, Acc. Chem. Res., 2021, 54, 827–836 CrossRef CAS PubMed.
- S. Ma, S. Wang, J. Cao and F. Liu, ACS Omega, 2022, 7, 34858–34867 CrossRef CAS PubMed.
- K. Jorner, Morfeus: Molecular features for machine learning, 2022, https://github.com/digital-chemistry-laboratory/morfeus Search PubMed.
- S. S. SV, P. C. S. John and R. S. Paton, Chem. Sci., 2021, 12, 13158–13166 RSC.
- S. S. S. Vejaykummar, Y. Kim, S. Kim, P. S. John and R. Paton, Expansion of Bond Dissociation Prediction with Machine Learning to Medicinally and Environmentally Relevant Chemical Space, 2023 Search PubMed.
- T. A. Young, J. J. Silcock, A. J. Sterling and F. Duarte, Angew. Chem., Int. Ed., 2021, 133, 4312–4320 CrossRef.
- M. Frisch, G. Trucks, H. Schlegel, G. Scuseria, M. Robb, J. Cheeseman, G. Scalmani, V. Barone, G. Petersson, H. Nakatsuji, et al., Gaussian 16, 2016 Search PubMed.
- T. Stuyver, K. Jorner and C. W. Coley, Sci. Data, 2023, 10, 66 CrossRef CAS PubMed.
- D. Probst, P. Schwaller and J.-L. Reymond, Digital Discovery, 2022, 1, 91–97 RSC.
- N. Casetti, J. E. Alfonso-Ramos, C. W. Coley and T. Stuyver, Chem.–Eur. J., 2023, e202301957 CrossRef CAS PubMed.
- Y. Zhao and D. G. Truhlar, Theor. Chem. Acc., 2008, 120, 215–241 Search PubMed.
- A. Schäfer, H. Horn and R. Ahlrichs, J. Chem. Phys., 1992, 97, 2571–2577 CrossRef.
- A. Schäfer, C. Huber and R. Ahlrichs, J. Chem. Phys., 1994, 100, 5829–5835 CrossRef.
- P. C. St. John, Y. Guan, Y. Kim, S. Kim and R. S. Paton, Nat. Commun., 2020, 11, 2328 CrossRef CAS PubMed.
- B. C. Garrett and D. G. Truhlar, J. Phys. Chem., 1979, 83, 2921–2926 CrossRef CAS.
- R. Ramakrishnan, P. O. Dral, M. Rupp and O. A. Von Lilienfeld, J. Chem. Theory Comput., 2015, 11, 2087–2096 CrossRef CAS PubMed.
- T. Bereau, R. A. DiStasio, A. Tkatchenko and O. A. Von Lilienfeld, J. Chem. Phys., 2018, 148, 241706 CrossRef PubMed.
- M. Bogojeski, L. Vogt-Maranto, M. E. Tuckerman, K.-R. Müller and K. Burke, Nat. Commun., 2020, 11, 5223 CrossRef CAS PubMed.
- J.-D. Chai and M. Head-Gordon, Phys. Chem. Chem. Phys., 2008, 10, 6615–6620 RSC.
- J.-D. Chai and M. Head-Gordon, J. Chem. Phys., 2008, 128, 084106 CrossRef PubMed.
- P. C. Hariharan and J. A. Pople, Theor. Chim. Acta, 1973, 28, 213–222 CrossRef CAS.
- M. M. Francl, W. J. Pietro, W. J. Hehre, J. S. Binkley, M. S. Gordon, D. J. DeFrees and J. A. Pople, J. Chem. Phys., 1982, 77, 3654–3665 CrossRef CAS.
- A. V. Marenich, C. J. Cramer and D. G. Truhlar, J. Phys. Chem. B, 2009, 113, 6378–6396 CrossRef CAS PubMed.
- A. D. Becke, Phys. Rev. A: At., Mol., Opt. Phys., 1988, 38, 3098 CrossRef CAS PubMed.
- C. Lee, W. Yang and R. G. Parr, Phys. Rev. B: Condens. Matter Mater. Phys., 1988, 37, 785 CrossRef CAS PubMed.
- P. J. Stephens, F. J. Devlin, C. F. Chabalowski and M. J. Frisch, J. Phys. Chem., 1994, 98, 11623–11627 CrossRef CAS.
- R. P. Bell, Proc. R. Soc. A, 1936, 154, 414–429 Search PubMed.
- M. Evans and M. Polanyi, Trans. Faraday Soc., 1936, 32, 1333–1360 RSC.
- P. van Gerwen, A. Fabrizio, M. D. Wodrich and C. Corminboeuf, Mach. Learn.: Sci. Technol., 2022, 3, 045005 Search PubMed.
- M. Salamone, F. Basili and M. Bietti, J. Org. Chem., 2015, 80, 3643–3650 CrossRef CAS PubMed.
- J. M. Tedder, Angew. Chem., Int. Ed., 1982, 21, 401–410 CrossRef.
- A. Ruffoni, R. C. Mykura, M. Bietti and D. Leonori, Nat. Synth., 2022, 1, 682–695 CrossRef.
Footnote |
| † Electronic supplementary information (ESI) available. See DOI: https://doi.org/10.1039/d4dd00043a |
| This journal is © The Royal Society of Chemistry 2024 |