Metal substrate engineering to modulate CO2 hydrogenation to methanol on inverse Zr3O6/CuPd catalysts†
Bin
Qin‡
a,
XiaoYing
Sun‡
a,
Jianzhuo
Lu
a,
Zhen
Zhao
 *ab and
Bo
Li
 *a
*a
aInstitute of Catalysis for Energy and Environment, College of Chemistry and Chemical Engineering, Shenyang Normal University, Shenyang 110034, China. E-mail: boli@synu.edu.cn; zhenzhao@cup.edu.cn
bState Key Laboratory of Heavy Oil Processing, China University of Petroleum, Beijing, 102249, China. E-mail: zhaozhen1586@163.com
First published on 10th September 2024
Abstract
It is well known that the performance of some key catalytic reactions has a strong dependence on metal catalyst surfaces. In the current work, this concept is further extended to the CuPd alloy-supported zirconium oxide inverse catalyst for CO2 hydrogenation to methanol. A combined DFT and microkinetic simulation study reveal that both the metal substrate surface and the precise exposed Cu or Pd metal atoms on the substrate have a pivotal influence on the catalytic mechanism and performance of the inverse catalyst for CO2 hydrogenation to methanol. Herein, CuPd(100), (111), and (110) surfaces with either Cu and Pd terminations have been examined, which provided five metal substrates as support for the inverse catalyst. Three different mechanisms, including the formate pathway, RWGS + CO-hydro pathway, and CO2 direct activation pathway, are explored under the same conditions; they take place at the interfacial sites between the metal alloy and oxide. The calculations indicated that the inverse catalyst with the CuPd(100) substrate demonstrates better performance than those with CuPd(110) and (111) for both formate and RWGS + CO-hydro mechanisms. Conversely, the reaction pathway is more sensitive to exposed atoms on the metal substrate. The best inverse catalyst, Zr3O6/CuPd(100) with either Cu or Pd terminations, demonstrated a methanol formation TOF above 0.30 site−1 s−1 and the selectivity was above 90% at 573 K, as evaluated from microkinetic simulation. The coverage analysis indicates the most populated species is HCOO*, which is consistent with experimental reports. Both kinetic and thermodynamics control steps are identified from DRC analysis for the best performing catalysts. Overall, the current study confirms the catalytic performance of the inverse Zr3O6/CuPd catalyst and demonstrates the tunable effects of the metal alloy substrate, which can facilitate effective optimization.
1. Inroduction
The combustion of fossil fuels over the past decades has led to the excessive emission of carbon dioxide. Consequently, the ever-increasing CO2 concentration in the atmosphere has resulted in severe adverse effects, including the greenhouse effect, rising sea levels and ocean acidification.1,2 A global consensus was attained to strictly control CO2 emissions before the occurrence of any irreversible environmental damage. The carbon capture and utilization (CCU) technology, converting CO2 to value-added chemicals through thermocatalytic, electrocatalytic3,4 and photocatalytic5,6 processes, is a very promising economical-viable strategy to reduce CO2 and maintain sustainable developments.7,8 However, it is well known that the CO2 molecule is extremely stable thermodynamically. Furthermore, CO2 activation is not a trivial task. Among various CO2 catalytic conversion routes, the hydrogenation of CO2 with the assistance of H2 can generate many valuable chemicals, including methane,9,10 formic acid,11–13 alkene,14 and methanol1,2,15–19 under mild conditions. Moreover, H2 can be produced from a green and renewable energy source. Among various products of CO2 hydrogenation, methanol stands out due to its distinctive benefits, including ease of transportation and storage, and high volumetric energy density.20 It has also been suggested that the so-called “methanol economy” could potentially change the energy supply landscape.20,21 Therefore, it is not surprising that extensive efforts have been devoted to developing an edge catalyst and technology for the catalytic carbon dioxide hydrogenation to methanol.Cu/ZnO/Al2O3 catalysts are industrially employed in methanol synthesis for syngas feeding due to their good activity and affordability, although their activity is greatly decreased with high CO2 concentrations.22 To address this issue, several strategies to improve the Cu-based catalysts for CO2 hydrogenation to methanol were investigated. The alloying of a second metal with Cu is one effective method to adjust the CO2 hydrogenation activity, and has been widely applied in methanol synthesis (e.g., CuPd,23,24 CuNi,25 CuZn,26 PdZn27,28). It should be noted that an appropriate chosen support for these metal alloy catalysts is vital for the catalytic performance. Among various oxide supports, ZrO2 is considered to be one of the best options, particularly for the Cu catalyst, because of its basicity, weak hydrophilicity, and increased methanol formation rates. In addition to playing a role as an inert support and spectator in the reaction, ZrO2 also actively participates in hydrogenation. It is generally accepted that the interface between ZrO2 and the metal is the active site for CO2 hydrogenation to methanol.29,30 As a further extension from the conventional metal/oxide architecture, Wu et al.31 developed a superior active inverse catalyst, in which Cu and ZrO2 switched their roles as the active material and support, respectively, and applied this inverse catalyst in the CO2 hydrogenation to methanol. Therefore, an inverse catalyst is an architecture that uses metal oxide as the active material and metal as the support. They found that the inverse catalyst delivered a methanol formation rate that was 3.3 times greater than that of the conventional counterpart at 220 °C. The spectacular activity increase is attributed to the fast hydrogenation of the key elementary steps of formate to methoxy, and methoxy to methanol, as observed from operando DRIFTS measurements. Moreover, the unique adsorption configuration of CO2, COO*–Cu, induced an adsorption-driven mechanism that is absent in the conventional metal/oxide catalyst. Senanayake et al.32 explored the relationship between the methanol formation rate and coverage of oxide on a metal support for the inverse CeOx/Cu(111) catalyst. It was found that there is a volcano curve of activity, together with increasing oxide coverage, while the fully covered or empty metal surfaces possessed the lowest activity. This suggested that the interface between the oxide and metal is responsible for the observed catalytic performance. Consistent with this rationale, the exposed facets of the metal support, as a part of the oxide–metal interface, considerably affect the catalytic performance. For example, the methanol production rate of ZnO/Cu(100) is almost twice that of ZnO/Cu(111).33 The barrier of the rate-limiting step of the bridge formate hydrogenation on inverse ZrO2/Cu(111) is two times greater than the counterparts on Cu(100) and Cu(110).34 The inverse catalyst showed distinct features from the traditionally accepted mechanism. From a combined density functional theory (DFT) and kinetic Monte Carlo (kMC) simulation, Kattel et al.19 suggested that CO2 hydrogenation to methanol on Zr3O6H6/Cu(111) preferred a RWGS + CO-hydro pathway over the conventional formate pathway due to the strong CO adsorption at the interfacial sites.
Overall, the exceptional performance of an inverse catalyst in CO2 hydrogenation to methanol has been clearly demonstrated,15,31,33 and the properties of the interfacial sites between oxide and metal are crucial to the catalytic activity. However, the origin of the significant improvements from the inverse catalyst over the conventional counterpart still remains elusive, particularly in consideration of the pronounced consequence induced by simply exchanging the metal and oxide. To solve this enigma, a DFT-based microkinetic simulation was performed to reveal and understand the reaction pathway and mechanism of CO2 hydrogenation to methanol catalyzed by an inverse catalyst, Zr3O6/CuPd. The chosen bimetal alloy provides more options to modulate the properties of the interfacial sites, which serve to establish a structure–performance relationship, and potentially break the linear scaling relation associated with the single metal case. The supported CuPd bimetallic catalyst has been reported to have excellent activity in CO2 hydrogenation to methanol.23 However, the corresponding inverse counterpart or other oxide/bimetallic catalysts have not been explored to the best of our knowledge. Three facets of the CuPd alloy, including (100), (110), and (111), are chosen to construct the interfacial configurations with the Zr3O6 cluster. The adsorption and activation of CO2 at the interfacial sites are carefully examined to reveal the origin of the activity. Three different pathways are examined and evaluated under the same conditions, including formate, RWGS + CO-hydro, and CO2 direct activation. A microkinetic simulation is performed to reveal the different activities of the investigated inverse catalysts and identify the dominant reaction mechanism. The calculations verified the excellent performance of the inverse Zr3O6/CuPd catalyst, which is comparable with contemporary catalysts. It is also demonstrated that the fine-tuning of the atomic arrangement of the interfacial sites is key to adjusting both performance and mechanism. The current work paves the way for further advancing inverse catalyst applications in CO2 hydrogenation and provides a solid optimization strategy.
2. Computational details
2.1. DFT calculations methods
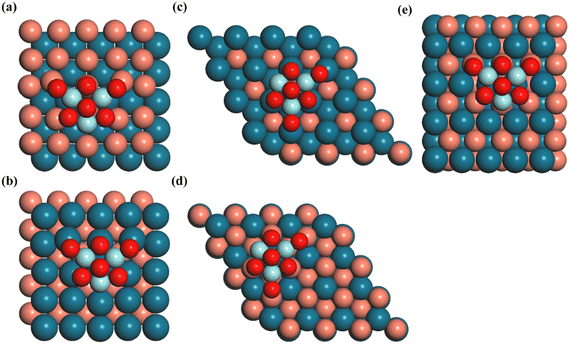
The Vienna ab initio simulation package (VASP) code35,36 with the projector-augmented wave (PAW) method37,38 was used to perform all calculations. The PBE exchange–correlation functional,39 which incorporates the generalized gradient approximation (GGA), was utilized to characterize the exchange and correlation interactions. Additionally, the Grimme correction was applied to account for van der Waals interactions in all calculations. The integration over the Brillouin zone was conducted using a Monkhorst–Pack40k-points grid with dimensions of 2 × 2 × 1. The atomic configurations were iteratively optimized until the forces acting on all unconstrained atoms reached a magnitude lower than 0.02 eV Å−1 with the plane wave basis set with a cutoff energy of 400 eV, and the total energy was converged to an accuracy of 1 × 10⁻⁵ eV. To describe the London-dispersion interactions, the DFT-D3 correction was applied.41The Zr3O6 cluster (denoted as Z) was modeled as the oxide moiety due to its successful imitation of the Cu–ZrO2 interface42 and its validity in depicting the coordination of O and Zr atoms.43 The (100), (110), and (111) surfaces of the CuPd alloy are used as support for the Zr3O6 cluster. The detailed information of each catalyst model is listed in Table S1 (ESI†). The (100) and (111) surfaces of the CuPd alloy both have two different terminations with either Cu or Pd, while the (110) surface of CuPd showed alternating Pd and Cu atom arrangements. The combinations between the Zr3O6 cluster and the CuPd alloy support resulted in five inverse catalysts, as shown in Fig. 1. The term ‘Z/CuPd(100)–Cu’ denotes the Zr3O6 cluster inverse catalyst supported on a metal substrate (100) surface with Cu termination.
The adsorption energy of the intermediates (Eads) is defined as
| Eads = Etotal − Eslab − Egas |
2.2. Microkinetic model
Microkinetic analysis was performed using the catalysis microkinetic analysis package (CatMAP).48 The elementary reactions considered in this microkinetic model are listed in Table 1. During the simulation, two distinct sites were taken into account: h_site, designated for hydrogen atoms, and s_site, designated for other species involved in the reaction network. In this approach, hydrogen was adsorbed at a special “hydrogen reservoir” site, ensuring its adsorption occurred independently without any competition from other species.49,50 The reaction was conducted under specific conditions, where the feed gas composition consisted of CO2(g)![[thin space (1/6-em)]](https://www.rsc.org/images/entities/char_2009.gif) :
:![[thin space (1/6-em)]](https://www.rsc.org/images/entities/char_2009.gif) H2(g)
H2(g)![[thin space (1/6-em)]](https://www.rsc.org/images/entities/char_2009.gif) :
:![[thin space (1/6-em)]](https://www.rsc.org/images/entities/char_2009.gif) inert gas in a ratio of 0.10
inert gas in a ratio of 0.10![[thin space (1/6-em)]](https://www.rsc.org/images/entities/char_2009.gif) :
:![[thin space (1/6-em)]](https://www.rsc.org/images/entities/char_2009.gif) 0.40
0.40![[thin space (1/6-em)]](https://www.rsc.org/images/entities/char_2009.gif) :
:![[thin space (1/6-em)]](https://www.rsc.org/images/entities/char_2009.gif) 0.50 under 473–573 K and total pressure of 10 Bar.
0.50 under 473–573 K and total pressure of 10 Bar.
| Elementary reactions | Z/CuPd(100)–Cu | Z/CuPd(100)–Pd | Z/CuPd(110) | Z/CuPd(111)–Cu | Z/CuPd(111)–Pd | ||||||
|---|---|---|---|---|---|---|---|---|---|---|---|
| E a/eV | ΔE/eV | E a/eV | ΔE/eV | E a/eV | ΔE/eV | E a/eV | ΔE/eV | E a/eV | ΔE/eV | ||
| R1 | H2(g) + 2* ⇔ 2H* | 0.39 | −0.78 | 0.11 | −0.83 | 0.21 | −0.31 | 0.36 | 0.27 | 0.47 | 0.09 |
| R2 | CO2* ⇔ CO2(g) + * | 1.51 | 1.51 | 1.65 | 1.65 | 1.67 | 1.67 | 1.42 | 1.42 | 1.73 | 1.73 |
| R3 | CO2* + H* ⇔ HCOO* + * | 0.67 | −0.24 | 0.33 | 0.11 | 0.66 | 0.05 | 0.19 | −0.86 | 0.46 | −0.28 |
| R4 | CO2* + H* ⇔COOH* + * | 0.73 | 0.25 | 0.60 | 0.28 | 0.81 | 0.48 | 0.50 | −0.30 | 0.90 | −0.07 |
| R5 | CO2* + * ⇔ CO* + O* | 0.71 | 0.31 | 1.34 | 0.35 | 1.13 | 0.75 | 0.74 | −0.11 | 1.30 | 0.55 |
| R6 | HCOO* + H* ⇔ HCOOH* + * | 1.11 | 0.79 | 0.74 | 0.63 | 0.74 | 0.59 | 1.19 | 1.10 | 1.08 | 0.89 |
| R7 | HCOO* + H* ⇔ CH2OO* + * | 1.33 | 0.65 | 1.87 | 1.01 | 1.23 | 1.05 | 1.48 | −0.07 | 1.64 | 1.39 |
| R8 | COOH* + * ⇔ CO* + OH* | 1.52 | 1.04 | 0.82 | 1.01 | 1.05 | 0.14 | 2.05 | 1.18 | 1.94 | 0.81 |
| R9 | CO* + H* ⇔ HCO* + * | 0.62 | −0.52 | 0.79 | 0.63 | 0.97 | 0.40 | 0.98 | −0.36 | 1.26 | 0.18 |
| R10 | HCOOH* + H* ⇔CH2OOH* + * | 0.55 | −0.46 | 0.72 | 0.16 | 0.61 | 0.11 | 0.22 | −0.75 | 0.64 | −0.15 |
| R11 | CH2OO* + H* ⇔ CH2OOH* + * | 0.56 | −2.23 | 0.48 | −0.25 | 0.44 | −0.11 | 0.60 | 0.06 | 0.64 | −0.69 |
| R12 | HCO* + H* ⇔ CH2O* + * | 0.74 | −0.21 | 0.56 | 0.13 | 0.65 | −0.11 | 0.49 | −0.40 | 0.65 | −0.08 |
| R13 | CH2OOH* + * ⇔ CH2O* + OH* | 0.51 | 0.32 | 0.52 | 0.21 | 0.54 | 0.02 | 1.30 | 1.10 | 1.20 | 0.34 |
| R14 | CH2O* + H* ⇔ H3CO* + * | 0.62 | −0.66 | 0.60 | 0.00 | 0.43 | −0.27 | 0.22 | −0.63 | 0.56 | 0.02 |
| R15 | CH2O* + H* ⇔ CH2OH* + * | 1.44 | 0.44 | 1.19 | 0.73 | 1.70 | 0.83 | 0.92 | 0.33 | 1.48 | 0.67 |
| R16 | CH3O* + H* ⇔ CH3OH* + * | 1.34 | 0.87 | 0.74 | 0.44 | 0.89 | 0.67 | 0.73 | 0.29 | 0.81 | 0.61 |
| R17 | CH2OH* + H* ⇔ CH3OH* + * | 1.15 | −0.22 | 0.71 | −0.26 | 0.54 | −0.59 | 0.77 | −0.29 | 0.64 | −0.07 |
| R18 | OH* + H* ⇔ H2O* + * | 1.41 | 0.95 | 0.70 | 0.45 | 0.94 | 0.69 | 1.08 | 0.82 | 0.83 | 0.61 |
| R19 | H2O* ⇔H2O(g) + * | 1.29 | 1.29 | 1.30 | 1.30 | 1.63 | 1.63 | 1.33 | 1.33 | 1.46 | 1.46 |
| R20 | CO* ⇔ CO(g) + * | 1.23 | 1.23 | 2.36 | 2.36 | 2.61 | 2.61 | 1.59 | 1.59 | 2.23 | 2.23 |
| R21 | CH3OH* ⇔ CH3OH(g) + * | 1.56 | 1.56 | 1.55 | 1.55 | 1.87 | 1.87 | 1.59 | 1.59 | 1.56 | 1.56 |
The free energies of the adsorbates and transition states were estimated employing the harmonic approximation, and the entropy was evaluated using the following equation:
Moreover, the free energies of the gas phase molecules are corrected through the following equation:
3. Results and discussion
3.1. CO2 adsorption and activation
As shown in Fig. 1, two different exposed atoms, either Cu or Pd, form contacts with the Zr3O6 cluster to construct the interfacial structure for the investigated surfaces, including CuPd(100) and CuPd(111), respectively. It is noted that the interfacial atomic arrangement is different even for the same metal support surface, which will provide in-depth understandings of the catalytic mechanism beyond the pure surface-dependent regime. The interactions between the oxide and metal substrate induced a charge distribution polarization, as shown in Fig. 2. For facet (100), the Cu and Pd atoms in the top layer are mostly positively and negatively charged, respectively. More importantly, the interfacial atoms between the oxide cluster and metal support show different features from the other surface atoms. For Z/CuPd(100)–Cu, the interfacial copper atoms possessed around +0.37 |e−| charges, while the others are around +0.17 |e−|. For Z/CuPd(100)–Pd, the interfacial palladium atoms are less negatively charged (−0.02 |e−|) or even become positively charged (0.11 |e−|), while the others are negatively charged at around 0.13 |e−|. From charge analysis, the interfacial atoms showed a distinct charge pattern from the rest of the surface atoms, which is induced by the interaction between the oxide cluster and metal substrate. Moreover, the polarized charge distribution rendered the interfacial atoms with good activity to bind various intermediates, as discussed in the following sections.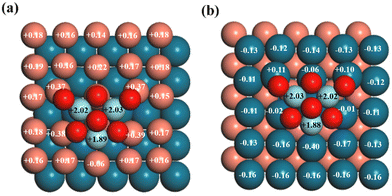 | ||
| Fig. 2 Bader charge analysis (in |e|) of (a) Z/CuPd(100)–Cu and (b) Z/CuPd(100)–Pd. The numbers on the atoms are the calculated charge transfer from the Bader charge analysis. | ||
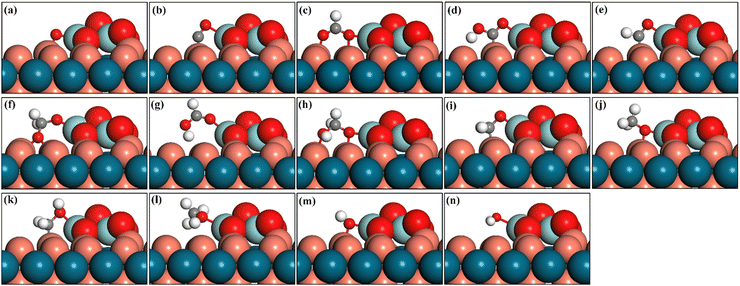
The polarized charge distribution directed the strong adsorption for the CO2 molecule, as shown in Fig. 3a, which is a key step to initiate the reaction and lower the first hydrogenation barrier. For the Z/CuPd(100)–Cu catalyst, the CO2 adsorption preferentially occurs at the interfacial sites and the adsorbed configuration is in the bent mode with an angle of 122.1°. This is significantly different from the linear configuration in the gas phase. Moreover, the C–O bond in CO2 is elongated to 1.26 Å and 1.31 Å after adsorption. These geometry features clearly indicate that CO2 is effectively activated upon adsorption. The adsorbed CO2 molecule configurations on other inverse catalysts are shown in Fig. S1 (ESI†). The calculated adsorption energy is −1.51, −1.65, −1.67, −1.42, and −1.73 eV on Z/CuPd(100)–Cu, Z/CuPd(100)–Pd, Z/CuPd(110), Z/CuPd(111)–Cu, and Z/CuPd(111)–Pd, respectively. The calculated adsorption energies are much greater than previous reports including metal or other inverse catalysts, which are in the range from −0.20 eV to −1.10 eV.19,42 The strong adsorption of CO2 is mainly due to the covalent bond formation with the interfacial atoms, as shown in Fig. 3b and c. The strong adsorption is also witnessed as a significant charge is transferred from the catalyst surface to the adsorbed CO2, as shown in Table S2 (ESI†). In addition to the CO2 molecule, other key intermediates are explored, as shown in Fig. 4 and Fig. S3–S6 (ESI†). For all investigated Z/PdCu catalysts, the interfaces between Zr3O6 and PdCu served as the sites for the intermediate adsorption. The bonding scenarios can be categorized into three types: (1) no bonding with the PdCu substrate, such as HCOOH*, CH3OH*, and H2O*; (2) bonding through the carbon atom in the intermediate with the PdCu substrate, such as CO*, COOH*, and HCO*; and (3) bonding through the oxygen atoms in the intermediate with the PdCu substrate, including O*, OH*, HCOO*, CH2OOH*, and CH3O*. The adsorption energy for these key intermediates is illustrated in Fig. S1 (ESI†). Notably, for catalysts with the same PdCu support facet, the intermediates that bond through the oxygen atoms exhibit stronger adsorption on the Cu-terminated surface, i.e., Type III. Meanwhile, the intermediates that bond through the carbon atoms exhibit stronger adsorption on the Pd-terminated surface, i.e., Type II. For catalysts with the same support facet, the adsorption energy of the intermediates that do not bond with the support is very similar, i.e., Type I. The ability of the catalysts to interact with key intermediate species largely determines the mechanistic differences in the CO2 hydrogenation-to-methanol process across various catalysts.
3.2. Reaction pathway
There are three major catalytic pathways for CO2 hydrogenation to methanol, as shown in Fig. 5. The main difference lies in the first hydrogenation step on the pathway. There are three different products at the first step, HCOO*, COOH*, and CO* + O*, respectively, for the three pathways. Hydrogen bonding with carbon or oxygen in the CO2 molecule formed HCOO* and COOH*, which distinguished the formate (PATH I) and RWGS + CO-hydro (PATH II) pathways (RWGS stands for reversed water–gas shift reaction). Conversely, CO2 can undergo a direct breaking of the C–O bond to form CO* and O*, which corresponds to the CO2 direction activation mechanism and is named as PATH III. However, PATH III became identical with PATH II after the first hydrogenation step. Therefore, only PATH I and II are mainly investigated. PATH I and II are basically paralleled until the formation of CH2O*, where the two pathways meet. The targeted product, methanol, is obtained after two successive hydrogenation steps via either CH3O* or CH2OH* after CH2O* formation. One of the main side products during the reaction is considered to be CO, which is mainly generated on PATH II and III. | ||
| Fig. 5 Reaction network for CO2 hydrogenation to methanol and carbon monoxide over Zr3O6/CuPd inverse catalysts. PATH I: formate, PATH II: RWGS + CO-hydro, PATH III: CO2 direct activation. | ||
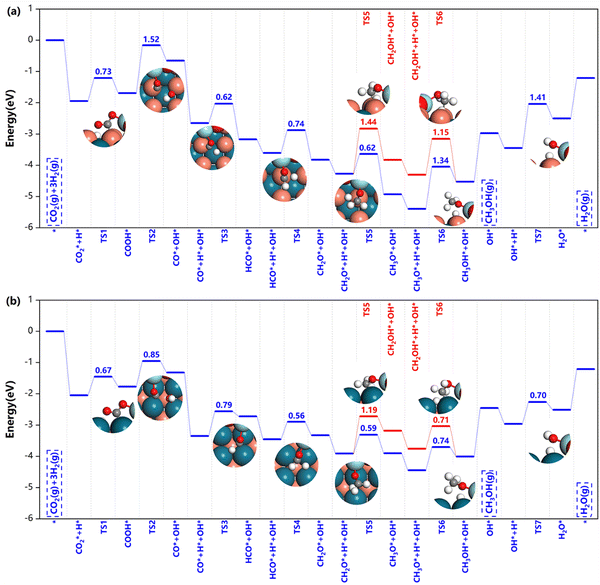
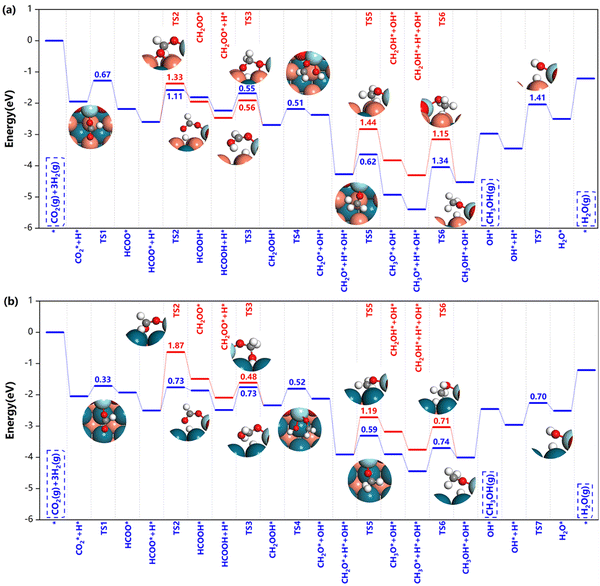 | ||
| Fig. 6 Potential energy diagrams and corresponding transition state structures of methanol formation over (a) Z/CuPd(100)–Cu and (b) Z/CuPd(100)–Pd on the formate pathway. | ||
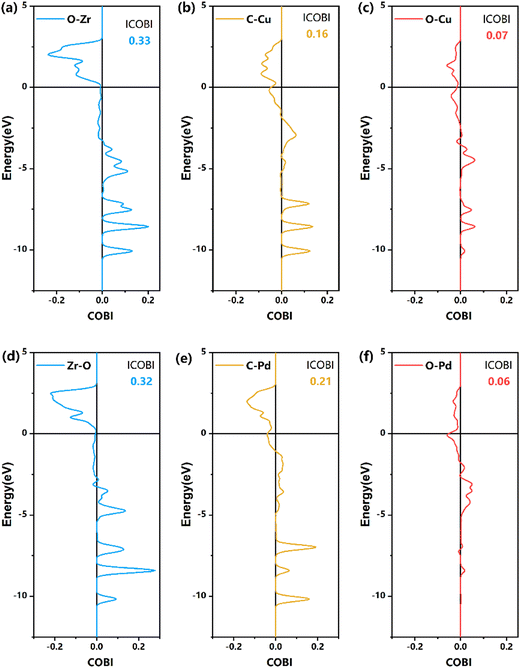 | ||
| Fig. 7 COBI analysis of the bonding nature and strength of TS1 on the formate pathway, as shown in Fig. 6. (a)–(c) Z/CuPd(100)–Cu, (d)–(f) Z/CuPd(100)–Pd. | ||
After HCOO* formation, there are two different catalytic routes to yield methanol, HCOOH → CH2OOH → CH2O → CH3O → CH3OH or CH2OO → CH2OOH → CH2O → CH2OH → CH3OH, as indicated by the blue and red routes in Fig. 6. For Z/CuPd(100)–Cu, the red and blue pathways are quite similar regardless of the reaction barrier until the formation of CH3O* (TS5), in which the blue pathway has a lower barrier than the red pathway. Therefore, Z/CuPd(100)–Cu probably followed the blue pathway. The largest barrier on the blue pathway is identified to be the hydrogenation of CH3O* to methanol, which is 1.34 eV. For Z/CuPd(100)–Pd, the barrier of HCOO* hydrogenation to HCOOH* on the blue pathway and to CH2OO* on the red pathway is 0.73 and 1.87 eV, respectively. This significant difference largely determined the blue pathway as being more favorable, which is consistent with Z/CuPd(100)–Cu. Conversely, the barriers on the blue pathway of Z/CuPd(100)–Pd are all less than 0.8 eV, which is more favorable than CuPd(100)–Cu, as shown in Fig. 6b. In particular, the critical step of CH3O* hydrogenation to methanol has a barrier of 0.74 eV on Z/CuPd(100)–Pd, and it is calculated to be 1.34 eV on Z/CuPd(100)–Cu. Hence, Z/CuPd(100)–Pd is suggested to have better activity than Z/CuPd(100)–Cu from the formate pathway analysis. The performance demonstrated by different metal terminations of CuPd(100) is attributed to the bonding strength and properties of the intermediates and transition with interfacial atomic sites, particularly the Pd and Cu sites at the interfaces.
Moreover, the CuPd bimetallic support possessed better catalytic performance in comparison with other inverse catalysts. DFT calculations indicated that the reaction barrier is 1.32 eV and 1.39 eV on the Zr3O6H6/Cu(111)19 and Zr3O6/Cu(110)42 inverse catalysts for *CH2OOH dissociation, respectively, while it is calculated to be 0.5 eV in the current work. Furthermore, the calculated barriers on Z/CuPd(100)–Pd are much smaller than those of the counterparts on either Zr3O6H6/Cu(111) or Zr3O6/Cu(110) in most cases for the formate pathway. The formate pathway on other surfaces, (110) and (111), are shown in Fig. S2 (ESI†). From comparison, Z/CuPd(100) generally has smaller barriers along the formate pathway than the Z/CuPd(110) and (111) surfaces, as shown in Fig. S3 (ESI†). In particular, for the key steps of the first hydrogenation and methanol formation, Z/CuPd(100)–Pd possessed the lowest barriers among the investigated catalysts.
Direct C–O bond breaking in the CO2 molecule is an elementary step to generate CO* besides COOH* dissociation, as shown in Fig. 5. However, CO2 direct activation has been rarely explored previously due to the assumption of a larger barrier associated with the strong C–O bond. The calculated barriers of CO2 direct activation is 0.71, 1.34, 1.13, 1.14, 0.74 and 1.30 eV for Z/CuPd(100)–Cu and Pd, Z/CuPd(110)–Cu and Z/CuPd(111)–Cu and Pd, respectively. The previous DFT studies demonstrated that the barriers of CO2 activation are around 1.00 eV on PdIn51,52 alloy catalysts. Therefore, inverse Zr3O6/CuPd catalysts indeed demonstrated a remarkable ability to directly activate the C–O bond in the CO2 molecule. This suggested that the inverse Zr3O6/CuPd catalysts will have great potential not only in CO2 hydrogenation to methanol, but also in other catalytic reactions for CO2 conversions with remarkable capability for C–O bond activation. Conversely, the calculated barriers of CO2 activation are comparable with the counterparts of the first hydrogenation steps (HCOO* and COOH*) on the other pathways, which open a new channel for the reaction to proceed.
3.3. Microkinetic simulation
The reaction pathway analysis gave a preliminary evaluation of the catalytic performance for inverse catalysts. Based on the energetics of the elementary steps, as shown in Table 1 (obtained from DFT calculations), a microkinetic simulation was performed to further discern the catalytic capabilities. Firstly, the preference for the formate or RWGS + CO-hydro mechanism is explored for five different catalysts, as shown in Fig. 9. For both mechanisms, the TOF (turnover frequency) has a positive correlation with temperature, and it continuously increased with increasing temperature. For the formate pathway, the calculated TOF decreases with the following sequence: Z/CuPd(100)–Cu > Z/CuPd(100)–Pd > Z/CuPd(110) > Z/CuPd(111)–Pd > Z/CuPd(111)–Cu. The Z/CuPd(100) surfaces with either Cu or Pd terminations exhibit much better performances than the others throughout the whole investigated temperature range. For the Z/CuPd(100) surface, the Cu termination delivered a greater TOF than Pd termination. This indicated that the reactivity is not only dependent on a specific surface, but also significantly influenced by the exposed metal atoms. Conversely, this observation from the TOF calculations is different from the discussion of the reaction barrier comparison, which seems to suggest that Pd termination has better activity. For the RWGS + CO-hydro pathway, the reactivity with decreasing order is Z/CuPd(100)–Pd > Z/CuPd(110) > Z/CuPd(100)–Cu > Z/CuPd(111)–Pd > Z/CuPd(111)–Cu. The most significant change compared with the formate pathway is that the reactivity switched between Z/CuPd(100)–Cu and Z/CuPd(110). On the RWGS + CO-hydro pathway, Z/CuPd(110) exhibited improved activity compared to Z/CuPd(100)–Cu. This again demonstrated that not only reactivity, but also the reaction mechanism, is surface-dependent. The better reactivity of Z/CuPd(110) likely originated from the reduced barrier of the key step (TS2) over Z/CuPd(100)–Cu, as shown in Fig. S2b (ESI†). The common feature shared by both formate and RWGS-CO-hydro pathways is that Z/CuPd(100)–Pd has superior performance compared to others. A comparison of the performance regarding CO2 direct activation (PATH III) is shown in Fig. S6 (ESI†) for the investigated catalysts. For each inversed catalyst, it also has a preferred reaction pathway. In particular, the most favorable pathway is determined to be formate on the Z/CuPd(100) surface, while it is CO2 direct activation on the Z/CuPd(110) and Z/CuPd(111) surfaces. Furthermore, the reactivity sequence predicted from TOF calculations in Fig. 9 is inversely correlated with the trend of the largest barrier on the reaction pathway shown in Fig. 6 and 8 and Fig. S8 and S9 (ESI†), except CuPd(100)–Cu on the formate pathway, which further corroborated the validity of the calculations.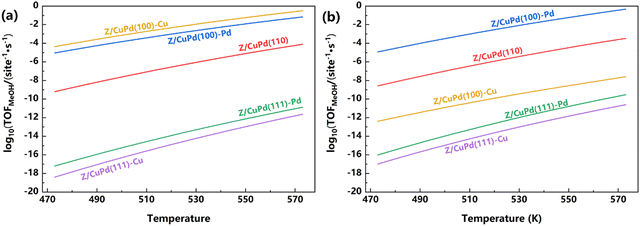 | ||
| Fig. 9 The calculated TOF of Zr3O6/CuPd catalysts along the (a) formate pathway and (b) RWGS + CO-hydro pathway. | ||
Besides the evaluation of the individual pathway, a total TOF is obtained by taking into account the elementary steps of all three pathways, as shown in Table 1, in the microkinetic simulation, which could eliminate any bias to a specific pathway and provide a thorough estimation of the performance. From Fig. 10a, it is clearly indicated that the Z/CuPd(100) surface outperformed both Z/CuPd(110) and Z/CuPd(111) surfaces. Hence, the performance of the Zr3O6/CuPd inverse catalyst has a strong dependence on the metal alloy support surface. From the above discussions, it can be concluded that the catalytic performance and mechanism of inverse Zr3O6/CuPd is largely determined by the metal surface and exposed atoms, respectively.
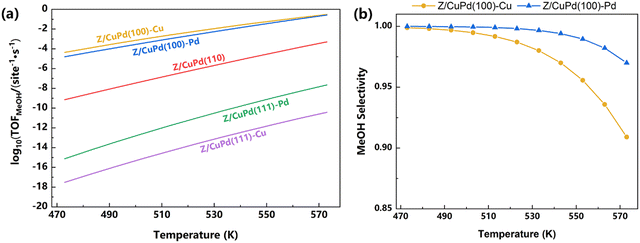 | ||
| Fig. 10 (a) The calculated TOF of Zr3O6/CuPd catalysts, including all elementary steps shown in Table 1. (b) Methanol selectivity of Z/CuPd(100)–Cu and Z/CuPd(100)–Pd. | ||
For the two best catalysts Z/CuPd(100)–Cu and –Pd, the selectivity to methanol is also obtained, as shown in Fig. 10b. The selectivity of both catalysts showed a slow decline with increasing temperature, while Z/CuPd(100)–Cu exhibits a faster decrease in comparison with Z/CuPd(100)–Pd. Both catalysts demonstrate good selectivity above 90% in the investigated temperature range.
The degree of rate control (DRC) analysis, developed by Campbell, provides a quantitative method for analyzing the kinetics of multi-step reaction mechanisms.53 Although the sum of DRC should be unity, there are cases in which unity is not reached. This is probably due to the incomplete elementary step list.51,54 More information regarding the reaction key steps and mechanism are acquired from the coverage and DRC analysis, as shown in Fig. 11. For Z/CuPd(100)–Cu, the major species on the surface are determined to be HCOO*, CH3O*, and OH*, as shown in Fig. 11a. Among them, HCOO* is the most populated species, which is consistent with previous experimental reports.19,31,55 With increasing temperature, the coverage of HCOO* is slowly decreased from 0.6 ML to around 0.4 ML. However, it still occupied most surface sites. Conversely, the coverage of OH* steadily increased from 0.1 ML to 0.3 ML with increasing temperature, while the coverage of CH3O* remains nearly unchanged. To further identify the key steps during the reaction, the general degree of control analysis was performed, as shown in Fig. 11c, which predicted both rate-limited and thermodynamics-limited steps accordingly. For the rate control step, TS4 (CH2O–OH) on the formate pathway and CH2OOH dissociation wielded the most significant influence on the reaction rate. The DRC of this step is calculated to be 0.5 at around 480 K, and it gradually decreased with increasing temperature. Conversely, water formation is also a kinetically relevant step, particularly at high temperature, although the DRC of water formation is below 0.15. The thermodynamics rate control analysis is conversely related with coverage, which is derived from its definition. The strong adsorptions of HCOO* or OH* inhibited the reaction and have adverse effects on rates. This adverse effect becomes less pronounced with increasing temperature for HCOO*, while the opposite trend is observed for OH*.
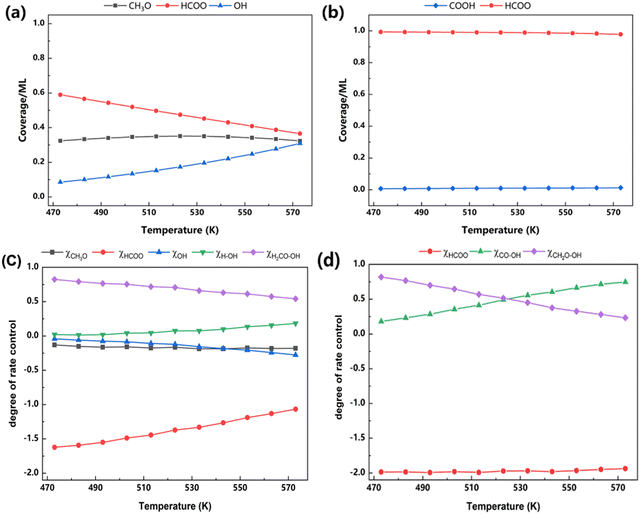 | ||
| Fig. 11 Coverage analysis of (a) Z/CuPd(100)–Cu and (b) Z/CuPd(100)–Pd, and DRC analysis of (c) Z/CuPd(100)–Cu and (d) Z/CuPd(100)–Pd. | ||
For Z/CuPd(100)–Pd, HCOO* dominated the surface coverage with a negligible contribution from COOH*. Furthermore, the coverage distribution did not show an obvious dependence on temperature, as shown in Fig. 11b, which is quite different from Z/CuPd(100)–Cu. A more profound difference regarding the mechanism is revealed from DRC analysis, as shown in Fig. 11d. The kinetic control step is determined to be CH2O–OH (TS4 on the formate pathway) and CO–OH (TS2 on the RWGS + CO-hydro pathway). Below 523 K, CH2O–OH is dominant, and it switched to CO–OH at higher temperature. This seems to suggest that the formate and RWGS pathways have similar contributions to TOF, which is consistent with the observation shown in Fig. S5b (ESI†).
4. Conclusions
The rational optimization is crucial to further extend the application scope of promising inverse catalysts for CO2 hydrogenation. In this work, it is found that the fine-tuning of the facets and exposed metal atoms on the substrate of inverse Zr3O6/CuPd catalysts is an effective strategy to enhance the performance and adjust the mechanism. The chosen CuPd alloy as support to construct inverse catalysts is proved to be crucial toward delivering excellent performance. The interface between the oxide and metal substrate provided active sites for CO2 adsorption and activation, which initiated the reaction. COBI analysis gave a quantitative description of the bonding strength and nature of the transition state of key first hydrogenation step, which is used to determine the following pathway. Three mechanisms, including formate, RWGS + CO-hydro, and CO2 direct activation, are explored and the former two are the dominant reactions. The preferred mechanism is largely determined by the exposed metal atom on the substrate. Moreover, this effect is manifested from the coverage and DRC analysis obtained from the microkinetic simulation. The calculated TOF indicated that the metal alloy substrate surfaces dominate the performance. Thus, Zr3O6/CuPd(100) has been predicted to possess the best performance among the investigated catalysts, which also outperformed the conventional CO2 hydrogenation catalysts and other inverse catalysts on mono metal substrate. Overall, the current work applied a metal alloy-supported inverse catalyst in CO2 hydrogenation to methanol, and validated its exceptional catalytic performance. More importantly, an effective strategy with the rational chosen metal substrate and exposed atoms has been verified, which opens a new direction for further optimization.Data availability
The data supporting this article have been included as part of the ESI.†Conflicts of interest
There are no conflicts to declare.Acknowledgements
This work was supported by the National Natural Science Foundation of China (Grant No. 22372105, 22172100), Basic Research Project of Education Office of Liaoning Province (JYTZD2023183), the Fundamental Research Funds for the Liaoning Universities (LJ212410166043), ShenYang Normal University (BS202208) and The Program for Excellent Talents in Shenyang Normal University.References
- X. Jiang, X. Nie, X. Guo, C. Song and J. G. Chen, Chem. Rev., 2020, 120, 7984–8034 CrossRef CAS PubMed.
- J. Zhong, X. Yang, Z. Wu, B. Liang, Y. Huang and T. Zhang, Chem. Soc. Rev., 2020, 49, 1385–1413 RSC.
- T. Liu, S. Ali, Z. Lian, C. Si, D. S. Su and B. Li, J. Mater. Chem. A, 2018, 6, 19998–20004 RSC.
- S. Chen, T. Liu, S. O. Olanrele, Z. Lian, C. Si, Z. Chen and B. Li, J. Energy Chem., 2021, 54, 143–150 CrossRef CAS.
- W. Xie, K. Li, X.-H. Liu, X. Zhang and H. Huang, Adv. Mater., 2023, 35, 2208132 CrossRef CAS.
- S. Yoshino, T. Takayama, Y. Yamaguchi, A. Iwase and A. Kudo, Acc. Chem. Res., 2022, 55, 966–977 CrossRef CAS.
- J. Artz, T. E. Muller, K. Thenert, J. Kleinekorte, R. Meys, A. Sternberg, A. Bardow and W. Leitner, Chem. Rev., 2018, 118, 434–504 CrossRef CAS PubMed.
- C. Hepburn, E. Adlen, J. Beddington, E. A. Carter, S. Fuss, N. Mac Dowell, J. C. Minx, P. Smith and C. K. Williams, Nature, 2019, 575, 87–97 CrossRef CAS PubMed.
- T. Dong, X. Liu, Z. Tang, H. Yuan, D. Jiang, Y. Wang, Z. Liu, X. Zhang, S. Huang, H. Liu, L. Zhao and W. Zhou, Appl. Catal., B, 2023, 326, 122176 CrossRef CAS.
- J. A. Onrubia-Calvo, A. Bermejo-López, B. Pereda-Ayo, J. A. González-Marcos and J. R. González-Velasco, Appl. Catal., B, 2023, 321, 122045 CrossRef CAS.
- K. Mori, H. Hata and H. Yamashita, Appl. Catal., B, 2023, 320, 122022 CrossRef CAS.
- E. H. Kim, M. H. Lee, J. Kim, E. C. Ra, J. H. Lee and J. S. Lee, Chin. J. Catal., 2023, 47, 214–221 CrossRef CAS.
- D. Wei, R. Sang, P. Sponholz, H. Junge and M. Beller, Nat. Energy, 2022, 7, 438–447 CrossRef CAS.
- S. Yang, L. Zhang and Z. Wang, Fuel, 2022, 324, 124503 CrossRef CAS.
- S. Kattel, B. Yan, Y. Yang, J. G. Chen and P. Liu, J. Am. Chem. Soc., 2016, 138, 12440–12450 CrossRef CAS.
- K. Larmier, W. C. Liao, S. Tada, E. Lam, R. Verel, A. Bansode, A. Urakawa, A. Comas-Vives and C. Coperet, Angew. Chem., Int. Ed., 2017, 56, 2318–2323 CrossRef CAS.
- T. Lunkenbein, J. Schumann, M. Behrens, R. Schlogl and M. G. Willinger, Angew. Chem., Int. Ed., 2015, 54, 4544–4548 CrossRef CAS.
- J. A. Rodriguez, P. Liu, D. J. Stacchiola, S. D. Senanayake, M. G. White and J. G. Chen, ACS Catal., 2015, 5, 6696–6706 CrossRef CAS.
- S. Kattel, B. Yan, Y. Yang, J. G. Chen and P. Liu, J. Am. Chem. Soc., 2016, 138, 12440–12450 CrossRef CAS.
- G. A. Olah, A. Goeppert and G. K. S. Prakash, Beyond Oil and Gas: The Methanol Economy, Wiley, 1st edn, 2009 Search PubMed.
- G. A. Olah, Angew. Chem., Int. Ed., 2005, 44, 2636–2639 CrossRef CAS.
- M. Behrens, F. Studt, I. Kasatkin, S. Kühl, M. Hävecker, F. Abild-Pedersen, S. Zander, F. Girgsdies, P. Kurr, B.-L. Kniep, M. Tovar, R. W. Fischer, J. K. Nørskov and R. Schlögl, Science, 2012, 336, 893–897 CrossRef CAS PubMed.
- R. Qiu, Z. Ding, Y. Xu, Q. Yang, K. Sun and R. Hou, Appl. Surf. Sci., 2021, 544, 148974 CrossRef CAS.
- A. Mravak, S. Vajda and V. Bonačić-Koutecký, J. Phys. Chem. C, 2022, 126, 18306–18312 CrossRef CAS PubMed.
- C. Wang, Y. Fang, G. Liang, X. Lv, H. Duan, Y. Li, D. Chen and M. Long, J. CO2 Util., 2021, 49, 101542 CrossRef CAS.
- B. Hu, Y. Yin, G. Liu, S. Chen, X. Hong and S. C. E. Tsang, J. Catal., 2018, 359, 17–26 CrossRef CAS.
- F. Brix, V. Desbuis, L. Piccolo and É. Gaudry, J. Phys. Chem. Lett., 2020, 11, 7672–7678 CrossRef CAS PubMed.
- C. Quilis, N. Mota, B. Pawelec, E. Millán and R. M. Navarro Yerga, Appl. Catal., B, 2023, 321, 122064 CrossRef CAS.
- K. Li and J. G. Chen, ACS Catal., 2019, 9, 7840–7861 CrossRef CAS.
- S. Kattel, W. Yu, X. Yang, B. Yan, Y. Huang, W. Wan, P. Liu and J. G. Chen, Angew. Chem., Int. Ed., 2016, 55, 7968–7973 CrossRef CAS.
- C. Wu, L. Lin, J. Liu, J. Zhang, F. Zhang, T. Zhou, N. Rui, S. Yao, Y. Deng, F. Yang, W. Xu, J. Luo, Y. Zhao, B. Yan, X. D. Wen, J. A. Rodriguez and D. Ma, Nat. Commun., 2020, 11, 5767 CrossRef CAS.
- S. D. Senanayake, P. J. Ramírez, I. Waluyo, S. Kundu, K. Mudiyanselage, Z. Liu, Z. Liu, S. Axnanda, D. J. Stacchiola, J. Evans and J. A. Rodriguez, J. Phys. Chem. C, 2016, 120, 1778–1784 CrossRef CAS.
- R. M. Palomino, P. J. Ramírez, Z. Liu, R. Hamlyn, I. Waluyo, M. Mahapatra, I. Orozco, A. Hunt, J. P. Simonovis, S. D. Senanayake and J. A. Rodriguez, J. Phys. Chem. B, 2018, 122, 794–800 CrossRef CAS.
- W. Xiong, J. Ding, D. Wang and W. Huang, J. Phys. Chem. Lett., 2023, 14, 7229–7234 CrossRef CAS PubMed.
- G. Kresse and J. Furthmüller, Comput. Mater. Sci., 1996, 6, 15–50 CrossRef CAS.
- G. Kresse and J. Furthmüller, Phys. Rev. B: Condens. Matter Mater. Phys., 1996, 54, 11169–11186 CrossRef CAS PubMed.
- G. Kresse and D. Joubert, Phys. Rev. B: Condens. Matter Mater. Phys., 1999, 59, 1758–1775 CrossRef CAS.
- P. E. Blöchl, Phys. Rev. B: Condens. Matter Mater. Phys., 1994, 50, 17953–17979 CrossRef.
- J. P. Perdew, K. Burke and M. Ernzerhof, Phys. Rev. Lett., 1996, 77, 3865–3868 CrossRef CAS PubMed.
- H. J. Monkhorst and J. D. Pack, Phys. Rev. B: Solid State, 1976, 13, 5188–5192 CrossRef.
- S. Grimme, J. Antony, S. Ehrlich and H. Krieg, J. Chem. Phys., 2010, 132, 154104 CrossRef PubMed.
- L. Liu, X. Su, H. Zhang, N. Gao, F. Xue, Y. Ma, Z. Jiang and T. Fang, Appl. Surf. Sci., 2020, 528, 146900 CrossRef CAS.
- G. Zhao, B. Xiang, X. Shen, J. Sun, Y. Bai and Y. Wang, Acta Phys.-Chim. Sin., 2011, 27, 1095–1102 CAS.
- G. Henkelman and H. Jónsson, J. Chem. Phys., 1999, 111, 7010–7022 CrossRef CAS.
- P. C. Müller, C. Ertural, J. Hempelmann and R. Dronskowski, J. Phys. Chem. C, 2021, 125, 7959–7970 CrossRef.
- R. Nelson, C. Ertural, J. George, V. L. Deringer, G. Hautier and R. Dronskowski, J. Comput. Chem., 2020, 41, 1931–1940 CrossRef CAS.
- G. Henkelman, A. Arnaldsson and H. Jónsson, Comput. Mater. Sci., 2006, 36, 354–360 CrossRef.
- A. J. Medford, C. Shi, M. J. Hoffmann, A. C. Lausche, S. R. Fitzgibbon, T. Bligaard and J. K. Nørskov, Catal. Lett., 2015, 145, 794–807 CrossRef CAS.
- A. Cao, J. Schumann, T. Wang, L. Zhang, J. Xiao, P. Bothra, Y. Liu, F. Abild-Pedersen and J. K. Nørskov, ACS Catal., 2018, 8, 10148–10155 CrossRef CAS.
- D. Garcia-Pintos, J. Voss, A. D. Jensen and F. Studt, J. Phys. Chem. C, 2016, 120, 18529–18537 CrossRef CAS.
- P. Wu and B. Yang, Catal. Sci. Technol., 2019, 9, 6102–6113 RSC.
- P. Wu, J. Zaffran and B. Yang, J. Phys. Chem. C, 2019, 123, 13615–13623 CrossRef CAS.
- C. T. Campbell, ACS Catal., 2017, 7, 2770–2779 CrossRef CAS.
- X. Wang, J. Pan, H. Wei, W. Li, J. Zhao and Z. Hu, J. Phys. Chem. C, 2022, 126, 1761–1769 CrossRef CAS.
- F. C. Meunier, I. Dansette, A. Paredes-Nunez and Y. Schuurman, Angew. Chem., Int. Ed., 2023, 62, e202303939 CrossRef CAS PubMed.
Footnotes |
| † Electronic supplementary information (ESI) available. See DOI: https://doi.org/10.1039/d4cp00927d |
| ‡ These authors contributed equally to this work. |
| This journal is © the Owner Societies 2024 |

