 Open Access Article
Creative Commons Attribution 3.0 Unported Licence
Investigating the behaviour of NaCl brines and hydrocarbons in porous alumina using low-field NMR relaxation and diffusion methods
Aristarchos
Mavridis
 a,
Mark
Sankey
b,
Kuhan
Chellappah
b and
Carmine
D’Agostino
 *ac
*ac
aDepartment of Chemical Engineering, The University of Manchester, Oxford Road, Manchester, M13 9PL, UK. E-mail: carmine.dagostino@manchester.ac.uk
bbp, Chertsey Road, Sunbury-on-Thames, Middlesex, TW16 7LN, UK
cDipartimento di Ingegneria Civile, Chimica, Ambientale e dei Materiali (DICAM), Alma Mater Studiorum – Università di Bologna, Via Terracini, 28, 40131 Bologna, Italy
First published on 7th March 2024
Abstract
The behaviour of multiple fluid phases within a porous medium is hard to predict. NMR measurements offer an excellent tool to probe such systems in a fast and non-invasive way. Such systems can be relevant to hydrocarbon recovery, catalysis, and CO2 and H2 geo-storage, among others. Since electrolyte solutions are always present in subsurface reservoirs, understanding their behaviour within porous media is highly important. In this study, we use NMR relaxation and diffusion methods to investigate the diffusion coefficients and strength of interactions between alumina surfaces and brines at various NaCl concentrations, focusing on the effect of salt concentration on transport and interactions within the porous structure. Furthermore, we study the spontaneous displacement of dodecane, a model hydrocarbon, from the same alumina pellets using the same brine solutions. Results show that brines of lower salinity consistently displace more dodecane in total, after soaking dodecane-saturated pellets in a brine solution for several days. This indicates that increased salt concentrations can reduce wettability towards the aqueous phase in simple metal oxide surfaces and highlights the capabilities of NMR to efficiently study such systems.
Introduction
Investigating the behaviour of multiple fluids in porous media is of relevance in many areas of science and technology, such as hydrocarbon recovery, CO2 storage, catalysis, and separation. One of the most important parameters to consider is the wettability of the pore surfaces towards each of those fluids. It controls the distribution of fluid phases within the pore spaces and determines the flow behaviour for both the wetting and non-wetting phases.One particularly important aspect is the interactions between electrolyte solutions and mineral surfaces. Understanding such interactions is of significance as these systems are relevant to areas such as hydrocarbon recovery, carbon dioxide and hydrogen geo-storage, and geothermal applications. Low salinity waterflooding is one example of an area where interfacial wettability in porous rock plays an important role. The technique has been used to displace hydrocarbons from porous rocks for secondary and tertiary oil recovery. The effectiveness of such techniques may be explained through expansion of electrical double layer and multicomponent ion exchange mechanisms;1,2 however, uncertainties remain when it comes to implementations on reservoir scales.3,4
Nuclear magnetic resonance (NMR) relaxation has been used in numerous studies in recent years to probe the behaviour of fluids within restricted environments, such as biological cells, catalyst supports and rock materials.5–7 Several aspects of porous structures can be probed, such as pore size distribution8,9 and exchange of fluid molecules between different pore environments,10 under the condition of sufficiently low diffusion coupling between these pores.11 NMR also offers the possibility to investigate wettability of fluids with a fast, non-invasive and non-destructive approach,12,13 which can offer advantages over traditional, more complicated methods to assess wettability, such as the USBM and Amott-Harvey index,14 or contact angle methods15 which can sometimes yield inconsistent results16 and cannot fully represent the effects of complex geometries found within porous structures.
In this study, we investigate the potential of NMR to study the wetting properties of NaCl brines, as well their ability to spontaneously displace dodecane, a model hydrocarbon compound, from the pores of alumina pellets through an imbibition process at room temperature and atmospheric pressure. Since most natural rocks consist predominantly of metal oxide-based minerals, it would be reasonable to study porous extrudates of pure metal oxides, such as alumina, as an analogue for actual rock samples. The advantage of this approach for systematic studies is in the more controlled and reproducible pore structures offered by these materials, as opposed to the intrinsic heterogeneous nature of rocks in terms of structure and chemical composition, which makes experimental results difficult to interpret. NaCl has been chosen since it is by far the most common electrolyte found in natural brines.
Theory
NMR relaxation
When a sample containing spin-bearing particles is placed under a strong magnetic field, these spins will precess around an axis parallel to that external magnetic field, which is labelled as the z-axis, with an angular velocity (ω0) given by:| ω0 = −γB0 | (1) |
![[M with combining right harpoon above (vector)]](https://www.rsc.org/images/entities/i_char_004d_20d1.gif) ). Electromagnetic pulses can be used to manipulate this magnetization, to obtain useful information about various physical and chemical properties of the sample. More details on the physics of magnetic resonance can be found in various textbooks.17–19
). Electromagnetic pulses can be used to manipulate this magnetization, to obtain useful information about various physical and chemical properties of the sample. More details on the physics of magnetic resonance can be found in various textbooks.17–19
After the sample's net magnetisation is disturbed by this pulse, it relaxes back to its equilibrium state, parallel to the z-axis. The restoration of the z-axis component back to the equilibrium level is referred to as “longitudinal relaxation”, and the diminishing of the x and y axes’ components back to zero is called “transverse relaxation”. For spins in liquid molecules, both longitudinal and transverse relaxation occur exponentially, and their rates can provide information about the molecular dynamics existing within the sample.20 Longitudinal relaxation is characterised by the “T1” time constant, while transverse relaxation is characterised by the “T2” time constant.
In the case of fluids confined within some restrictive geometry, such as in a porous medium, relaxation times are usually much shorter than those of the same liquids in their bulk state. This is because the surfaces of the confining solid act as relaxation sinks, whether these involve spin bearing particles, paramagnetic species or surface adsorption sites.21
For porous media with limited pore connectivity,22 both T1 and T2 relaxation time distributions can usually be correlated to the pore size distribution of a porous medium.9 The relationship between T1 and T2 values can be used to draw information about the wettability of the porous medium towards a fluid, since it is related to the surface residency time of the fluid's molecules.23 The T1/T2 ratio can be linked to an energy of adsorption for a fluid molecule onto a surface. This relationship comes from the different dependencies of T1 and T2 on molecular motions, and can be mathematically proven for surface adsorption on both paramagnetic24,25 and non-paramagnetic26,27 sites. Several experimental studies have shown the validity of such measurements.26,28
NMR diffusion
The precession frequency of a spin-bearing nucleus depends on the strength of the external magnetic field it experiences. Modern NMR instruments are capable of generating magnetic field gradients (using short pulses of constant current applied to suitable gradient coils), which effectively label different positions within the sample, according to their different precession frequencies. In the case of a one-dimensional gradient along the z-axis, the precession frequency at each point will be:29| ω(z) = ω0 − γgz | (2) |
After a radiofrequency pulse creates a net magnetisation, the movement of molecules between regions of different magnetic fields introduces additional dephasing of the spin ensemble. The extent of this dephasing results in a signal attenuation, which can be exploited by carefully designed pulse sequences in order to accurately quantify the diffusion coefficients of the molecules within the sample. Further information about diffusion measurements and the theory behind them can be found in the literature.30–32
Pulse sequences
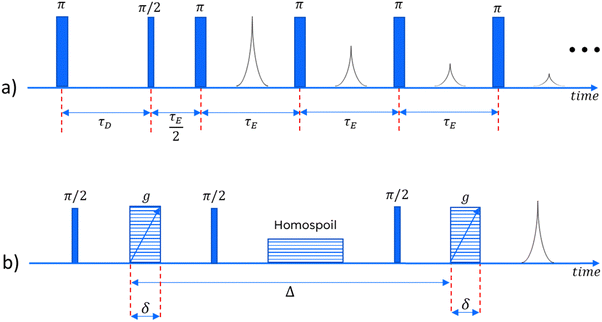
In order to obtain meaningful information about the NMR behaviour of any sample, we must use a series of well-timed radiofrequency pulses. In this study, for the relaxation measurements, we employ an IR-CPMG sequence33 (a combination of the Inversion Recovery and Carr–Purcell–Meiboom–Gill pulse sequences), capable of obtaining information about both longitudinal and transverse relaxation in one single experiment. For the diffusivity measurements a pulsed field gradient stimulated echo (PGSTE) sequence is used.34 Both of these sequences are illustrated in Fig. 1.Numerical inversion
In the presence of multiple relaxation behaviours within the sample, these different components are hidden behind a single NMR signal. To separate the contributions of each component, numerical inversion methods are commonly used. Effectively, it is a process where the experimental results are fitted with a sum of a large number of relaxation decays. Mathematically, this multi exponential decay can be expressed as a Fredholm integral of the first kind:35 | (3) |
 | (4) |
 | (5) |
Conventional algorithms used for curve fitting cannot handle such complex forms, and thus a regularisation process must be used.36 The inverse problem of finding a realistic set of f(T) values can be solved using methods such as non-linear least squares, maximum entropy, or equivalent. These methods can be used for both 1D and 2D NMR experiments, sometimes involving both relaxation and diffusion measurements.37 Further information about the inversion process can be found in the literature.35,38–40
Experimental
Sample preparation
For the experiments performed in this study, cylindrical pellets of pure alumina (approximately 2 mm in diameter and 5 mm in length) were used. The brine samples have been prepared using NaCl of purity above 99%, dissolved in deionised water. The concentration range used is from 1% w/v up to 25% w/v, which is close to the solubility limit of NaCl at room temperature. The alumina pellets were dried overnight in a vacuum oven at 70 °C, in order to remove any residual moisture and other potential impurities. Afterwards, they were soaked in the prepared brine samples in order to saturate the pores, for at least 48 hours before an experiment. Before the measurements, the pellets were removed from the liquid, and carefully dried on a filter paper so that the outer surface would be dry, without removing any significant amount of liquid from within the pores of the pellet. This is so that the obtained signal will come exclusively from the pore-bound fluid, and not from an external bulk liquid layer.Methodology
NMR relaxation and diffusion experiments were performed on the alumina samples, saturated with brines of various NaCl concentrations.Imbibition experiments were also performed, whereby brines of different salinities were used to spontaneously displace dodecane from within the alumina pellets. The pellets were dried and soaked in dodecane for at least 48 h before the experiments. They were then placed in a container full of brine, and removed after a designated time interval, after which a T1–T2 measurement was performed. The process was repeated for ten different time steps, for all ten of the brine solutions used, with the longest soaking interval lasting about one week. The pellets inherently have a higher water wetting tendency and dodecane is not miscible with the aqueous phase, thus the brine solutions would imbibe into the pores of the pellet, displacing some of the dodecane.
This displacement process can be studied by looking at the volume fractions of water and dodecane through time. These two can be easily quantified using NMR since their relaxation times within the pores of the alumina pellets differ significantly. Their respective volume fractions can be estimated by calculating the integrals under the peaks representing each of the fluids in a 2D T1–T2 map,41 obtained by inverting the experimental data by methods discussed in the previous section, utilising the Tikhonov regularisation method.42
Diffusion coefficients were estimated by fitting the experimental results with an exponential equation of the form:
 | (6) |
NMR hardware
A Magritek Spinsolve™ spectrometer was used, with a magnetic field of approximately 1 Tesla, corresponding to a proton Larmor frequency of around 43 MHz. A gradient coil is included in the instrument, which can be used to apply one-dimensional gradients up to 163 mT m−1. For the IR-CPMG sequence, 16 inversion recovery cycles have been used for each experiment, with delay times logarithmically spaced between 1 and 3000 ms. The echo time for the CPMG part of the sequence was 250 μs. For the PGSTE experiments, δ was fixed at 2 ms and Δ at 300 ms, while g was varied between 14 and 130 mT m−1, in 16 linearly spaced intervals.Results and discussion
Diffusion measurements
The experimental results from the PGSTE measurements are presented in a Stejskal-Tanner plot43 in Fig. 2. The data for all different NaCl concentrations follow clear mono-exponential trends, implying that there is a single diffusion regime within the samples over the time scale probed by PGSTE measurements. This behaviour is typical of porous materials showing a macroscopically homogeneous pore structure and is often referred to as quasi-homogeneous behaviour.44,45 A similar behaviour is observed for the same brine samples in their bulk state.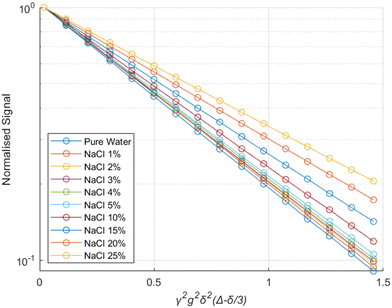 | ||
| Fig. 2 Stejskal–Tanner plot for brines of different salinities within the pores of alumina pellets. The solid lines represent exponential fits using eqn (6). | ||
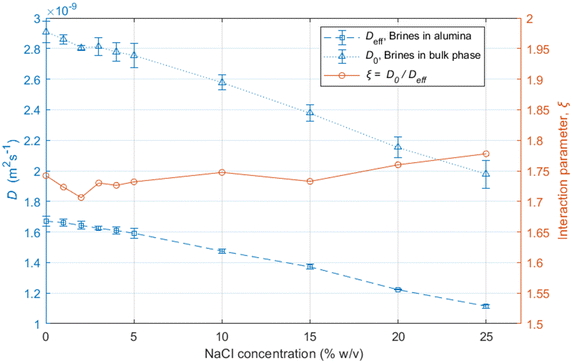
The results show that the diffusion coefficients of the water molecules consistently decrease with increasing salinity, both in bulk and within the alumina samples, as shown in Fig. 3.
The reduction in the diffusion coefficients for the brines within the pores are mostly due to the increase in the viscosity of the solutions due to the addition of NaCl,46 also reflected by the bulk brine measurements.
The ratio between the diffusivity of a liquid in its bulk state and the same liquid confined within pores can provide information related to the tortuosity of the porous medium.44,47 However, this is only valid in the case of molecules which do not interact strongly with the surfaces, as shown elsewhere.48 Otherwise, a PFG interaction parameter is defined, as:
 | (7) |
The ξ value for the alumina samples is slightly lower for the low salinity brines, indicating that the decrease in the movement of water molecules within the alumina samples is slightly greater for lower salinities. This could be partly due to stronger interaction of water molecules with the pore walls for the low-salinity brines, which is supported by the relaxation measurements presented in the next section. Since that effect would only have an impact on the surface layers and not the bulk liquid in the middle of the pores, the variation in ξ is not very significant.
Relaxation measurements – dodecane displacement
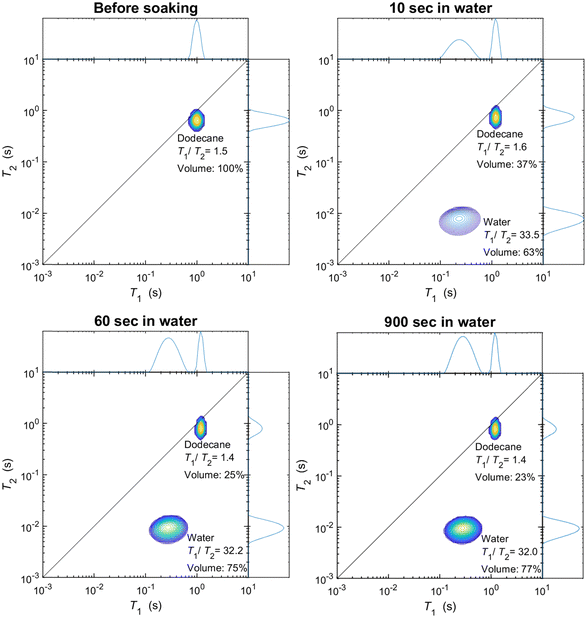
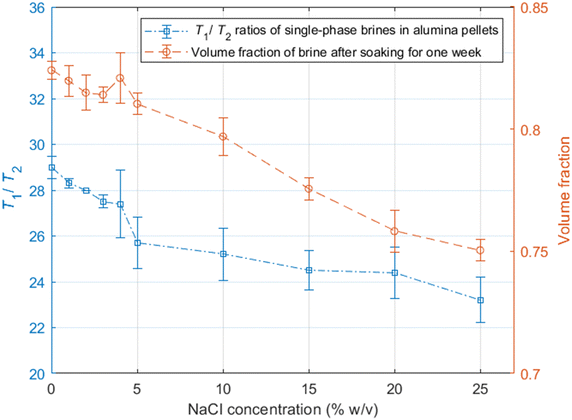
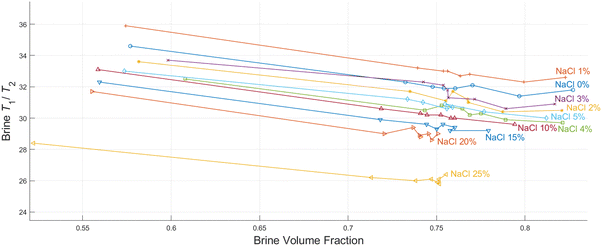
As discussed in the experimental section, we look at the volume fractions of brine and dodecane at several different time steps during the soaking process (10 s, 20 s, 1 min, 10 min, 15 min, 1 h, 24 h, 1 week). This information is obtained by integrating the peaks representing each of the fluid phases in the T1–T2 maps, such as the examples presented in Fig. 4. The position of the same peaks provides the value of the T1/T2 ratio for each of the fluids.T 1–T2 experiments have also been performed in alumina pellets fully saturated with each of the different brine concentrations tested. The results of such measurements are presented in Fig. 5, along with the volume fractions of the same brine samples, after a dodecane-saturated pellet was soaked in them for a period of one week.
It is evident from the data in Fig. 5 that there is a strong correlation between the T1/T2 ratio of the brines and the amount of dodecane they are able to displace. During the early time steps, no significant trends were observed between different salinities, and the rate of displacement was uncorrelated with salinity. This is possibly attributed to slight differences in pore structure and permeability between individual pellets, which would probably affect the initial displacement rates. However, looking at the final time steps, after a week of soaking, there is a clear trend, showing that brines of lower salinities are consistently displacing more dodecane. This is also illustrated in Fig. 6.
The results show that a fraction of dodecane will always remain trapped in the pores of the alumina pellets, regardless of the soaking time in the brine solutions. This is because the non-wetting phase forms discontinuous ganglia surrounded by the mobile wetting phase,51,52 which are very difficult to displace spontaneously by the wetting phase.
By looking at the T1/T2 ratios of the brines at each step, we can see that brines of lower salinities generally tend to have higher T1/T2 values, the same as the single-phase experiments. This confirms that surface affinity is higher for the brines at lower NaCl concentrations, even in multi-phase environments, which explains their ability to displace more dodecane. These results agree with the findings of Lee et al.,2 who observed that in low salinities the water layers on silica surfaces are thicker compared to the water layers for higher salinities.
Furthermore, the T1/T2 ratio for each of the brine samples is consistently reduced when the brine volume fraction is increased, as shown in Fig. 4 and 6. This could be attributed to the distribution of fluids within the pores. Since brine is the wetting phase, it mostly occupies the limited space between the pore surface and the non-wetting phase, which occupies the middle of the pores. When the volume fraction of the brine is lower, a bigger proportion of the water hydrogens experience enhanced surface relaxation and additional dephasing of the spin ensemble due to the magnetic field distortion caused by the magnetic susceptibility of the solid, leading to reduced T2 values. Nevertheless, these dephasing effects would be the same regardless of the salinity, and thus differences in T1/T2 between the different brines can be interpreted as a clear indication of surface affinity.
Conclusions
In this study, the effects of NaCl concentration in the wettability and the capacity for hydrocarbon displacement through spontaneous imbibition were investigated for several different brine samples in porous alumina pellets.Both NMR relaxation and diffusion results show that interactions between the aqueous phase and the alumina surfaces are stronger for lower NaCl concentrations, indicating higher levels of wettability for lower salinity brines. Imbibition experiments show that low salinity brines consistently displace more dodecane. A strong correlation between the T1/T2 ratio of the brines and their ability to displace hydrocarbons from the pores of the alumina pellets was also observed.
Such results show that the T1/T2 ratio of fluids confined within the pores of a solid medium can be a valid indication of wettability in multi-phase systems and can help unravel the effect of salt concentration on transport and dynamics of fluids inside the pores, which has important implications for subsurface applications, where multi-phase fluid behaviour is of critical importance, whether the goal is to displace a fluid phase, or keep it trapped within the pores.
It is worth noting that NMR might be able to help us evaluate the ways fluids are distributed within pores, in systems where multiple fluid phases are present. Future studies could further investigate these effects, by comparing NMR results with imaging techniques for example.
Author contributions
Aristarchos Mavridis: investigation, writing – original draft, data curation, formal analysis, validation, methodology. Carmine D’Agostino: conceptualisation, funding acquisition, supervision, project administration, writing – review & editing. Mark Sankey, Kuhan Chellappah: supervision, project administration, writing – review & editing.Conflicts of interest
There are no conflicts to declare.Acknowledgements
The authors would like to acknowledge funding from bp-ICAM and the EPSRC grant no. EP/V519613/1 for funding their research activities. Furthermore, the authors would like to thank Mike Spearing and Dana Aytkhozhina for their comments on the manuscript, and Vahid Niasar for helpful discussions during the early stages of the study.References
- K. S. Sorbie and I. R. Collins, SPE - DOE Improved Oil Recovery Symposium. Proceedings, 2010, 1, 760–777.
- S. Y. Lee, K. J. Webb, I. R. Collins, A. Lager, S. M. Clarke, M. O’Sullivan, A. F. Routh and X. Wang, Proceedings - SPE Symposium Improved Oil Recovery, 2010, 1, 534–544.
- P. I. Sagbana, K. Sarkodie and W. A. Nkrumah, Petroleum, 2023, 9, 317–330 CrossRef.
- F. Liu and M. Wang, Fuel, 2020, 267, 117112 CrossRef CAS.
- Y.-Q. Song, J. Magn. Reson., 2013, 229, 12–24 CrossRef CAS PubMed.
- L. F. Gladden and J. Mitchell, New J. Phys., 2011, 13, 035001 CrossRef.
- K. T. O’Neill, E. O. Fridjonsson, D. Smeed, T. A. J. Hopper and M. L. Johns, Icarus, 2023, 399, 115544 CrossRef.
- S. Davies, M. Z. Kalam, K. J. Packer and F. O. Zelaya, J. Appl. Phys., 1990, 67, 3171–3176 CrossRef CAS.
- R. L. Kleinberg, Magn. Reson. Imaging, 1994, 12, 271–274 CrossRef CAS PubMed.
- K. E. Washburn and P. T. Callaghan, Phys. Rev. Lett., 2006, 97, 175502 CrossRef CAS PubMed.
- M. Fleury, T. Gimmi and M. Mazurek, Clays Clay Miner., 2022, 70, 417–437 CrossRef CAS.
- A. Valori and B. Nicot, PETROPHYSICS The SPWLA Journal of Formation Evaluation and Reservoir Description., 2019, 60, 255–263 Search PubMed.
- A. Valori, F. Ali and W. Abdallah, in Day 2 Tue, March 27, 2018, SPE, 2018, vol. 2018, pp. 26–28.
- W. Anderson, J. Pet. Technol., 1986, 38, 1246–1262 CrossRef CAS.
- J. Bachmann, S. K. Woche, M.-O. Goebel, M. B. Kirkham and R. Horton, Water Resour. Res., 2003, 39, 1353 CrossRef.
- S. Iglauer, C. H. Pentland and A. Busch, Water Resour. Res., 2015, 51, 729–774 CrossRef CAS.
- M. H. Levitt, Spin Dynamics: Basics of Nuclear Magnetic Resonance, John Wiley & Sons Ltd, 2008 Search PubMed.
- J. Keeler, Understanding NRM Spectroscopy, John Wiley & Sons, Ltd, 2010 Search PubMed.
- R. J. Abraham, J. Fisher and P. Loftus, Introduction to NMR spectroscopy, Wiley, 1988 Search PubMed.
- J. Kowalewski, Nucl. Magn. Reson., 2012, 41, 196–243 CAS.
- J.-P. Korb, New J. Phys., 2011, 13, 035016 CrossRef.
- K. R. McCall, D. L. Johnson and R. A. Guyer, Phys. Rev. B: Condens. Matter Mater. Phys., 1991, 44, 7344–7355 CrossRef PubMed.
- J. Mitchell, M. D. Hürlimann and E. J. Fordham, J. Magn. Reson., 2009, 200, 198–206 CrossRef CAS.
- R. L. Kleinberg, W. E. Kenyon and P. P. Mitra, J. Magn. Reson., Ser. A, 1994, 108, 206–214 CrossRef CAS.
- P. J. McDonald, J.-P. Korb, J. Mitchell and L. Monteilhet, Phys. Rev. E: Stat., Nonlinear, Soft Matter Phys., 2005, 72, 011409 CrossRef CAS PubMed.
- J. Mitchell, L. M. Broche, T. C. Chandrasekera, D. J. Lurie and L. F. Gladden, J. Phys. Chem. C, 2013, 117, 17699–17706 CrossRef CAS.
- C. D’Agostino, J. Mitchell, M. D. Mantle and L. F. Gladden, Chem. – A Eur. J., 2014, 20, 13009–13015 CrossRef PubMed.
- N. Robinson, C. Robertson, L. F. Gladden, S. J. Jenkins and C. D’Agostino, ChemPhysChem, 2018, 19, 2472–2479 CrossRef CAS PubMed.
- D. Sinnaeve, Concepts Magn. Reson. Part A Bridg. Educ. Res., 2012, 40, 39–65 CrossRef.
- W. S. Price, NMR Studies of Translational Motion, Cambridge University Press, 2009 Search PubMed.
- W. S. Price, Concepts Magn. Reson., 1997, 9, 299–336 CrossRef CAS.
- D. S. Grebenkov, Concepts Magn. Reson., Part A, 2008, 32A, 277–301 CrossRef CAS.
- S. Vashaee, M. Li, B. Newling, B. MacMillan, F. Marica, H. T. T. Kwak, J. Gao, A. M. M. Al-harbi and B. J. J. Balcom, J. Magn. Reson., 2018, 287, 113–122 CrossRef CAS PubMed.
- S. A. Willis, T. Stait-Gardner, A. M. Torres and W. S. Price, Diffusion NMR of Confined Systems: Fluid Transport in Porous Solids and Heterogeneous Materials, 2016, pp. 16–51 Search PubMed.
- J. Mitchell and T. C. Chandrasekera, J. Chem. Phys., 2014, 141, 224201 CrossRef CAS PubMed.
- P. C. Hansen, Inverse Probl., 1992, 8, 849–872 CrossRef.
- P. T. Callaghan, C. H. Arns, P. Galvosas, M. W. Hunter, Y. Qiao and K. E. Washburn, Magn. Reson. Imaging, 2007, 25, 441–444 CrossRef PubMed.
- Y.-Q. Song, L. Venkataramanan, M. D. Hürlimann, M. Flaum, P. Frulla and C. Straley, J. Magn. Reson., 2002, 154, 261–268 CrossRef CAS PubMed.
- K. Dunn, D. Bergman and G. LaTorraca, Nuclear magnetic resonance: Petrophysical and logging applications, Pergamon, 2002 Search PubMed.
- V. Bortolotti, R. J. S. Brown, P. Fantazzini, G. Landi and F. Zama, Inverse Probl., 2016, 33, 015003 CrossRef.
- B. Nicot, N. Vorapalawut, B. Rousseau, L. F. Madariaga, G. Hamon and J.-P. Korb, Petrophysics, 2016, 57, 19–29 Search PubMed.
- J. Mitchell, T. C. Chandrasekera and L. F. Gladden, Prog. Nucl. Magn. Reson. Spectrosc., 2012, 62, 34–50 CrossRef CAS PubMed.
- E. O. Stejskal and J. E. Tanner, J. Chem. Phys., 1965, 42, 288–292 CrossRef CAS.
- C. D’Agostino, J. Mitchell, L. F. Gladden and M. D. Mantle, J. Phys. Chem. C, 2012, 116, 8975–8982 CrossRef.
- M. Dvoyashkin, R. Valiullin and J. Kärger, Phys. Rev. E: Stat., Nonlinear, Soft Matter Phys., 2007, 75, 041202 CrossRef PubMed.
- D. E. Goldsack and R. Franchetto, Can. J. Chem., 1977, 55, 1062–1072 CrossRef CAS.
- M. D. Mantle, D. I. Enache, E. Nowicka, S. P. Davies, J. K. Edwards, C. D’Agostino, D. P. Mascarenhas, L. Durham, M. Sankar, D. W. Knight, L. F. Gladden, S. H. Taylor and G. J. Hutchings, J. Phys. Chem. C, 2011, 115, 1073–1079 CrossRef CAS.
- N. Robinson and C. D’Agostino, Top. Catal., 2020, 63, 319–327 CrossRef CAS.
- C. D’Agostino, R. Liuzzi, L. F. Gladden and S. Guido, Soft Matter, 2017, 13, 2952–2961 RSC.
- J. A. Ward-Williams, V. Karsten, C. M. Guédon, T. A. Baart, P. Munnik, A. J. Sederman, M. D. Mantle, Q. Zheng and L. F. Gladden, Chem.: Methods, 2022, 2, e202200025 CAS.
- C. Wang, Y. Mehmani and K. Xu, Proc. Natl. Acad. Sci. U. S. A., 2021, 118, e2024069118 CrossRef CAS PubMed.
- I. Zarikos, A. Terzis, S. M. Hassanizadeh and B. Weigand, Sci. Rep., 2018, 8, 13228 CrossRef CAS PubMed.
| This journal is © the Owner Societies 2024 |

