
 Open Access Article
 This Open Access Article is licensed under a
 Creative Commons Attribution 3.0 Unported Licence
The reduction behavior of sulfurized polyacrylonitrile (SPAN) in lithium–sulfur batteries using a carbonate electrolyte: a computational study†
S. V.
Klostermann
a,
J.
Kappler
b,
A.
Waigum
 a,
M. R.
Buchmeiser
b,
A.
Köhn
a and
J.
Kästner
*a
a,
M. R.
Buchmeiser
b,
A.
Köhn
a and
J.
Kästner
*a
aInstitute for Theoretical Chemistry, University of Stuttgart, Pfaffenwaldring 55, 70569 Stuttgart, Germany. E-mail: kaestner@theochem.uni-stuttgart.de
bInstitute of Polymer Chemistry, University of Stuttgart, Pfaffenwaldring 55, 70569 Stuttgart, Germany
First published on 28th February 2024
Abstract
Lithium–sulfur batteries (LSBs) have attracted attention due to their high theoretical energy density. This and various other advantages, such as the availability and non-toxicity of sulfur, raise interest in LSBs against the background of the energy revolution. However, a polysulfide shuttle mechanism can adversely affect the electrochemical performance of the cell. The sulfur redox properties are influenced, for example, by the electrolyte and the cathode material. Here, a computational study of the discharge process of an LSB with sulfurized poly(acrylonitrile) (SPAN) as the cathode material in combination with a carbonate electrolyte is presented. The nucleation of produced solid Li2S is compared to soluble Li2S. Dominating species are determined by comparing the Gibbs free energy of several species. We found that multiple lithiation steps occur before each Li2S detachment, preventing longer-chain polysulfide cleavage and a polysulfide shuttle. Through nucleating on the nitrogen-rich backbone of SPAN, Li2S units are stabilized by interactions with each other and with the nitrogen atoms. Experimental data show a potential drop and plateau during discharge, which is consistent with the calculated discharge profiles of SPAN with both soluble and nucleated Li2S, and hints at a direct solid–solid transition in the Li-SPAN cell during discharge when using carbonate-based electrolytes.
I. Introduction
By pledging the Paris Agreement as the European Green Deal, parties of the EU-27 agreed to reduce their total greenhouse gas (GHG) emissions by at least 40% of below 1990 levels by 2030 and to achieve net zero emissions by 2050.1 Amongst all sectors, the transport sector, including international aviation, accounts for nearly 30% of the total CO2 footprint in the EU.2 With the proposed target to decarbonize the transportation sector, there is a growing need for lightweight, cost-efficient, and environmentally benign batteries. In partcular in the aviation sector, the main technical challenge in implementing battery-powered aircraft is the gravimetric energy density of state-of-the-art batteries.3Lithium–sulfur-batteries (LSBs) utilize elemental lithium (3860 mA h g−1) and sulfur (α-S8; 1672 mA h g−1) as active materials, which results in high theoretical gravimetric energy densities of up to 2567 W h kg−1.4,5 In addition to its favorable electrochemical properties, elemental sulfur is non-toxic and broadly available on the raw material market due to the high production volume out of the hydrodesulfurization process (HDS, oil refinery) in contrast to Ni, Co, and Mn, which are commonly used in state-of-the-art cathodes in LIBs.6 Despite the multitude of the aforementioned favorable properties of this battery type, they have only been used rarely in technical applications to date. Major drawbacks of this battery chemistry are related to sulfur's redox properties. As carbonate electrolytes are prone to decomposition via a nucleophillic attack of intermediary polysulfides as described by Yim et al.,7 ether-based electrolytes are commonly used in LSBs.8,9 However, intermediary lithium polysulfides dissolve in these electrolytes and can migrate to the Li anode and reduce the concentration gradient. As a result, a continuous sulfur loss occurs, commonly referred to as the polysulfide shuttle mechanism.10 The density difference of α-S8 (ρ = ∼2.07 g cm−3) and Li2 S (ρ = ∼1.66 g cm−3) creates an internal mechanical stress in the cathode upon cycling due to volume contraction/expansion, ultimately leading to electrode delamination, particle cracking, and loss of electrical contact.11
Sulfurized poly(acrylonitrile) (SPAN) is a prominent cathode material with the potential to overcome a variety of the above mentioned drawbacks of conventional sulfur/S8-cathodes.12 Its high cycle stability and compatibility with various chemically different electrolytes and anodes (e.g., K, Na, Mg, Al, Li) make this cathode material an outstanding candidate for post-Li-ion cell chemistries.13 Furthermore, the carbonaceous backbone of SPAN allows the buffering of volume expansion and contraction due to the sheering of the graphitic planes in response to mechanical stress upon cycling.14 In particular, the stability of SPAN in carbonate electrolytes is a distinctive feature, as conventional metal–sulfur-batteries using a carbonate-based electrolyte only generate a stable cell behavior if combined with a cathode in which sulfur is addressed as allotropes with short chain length (γ-sulfur; S2–S4).7,15–17
Gathering insight into the redox behavior of SPAN and conventional S-cathodes by means of in situ or operando techniques is challenging due to the amorphicity of the material and its structural complexity, as well as the experimental and technical complexity of in situ measurements in general.18 Moreover, the high self-absorption of sulfur when applying X-ray absorption spectroscopy near the absorption edge (XANES), which is sensitive to the oxidation state or atomic surrounding of S, impedes precise quantitative analysis.19 These limitations motivate a theoretical approach to elucidate the lithiation behavior of SPAN on an atomic scale.
In recent years, SPAN has become the focus of theoretical research. Besides investigating the structural motifs in SPAN involving preferred conformers with inter- and intramolecular sulfur chains,20 the intercalation properties were also investigated. Theoretical studies are showing that SPAN can capture polysulfides21,22 and is not only a host material for lithium storage but also an active material exhibiting chemisorption of polysulfides in ether-based electrolytes. Apart from the elucidation of the discharge mechanism of SPAN in ether-based electrolytes,23,24 further theoretical work investigated the formation of a passivating solid–electrolyte interphase on the SPAN surface.25
Although the lithiation behavior of SPAN is crucial for the charge and discharge process, to our knowledge, no theoretical study has so far investigated this process in carbonate-based electrolytes, which is what we aim at here. For this purpose, a representative structural model for SPAN, which covers all chemical motifs and has an appropriate size for DFT calculations, is selected. The step-wise cleavage of a sulfur side-chain of SPAN in connection with the resulting redox potentials is investigated. Two approaches are pursued, with and without the nucleation of the nascent Li2S molecules at the backbone of SPAN.
II. Computational methods
All DFT calculations are carried out in ChemShell26,27via DL-FIND.28 Turbomole V7.4.129 is used for density functional theory (DFT) and the conductor-like screening model (COSMO)30 with a dielectric constant of ε = 89.831 for ethylene carbonate. All local coupled-cluster computations were performed using the MOLPRO program package (2022.1).32–34 These computations were run without COSMO, instead a correction for the solvation energy was computed at the HF level as ΔCOSMO = EHF,COSMO − EHF.A. Benchmark studies
DFT functionals for comparison comprise BP86-D3(BJ),35–38 cam-B3LYP,39 M06,40 PBE0-D3(BJ),41,42 TPSSh-D3(BJ),43 and B3LYP-D3(BJ)35,44 with the def2-SVP45 basis set, as well as PBEh-3c46 with the def2-mSVP46 basis set for geometry optimizations. At the optimized geometries, single-point energy calculations with the def2-TZVPD basis set47 were performed. For comparison of the optimized geometries, calculations with the second-order Møller–Plesset perturbation theory (MP2)48 with def2-SVP basis set were carried out using COSMO. Single point energies were compared to a high-level explicitly correlated local coupled-cluster (LCC) method (PNO-LCCSD(T)-F12)49–52 using the cc-pVTZ-F12 basis.53 Atomic charges based on the natural bond orbitals (NBO)54 scheme were calculated.B. Mechanistic investigations
As a result of the benchmark studies, see below, geometries were optimized at the PBEh-3c/def2-mSVP level to obtain the structures, the thermal correction, and free energy contributions at 300 K. On these optimized geometries, single-point energies were calculated at the cam-B3LYP/def2-TZVPD level of theory. Reaction paths were obtained by performing nudged-elastic band (NEB)55,56 calculations at the PBEh-3c/def2-mSVP level.Experimentally, the redox potential is usually measured against Li/Li+. In our computations, we model it through the Nernst equation:
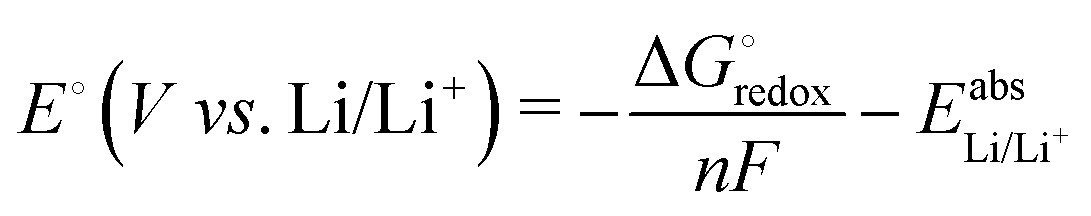 | (1) |
 is the Gibbs free energy difference (in eV) for a reaction with implicit solvation (ε = 89.8) involving the addition of n electrons, F is the Faraday constant (F = 1 eV V−1), and
 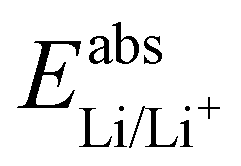 is the estimated absolute redox potential of Li/Li+. The latter cannot be calculated easily with our computational setup. Instead, we used secondary reference electrodes, namely Fe2+/Fe3+ and Cu2+/Cu3+. We calculated their absolute redox potentials with a computational setting as described previously,57i.e., with an explicit solvation sphere of 18 water molecules in addition to implicit solvation, but with the same level of theory used in all our further simulations. This resulted in
 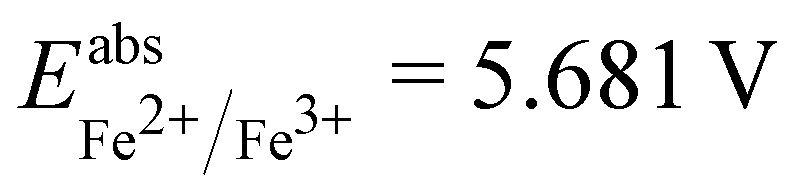 and
and 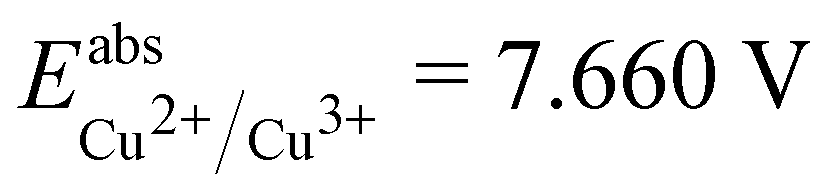 . From the difference between the experimental redox potentials of Fe2+/Fe3+ (
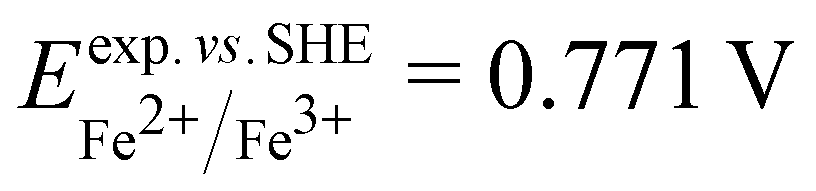 58) and Li/Li+ (
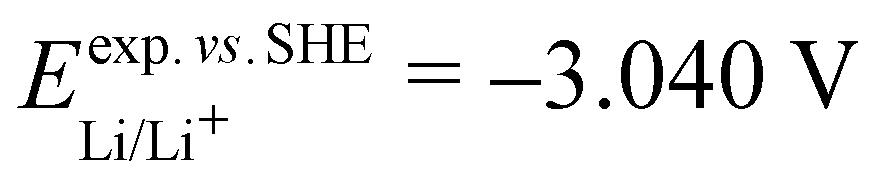 59) we can estimate
  . With Fe2+/Fe3+ as a secondary reference, we obtain
 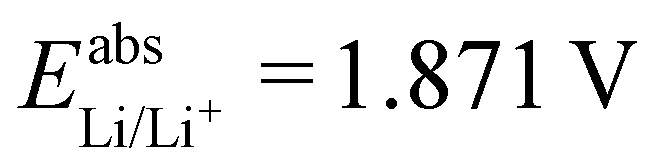 , while with Cu2+/Cu3+, we obtain
 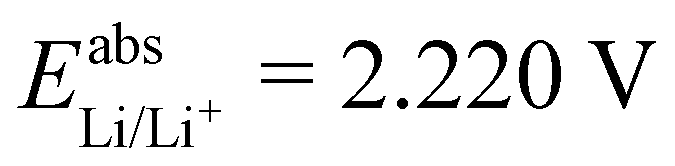 . For all results reported in this work, we use the average of these two values, namely
  .
.
The model structure for SPAN, see Fig. 1, was chosen according to the structure proposal by Buchmeiser et al.,60–62 containing a thioamide group and polysulfides bound in a vinylogous motif.63,64 Derived from the typical elemental composition (C, H, N, S) of SPAN, a chain length of S5 represents the statistically most probable length. The model chosen here represents the structural properties, considering only intramolecular sulfur chains.
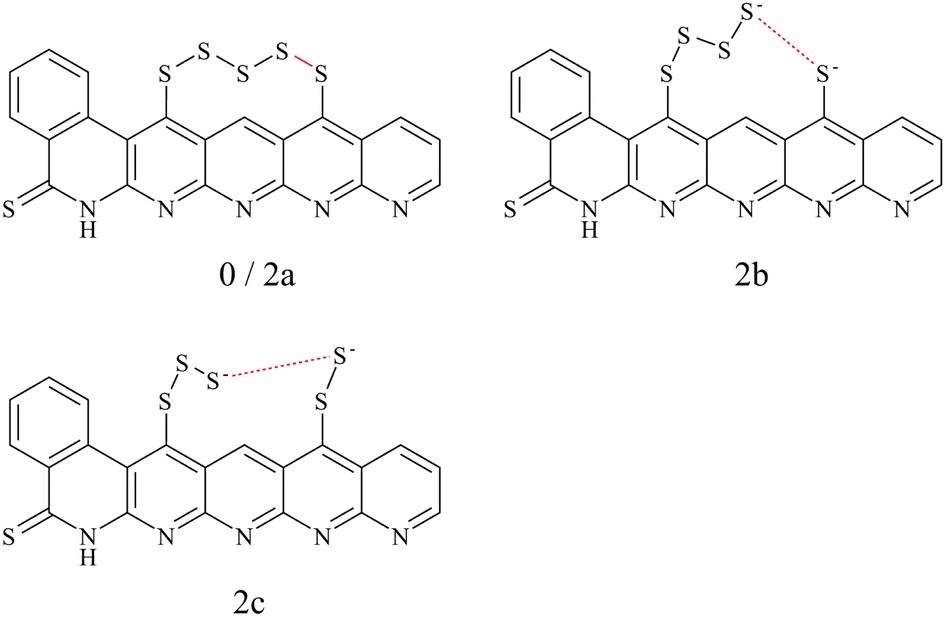 | ||
| Fig. 1 Schematic representation of the structures 0 (charge = 0e), 2a (charge = −2e) with intact S5 chain (both top left) 2b (charge = −2e) with the S4–S1 cleaved S5 chain (top right) and 2c with S3–S2 cleaved sulfur chain (bottom). The split S–S bond is marked in red. | ||
A variety of possible isomers was considered to obtain the minimum-energy structure for each redox state. This involved investigating various factors such as different Li+ placements, electron and Li+ addition, and detachment of Li2S. The objective is to identify the most suitable structure for each reduction step.
The naming convention of the states in this study follows the following scheme: x_Liy, where x denotes the number of electrons transferred to the initial, neutral SPAN model and y the number of bound lithium cations.
III. Results and discussion
A. Choice of the level of theory
To choose a suitable DFT functional for the following mechanistic investigations, we compared a series of functionals (see Section II A) to reference methods. Thereby, we distinguished between geometry optimizations and electronic energy calculations.We compared the uncharged structure 0 and the structures 2a and 2b with charge −2e (see Fig. 1). Structures 0 and 2a contain an intact S5 chain while it is cleaved in 2b. The goal of the comparison was to answer two questions: (i) How is the charge of the additional two electrons distributed? (ii) Does the negative charge result in a spontaneous breaking of the bond to 2b, or does the chain remain intact (2a) in the optimization?
The charges are compared in Table 1. We report the individual charge differences of the sulfur atoms S1 to S5, which make up the S5 chain and provide the sums of charges for other areas of the model. The exact division and detailed charges can be found in the ESI,† in Fig. S1 and Tables S1–S3. Carbons S refers to six carbon atoms at the side of the backbone close to the S5 chain, Carbons N refers to four carbon atoms between the nitrogen atoms of the backbone.
| Opt. structure | 2a | 2b | 2a | |||||
|---|---|---|---|---|---|---|---|---|
| Atom area | MP2 | BP86-D3(BJ) | TPSSh-D3(BJ) | B3LYP-D3(BJ) | M06 | cam-B3LYP | PBE0-D3(BJ) | PBEh-3c |
| S5 | −0.030 | −0.385 | −0.416 | −0.396 | −0.054 | −0.040 | −0.044 | −0.040 |
| S4 | −0.090 | −0.477 | −0.571 | −0.586 | −0.117 | −0.115 | −0.103 | −0.098 |
| S3 | −0.024 | 0.082 | 0.044 | 0.020 | −0.059 | −0.048 | −0.056 | 0.047 |
| S2 | −0.064 | −0.177 | −0.147 | −0.145 | −0.082 | −0.067 | −0.073 | −0.073 |
| S1 | −0.033 | −0.209 | −0.166 | −0.160 | −0.038 | −0.033 | −0.035 | −0.032 |
| Σ S5 chain | −0.241 | −1.166 | −1.256 | −1.266 | −0.350 | −0.302 | −0.311 | −0.291 |
| S (thione) | −0.202 | −0.096 | −0.087 | −0.089 | −0.193 | −0.188 | −0.209 | −0.211 |
| Carbons S | −0.645 | −0.188 | −0.165 | −0.164 | −0.531 | −0.531 | −0.532 | −0.567 |
| Carbons N | −0.165 | −0.075 | −0.059 | −0.055 | −0.116 | −0.116 | −0.108 | −0.111 |
| Σ Nitrogen | −0.263 | −0.227 | −0.223 | −0.223 | −0.305 | −0.344 | −0.328 | −0.324 |
It is particularly important for the investigation of SPAN reduction that the S–S bonds are well-described. Indications for that are a proper structure and a proper charge distribution.
After geometry optimization of the charged structures, MP2 and four of the functionals result in metastable structure 2a, in which the S5 chain remains intact. Here, most of the additional charge is located in the thione moiety and the carbon atoms close to the S5 chain. In contrast, three of the tested functionals lead to the spontaneous breaking of the bond between S1 and S2 and, thus, to structure 2b. Here, the majority of the charge localizes in the S5 chain, especially in the atoms S1 and S2. Where comparable, 2b has a lower energy than 2a as can be seen in the ESI,† Table S4.
The S4–S5 sulfur bond lengths, on which most of the charge difference is located, are compared in Table 2. Here, it is obvious that all the functionals lead to longer bond lengths than MP2 (which results in 2.09 Å). The closest to the MP2 reference is PBEh-3c (2.13 Å), which also shows reasonable charges. Thus, we found PBEh-3c/def2-mSVP to be the most suitable method for optimizing the geometries.
| MP2 | BP86-D3(BJ) | TPSSh-D3(BJ) | B3LYP-D3(BJ) | M06 | cam-B3LYP | PBE0-D3(BJ) | PBEh-3c | |
|---|---|---|---|---|---|---|---|---|
| Structure | 2a | 2b | 2b | 2b | 2a | 2a | 2a | 2a |
| S4–S5 Bond length/Å | 2.09 | — | — | — | 2.20 | 2.19 | 2.16 | 2.13 |
The resulting energies are listed in Table 3. The hybrid DFT functional PBE0-D3(BJ) results in a significant endothermic process with a mean difference value to the LCC energies of 0.139 eV. The smallest mean deviation of −0.055 eV from the coupled-cluster values is achieved with the range-separated cam-B3LYP functional. Consequently, we calculated energy differences with cam-B3LYP in the following investigations of the discharge mechanism.
| Structure | LCC | M06 | cam-B3LYP | PBE0-D3(BJ) | PBEh-3c | ||||
|---|---|---|---|---|---|---|---|---|---|
| 2a | −7.528 | −7.575 | −0.047 | −7.547 | −0.019 | −7.657 | −0.129 | −7.844 | −0.316 |
| 2b | −8.511 | −8.348 | 0.163 | −8.536 | −0.024 | −8.218 | 0.294 | −8.581 | −0.070 |
| 2c | −8.090 | −7.911 | 0.178 | −8.123 | −0.123 | −7.837 | 0.252 | −8.239 | −0.150 |
| Mean Δ to LCC | — | 0.098 | −0.055 | 0.139 | −0.179 | ||||
B. The discharge mechanism
One of the main challenges of LSBs is the low capacity and the degradation of the cells during charging and discharging. The main reason for this is the solubility of the resulting long-chain polysulfide intermediates in ether-based electrolytes. These can migrate through the electrolyte to the anode, which represents an irreversible loss of active material (polysulfide shuttle).63,64 By employing SPAN as a cathode material, the use of carbonate-based electrolytes, in which polysulfides are insoluble, is possible. Experiments indicate that during the discharge process in carbonate-based electrolytes, the formation of long-chain polysulfides is suppressed, and insoluble Li2S is formed directly.66 This direct solid–solid transformation results in a higher cyclability and higher cell capacity because nucleation at the backbone during the discharge process allows reversible storage of Li2S. The redox chemistry of the SPAN cathode in carbonate-based electrolytes is part of our investigations because, despite being crucial for the understanding of lithium storage during discharge, to the best of our knowledge, it has not been investigated theoretically so far. In the following, we will discuss our results of the discharge mechanism first under the assumption that Li2S is dissolved in ethylene carbonate (EC) and then assuming that Li2S nucleates at the SPAN backbone to clarify the differences that result in the mechanism energetically and consequently electrochemically.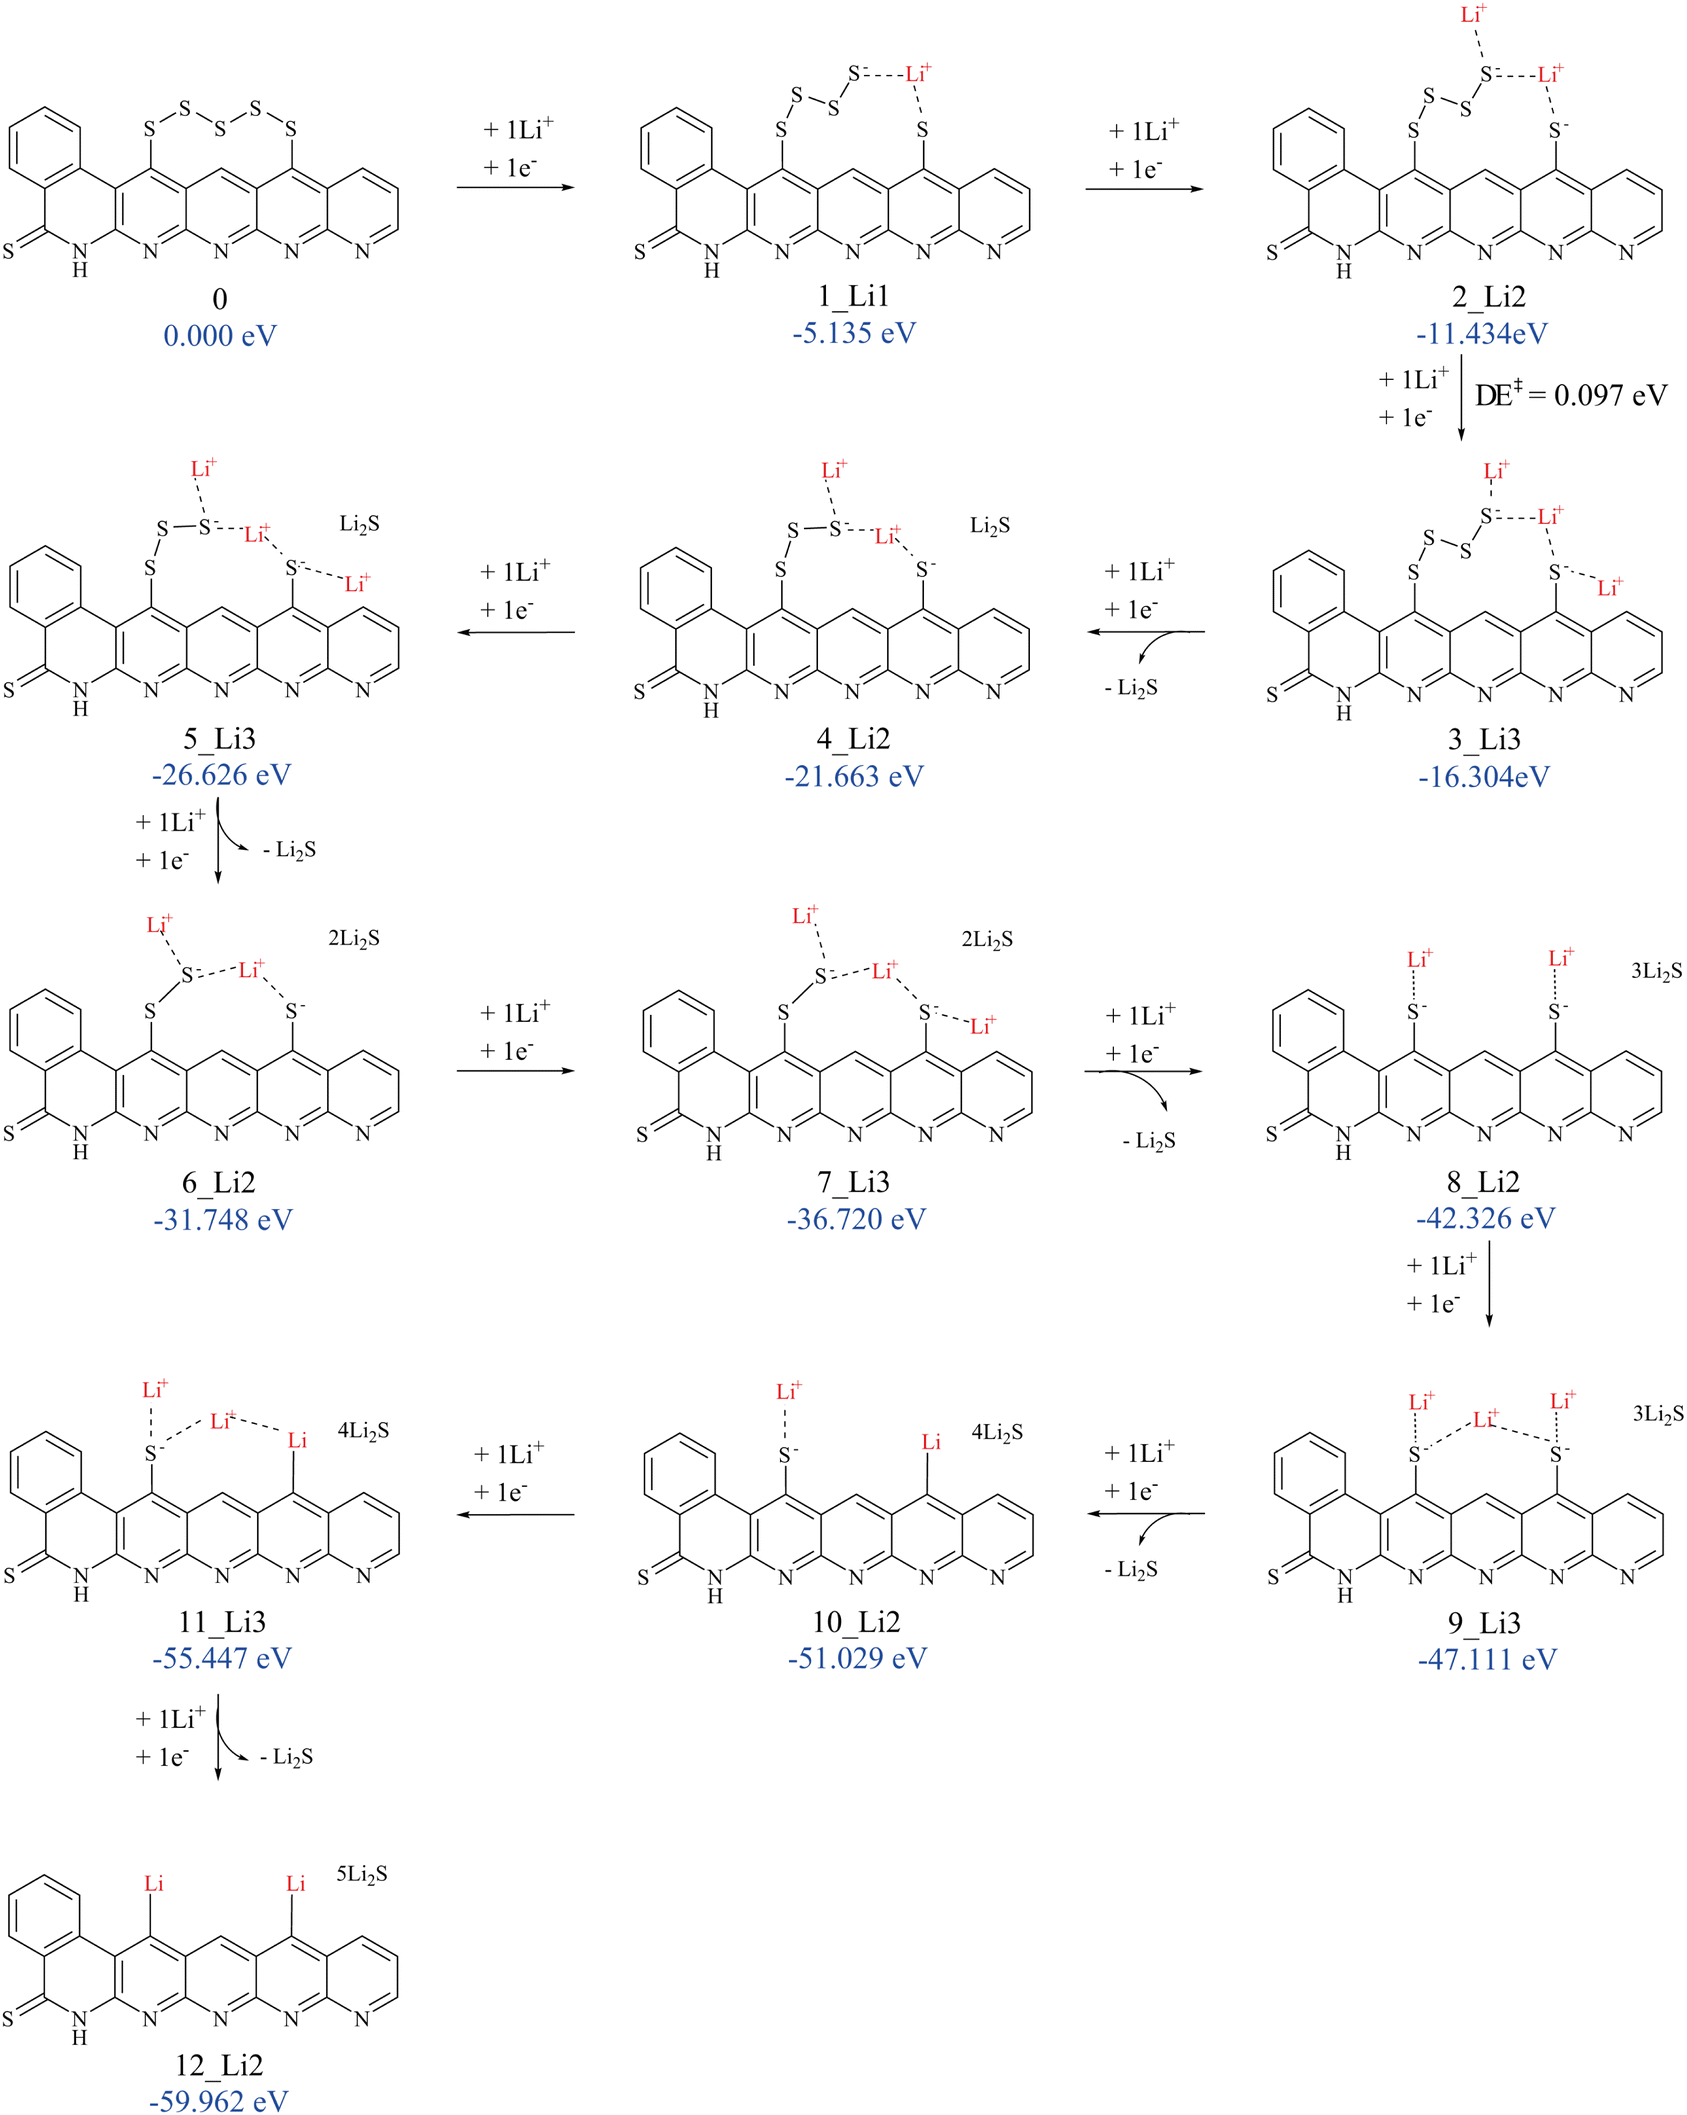 | ||
| Fig. 2 Schematic representation of the proposed reduction mechanism of SPAN assuming soluble Li2S. | ||
The addition of the first electron to our SPAN model 0 leads to 1_Li0 and is strongly exergonic by 4.143 eV, corresponding to an absolute redox potential of 4.143 V. During the discharge process, Li+ ions are produced at the anode. These are mobile and are also available at the cathode. Furthermore, Li+ is required for the electrochemical formation of Li2S during the discharge process. Thus, we have to take the association of Li+ to our SPAN model into account. Attaching one Li+ ion from the solution to structure 0 is exergonic by 0.523 eV. However, attaching one Li+ ion to the anionic reduced form 1_Li0 is already exergonic by 0.992 eV. After a further reduction step of 1_Li0 to 2_Li0, attaching one Li+ ion is even more exergonic, by 1.752 eV. The geometries of 1_Li0 and 2_Li0 are very similar to that of 0 and, therefore, not shown. Details are provided in Table S6 of the ESI.† Thus, under standard concentrations, one Li+ ion is expected to attach to our model in a concerted manner already at the first reduction step. Qualitatively, the same holds for all subsequent reduction steps. The first exergonic Li+ addition is possible for concerted transfers of electrons and Li+ ions, which is what we focus on in the following discussion. To test where the Li+ ions are likely to attach at each step, different placements were considered and compared based on their energy differences. One indication for likely binding sites was the spin density of open-shell reduced intermediates. We found that spin density, which is often better localized, is more appropriate than the charge density to find out where the electron of the last reduction is preferentially located. Four different possible sites for Li+ were tried in each of the first three reduction steps, fewer for the subsequent steps. The one with the lowest Gibbs energy for each step was considered for the continuation of the discharge cycle. Details and exemplary images of the spin densities are given in the ESI.†
The binding of Li+ ions was found to possess only low barriers. As an example, we discuss the barrier of the third Li+ addition, i.e., the step from 2_Li2 to 3_Li3 based on electronic energies at the PBEh-3c/def2-mSVP level of theory. Reducing 2_Li2 by one electron and placing a Li+ ion 10.35 Å away from the nearest sulfur atom lowers the energy by 4.579 eV compared to 2_Li2. Starting from that, the further approach of Li+ lowers the energy by 0.029 eV. The actual attachment of Li+ requires overcoming a barrier of merely 0.097 eV, which is small compared to the thermal energy at ambient conditions of (0.025 eV). Thus, we expect kinetic effects to play only a negligible role in the discharge process and focus the following discussion on equilibrium states.
Overall, the combination of two elementary processes is observed during the discharge: (i) lithiation of the sulfur chain by the addition of a Li+ cation with the concerted transfer of an electron, and (ii) the detachment of a Li2S molecule from the cleaved sulfur chain. We found step (ii) to be exergonic always in conjunction with (i). This conjunction can be explained by the low lithiation barrier found and the expected rapid accessibility of the lithium cations due to their assumed uniform distribution in the cathode material. As a consequence, this allows simultaneous lithiation during Li2S detachment with an accompanying electron transfer, which is also energetically favored.
Already the first addition of an electron/Li+ pair leads to the breaking of the S5 chain into an S1 and an S4 part. As discussed in the Computational methods section, we find that the S4–S5 bond breaks preferentially. Our lowest-energy solutions consistently contain a bridging lithium cation between the two residues of the cleaved sulfur chain. The lowest-energy sites for further Li+ placements are at the free end of the longer sulfur chain, where a large part of the charge is localized according to the population analysis (see also Section 3.1.1).
Upon reduction of 3_Li3, we find that the electron and Li+ transfer triggers the first detachment of Li2S, resulting in 4_Li2, as can be seen in Table 4. Direct addition of an electron and Li+ to 3_Li3 would result in 4_Li4 with an energy of 1.063 eV higher than 4_Li2 + Li2S in solution. Alternatives, like another abstraction of Li2S yielding 4_Li1, are higher in energy, 1.102 eV above 4_Li2. One could also envisage that Li2S is split off 3_Li3 upon its formation in the third reduction step. However, we found the resulting structure 3Li_1 to be 0.881 eV higher in energy than 3_Li3. The resulting structure 4_Li2 has a bridging lithium cation and a lithium cation at the free end of the remaining S3 chain.
| System | ΔG°/eV | Step |
|---|---|---|
| 3_Li3 | 0.000 | |
| 3_Li1 + Li2S | 0.891 | Detachment |
| 4_Li2 + Li2S | −5.359 | Detachment + Li+/e− |
| 4_Li4 | −4.296 | Li+/e− |
| 4_Li0 + 2Li2S | −1.938 | Detachment |
| 5_Li1 + 2Li2S | −9.472 | Detachment + Li+/e− |
| 5_Li3 + 1Li2S | −10.322 | Li+/e− |
The attachment of a further Li+ in the subsequent reduction step results in 5_Li3, where one Li+ ion bridges the remains of the sulfur chain. The next Li2S detachment is found after one more reduction step with another lithium cation/electron addition, resulting in the structure 6_Li2. After the next two reduction steps, resulting in a further Li2S detachment with a further Li+ attachment, the resulting structure 8_Li2 has two remaining sulfur atoms, which are now coordinated to Li+. This state may well be the end of the regular discharge process. Further addition of a lithium cation and an electron causes one of the remaining sulfur atoms, which are covalently bound to the carbon backbone via a C–S bond, to be detached as Li2S. The vacant site is saturated by a lithium cation. While these processes are still exergonic, the associated cell potentials show a noticeable drop, see below.
In 12_Li2, where the two remaining sulfur atoms are detached from the SPAN backbone, all theoretically available sulfur was transformed into Li2S by solid-state transitions.
The first four reaction steps are the same as in the mechanism with soluble Li2S, since no Li2S is formed yet. Attaching Li2S to the backbone is exergonic by 0.750 eV in 4_Li2. Almost all subsequent intermediates are also lower in energy when Li2S nucleation is considered, see Table 5. One example of a resulting geometry is depicted in Fig. 3, where 6_Li2 is shown with its two nucleated Li2S units. It can be seen that the nucleated Li2S units interact with each other in addition to the nitrogen atoms. This ensures the reversible accessibility of lithium. Due to the internal Li2S interaction, proximity to the SPAN backbone can be facilitated even with increased Li2S formation, preventing the loss of active material to the electrolytes.
| n | Soluble | Nucleation | Δ |
|---|---|---|---|
| 0 | 0.000 | 0.000 | 0.000 |
| 1 | −5.135 | −5.135 | 0.000 |
| 2 | −11.434 | −11.434 | 0.000 |
| 3 | −16.304 | −16.304 | 0.000 |
| 4 | −21.663 | −21.977 | −0.314 |
| 5 | −26.626 | −26.193 | 0.432 |
| 6 | −31.784 | −32.615 | −0.831 |
| 7 | −36.720 | −37.697 | −0.977 |
| 8 | −42.326 | −42.296 | 0.030 |
| 9 | −47.111 | −47.283 | −0.172 |
| 10 | −51.029 | −50.572 | 0.457 |
| 11 | −55.447 | −54.390 | 1.058 |
| 12 | −59.962 | −61.320 | −1.358 |
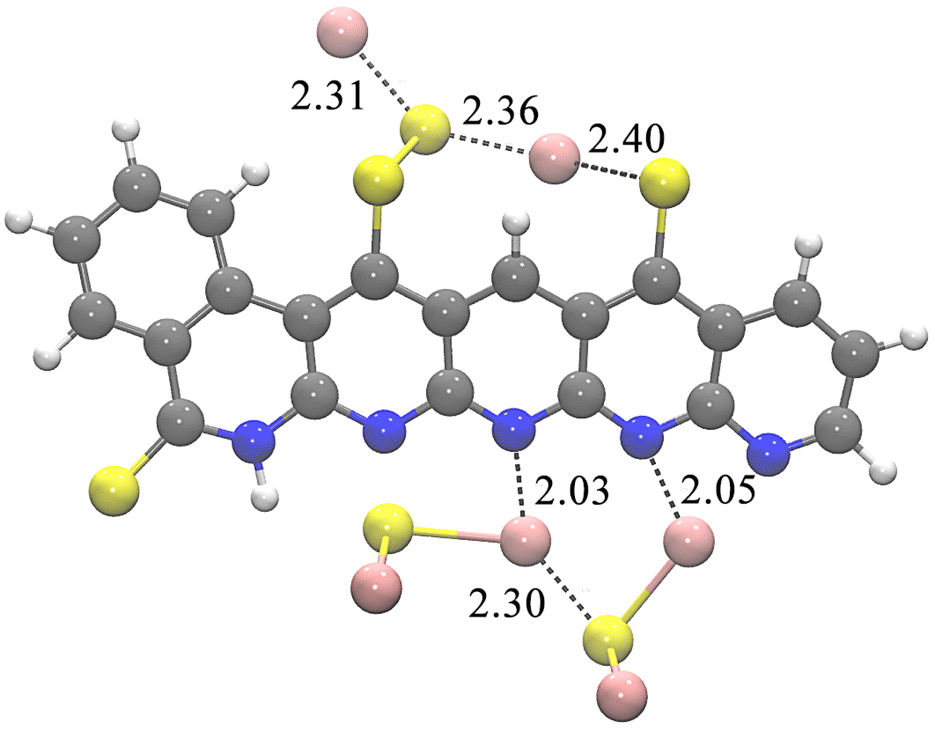 | ||
| Fig. 3 Structure 6_Li2 with two Li2S units nucleated at the SPAN backbone. Distances in Å. Color coding: grey = carbon, blue = nitrogen, yellow = sulfur, pink = lithium, white = hydrogen. | ||
For a given E°, the Gibbs free energy of each species can be calculated according to
 | (2) |
| G(E°) = −5.135 eV + 1·F(E° + 2.045 V). | (3) |
Using eqn (2), we can compare the Gibbs free energies of all species. The ratio of the concentrations of two species in equilibrium can be calculated by
 | (4) |
All Gibbs free energies of the mechanism with soluble Li2S are depicted in Fig. 4, those for nucleated Li2S in Fig. 5. At large E°, structure 0 has the lowest free energy. This means that at the end of the charging process, i.e., when the externally applied voltage is high, structure 0 dominates among those states that we considered. According to our results in Fig. 4, the fully charged cell shows a potential E° = 3.672 V vs. Li/Li+. At that cell potential, the lines G(E°) for structures 0 and 2_Li2 intersect, 0 is converted to 2_Li2 taking up two electrons in the discharge process. It is also obvious from Fig. 4 that the Gibbs free energy of species 1_Li1 is always higher than that of 0 or 2_Li2. This means that whenever 1_Li1 is formed, it disproportionates and never dominates any equilibrium. The same holds for species 3_Li3, 4_Li2, 5_Li1, 6_Li2, 7_Li2, 10_Li2 and 11_Li3 (see Fig. 2). In contrast, the species 0, 2_Li2, 8_Li2, 9_Li3, and 12_Li2 dominate along the discharge process assuming soluble Li2S. They form the convex hull in Fig. 4. The values of E° of their intersection points are the cell potentials that can be found during the discharge process.
 | ||
| Fig. 4 Free energy G(E°) of the individual species during the discharge with soluble Li2S vs. the cell potential. | ||
 | ||
| Fig. 5 Free energy G(E°) of the individual species during the discharge process with Li2S nucleation vs. the cell potential. | ||
Using eqn (2) and (4), we can calculate the concentrations of all species at each value of the potential. From their changes, we can derive the number of consumed electrons, which leads to the discharge curves shown in Fig. 6.
 | ||
| Fig. 6 Discharge curve of the cell potential vs. the number of electrons for soluble Li2S and nucleated Li2S. | ||
It can be seen that the S5 chain receives the first two electrons paired with lithium cations starting at a cell voltage of 3.672 V vs. Li/Li+, which is also where the splitting of the chain occurs. The next 6 electrons, which also involve the detachment of 3Li2S units are obtained at a cell voltage around 3.104 V for soluble Li2S. Taking Li2S nucleation into account (see Fig. 5, 2 of the 6 electrons are transferred at a cell voltage of around 3.672 V). At around 2.741 V, 9 electrons per S5 chain have been transferred. At lower cell voltage (2.238 V) for soluble Li2S and 2.748 V for nucleated Li2S, the remaining two sulfur atoms at the SPAN backbone are gradually removed, cleaved off as Li2S, C–Li bonds are formed, and another three electrons are transferred. The transfer of these last 3 electrons may be seen as deep discharge.
The two discharge processes we discuss here can only be interpreted as representatives of the real system. Structural variations in the SPAN backbone and additional species in the battery material are expected to lead to a smearing of the discrete potential steps depicted in Fig. 6. Moreover, we derive the discharge curve purely from equilibrium properties and assume fast redox reactions compared to the speed of the discharge. Kinetic effects may further change the discharge curve.
C. Discussion and relation to the experiment
Our investigations of the discharge mechanism show step-wise detachment of sulfur as Li2S by the coupled accumulation of lithium cations and electrons. The lithium is found to be incorporated at the nitrogen-rich backbone of the SPAN matrix by nucleation.The steps of the discharge mechanism, as found here, show multiple lithiation before each detachment of Li2S. This may be due to the stabilizing effect of the lithium cations, which were found to preferentially reside between the two negatively charged ends of the sulfur chain. Through such bridging lithium cations and other cations surrounding the free chain ends, the negative charge delivered by the transferred electrons to the entire SPAN matrix and the free sulfur ends can be stabilized. Cleavage of longer-chain polysulfide intermediates is suppressed.
The DFT studies suggest a mechanism how Li2S nucleates at the nitrogen-rich SPAN backbone. We particularly point out the interactions between the Li2S units, which, in addition to their interaction with the nitrogen atom of the SPAN backbone, have a stabilizing effect and may facilitate the direct solid–solid transition, ensuring the reversible availability of lithium.
Comparison of the free energies of the different species along the discharge process provides information on the dominant species at each cell potential. Obtaining the transferred charge from the change in concentration, we are able to simulate an idealized discharge curve. Such a curve can directly be compared to experimental discharge curves like the one shown in Fig. 7. However, our DFT result is idealized in several ways. First, we assume the instantaneous formation of an equilibrium. In a real cell, the diffusion of Li+ will limit the equilibration, smoothing the discharge curve. Moreover, we take only one structural model of SPAN into account. In the real cell, different sulfur chain lengths and different structural features and environments of the sulfur chains will be present. While we consider our model to be representative, the real variability will lead to a further smoothing of the discharge curve. It should also be noted that the cell potential vs. Li/Li+ that we obtain is somewhat overestimated compared to experimental data from Fig. 7. This can also be caused by our assumption of instantaneous equilibration or, e.g., by inaccuracies in our estimation of the Li/Li+ reference.
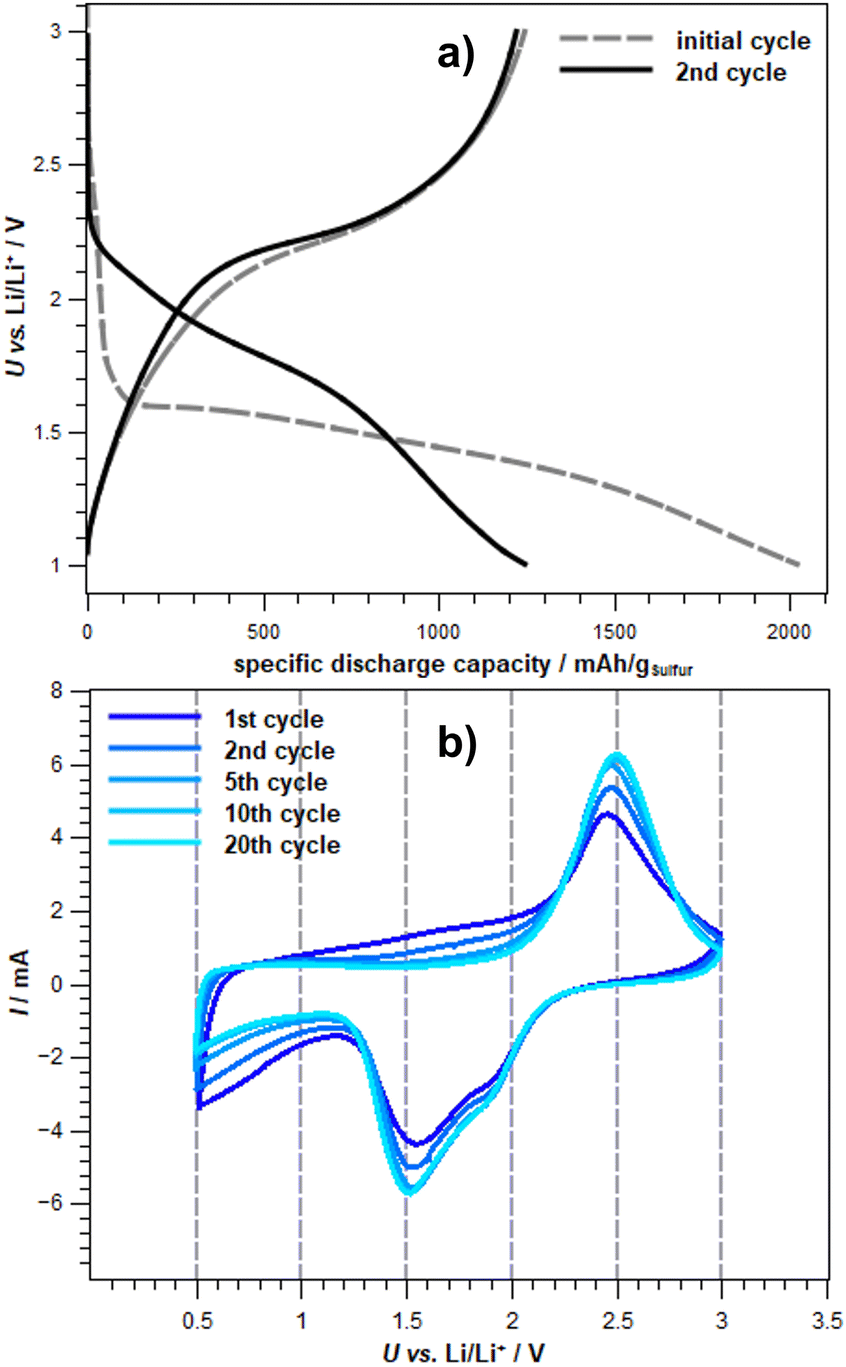 | ||
Fig. 7 Experimental (a) potential profile (0.2C) of the initial and second cycle and (b) cyclovoltammograms of exemplary cycles of Li-SPAN cells in a carbonate electrolyte. Electrolyte: 1 M LiPF6 in DMC:EC (V:V – 1![[thin space (1/6-em)]](https://www.rsc.org/images/entities/char_2009.gif) :1) + 10 wt% – FEC vs. Li/Li+.66 :1) + 10 wt% – FEC vs. Li/Li+.66 | ||
In order to substantiate this postulate, experimental data (see Fig. 7) can be used. Fig. 7a on the top shows the potential profile of an exemplary Li-SPAN cell in a carbonate-based electrolyte. The initial discharge of the cell exhibits a sharp potential drop at the beginning and forms a plateau at about 1.6 V. This is consistent with the potential curve shown in Fig. 6 as a function of electrons transferred. It should be mentioned that the calculated redox potentials show only the decomposition potentials of the S5 chain chosen as representative. In the cyclovoltammogram (CV) of the same exemplary Li-SPAN cell, reduction potentials at 1.8 V and 1.5 V are visible, which speak for a direct solid–solid transition, since a reduced reduction range is recognizable in comparison to liquid–solid transitions.
IV. Conclusion
The discharge mechanism of a Li-SPAN cell with a carbonate-based electrolyte was investigated based on DFT simulations. We found that the discharge occurs in a step-wise reduction of the sulfur chain forming Li2S in a solid–solid transition. We found the nucleation of Li2S at the SPAN backbone to be energetically favored. It facilitates the re-use of sulfur in the subsequent charging process and avoids material loss. Our resulting discharge curve, while showing several discrete potential drops, generally agrees with the available experimental data.Conflicts of interest
There are no conflicts to declare.Acknowledgements
The authors acknowledge support by the state of Baden-Württemberg through bwHPC and the German Research Foundation (DFG) through grant no INST 40/575-1 FUGG (JUSTUS 2 cluster). We thank the Deutsche Forschungsgemeinschaft (DFG, German Research Foundation) for supporting this work by funding – EXC2075 – 390740016 under Germany's Excellence Strategy. We acknowledge the support by the Stuttgart Center for Simulation Science (SimTech).References
- M. Siddi, et al. , UPI REPORT, 2020, 114, 1–14 Search PubMed.
- M. Robaina and A. Neves, Res. Transp. Econ., 2021, 90, 101074 CrossRef.
- A. Barke, W. Cistjakov, D. Steckermeier, C. Thies, J.-L. Popien, P. Michalowski, S. Pinheiro Melo, F. Cerdas, C. Herrmann and U. Krewer, et al. , J. Ind. Ecol., 2022, 27, 795–810 CrossRef.
- L. F. Nazar, M. Cuisinier and Q. Pang, MRS Bull., 2014, 39, 436–442 CrossRef CAS.
- P. G. Bruce, L. J. Hardwick and K. Abraham, MRS Bull., 2011, 36, 506–512 CrossRef CAS.
- B. Meyer, Chem. Rev., 1976, 76, 367–388 CrossRef CAS.
- T. Yim, M.-S. Park, J.-S. Yu, K. J. Kim, K. Y. Im, J.-H. Kim, G. Jeong, Y. N. Jo, S.-G. Woo and K. S. Kang, et al. , Electrochim. Acta, 2013, 107, 454–460 CrossRef CAS.
- S. S. Zhang, J. Power Sources, 2013, 231, 153–162 CrossRef CAS.
- Y. Liu, Y. Elias, J. Meng, D. Aurbach, R. Zou, D. Xia and Q. Pang, Joule, 2021, 5, 2323–2364 CrossRef CAS.
- M. Wild, L. O'neill, T. Zhang, R. Purkayastha, G. Minton, M. Marinescu and G. Offer, Energy Environ. Sci., 2015, 8, 3477–3494 RSC.
- S. Waluś, G. Offer, I. Hunt, Y. Patel, T. Stockley, J. Williams and R. Purkayastha, Energy Storage Mater., 2018, 10, 233–245 CrossRef.
- X. Zhao, C. Wang, Z. Li, X. Hu, A. A. Razzaq and Z. Deng, J. Mater. Chem. A, 2021, 9, 19282–19297 RSC.
- M. S. Ahmed, S. Lee, M. Agostini, M.-G. Jeong, H.-G. Jung, J. Ming, Y.-K. Sun, J. Kim and J.-Y. Hwang, Adv. Sci., 2021, 8, 2101123 CrossRef CAS PubMed.
- S. Perez Beltran and P. B. Balbuena, J. Phys. Chem. C, 2021, 125, 13185–13194 CrossRef CAS.
- L. Wang, X. He, J. Li, M. Chen, J. Gao and C. Jiang, Electrochim. Acta, 2012, 72, 114–119 CrossRef CAS.
- Z. Wu, S.-M. Bak, Z. Shadike, S. Yu, E. Hu, X. Xing, Y. Du, X.-Q. Yang, H. Liu and P. Liu, ACS Appl. Mater. Interfaces, 2021, 13, 31733–31740 CrossRef CAS PubMed.
- R. Pai, A. Singh, M. H. Tang and V. Kalra, Commun. Chem., 2022, 5, 17 CrossRef CAS PubMed.
- J. Tan, D. Liu, X. Xu and L. Mai, Nanoscale, 2017, 9, 19001–19016 RSC.
- G. Almkvist, K. Boye and I. Persson, J. Synchrotron Rad., 2010, 17, 683–688 CrossRef CAS PubMed.
- T. Zhu, J. E. Mueller, M. Hanauer, U. Sauter and T. Jacob, ChemElectroChem, 2017, 4, 2494–2499 CrossRef CAS.
- S. Bertolini and T. Jacob, ACS Omega, 2021, 6, 9700–9708 CrossRef CAS PubMed.
- S. Bertolini and T. Jacob, Electrochem. Sci. Adv., 2022, 2, e2100129 CrossRef CAS.
- T. Zhu, J. E. Mueller, M. Hanauer, U. Sauter and T. Jacob, ChemElectroChem, 2017, 4, 2975–2980 CrossRef CAS.
- S. Perez Beltran and P. B. Balbuena, ACS Appl. Mater. Interfaces, 2020, 13, 491–502 CrossRef PubMed.
- S. P. Beltran and P. B. Balbuena, J. Mater. Chem. A, 2021, 9, 7888–7902 RSC.
- P. Sherwood, A. H. de Vries, M. F. Guest, G. Schreckenbach, C. R. A. Catlow, S. A. French, A. A. Sokol, S. T. Bromley, W. Thiel and A. J. Turner, et al. , J. Mol. Struct., 2003, 632, 1–28 CrossRef CAS.
- S. Metz, J. Kästner, A. A. Sokol, T. W. Keal and P. Sherwood, Wiley Interdiscip. Rev.: Comput. Mol. Sci., 2014, 4, 101–110 CAS.
- J. Kästner, J. M. Carr, T. W. Keal, W. Thiel, A. Wander and P. Sherwood, J. Phys. Chem. A, 2009, 113, 11856–11865 CrossRef PubMed.
- University of Karlsruhe and Forschungszentrum Karlsruhe GmbH, TURBOMOLE V7.4.5 2019, 1989-2007, available from https://www.turbomole.com.
- A. Klamt and G. Schüürmann, J. Chem. Soc., Perkin Trans. 2, 1993, 799–805 RSC.
- W. M. Haynes, CRC handbook of chemistry and physics, CRC Press, 2014 Search PubMed.
- H.-J. Werner, P. J. Knowles, G. Knizia, F. R. Manby and M. Schütz, Wiley Interdiscip. Rev. Comput. Mol. Sci., 2012, 2, 242–253 CrossRef CAS.
- H.-J. Werner, P. J. Knowles, F. R. Manby, J. A. Black, K. Doll, A. Heßelmann, D. Kats, A. Köhn, T. Korona and D. A. Kreplin, et al. , Chem. Phys., 2020, 152, 144107 CAS.
- H.-J. Werner and P. J. Knowles, et al. MOLPRO, 2022.1, a package of ab initio programs, https://molpro.net/.
- A. D. Becke, Phys. Rev. A: At., Mol., Opt. Phys., 1988, 38, 3098 CrossRef CAS PubMed.
- J. P. Perdew, Phys. Rev. B: Condens. Matter Mater. Phys., 1986, 33, 8822 CrossRef PubMed.
- S. Grimme, J. Antony, S. Ehrlich and H. Krieg, J. Chem. Phys., 2010, 132, 154104 CrossRef PubMed.
- S. Grimme, S. Ehrlich and L. Goerigk, J. Comput. Chem., 2011, 32, 1456–1465 CrossRef CAS PubMed.
- T. Yanai, D. P. Tew and N. C. Handy, Chem. Phys. Lett., 2004, 393, 51–57 CrossRef CAS.
- Y. Zhao and D. G. Truhlar, Theor. Chem. Acc., 2008, 120, 215–241 Search PubMed.
- J. P. Perdew, K. Burke and M. Ernzerhof, Phys. Rev. Lett., 1996, 77, 3865 CrossRef CAS PubMed.
- C. Adamo and V. Barone, J. Chem. Phys., 1999, 110, 6158–6170 CrossRef CAS.
- J. Tao, J. P. Perdew, V. N. Staroverov and G. E. Scuseria, Phys. Rev. Lett., 2003, 91, 146401 CrossRef PubMed.
- C. Lee, W. Yang and R. G. Parr, Phys. Rev. B: Condens. Matter Mater. Phys., 1988, 37, 785 CrossRef CAS PubMed.
- F. Weigend and R. Ahlrichs, Phys. Chem. Chem. Phys., 2005, 7, 3297–3305 RSC.
- S. Grimme, J. G. Brandenburg, C. Bannwarth and A. Hansen, J. Chem. Phys., 2015, 143, 054107 CrossRef PubMed.
- F. Weigend, Phys. Chem. Chem. Phys., 2006, 8, 1057–1065 RSC.
- C. Møller and M. S. Plesset, Phys. Rev., 1934, 46, 618 CrossRef.
- Q. Ma and H.-J. Werner, Wiley Interdiscip. Rev.: Comput. Mol. Sci., 2018, 8, e1371 Search PubMed.
- M. Schwilk, Q. Ma, C. Köppl and H.-J. Werner, J. Chem. Theory Comput., 2017, 13, 3650–3675 CrossRef CAS PubMed.
- Q. Ma, M. Schwilk, C. Köppl and H.-J. Werner, J. Chem. Theory Comput., 2017, 13, 4871–4896 CrossRef CAS PubMed.
- Q. Ma and H.-J. Werner, J. Chem. Theory Comput., 2018, 14, 198–215 CrossRef CAS PubMed.
- K. A. Peterson, T. B. Adler and H.-J. Werner, Chem. Phys., 2008, 128, 084102 Search PubMed.
- A. E. Reed, L. A. Curtiss and F. Weinhold, Chem. Rev., 1988, 88, 899–926 CrossRef CAS.
- H. Jónsson, G. Mills and K. W. Jacobsen, Classical and quantum dynamics in condensed phase simulations, World Scientific, 1998, pp. 385–404 Search PubMed.
- G. Henkelman, B. P. Uberuaga and H. Jónsson, Chem. Phys., 2000, 113, 9901–9904 CAS.
- M. Uudsemaa and T. Tamm, J. Phys. Chem. A, 2003, 107, 9997–10003 CrossRef CAS.
- W. C. Schumb, M. S. Sherrill and S. B. Sweetser, J. Am. Chem. Soc., 1937, 59, 2360–2365 CrossRef CAS.
- N. Wiberg, E. Wiberg and A. F. Holleman, Lehrbuch der Anorganischen Chemie, 102. Aufl, 2007 Search PubMed.
- J. Fanous, M. Wegner, J. Grimminger, A. Andresen and M. R. Buchmeiser, Chem. Mater., 2011, 23, 5024–5028 CrossRef CAS.
- J. Fanous, M. Wegner, J. Grimminger, M. Rolff, M. B. Spera, M. Tenzer and M. R. Buchmeiser, J. Mater. Chem., 2012, 22, 23240–23245 RSC.
- J. Fanous, M. Wegner, M. B. Spera and M. R. Buchmeiser, J. Electrochem. Soc., 2013, 160, A1169 CrossRef CAS.
- S. Warneke, A. Hintennach and M. R. Buchmeiser, J. Electrochem. Soc., 2018, 165, A2093 CrossRef CAS.
- S. Warneke, M. Eusterholz, R. K. Zenn, A. Hintennach, R. E. Dinnebier and M. R. Buchmeiser, J. Electrochem. Soc., 2017, 165, A6017 CrossRef.
- M. W. Wong, inQuantum-Chemical Calculations of Sulfur-Rich Compounds, ed. R. Steudel, Springer Berlin Heidelberg, Berlin, Heidelberg, 2003, pp. 1–30 Search PubMed.
- J. Kappler, S. V. Klostermann, P. L. Lange, M. Dyballa, L. Veith, T. Schleid, T. Weil, J. Kästner and M. R. Buchmeiser, Batter. Supercaps, 2023, 6, e202200522 CrossRef CAS.
Footnote |
| † Electronic supplementary information (ESI) available. See DOI: https://doi.org/10.1039/d3cp06248a |
| This journal is © the Owner Societies 2024 |