Chemisorption of silicon tetrachloride on silicon nitride: a density functional theory study†
Received
28th November 2023
, Accepted 15th March 2024
First published on 27th March 2024
Abstract
We studied the chemisorption of silicon tetrachloride (SiCl4) on the NH2/NH-terminated silicon nitride slab model using density functional theory (DFT) for atomic layer deposition (ALD) of silicon nitride. Initially, two reaction pathways were compared, forming HCl or NH3+Cl− as a byproduct. The NH3+Cl− complex formation was more exothermic than the HCl formation, with an activation energy of 0.26 eV. The –NH2* reaction sites are restored by desorption of HCl from the NH3+Cl− complexes at elevated temperatures of 205 °C or higher. Next, three sequential ligand exchange reactions forming Si–N bonds were modeled and simulated. The reaction energies became progressively less exothermic as the reaction progressed, from −1.31 eV to −0.30 eV to 0.98 eV, due to the stretching of Si–N bonds and the distortion of the N–Si–N bond angles. Also, the activation energies for the second and third reactions were 2.17 eV and 1.55 eV, respectively, significantly higher than the 0.26 eV of the first reaction, mainly due to the additional dissociation of the N–H bond. The third Si–N bond formation is unfavorable due to the endothermic reaction and higher activation energy. Therefore, the chemisorbed species would be –SiCl2* when the surface is exposed to SiCl4.
Introduction
As the integration density of semiconductor devices continues to increase, advanced thin film deposition techniques such as atomic layer deposition (ALD) are being adopted in semiconductor manufacturing. ALD is an atomic layer-by-layer growth technique in which the substrate surface is alternately exposed to a precursor and a co-reactant. The self-limiting nature of ALD provides precise process control over material thickness, composition, and conformality in high aspect ratio (HAR) patterns. ALD of silicon nitride is used for various applications such as gate spacers1 and diffusion barriers2 in complementary metal-oxide-semiconductor (CMOS) devices and charge trapping3 and sacrificial layers3 in three-dimensional vertical NAND flash memory devices.
The ALD process of silicon nitride can be achieved by thermal ALD or plasma-enhanced ALD (PEALD). Although various types of silicon precursors, such as chlorosilanes,4–6 aminosilanes,7,8 silylamines,9,10 cyclosilazanes,11,12 and silanes,4,13 have been investigated in PEALD, only chlorosilane-type silicon precursors have been studied in thermal ALD processes, such as silicon tetrachloride (SiCl4),14,15 dichlorosilane (DCS, SiH2Cl2),15 hexachlorodisilane (HCDS, Si2Cl6),16 and octachlorotrisilane (OCTS, Si3Cl8).17 Ammonia (NH3)14,15,17,18 or hydrazine (N2H4)16,19 was used as the coreactant for thermal ALD.
The reaction mechanism of thermal silicon nitride ALD using SiCl4 was investigated by in situ FTIR spectroscopy.14 SiCl4 reacts with the –NHx surface site to form –NSiClx with an HCl byproduct, and then NH3 reacts with –NSiClx to restore –NHx, resulting in the growth of silicon nitride film. Density functional theory (DFT) calculations were used to study the reaction mechanism of the ALD process of silicon nitride.20–26 The surface reaction of bis(diethylamino)silane or bis(tert-butylamino)silane was studied on the β-Si3N4 (0001) slab model.24 The surface reaction of SiCl4, SiH2Cl2, Si2Cl6, or Si3Cl8 to form a Si–N bond was also studied on the NH/NH2-terminated β-Si3N4 (0001) slab model.25 Different silicon tetrahalides were compared by simulating the sequential ligand exchange reactions forming multiple Si–N bonds using the NH2-terminated Si cluster model.27
The above DFT studies assumed the formation of an HCl molecule as a reaction byproduct. However, Hartmann et al.26 studied the surface reaction of SiH2Cl2 and suggested that the H from the –NH2 could migrate to another –NH2 site to form an NH3+Cl− complex instead of directly forming a gaseous HCl byproduct, resulting in a lower system energy. The formation of the NH3+Cl− complex has also been demonstrated by in situ FTIR and XPS analyses.28 To date, no comparative study has been performed between the direct formation of an HCl molecule and the formation of an NH3+Cl− complex on the surface.
In this study, the chemisorption mechanism of a SiCl4 molecule on a silicon nitride surface terminated with NH2 and NH groups was investigated. SiCl4 was chosen as the precursor to be investigated because it is the most basic chlorosilane molecule. First, the formation of the NH3+Cl− complex was compared to the formation of HCl. The desorption of HCl from the NH3+Cl− complex, resulting in the restoration of the original  site, where the asterisk (*) indicates the surface species, was also studied. Finally, the sequential ligand exchange reactions forming Si–N bonds were modeled and simulated. The reaction and activation energies were obtained to suggest the end product of the chemisorption of SiCl4.
Computational methods
The DFT calculations were performed with the DMol3 code in the Materials Studio 7.0 package29,30 using the generalized gradient approximation (GGA) with the Perdew–Burke–Ernzerhof (PBE) functional.31 The all-electron core treatment and the double numerical polarization (DNP) 4.4 basis set29 with a global cutoff scheme at 4.6 Å were used for all calculations. The Brillouin zone integration was sampled within a 2 × 2 × 1 Monkhorst–Pack k-point mesh.32 Dispersion force corrections based on the Grimme's method (DFT-D2)33 were considered to account for long-range van der Waals (vdW) interactions. The convergence tolerance, self-consistent field (SCF), and thermal smearing parameters were the same as in previous reports.25,34 Transition state (TS) was located using the complete linear-quadratic synchronous transit (LST-QST) or QST method with root mean square (RMS) force gradient criteria of 0.002 Ha/Å.35 The TS needed to meet the additional criterion of having only one imaginary vibration mode, which was determined by frequency calculation. Further details of the TS search have been reported elsewhere.34
For this study, we chose the β-Si3N4 (001) surface that was fully passivated with  and 12 NH*. This surface was also used in the previous reaction mechanism studies.25,36,37 The surface had cell parameters of a = b = 15.320 Å. The slab model consisted of a four-layer (2 × 2) supercell with 184 atoms (48 silicon, 76 nitrogen, and 60 hydrogen atoms). The surface contained evenly distributed
  and –NH* sites, with a density of 5.89 per nm2 each. The surface construction is described in detail in a previous work.36Fig. 1 shows the atomistic structure of the surface before the surface reaction of SiCl4. The N–H bonds that undergo subsequent ligand exchange reactions are labeled N1–H1, N2–H2, and N3–H3, respectively. The
  sites are more sterically exposed to the precursor molecules than the –NH* sites, so we assumed that the first reaction would occur at
  (N1–H1). We also assumed that the second and third reactions would occur at neighboring –NH* (N2–H2) and
  (N3–H3) sites adjacent to N1–H1. The distances between the sites were 2.80 Å, 3.21 Å and 4.79 Å. The N–H bond length was 1.02 Å for
  and 1.04 Å for –NH*. The lower half of the slab model was constrained, while the upper half was relaxed. A 20 Å-thick layer of vacuum was inserted between the adjacent slabs to prevent interactions.
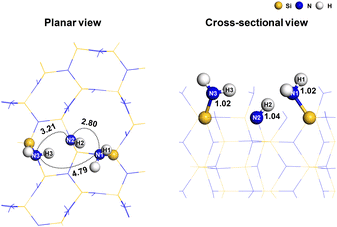 |
| | Fig. 1 The atomistic structure of the  and –NH* terminated silicon nitride surface with the reaction sites. In the planar view, the dotted lines represent the interatomic distances with corresponding values in Å. In the cross-sectional view, the N–H bond lengths are shown in Å. and –NH* terminated silicon nitride surface with the reaction sites. In the planar view, the dotted lines represent the interatomic distances with corresponding values in Å. In the cross-sectional view, the N–H bond lengths are shown in Å. | |
Several states were considered for the interaction of the precursor molecules on the surface, namely the unbound reactant state (UR), the reactant state (Rn), and the product state (Pn). UR is the state in which the precursor does not interact with the surface, assuming it is at an infinite distance from the surface. R1 is the state where the precursor physisorbs on the surface. P1, P2, and P3 are the product states with first, second, and third Si–N bonds, respectively. R2 and R3 are the reactant states after removing a byproduct molecule to infinity from P1 and P2, respectively. TS1, TS2, and TS3 are the transition states between the reactant and product states. All the structures used in this work can be found as ESI† in XYZ file format. The adsorption energy (Eads), reaction energy (ΔEn), activation energy (EAn), and desorption energy (Edes,n) of the nth reaction (n = 1–3) are defined as follows:
| | | Eads = ER − (Esurface + Eprecursor) | (1) |
| | Edes,n = (EReacted![[thin space (1/6-em)]](https://www.rsc.org/images/entities/char_2009.gif) surface + Ebyproduct) − EPn surface + Ebyproduct) − EPn | (4) |
where
ERn and
EPn are the total system energies of the reactant and product states.
ETSn is the total energy of the transition state.
Esurface,
Eprecursor, and
Ebyproduct are the energies of the surface only, a precursor molecule and a byproduct molecule, respectively.
EReactedsurface is the energy of the surfaces after the desorption of the byproduct molecules.
To study the desorption of the byproduct as a function of temperature, the free energies were determined by DFT using the following equation:
| | | ΔG = ΔG° + RTlnpbyproduct | (5) |
where Δ
G° is the standard free energy at 1 atm,
R is the ideal gas constant (8.63 × 10
−5 eV mol
−1 K
−1),
T is the temperature in
K, and
pbyproduct is the partial pressure of the byproduct in atm. The partial pressure was assumed to be 1 Torr. Δ
G° was estimated using the following equation:
| | | ΔG° = (Edes,n + ΔZPE + ΔEv(T) + ΔEr(T) + ΔEt(T) + RT) − TΔS(T) | (6) |
where ΔZPE, Δ
Ev(
T), Δ
Er(
T), Δ
Et(
T), and Δ
S(
T), represent the difference between
Rn+1 and
Pn states at temperature
T (in K) in zero point energy, vibrational energy, rotational energy, translational energy, and entropy, respectively.
Results and discussion
During the initial reaction of the silicon precursor with the β-Si3N4 (001) surface, the  surface site is not only more sterically exposed but also more reactive than NH*, as discussed in the previous study.25 Based on the electronegativity of Si (1.90) and Cl (3.16) atoms in SiCl4 and N (3.04) and H (2.20) atoms of the surface
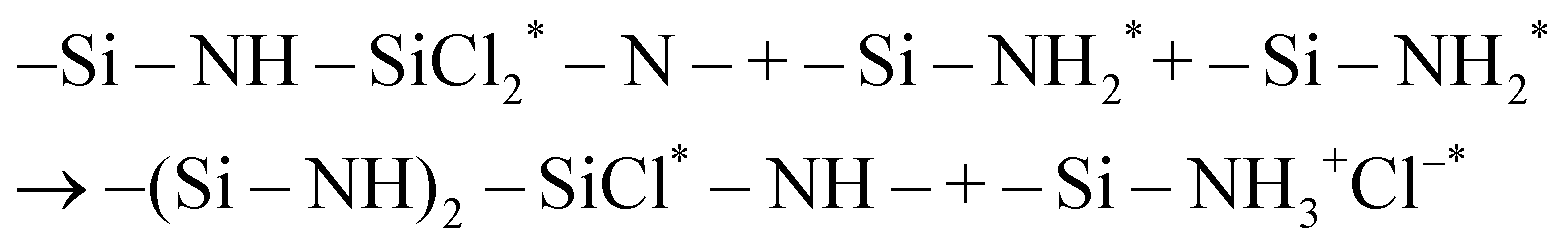
  site,38 Si and Cl atoms are expected to interact with N and H atoms, respectively. Therefore, the two types of pathways, HCl byproduct formation (denoted as P1a) and NH3+Cl− complex formation (denoted as P1b), were modeled and simulated from the physisorption state (denoted as R1) as described in the following reaction equations:
| |  | (7) |
| |  | (8) |
Fig. 2 shows the reaction schemes from R1 to P1a or P1b, along with the corresponding reaction and activation energy values. Both pathways were exothermic. However, the formation of P1a was less exothermic (−0.73 eV) than that of P1b (−1.31 eV). The reaction energy of P1a was mainly due to the formation of Si–N (4.82 eV) and H–Cl (4.53 eV) bonds despite the dissociation of N–H (4.57 eV) and Si–Cl (4.57 eV) bonds. The bond dissociation energies (BDE) were estimated using gas-phase models, as summarized in Fig. S1 (ESI†). The reaction energy of P1b could not be explained solely by the formation of Si–N and N–H (3.40 eV) bonds and the dissociation of N–H and Si–Cl bonds alone. The ionic interaction between NH3+ and Cl− contributes to the reaction energy of P1b, making it more exothermic than P1a. Both P1a and P1b have similar activation energy values of 0.27 eV and 0.26 eV, respectively. The activation energy of 0.26 eV for P1b is similar to that of 0.3 eV reported for NH3+Cl− complex formation by DCS.26P1b was found to be more favorable than P1a due to its greater exothemicity when SiCl4 initially interacted with the silicon nitride surface.
 |
| | Fig. 2 The reactions scheme from the reactant state R1 to the product states P1a and P1b. All energies are in eV. | |
Fig. 3 shows the changes in atomistic geometry during the initial reaction of SiCl4. The other  site shown in this figure is one of the neighboring sites to which the H atom will migrate in P1b, as shown in Fig. S2 (ESI†). In TS1a and TS1b, the Cl1 atom dissociated from SiCl4, and the Si atom of SiCl4 formed an elongated bond to the N1 atom with a distance of 1.83 Å. Additionally, the N1–H1 bond remained unbroken, resulting in a lower activation energy. The N1–H1 bond was elongated from 1.02 Å to 1.14 Å due to the overcoordination of the N1 atom. The strong interaction between the C11 and the surface H atoms also lowered the system energy. A similar transition state structure has also been reported.27 In a previous work,25 we obtained a transition state significantly different from TS1b. The Si–N1 bond was not formed, and H1 was dissociated from N1 to form the H1–Cl1 bond, resulting in a high activation energy of 4.49 eV.
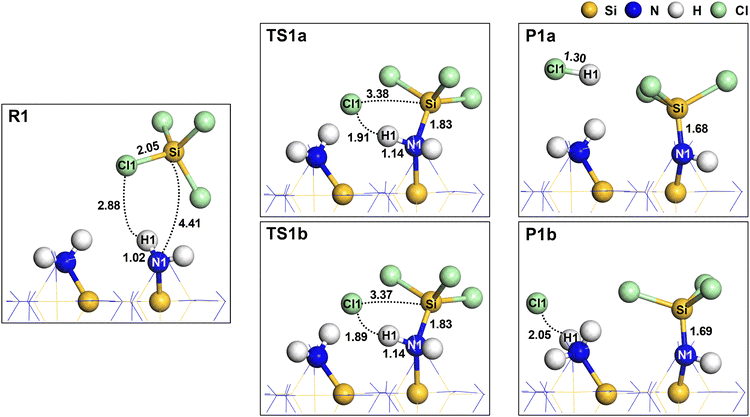 |
| | Fig. 3 The atomistic structures for the reactant (R1), transition (TS1a and TS1b), and product (P1a and P1b) states. The dotted lines represent the interatomic distances with corresponding values in Å. The bond lengths are also shown in Å. | |
The Mulliken atomic charges39 were calculated and are presented in Table 1. In R1, the Si and Cl atoms in SiCl4 have charges of 1.257 e and −0.349 e, respectively. For the surface  site, the N1 and H1 atoms have charges of −0.864 e and 0.232 e, respectively. In TS1a and TS1b, the atomic charge of Si and N1 atoms increased due to the formation of an elongated Si–N1 bond. In P1a and P1b, the stable Si–N1 bond formation slightly increased the atomic charges of Si and N1 atoms. The charges of H1 and Cl1 atoms in HCl were similar in P1a with values of 0.285 e and −0.290 e, respectively. However, in P1b, the charge of the Cl1 atom significantly increased to −0.710 e, indicating a strong ionic interaction between Cl and
  .
.
Table 1 The Mulliken atomic charges for the reactant (R1), transition (TS1a and TS1b), and product (P1a and P1b) states
| Atom |
Mulliken atomic charge (e) |
|
R1
|
TS1a
|
TS1b
|
P1a
|
P1b
|
| Si |
1.257 |
1.321 |
1.321 |
1.332 |
1.300 |
| Cl |
−0.349 |
−0.647 |
−0.647 |
−0.290 |
−0.710 |
| N1 |
−0.864 |
−1.009 |
−1.009 |
−1.117 |
−1.134 |
| H1 |
0.232 |
0.332 |
0.332 |
0.285 |
0.308 |
When HCl molecules were desorbed from the NH3+Cl− surface complex in P1b, the −NH2 surface sites were restored, and the resulting surface became R2, the reactant state for the subsequent reaction. The energy required for the desorption of HCl molecules was calculated from eqn (4), and 1.29 eV was obtained. The free energy change due to the desorption of HCl molecules with temperature was also calculated from eqn (5), as shown in Fig. 4. A minimum temperature of 205 °C is required for HCl molecules to spontaneously desorb from the surface. Therefore, elevated temperature is a prerequisite for the recovery of the −NH2* surface sites.
 |
| | Fig. 4 The free energy change for the desorption of an HCl molecule from the NH3+Cl− surface site in P1b as a function of temperature. | |
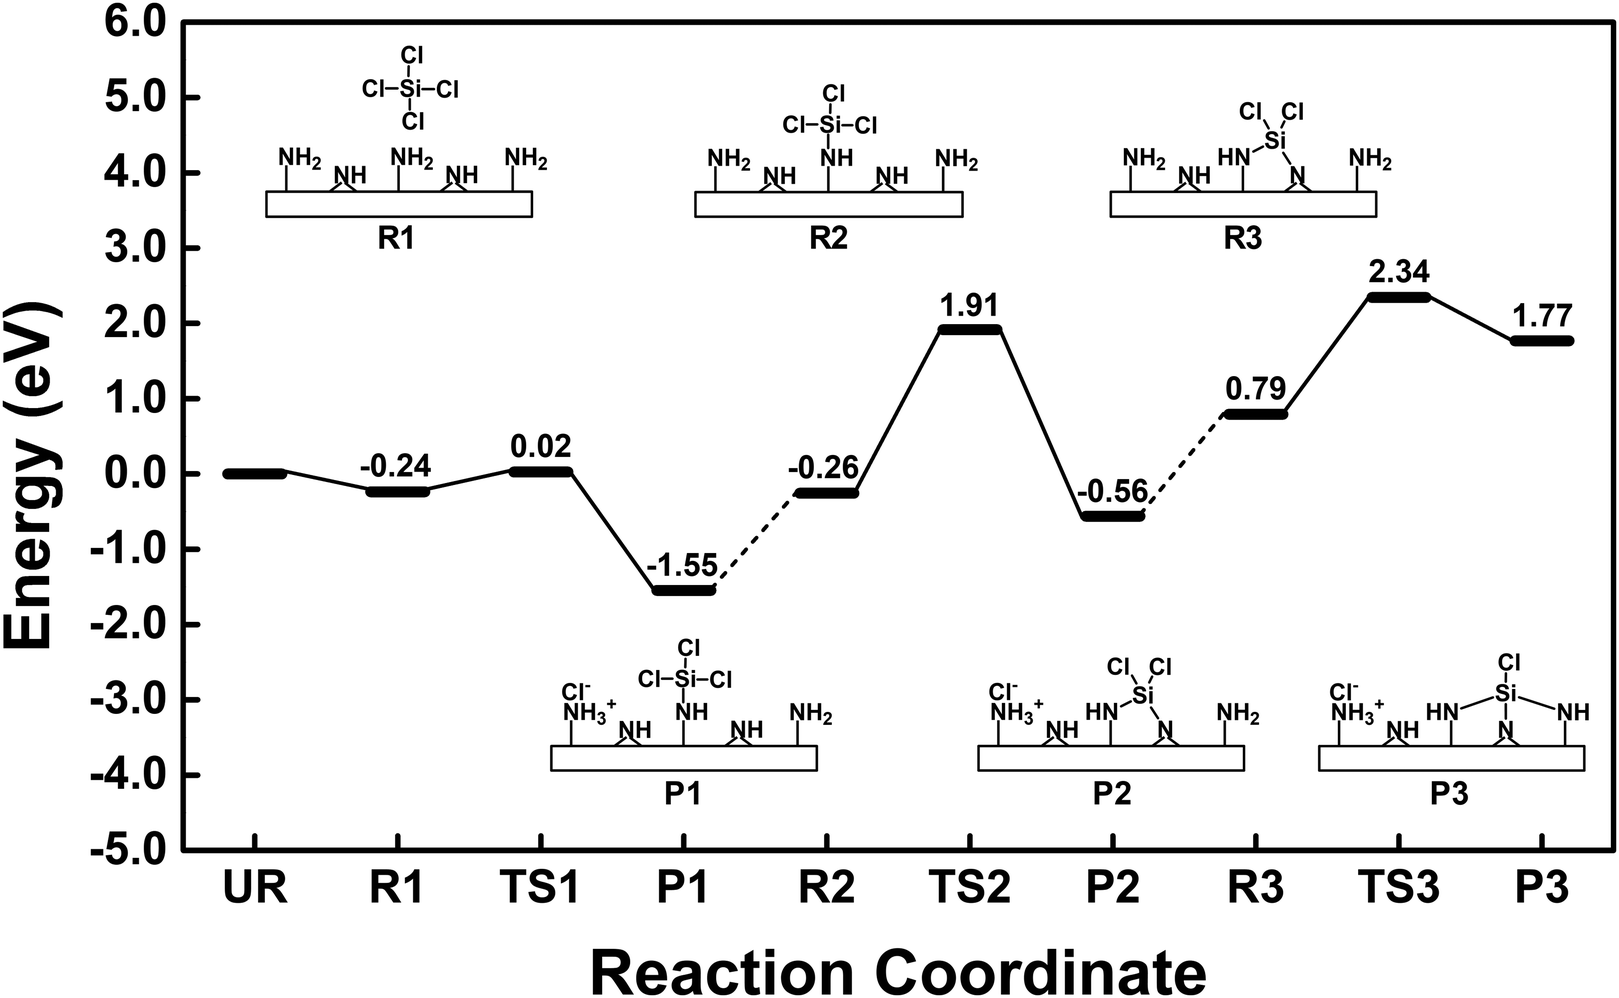
Fig. 5 shows the comprehensive energy diagram for the surface reaction of SiCl4 on the silicon nitride surface. Only the pathway associated with NH3+Cl− complex formation was considered. For the first ligand exchange reaction, only the P1b pathway in Fig. 2 is shown as P1 in Fig. 5. For the second and third reactions to form P2 and P3, the reactions of  with the N2–H2 site and
  with the N3–H3 site were assumed, as described in the following reaction equations:
| |  | (9) |
| |  | (10) |
 |
| | Fig. 5 Energy diagram for the chemisorption of SiCl4 on silicon nitride. | |
The reaction in eqn (9) was exothermic with an activation energy of 2.17 eV, while the reaction in eqn (10) was endothermic with an activation energy of 1.55 eV. The endothermic reaction and the higher activation energy indicate that the formation of P3 is not favorable. Therefore, the chemisorbed species would be  when the surface is exposed to SiCl4.
Fig. 6 shows the atomistic structures of the R2, TS2, and P2 states. The reaction energy was −0.30 eV, which is significantly less exothermic than P1 because the subsurface bonds were elongated in P2, as shown in Fig. S3 (ESI†). In addition, the reaction in eqn (9) had a higher activation energy of 2.17 eV than 0.26 eV in eqn (8). In TS2, the Si–Cl2 and N2–H2 bonds were dissociated, and an elongated Si–N2 bond with a length of 1.81 Å was formed. The higher activation energy to form P2 than P1 was mainly due to the additional dissociation of the N2–H2 bond. The Mulliken atomic charges for R2, TS2 and P2 states are presented in Table S1 (ESI†). The trend remains consistent with the change from R1 to P1b.
 |
| | Fig. 6 The atomistic structures for the reactant (R2), transition (TS2), and product (P2) states of the second Si–N bond formation reaction. The dotted lines represent the interatomic distances with corresponding values displayed in Å. The bond lengths are also shown in Å. | |
Similar to the desorption of HCl from P1, the desorption of the HCl molecule from P2 was simulated. A desorption energy of 1.35 eV was obtained, similar to 1.29 eV for the P1 case. The free energy change due to the desorption of HCl was estimated as a function of temperature, as shown in Fig. 7. A minimum of 276 °C would be required to restore the −NH2 site to form R3, the reactant state for the subsequent reaction.
 |
| | Fig. 7 The free energy change for the desorption of an HCl molecule from the NH3+Cl− surface site in P2 as a function of the temperature. | |
Fig. 8 shows the atomistic structures of R3, TS3, and P3. The reaction was endothermic with a reaction energy of 0.98 eV, in contrast to the exothermicity of the previous reactions leading to P1 and P2. The endothermic nature of the reaction leading to P3 was mainly caused by the stretching of the Si–N1 and Si–N3 bonds, which were stretched to 1.79 Å in P3. In addition, the N–Si–N bond angles in P3 were significantly distorted from the tetrahedral structure. The N1–Si–N2 bond angle was reduced from 108.6° in R3 to 95.2° in P3. The angles of N1–Si–N3 and N2–Si–N3 were 146.8° and 97.0°, respectively. In TS3, the Si–Cl3 and N3–H3 bonds were dissociated, and elongated Si–N3 and H3–Cl3 bonds were formed with lengths of 1.87 Å and 1.48 Å, respectively. The lower activation energy for the formation of P3 than P2 was mainly due to the additional formation of the H3–Cl3 bond. The Mulliken atomic charges for R3, TS3, and P3 states are presented in Table S2 (ESI†). The trend remains consistent with the change from R1 to P1b.
 |
| | Fig. 8 The atomistic structures for the reactant (R3), transition (TS3), and product (P3) states of the third Si–N bond formation reaction. The dotted lines represent the interatomic distances with corresponding values displayed in Å. The bond lengths are also shown in Å. | |
The present work shows that the NH3+Cl− complex formation is significant for the chemisorption of SiCl4. Our calculation is consistent with previous findings on the chemisorption of DCS on the surface of silicon nitride, where NH3+Cl− complex formation has been reported.26,28 The  reaction sites are restored by desorption of HCl from the NH3+Cl− complexes at elevated temperatures. NHx surface groups have been reported for various nitride surfaces, including titanium nitride,40 and boron nitride.41 However, DFT studies on nitride surfaces have not considered the formation of NH3+Cl− but only HCl.41,42 We hope that our work considering the NH3+Cl− complexes can be applied to the reaction mechanism studies of other nitride films using chloride precursors.
Conclusion
The chemisorption of SiCl4 on the NH2/NH-terminated silicon nitride surface was studied by DFT calculations using a slab model. The NH3+Cl− complex formation pathway was more exothermic than the HCl formation pathway, with a low activation energy of 0.26 eV. The  reaction sites are restored by desorption of HCl from the NH3+Cl− complexes at elevated temperatures of 205 °C or higher. Three sequential ligand exchange reactions forming Si–N bonds on the silicon nitride surface were modeled and simulated. The reaction energies became progressively less exothermic as the reaction progressed due to the stretching of the Si–N bonds and the distortion of the N–Si–N bond angles in P2 and P3. Also, the activation energies for the second and third reactions were significantly higher than that of the first reaction, mainly due to the additional dissociation of the N–H bond. The endothermic reaction and the higher activation energy indicate that the species would be
  when the surface is exposed to SiCl4.
Author contributions
Tanzia Chowdhury: conceptualization, methodology, validation, formal analysis, investigation, writing – original draft, visualization. Khabib Khumaini: methodology, validation, formal analysis, investigation, writing – original draft, visualization. Romel Hidayat: methodology, validation, formal analysis, investigation, writing – review & editing. Hye-Lee Kim: methodology, validation, formal analysis, investigation, writing – review & editing. Won-Jun Lee: conceptualization, methodology, formal analysis, resources, writing – review & editing, supervision, project administration, funding acquisition.
Conflicts of interest
There are no conflicts to declare.
Acknowledgements
This work was supported by the Technology Innovation Program (Public-private joint investment semiconductor R&D program (K-CHIPS) to foster high-quality human resources) (RS-2023-00232222) funded by the Ministry of Trade, Industry & Energy (MOTIE, Korea) (1415187363). This research was also supported by the Korea Basic Science Institute (National Research Facilities and Equipment Center) grant funded by the Ministry of Education (2022R1A6C101A774).
References
- F. Koehler, D. H. Triyoso, I. Hussain, S. Mutas and H. Bernhardt, IOP Conf. Ser. Mater. Sci. Eng., 2012, 41, 012006 CrossRef CAS.
- H. Kim, H. Song, C. Shin, K. Kim, W. Jang, H. Kim, S. Shin and H. Jeon, J. Vac. Sci. Technol. A, 2017, 35, 01A101 CrossRef.
- S. S. Kim, S. K. Yong, W. Kim, S. Kang, H. W. Park, K. J. Yoon, D. S. Sheen, S. Lee and C. S. Hwang, Adv. Mater., 2022, 35, 2200659 CrossRef PubMed.
- R. A. Ovanesyan, E. A. Filatova, S. D. Elliott, D. M. Hausmann, D. C. Smith and S. Agarwal, J. Vac. Sci. Technol., A, 2019, 37, 060904 CrossRef.
- R. A. Ovanesyan, D. M. Hausmann and S. Agarwal, ACS Appl. Mater. Interfaces, 2015, 7, 10806–10813 CrossRef CAS PubMed.
- S. Yokoyama, N. Ikeda, K. Kajikawa and Y. Nakashima, Appl. Surf. Sci., 1998, 130–132, 352–356 CrossRef CAS.
- H. C. M. Knoops, K. De Peuter and W. M. M. Kessels, Appl. Phys. Lett., 2015, 107, 014102 CrossRef.
- N. Leick, J. M. M. Huijs, R. A. Ovanesyan, D. M. Hausmann and S. Agarwal, Plasma Process. Polym., 2019, 16, 1–7 CrossRef.
- W. Jang, H. Jeon, C. Kang, H. Song, J. Park, H. Kim, H. Seo, M. Leskela and H. Jeon, Phys. Status Solidi A, 2014, 211, 2166–2171 CrossRef CAS.
- J.-M. Park, S. J. Jang, L. L. Yusup, W.-J. Lee and S.-I. Lee, ACS Appl. Mater. Interfaces, 2016, 8, 20865–20871 CrossRef CAS PubMed.
- J.-M. Park, S. J. Jang, S.-I. Lee and W.-J. Lee, ACS Appl. Mater. Interfaces, 2018, 10, 9155–9163 CrossRef CAS PubMed.
- H. Cho, N. Lee, H. Choi, H. Park, C. Jung, S. Song, H. Yuk, Y. Kim, J.-W. Kim, K. Kim, Y. Choi, S. Park, Y. Kwon and H. Jeon, Appl. Sci., 2019, 9, 3531 CrossRef CAS.
- X. Meng, Y.-C. Byun, H. S. Kim, J. S. Lee, A. T. Lucero, L. Cheng and J. Kim, Materials, 2016, 9, 1007 CrossRef PubMed.
- J. W. Klaus, A. W. Ott, A. C. Dillon and S. M. George, Surf. Sci., 1998, 418, L14–L19 CrossRef CAS.
- W.-J. Lee, J.-H. Lee, C. O. Park, Y.-S. Lee, S.-J. Shin and S.-K. Rha, J. Korean Phys. Soc., 2004, 45, 1352–1355 CAS.
- S. Morishita, S. Sugahara and M. Matsumura, Appl. Surf. Sci., 1997, 112, 198–204 CrossRef CAS.
- W.-J. Lee, U.-J. Kim, C.-H. Han, M.-H. Chun, S.-K. Rha and Y.-S. Lee, J. Korean Phys. Soc., 2005, 47, 598–602 Search PubMed.
- S. Riedel, J. Sundqvist and T. Gumprecht, Thin Solid Films, 2015, 577, 114–118 CrossRef CAS.
- M. Edmonds, K. Sardashti, S. Wolf, E. Chagarov, M. Clemons, T. Kent, J. H. Park, K. Tang, P. C. McIntyre, N. Yoshida, L. Dong, R. Holmes, D. Alvarez and A. C. Kummel, J. Chem. Phys., 2017, 146, 0–12 CrossRef CAS PubMed.
- D. Sibanda, S. T. Oyinbo and T. C. Jen, Nanotechnol. Rev., 2022, 11, 1332–1363 CrossRef CAS.
- Y. Widjaja and C. B. Musgrave, Phys. Rev. B, 2001, 64, 205303 CrossRef.
- S. D. Elliott, G. Dey, Y. Maimaiti, H. Ablat, E. A. Filatova and G. N. Fomengia, Adv. Mater., 2016, 28, 5367–5380 CrossRef CAS PubMed.
- C. K. Ande, H. C. M. Knoops, K. De Peuter, M. Van Drunen, S. D. Elliott and W. M. M. Kessels, J. Phys. Chem. Lett., 2015, 6, 3610–3614 CrossRef CAS PubMed.
- L. Huang, B. Han, B. Han, A. Derecskei-Kovacs, M. Xiao, X. Lei, M. L. O’Neill, R. M. Pearlstein, H. Chandra and H. Cheng, Phys. Chem. Chem. Phys., 2014, 16, 18501–18512 RSC.
- L. L. Yusup, J.-M. Park, T. R. Mayangsari, Y.-K. Kwon and W.-J. Lee, Appl. Surf. Sci., 2018, 432, 127–131 CrossRef CAS.
- G. Hartmann, P. L. G. Ventzek, T. Iwao, K. Ishibashi and G. S. Hwang, Phys. Chem. Chem. Phys., 2018, 20, 29152–29158 RSC.
- N.-K. Yu, C. H. Moon, J. Park, H.-B.-R. Lee and B. Shong, Appl. Surf. Sci., 2021, 565, 150603 CrossRef CAS.
- T. Yang, E. S. Cheng, S. M. Johnson, T. Iwao, J. Zhao, J. G. Ekerdt, P. L. G. Ventzek and G. S. Hwang, Appl. Surf. Sci., 2023, 629, 157432 CrossRef CAS.
- B. Delley, J. Chem. Phys., 1990, 92, 508–517 CrossRef CAS.
- B. Delley, J. Chem. Phys., 2000, 113, 7756–7764 CrossRef CAS.
- J. P. Perdew, K. Burke and M. Ernzerhof, Phys. Rev. Lett., 1996, 77, 3865–3868 CrossRef CAS PubMed.
- H. J. Monkhorst and J. D. Pack, Phys. Rev. B, 1976, 13, 5188 CrossRef.
- S. Grimme, J. Comput. Chem., 2006, 27, 1787–1799 CrossRef CAS PubMed.
- K. Khumaini, R. Hidayat, T. R. Mayangsari, T. Chowdhury, H.-L. Kim, S.-I. Lee and W.-J. Lee, Appl. Surf. Sci., 2022, 585, 152750 CrossRef CAS.
- N. Govind, M. Petersen, G. Fitzgerald, D. King-Smith and J. Andzelm, Comput. Mater. Sci., 2003, 28, 250–258 CrossRef CAS.
- L. L. Yusup, J.-M. Park, Y. H. Noh, S. J. Kim, W.-J. Lee, S. Park and Y.-K. Kwon, RSC Adv., 2016, 6, 68515–68524 RSC.
- T. Chowdhury, R. Hidayat, H.-L. Kim, T. R. Mayangsari, S. Cho, S. Park, J. Jung and W.-J. Lee, Appl. Surf. Sci., 2021, 554, 149481 CrossRef CAS.
- A. L. Allred, J. Inorg. Nucl. Chem., 1961, 17, 215–221 CrossRef CAS.
- R. S. Mulliken, J. Chem. Phys., 1955, 23, 2338–2342 CrossRef CAS.
- M. Q. Snyder, B. A. McCool, J. DiCarlo, C. P. Tripp and W. J. DeSisto, Thin Solid Films, 2006, 514, 97–102 CrossRef CAS.
- N. Uene, T. Mabuchi, M. Zaitsu, Y. Jin, S. Yasuhara and T. Tokumasu, Comput. Mater. Sci., 2023, 217, 111919 CrossRef CAS.
- J. Park, N. K. Yu, D. Jang, E. Jung, H. Noh, J. Moon, D. Kil and B. Shong, Coatings, 2020, 10, 712 CrossRef CAS.
|
| This journal is © the Owner Societies 2024 |
Click here to see how this site uses Cookies. View our privacy policy here. 
 a,
Khabib
Khumaini
a,
Khabib
Khumaini
 site, where the asterisk (*) indicates the surface species, was also studied. Finally, the sequential ligand exchange reactions forming Si–N bonds were modeled and simulated. The reaction and activation energies were obtained to suggest the end product of the chemisorption of SiCl4.
 and 12 NH*. This surface was also used in the previous reaction mechanism studies.25,36,37 The surface had cell parameters of a = b = 15.320 Å. The slab model consisted of a four-layer (2 × 2) supercell with 184 atoms (48 silicon, 76 nitrogen, and 60 hydrogen atoms). The surface contained evenly distributed
  and –NH* sites, with a density of 5.89 per nm2 each. The surface construction is described in detail in a previous work.36Fig. 1 shows the atomistic structure of the surface before the surface reaction of SiCl4. The N–H bonds that undergo subsequent ligand exchange reactions are labeled N1–H1, N2–H2, and N3–H3, respectively. The
  sites are more sterically exposed to the precursor molecules than the –NH* sites, so we assumed that the first reaction would occur at
  (N1–H1). We also assumed that the second and third reactions would occur at neighboring –NH* (N2–H2) and
  (N3–H3) sites adjacent to N1–H1. The distances between the sites were 2.80 Å, 3.21 Å and 4.79 Å. The N–H bond length was 1.02 Å for
  and 1.04 Å for –NH*. The lower half of the slab model was constrained, while the upper half was relaxed. A 20 Å-thick layer of vacuum was inserted between the adjacent slabs to prevent interactions.
 and –NH* terminated silicon nitride surface with the reaction sites. In the planar view, the dotted lines represent the interatomic distances with corresponding values in Å. In the cross-sectional view, the N–H bond lengths are shown in Å.
 surface site is not only more sterically exposed but also more reactive than NH*, as discussed in the previous study.25 Based on the electronegativity of Si (1.90) and Cl (3.16) atoms in SiCl4 and N (3.04) and H (2.20) atoms of the surface
  site,38 Si and Cl atoms are expected to interact with N and H atoms, respectively. Therefore, the two types of pathways, HCl byproduct formation (denoted as P1a) and NH3+Cl− complex formation (denoted as P1b), were modeled and simulated from the physisorption state (denoted as R1) as described in the following reaction equations:


 site shown in this figure is one of the neighboring sites to which the H atom will migrate in P1b, as shown in Fig. S2 (ESI†). In TS1a and TS1b, the Cl1 atom dissociated from SiCl4, and the Si atom of SiCl4 formed an elongated bond to the N1 atom with a distance of 1.83 Å. Additionally, the N1–H1 bond remained unbroken, resulting in a lower activation energy. The N1–H1 bond was elongated from 1.02 Å to 1.14 Å due to the overcoordination of the N1 atom. The strong interaction between the C11 and the surface H atoms also lowered the system energy. A similar transition state structure has also been reported.27 In a previous work,25 we obtained a transition state significantly different from TS1b. The Si–N1 bond was not formed, and H1 was dissociated from N1 to form the H1–Cl1 bond, resulting in a high activation energy of 4.49 eV.
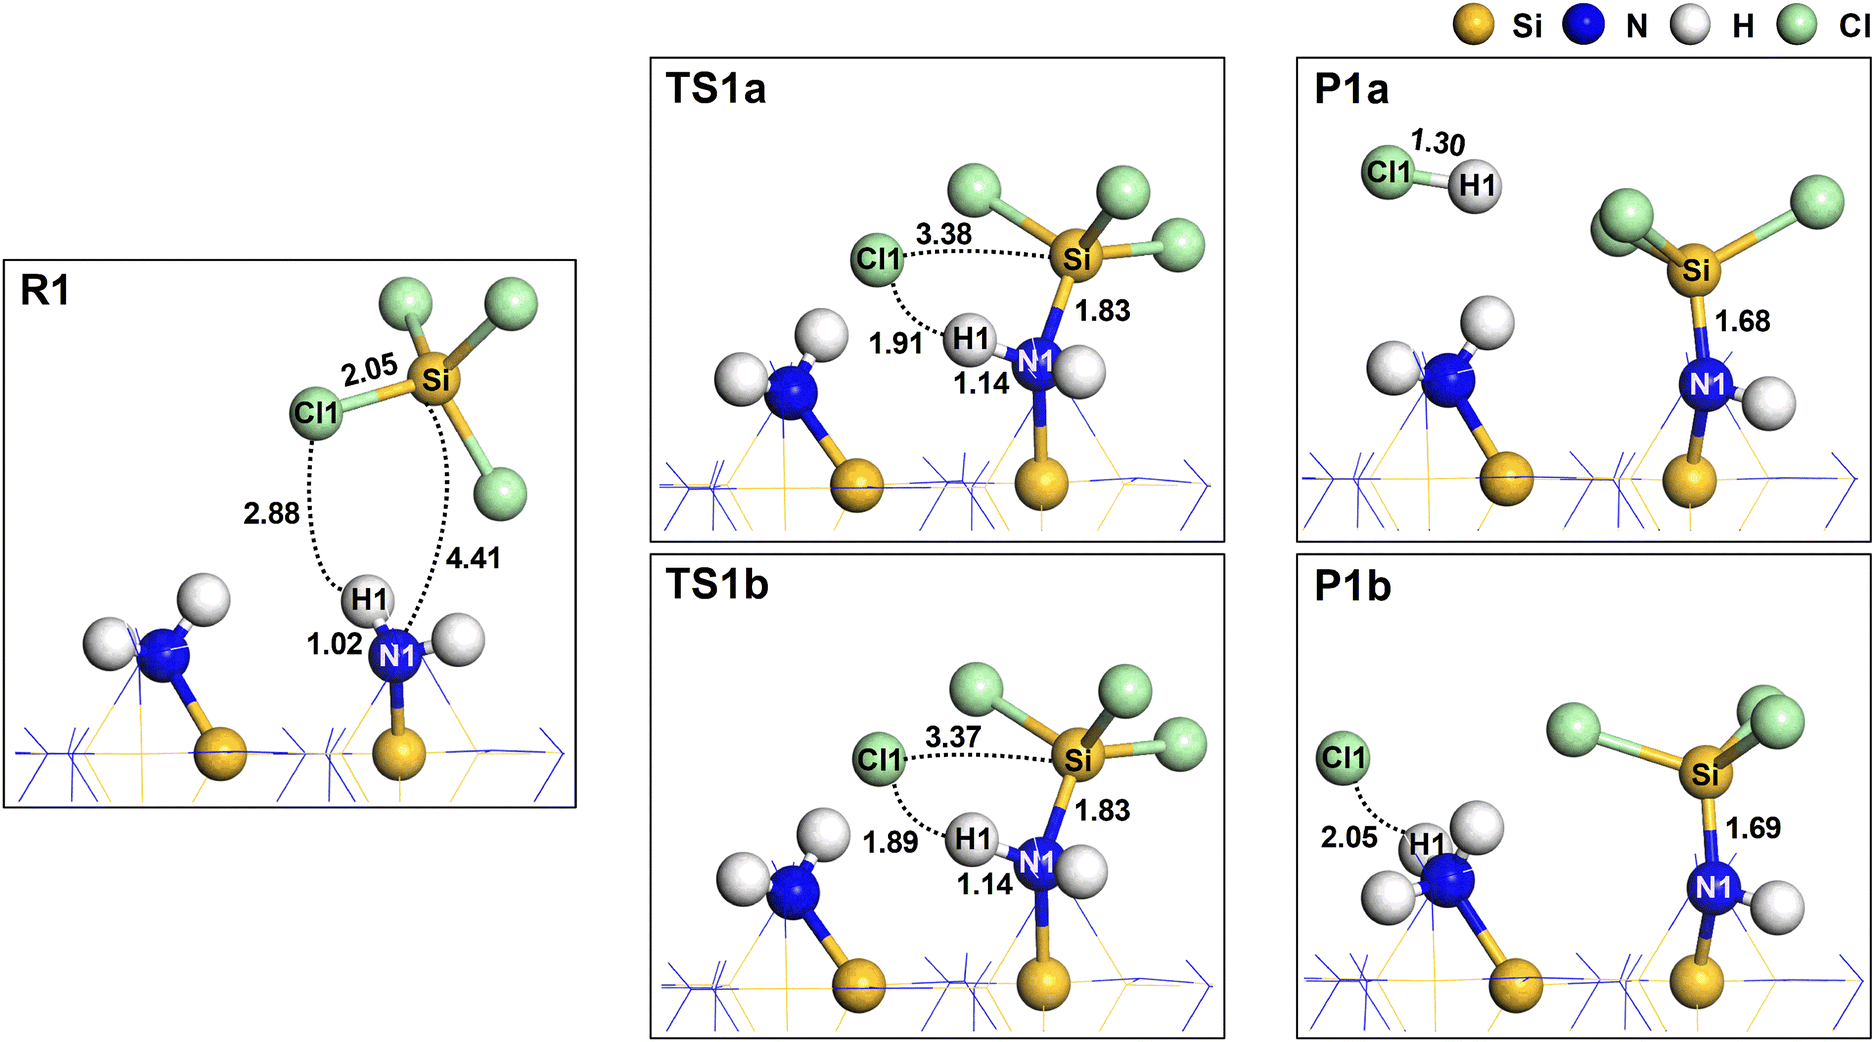
 site, the N1 and H1 atoms have charges of −0.864 e and 0.232 e, respectively. In TS1a and TS1b, the atomic charge of Si and N1 atoms increased due to the formation of an elongated Si–N1 bond. In P1a and P1b, the stable Si–N1 bond formation slightly increased the atomic charges of Si and N1 atoms. The charges of H1 and Cl1 atoms in HCl were similar in P1a with values of 0.285 e and −0.290 e, respectively. However, in P1b, the charge of the Cl1 atom significantly increased to −0.710 e, indicating a strong ionic interaction between Cl and
  .
.
 with the N2–H2 site and
  with the N3–H3 site were assumed, as described in the following reaction equations:
 when the surface is exposed to SiCl4.


 reaction sites are restored by desorption of HCl from the NH3+Cl− complexes at elevated temperatures. NHx surface groups have been reported for various nitride surfaces, including titanium nitride,40 and boron nitride.41 However, DFT studies on nitride surfaces have not considered the formation of NH3+Cl− but only HCl.41,42 We hope that our work considering the NH3+Cl− complexes can be applied to the reaction mechanism studies of other nitride films using chloride precursors.
 reaction sites are restored by desorption of HCl from the NH3+Cl− complexes at elevated temperatures of 205 °C or higher. Three sequential ligand exchange reactions forming Si–N bonds on the silicon nitride surface were modeled and simulated. The reaction energies became progressively less exothermic as the reaction progressed due to the stretching of the Si–N bonds and the distortion of the N–Si–N bond angles in P2 and P3. Also, the activation energies for the second and third reactions were significantly higher than that of the first reaction, mainly due to the additional dissociation of the N–H bond. The endothermic reaction and the higher activation energy indicate that the species would be
  when the surface is exposed to SiCl4.