
In situ monitoring of mechanochemical MOF formation by NMR relaxation time correlation†
Madeleine E.
Leger
ab,
Jiangfeng
Guo
 be,
Bryce
MacMillan
b,
Hatem M.
Titi
c,
Tomislav
Friščić
cd,
Bruce
Balcom
*ab and
Barry A.
Blight
*a
be,
Bryce
MacMillan
b,
Hatem M.
Titi
c,
Tomislav
Friščić
cd,
Bruce
Balcom
*ab and
Barry A.
Blight
*a
aDepartment of Chemistry, University of New Brunswick, Fredericton, New Brunswick E3B 5A3, Canada. E-mail: bjb@unb.ca; b.blight@unb.ca
bUNB MRI Centre, Department of Physics, University of New Brunswick, Fredericton, New Brunswick E3B 5A3, Canada
cDepartment of Chemistry, McGill University, Montreal, Quebec H3A 0G4, Canada
dSchool of Chemistry, University of Birmingham University, Birmingham, B15 2TT, UK
eNational Key Laboratory of Petroleum Resources and Engineering, China University of Petroleum (Beijing), Beijing, 102249, China
First published on 5th December 2023
Abstract
In this paper, we present a new approach to monitoring mechanochemical transformations, based on a magnetic resonance (MR) method in which relaxation time correlation maps are used to track the formation of the popular metal–organic framework (MOF) materials Zn-MOF-74 and ZIF-8. The two-dimensional (2D) relaxation correlation measurement employed yields a  spectrum which visually and analytically identifies different 1H environments in the sample of interest. The measurement is well-suited to analyzing solid mixtures, and liquids, in complex systems. Application in this work to monitoring MOF formation shows changes in signal amplitudes, and their MR lifetime coordinates, within the 2D plots as the reaction progresses, confirming reaction completion. This new measurement provides a simple way to analyse solid-state reactions without dissolution, and there is a logical pathway to benchtop measurement with a new generation of permanent magnet-based MR instruments. The methodology described permits measurement in an MR compatible milling container, which may be directly transferred from the shaker assembly to the MR magnet for in situ measurement of the entire reaction mixture.
1. Introduction
Mechanochemistry, i.e. chemical reactions induced and/or sustained through grinding, milling, shearing or other types of mechanical agitation, has emerged as a popular and versatile method for synthesizing molecules and materials in the absence of bulk solvents.1 The ability to circumvent the need for bulk solvents, while providing access to chemical reactions that are fast, proceed at room temperature, and can provide access to molecules and materials challenging to obtain through other means, makes mechanochemistry a highly attractive, ‘greener’ alternative to more conventional solvent-based synthesis. The scope of possible reactions by mechanochemical activation is widespread, with recent reviews and reports outlining mechanochemical approaches to organic,2,3 inorganic,4,5 organometallic,6 supramolecular,7–9 and coordination10,11 chemistry, as well as a range of advanced material targets such as metal–organic frameworks (MOFs),12,13 nanomaterials,14,15 and more. Mechanochemical transformations open the door to new synthetic opportunities16 such as the formation of unusual products, trapping of typically unstable intermediates, and the enhanced selectivity of products13 while also serving as an important tool for reducing reaction times.17Many details of mechanochemical reactions remain poorly understood,18 with attempts12,19 to elucidate the underlying physicochemical process often involving extensive and systematic investigations of temperature and pressure, including real-time approaches, as well as screening of milling frequency, sample-to-volume ratio, ball diameter, material of the milling assembly, presence, and properties of liquid and/or polymer additives, and other parameters.20–23
Real-time monitoring of reactions by thermography, powder X-ray diffraction (PXRD),24,25 Raman spectroscopy,23,26 and different combinations of these27 have shown great progress in our ability to monitor reactions without the need to disrupt the reaction or dissolve the products for subsequent analyses.28 Nevertheless, in situ mechanochemistry monitoring approaches are still in their infancy, and face numerous challenges. One of these is difficulty obtaining reliable data when measuring over a limited and inhomogeneous sampling area. This can lead to low quality data that is difficult to interpret.29 The majority of current monitoring methods are surface measurements or require high-cost specialized apparatus. We are seeking to develop a monitoring method, through time domain magnetic resonance (MR), that is compatible with the milling container employed with a mechanical shaker. This will permit simple measurement of the milling container and its contents when inserted into a benchtop MR instrument. The result would be a whole sample bulk measurement, where the sample is undisturbed in the milling container. It will thus be well suited to time resolving the progress of a mechanochemistry reaction in the laboratory.
MR is an incredibly varied and continually expanding field. While it is best known for its uses in chemical spectroscopic analysis30,31 and biomedical imaging,32,33 MR can be the basis of many other analyses. MR relaxation time measurements for example are now commonly used to analyse porous materials (e.g. rock cores)34–36 and food materials.37–40 Relaxation time measurements are usually based on longitudinal (T1) and transverse (T2) relaxation times, but it is increasingly common to combine these into relaxation correlation experiments, for example T1–T2. There are many similarities between 2D relaxation correlation experiments and 2D MR spectroscopy. In each case a 2D analysis permits better discrimination of the MR signal. In 2D MR spectroscopy the 2D plot shows signal intensity as a function of frequency with data processing via a 2D Fourier transform. In 2D relaxation correlation the 2D plot shows signal intensity as a function of signal lifetime(s) with data processing via a 2D Inverse Laplace transform. The T1–T2 measurement is ideal for samples with liquid like signal components with long T2 lifetimes. Solid-like signal components however have T2 lifetimes too short for useful measurement. Marreiros et al. recently reported studies of gas adsorption in MOFs using T1–T2 measurements but identified one of the core challenges to be measuring samples, such as solids, with short-lived T2 signal.41
We have recently developed a new relaxation correlation measurement that is designed to capture short lived transverse lifetime signal components.42 The new measurement,  , captures solid and liquid signals permitting discrimination of species via signal lifetime(s). The
  method is facile and combines saturation recovery with free induction decays. The minimum observation time of the
  method is limited only by the instrument deadtime, which makes it ideal to measure rigid samples with short
  lifetimes.
  measurements have been used to distinguish solid kerogen, from water and oil in shales,43,44 and to classify coal samples.45 In this work we use this method to analyze solid and liquid species in solid-state mechanochemical reactions for the first time. Furthermore, the entire mechanochemical process, from synthesis to analysis, may take place in the milling container without the requirement of sample removal and transfer.
A typical liquid-state MR experiment requires the product to be dissolved for measurement. Alternatively, MR analysis in the solid state requires transfer of the product to a rotor, which is then spun at high speed at the magic angle for spectroscopic analysis. Schiffmann and coworkers have assembled a miniaturized milling apparatus that is compatible with a magic-angle spinning solid-state MR instrument.46 This is a powerful approach to the mechanochemistry analysis problem, but it is not a general solution that can be translated to routine practise by a wide range of laboratories. The time domain relaxation correlation approach,  permits analysis of static samples and eliminates the need for material transfer in lab scale mechanochemistry, with all the attendant benefits. In this work we employ synthesis of MOFs as test examples for this method. Specifically, the milling synthesis of the well-known material Zn-MOF-74 (also known as CPO-27) is monitored by
  relaxation correlation analysis, with special attention to the formation of an intermediate and evident colour change. We then successfully demonstrate the mechanosynthesis and this MR analysis of the zeolitic imidazolate framework ZIF-8 within a reaction vessel that is MR compatible. The nature of the information provided by relaxation correlation measurements makes these methods well-suited to following the progress of a reaction, but less well suited to a mechanistic interpretation of a reaction. Following the progress of mechanochemistry reactions with
  measurement with desktop MR instrumentation is our ultimate goal.
2. Experimental
2.1 Chemicals
Zinc oxide (99%), 2-methylimidazole (99%), zinc acetate dihydrate (98%), and 2,5-dihydroxyterephthalic acid (98%), were purchased from Sigma Aldrich. All reactants were used without further purification.2.2 MR method
In time domain MR analysis, an instrument with a short deadtime must be utilized to capture the short component found in solid materials. A 4.7 T vertical-bore superconducting magnet (Cryomagnetics) and a Redstone HF NMR spectrometer console (Tecmag) equipped with a Doty DS1-874 1H RF probe (Doty Scientific) were utilized. Samples were either transferred to a glass vial for analysis or kept in the lab-made Teflon jar used during milling (see ESI,† Section S1). A large amount of sample (gram scale) was employed to increase sensitivity and to ensure the sample signal dominates over background signal from the probe. All measurements were collected at room temperature (295 K).
Parameters specific to these measurements included a dwell time of 400 ns, a pulse length of 5 μs, a total of 8 scans, and the acquisition of 4096 time domain points for all samples. Some pulse specific parameters included a recycle delay of 175 s for the free induction decay (FID) sequence, and a set of 40 recovery times ranging from 15 μs to 99 s for the saturation recovery pulse sequence. The receiver gain (RG) depended on the intensity of signal measured from each sample. The deadtime was 4 μs.
The data was collected using simple FID and saturation recovery (ESI,† Section S1). Total measurement time took approximately 20 minutes for individual FID measurements and 1 h 48 min for the saturation recovery measurement. A MATLAB program employing code from the program by the Schlumberger-Doll Research Center was utilized to process the data to generate the  time correlation maps. This program assumed the signal change to be purely exponential. For non-exponential data processing, a new
  analysis method was employed.47 A detailed explanation of the MR measurement is in the ESI† (Section S1).
2.3 Other methods
The mechanochemical preparation of Zn-MOF-74 and ZIF-8 followed the procedures established by Julien et al.48 and Tanaka et al.,49 respectively. For the synthesis leading to Zn-MOF-74, 6.67 mmol of zinc oxide (543 mg), 3.33 mmol of 2,5-dihydroxyterephthalic acid (H4dhta; 660 mg), and 0.75 mL of water were milled in a 15 mL poly(methyl)methacrylate (PMMA) jar, with two 7 mm diameter stainless steel balls for 90 minutes at 30 Hz. For the synthesis of ZIF-8, 3.75 mmol of zinc oxide (305 mg), 7.5 mmol of 2-methylimidazole (616 mg), and 30 mol% of zinc acetate dihydrate (247 mg) were added to an in-house made Teflon milling container, with two 7 mm diameter zirconia balls. In a Retsch MM400 mixer mill, the milling container was shaken at 30 Hz for 2 hours.The identities of the final products were confirmed through X-ray powder diffraction (PXRD) patterns collected on a Bruker D8 Advance spectrometer. Scanning electron microscope (SEM) images and energy dispersive X-ray spectroscopy (EDS) data were collected on a JEOL JSM-6400 Scanning Electron Microscope equipped with an EDAX Genesis 4000 Energy Dispersive X-ray analyser. Detailed methodology for PXRD, SEM, and EDS can be found in the ESI† (Section S1).
3. Results and discussion
3.1 Reactions and characterization
The two MOF milling synthesis reactions were analysed by MR relaxation time measurements. The synthesis of Zn-MOF-74 followed the procedure established by Julien et al.48 It consisted of milling ZnO, 2,5-dihydroxyterephthalic acid, and water together. The M-MOF-74 family of materials is particularly interesting because of their excellent stability, and gas adsorption and catalysis abilities.50 The second reaction involved the synthesis of ZIF-8 and followed the established procedure by Tanaka et al.,49 and involved the milling of zinc oxide and 2-methylimidazole in the presence of extra zinc acetate hydrate. ZIF-8 has been studied for its promising gas separation, sensing, and catalysis capabilities due to its excellent chemical and thermal stability.51 Detailed mechanisms of the Zn-MOF-7448 and ZIF-849 reactions have been published. PXRD (ESI,† see Section S5), SEM images and corresponding EDS data (ESI,† see Section S6), and MR correlation plots were all obtained for these reactions.3.2 Zn-MOF-74 reaction: capturing the intermediate
The reaction of Zn-MOF-74 is particularly interesting for its distinct colour changes and documented intermediate phase.48 Use of clear PMMA milling jars permitted observation of these changes during milling (Fig. 1f). The starting mixture appears bright yellow due to the presence of 2,5-dihydroxyterephthalic acid, but it quickly transforms to a pale yellow, and eventually a white colour. The observation of white material is evidence of the intermediate, Zn(H2O)2(H2dhta), being formed. The yellow hue of the Zn-MOF-74 final product is visible as the sticky mixture suddenly transforms into a powder. The resulting product is a dry dull yellow powder. The quick transition from liquid mixture to dry product can tentatively be explained by the moisture sequestration of MOF-74.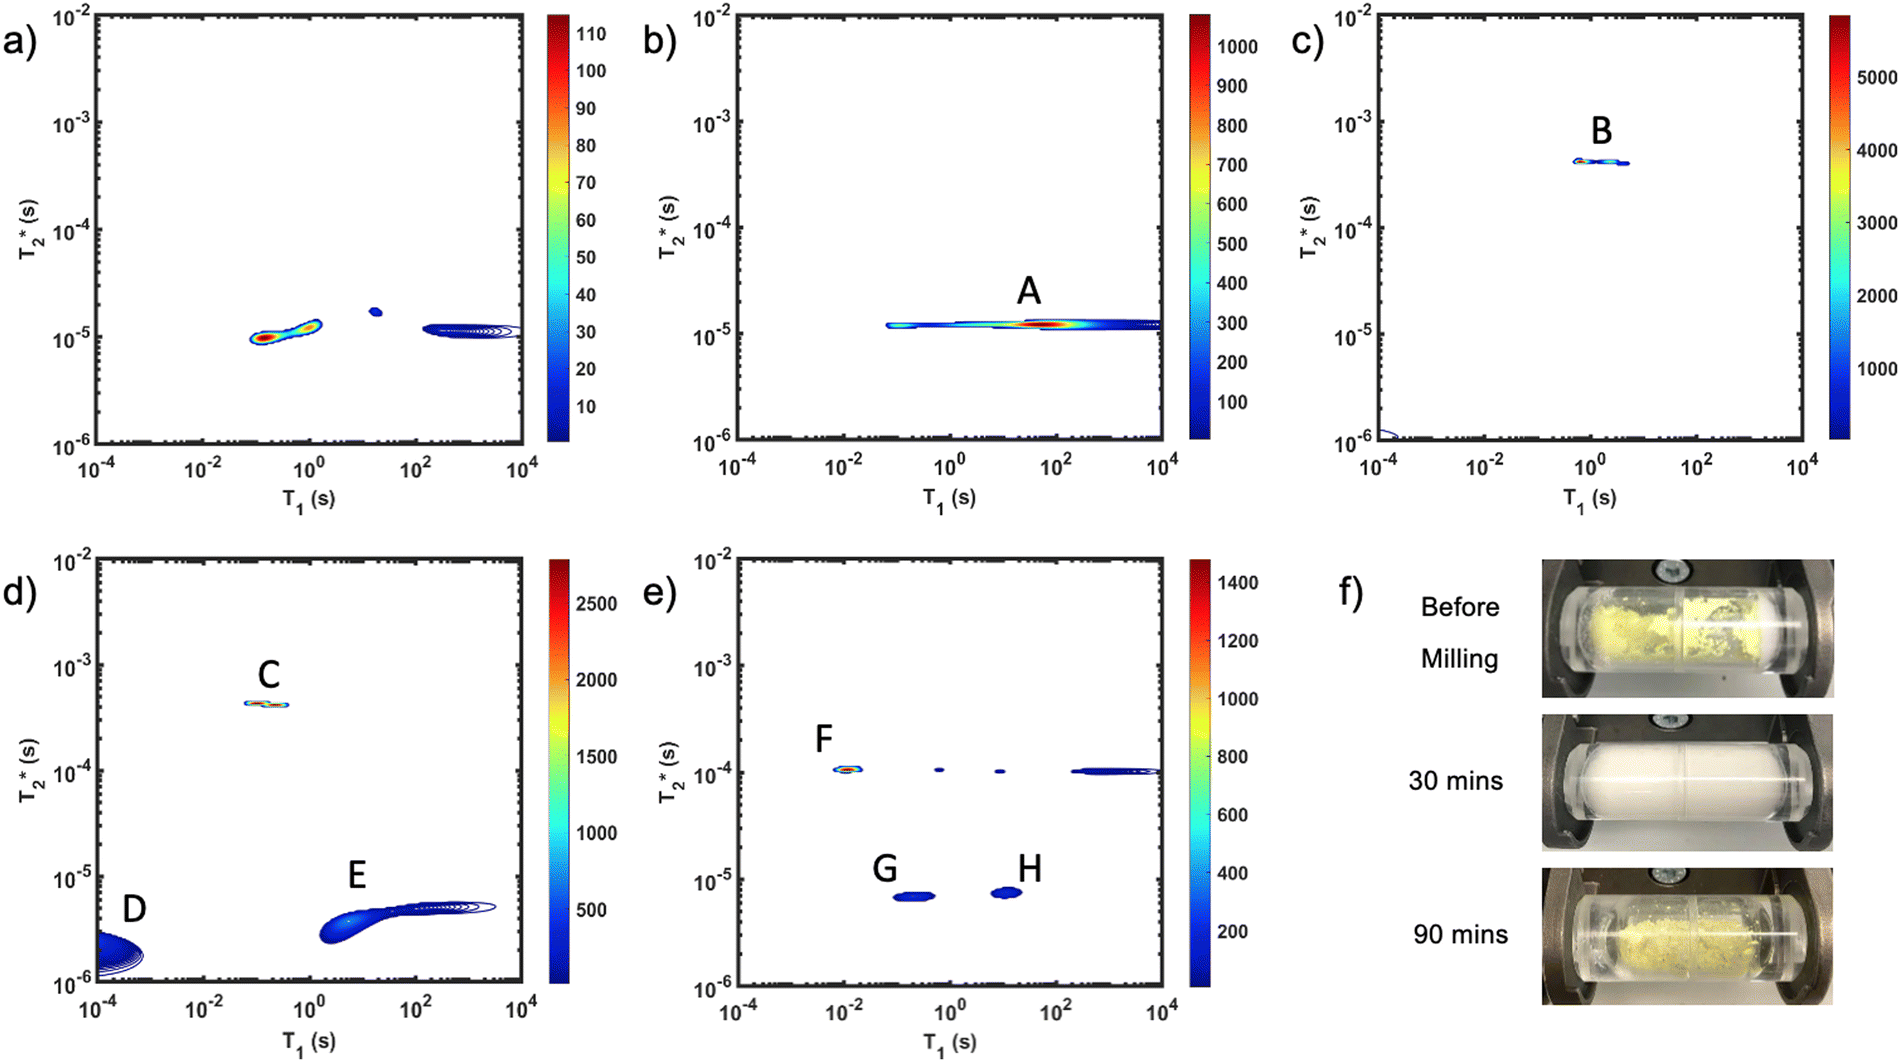 | ||
Fig. 1
 correlation plots of (a) zinc oxide, (b) 2,5-dihydroxyterephthalic acid, (c) reactants pre-milling, (d) intermediate after 30 minutes of milling, and (e) Zn-MOF-74 as synthesized. In the (c) before milling plot, the lone intense peak corresponds to water signal which overpowers the signal of the other reagents because of its large quantity of hydrogen. Zinc oxide (a) only shows probe background signal. New peaks in the (e) after milling plot indicate the formation of Zn-MOF-74. The (f) distinct colour changes from bright yellow, to white, to yellow, are evident. Scaling was adjusted to better reveal low signal. Data collected at 295 K, 4.7 Tesla. correlation plots of (a) zinc oxide, (b) 2,5-dihydroxyterephthalic acid, (c) reactants pre-milling, (d) intermediate after 30 minutes of milling, and (e) Zn-MOF-74 as synthesized. In the (c) before milling plot, the lone intense peak corresponds to water signal which overpowers the signal of the other reagents because of its large quantity of hydrogen. Zinc oxide (a) only shows probe background signal. New peaks in the (e) after milling plot indicate the formation of Zn-MOF-74. The (f) distinct colour changes from bright yellow, to white, to yellow, are evident. Scaling was adjusted to better reveal low signal. Data collected at 295 K, 4.7 Tesla. | ||
Fig. 1 demonstrates the progress of the Zn-MOF-74 reaction examined by  relaxation correlation measurement. Distinct changes in the peaks are visible between the reactant, pre-milling, and after milling plots which indicates the formation of the new MOF product. Correlation plots of (a) zinc oxide and (b) 2,5-dihydroxyterephthalic acid are displayed using notably different scaling to account for low sample signal. The plots of (c) reactants pre-milling, (d) intermediate after 30 minutes of milling, and (e) Zn-MOF-74 as synthesized, all contained the same amount of material and hydrogen, but loss of product did occur during transfer to the measurement vial. The plots show variable scaling to better reveal low signal.
The zinc oxide contains minimal hydrogen which is apparent in Fig. 1a. Any observed signal can be ascribed to background signal from the probe, and possible impurities in the zinc oxide sample. The 2,5-dihydroxyterephthalic acid correlation plot (Fig. 1b) shows a single short lifetime  of 12 μs (peak A). The T1 value at the center of the peak is at 48 s and at the very left side of the peak it is 0.11 s. The FID shows a clear sinc-Gaussian decay (ESI,† see Section S3).
The starting materials before milling included 0.75 mL of water, which is apparent in the 2D plot (Fig. 1c, peak B). Water has relatively long T1 and  lifetimes due to significant mobility in the liquid state. The noted intermediate was captured after 30 minutes of milling (Fig. 1d). The water peak is still very evident (peak C), with new peaks appearing in the bottom corners of the plot (peaks D and E). Formation of MOF-74 (Fig. 1e) shows multiple new peaks, attributed to assembly of the periodic porous solid. The T1 of the major peak on the upper left of the plot is at 12 ms (peak F). The T1 of the two peaks on the bottom are 0.20 s and 11.2 s (peaks G and H, respectively). The
  values are 7 μs (G), 7 μs (H) and 106 μs (F). The smaller less intense peaks trailing off to the right at the longer
  are most likely artifacts. Water adsorption of the porous Zn-MOF-74 product explains the change in the water peak.52 The relaxation time values for all these samples are summarized in Table S1 in the ESI.†
3.3 ZIF-8 reaction: in situ MR analysis
The important advantage to highlight with the MR measurement is the ability to undertake analysis of the reaction in the milling container. We consider analysis in the milling container, even when removed from the shaker apparatus, to be an in situ measurement. The synthesis of ZIF-8 served as our example (Fig. 2). The reaction was milled in a small lab-made Teflon jar with two small zirconia balls. These materials, Teflon and zirconia, have minimal hydrogen content yielding minimal background signal. This allows the reaction to be milled and analysed without ever having to open the milling vessel. The measurements of (a) zinc oxide, (b) 2-methylimidazole, and (c) zinc acetate dihydrate, all employed a zoomed scale compared to the display scale for the reaction to reveal low amplitude background signal. The plots of (d) reactants pre-milling, (e) ZIF-8 as synthesized and (f) ZIF-8 purified, all contained the same amount of material and therefore, the same quantity of hydrogen. The plots have variable scaling to better reveal low signal.
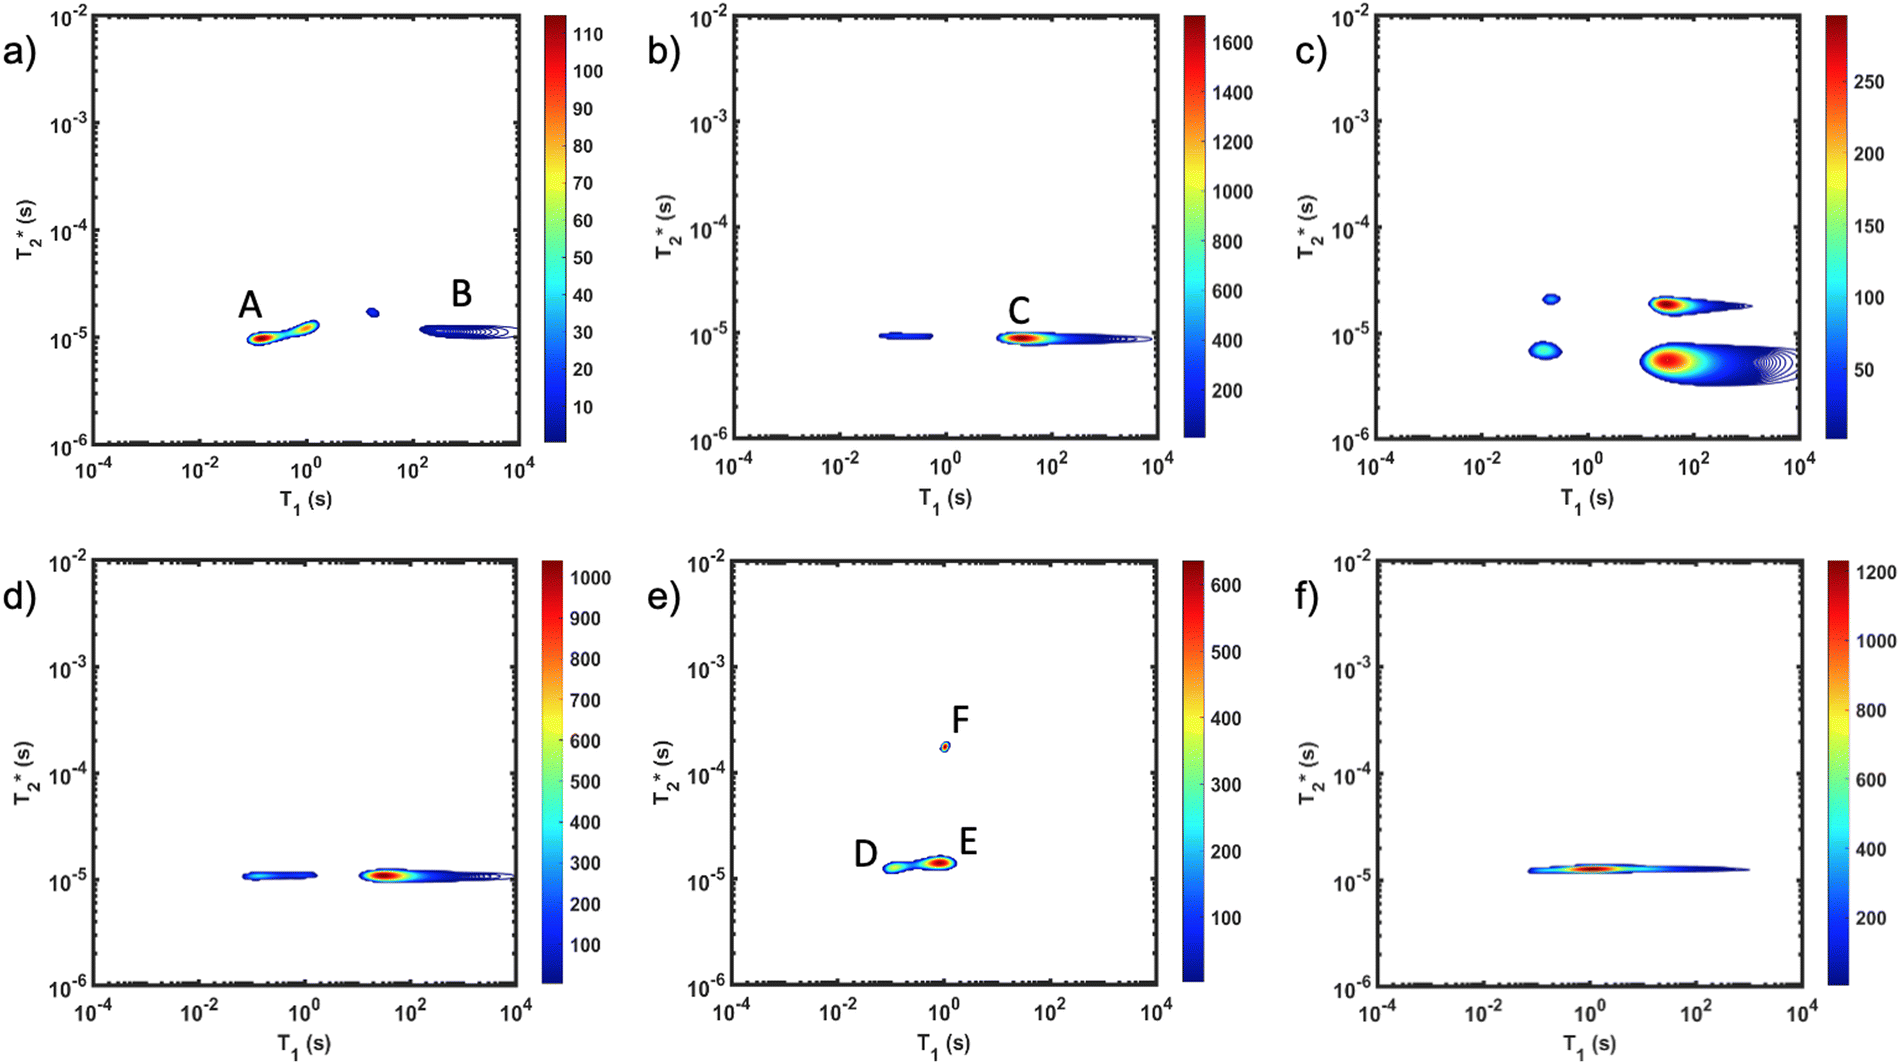 | ||
Fig. 2
 correlation plots of (a) zinc oxide, (b) 2-methylimidazole, (c) zinc acetate dihydrate, (d) reactants pre-milling, (e) ZIF-8 as synthesized and (f) ZIF-8 purified. The plot of (d) pre-milling is very similar to the (b) 2-methylimidazole plot due to having more hydrogen from that reactant. Zinc oxide (a) only shows probe background signal. Scaling was adjusted to better reveal low signal. Data collected at 295 K, 4.7 Tesla. correlation plots of (a) zinc oxide, (b) 2-methylimidazole, (c) zinc acetate dihydrate, (d) reactants pre-milling, (e) ZIF-8 as synthesized and (f) ZIF-8 purified. The plot of (d) pre-milling is very similar to the (b) 2-methylimidazole plot due to having more hydrogen from that reactant. Zinc oxide (a) only shows probe background signal. Scaling was adjusted to better reveal low signal. Data collected at 295 K, 4.7 Tesla. | ||
As expected, the zinc oxide signal (Fig. 2a) consists mostly of background signal from the probe and sample vessel. The signal intensity is very weak since there is very little hydrogen present. The major peaks have T1 values of 140 ms (A) and 960 ms (B), and  values of 10 μs and 12 μs. The 2-methylimidazole 2D plot (Fig. 2b) indicates one short lifetime
  signal at 9 μs (C). This major peak has a T1 value of 24.9 s. We posit that the smaller less intense peak with a T1 of 0.17 s comes from background signal. For 2-methylimidazole, the decay is sinc-Gaussian (ESI,† see Section S3). Zinc acetate dihydrate has four peaks with
  values of 6 μs and 19 μs and T1 values of 0.15 s and 30.9 s (Fig. 2c).
Starting materials were mixed and spectra collected prior to milling (Fig. 2d). They display a very similar profile to 2-methylimidazole (Fig. 2b), indicating that most of the hydrogen signal is coming from that reactant. The plot of the ZIF-8 product (Fig. 2e) consists of two distinct peaks. The T1 values are similar at 0.83 s (peak D) and 10.4 s (peak E), with  values of 14 μs (D) and 175 μs (E). The main signal, with the longer
  , indicates the formation of ZIF-8. The sharp signal towards the top of the plot is evidence of water (F) and acetic acid formed as by-products in the reaction. This is supported by Fig. 2f, which shows the product after rinsing and drying overnight under vacuum where the liquid peak is no longer visible. The remaining signal has very similar relaxation time values as the previous plot. The relaxation time values for all these samples are summarized in Table S1 in the ESI.†
3.4 Exponential vs. non-exponential analysis
Two types of processing exist for data sets. The simplest option is to process all the data assuming the transverse magnetization decays are exponentials. This type of processing is simple and is commonly employed in relaxation correlation measurements such as T1–T2. The Schlumberger program employed is user-friendly and only requires a few parameters to be manually changed. We utilized this method to process the results in Fig. 1 and 2. The disadvantage is that many rigid samples, like many of our solid samples, display non-exponential Gaussian or sinc-Gaussian
  decay curves (ESI,† see Section S3).53 The sinc-Gaussian non-exponential
  decay in the time domain occurs due to a distribution of Pake doublets in the frequency domain.54
Processing non-exponential decay curves as exponential curves will introduce errors and harm quantification. However, the work of Guo et al. demonstrates that the plots using this approximation yield similar relaxation time values to the non-exponential processing results.47 Exponential processing is a suitable method for species identification and differentiation, but it is not suitable for quantification of the samples. This is further supported in Fig. 3 where we compare exponential and non-exponential processing of ZIF-8 synthesis where the exponential processing peaks are very similar to the graphs generated from the non-exponential processing method (ESI,† see Section S4).
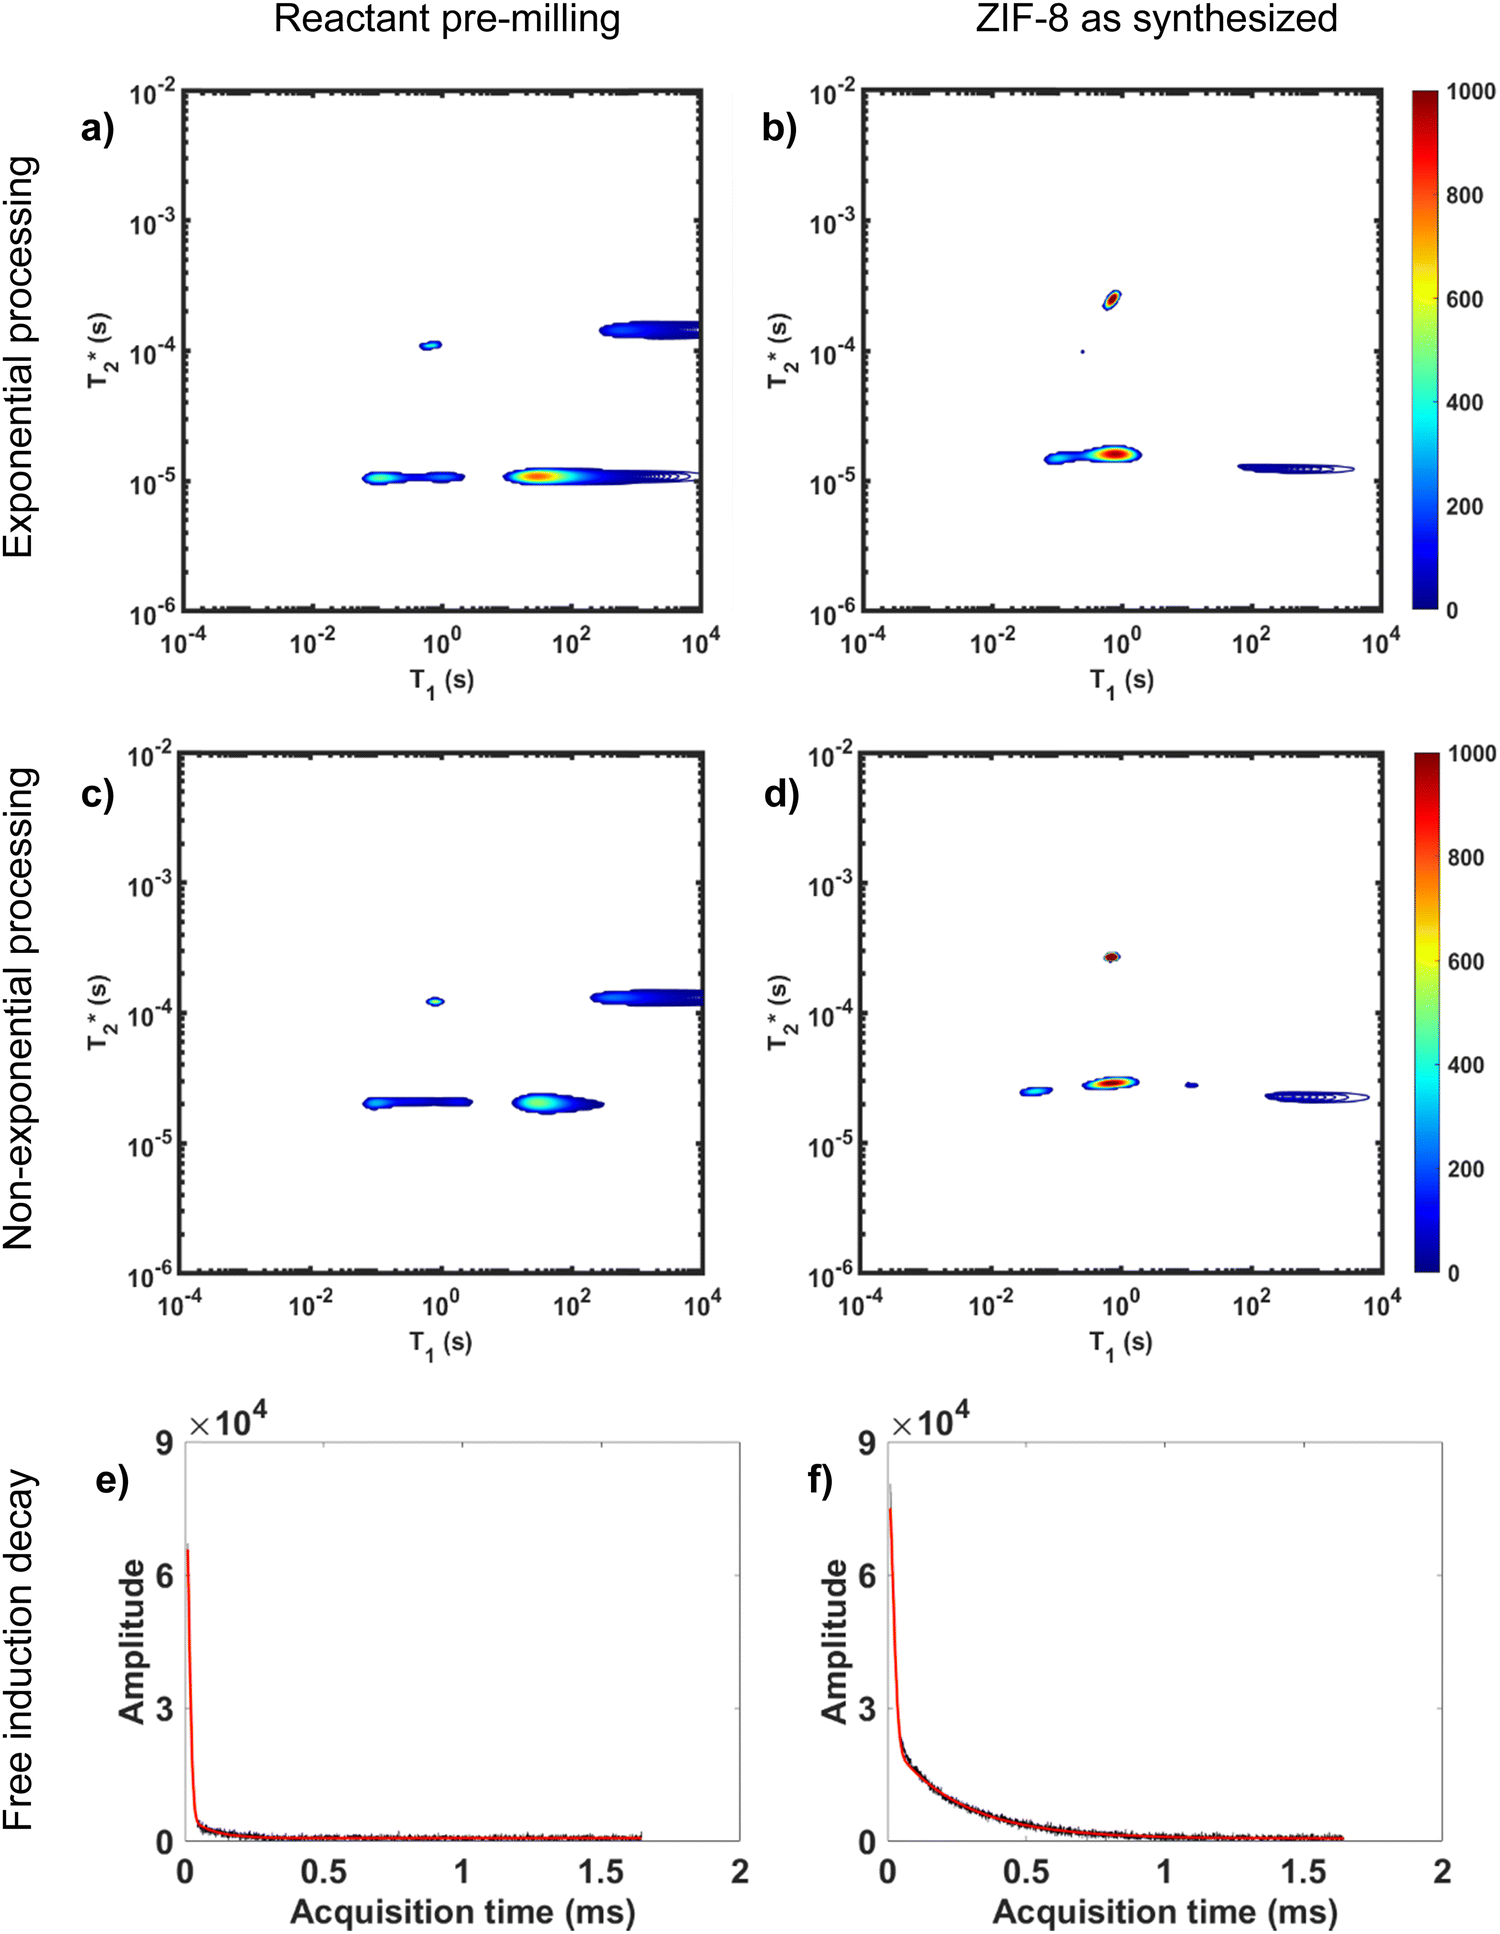 | ||
Fig. 3 Comparison of exponential and non-exponential processing of ZIF-8 synthesis. Plots a and b are  correlation plots using exponential processing while c and d used non-exponential processing. The plots are described as the following: (a) reactants pre-milling with exponential processing, (b) ZIF-8 as synthesized with exponential processing, (c) reactants pre-milling with non-exponential processing, and (d) ZIF-8 as synthesized with non-exponential processing. The 1D plots of free induction decay of correlation plots using exponential processing while c and d used non-exponential processing. The plots are described as the following: (a) reactants pre-milling with exponential processing, (b) ZIF-8 as synthesized with exponential processing, (c) reactants pre-milling with non-exponential processing, and (d) ZIF-8 as synthesized with non-exponential processing. The 1D plots of free induction decay of  using non-exponential processing of (e) ZIF-8 as synthesized and (f) ZIF-8 purified. Both 1D plots show a combination of two types of decay: Gaussian and exponential decay. Data collected at 295 K, 4.7 Tesla. using non-exponential processing of (e) ZIF-8 as synthesized and (f) ZIF-8 purified. Both 1D plots show a combination of two types of decay: Gaussian and exponential decay. Data collected at 295 K, 4.7 Tesla. | ||
Non-exponential processing is vital for quantifying signal intensity when dealing with Gaussian or sinc-Gaussian curves. The processing method reported by Guo et al. processes the non-exponential part of the decay and the exponential part separately to generate composite correlation plots to achieve accurate quantifiable results with non-exponential decays, or a combination of exponential and non-exponential decays.47 MR measurements are direct measurements of the nuclei under study, 1H in this case, and the processed signal intensity should be directly proportional to the 1H content of the sample. In our study, the hydrogen signal of materials before milling and after milling is conserved as established in both of our MOF reactions milled in lab-made Teflon jars. The synthesis of ZIF-8 and its conservation of signal is demonstrated in Fig. 3.
Fig. 3a and b demonstrate the correlation plot results using exponential decay processing while Fig. 3c–f demonstrate results using non-exponential processing. As mentioned previously, the resulting relaxation time values between the two types of processing methods are very similar but, accurate quantification requires non-exponential processing. Fig. 3 compares the two methods. In the pre-milling Fig. 3a and c, the most intense peak is located at T1 of 28.8 s in both types of processing for the same sample. The  varies from 11 μs for exponential processing to 21 μs for non-exponential processing. In the post-milling Fig. 3b and d, the main peak is situated at 0.78 s and 16 μs for exponential processing and 0.67 s and 29 μs for non-exponential processing, for T1 and
  , respectively. The liquid peak, found at a longer
  , has a value of 25 μs for exponential processing and 270 μs for non-exponential processing. The relaxation times are summarized in Table S2 of the ESI.† The minor differences from our previous ZIF-8 results in Fig. 2 are due to measurements being run on different days. In this case, humid lab conditions could be responsible for water contamination and a liquid peak at a longer
  in the pre-milling plots.
The easiest and most accurate method of quantification involves the back-extrapolation of 1D  data sets, obtained by simple FID measurement to obtain the time-zero value intensity (Fig. 3e and f). In this case, the decay of pre-milling and ZIF-8 as synthesized both contain a Gaussian and an exponential component. In these FID plots, the black line represents the raw data while the red line indicates the fitting. The reactants pre-milling had a signal intensity of 8.32 × 10⁴ and the ZIF-8 as synthesized of 8.31 × 10⁴, establishing conservation of hydrogen signal before and after milling. The FID decays reveal clear differences in the lifetimes of the 1H species present before and after milling.
4. Conclusions
We describe a new method of solid-state analysis of mechanochemical reactions using relaxation correlation plots. A simple saturation recovery sequence, with full FID data collected, was employed to acquire
  data from the solid-like samples. A short instrument deadtime was essential to capturing the solid-like signal. Zn-MOF-74 and ZIF-8 were mechanochemically synthesised in a ball mill and monitored using
  correlation maps. Significant differences in relaxation correlation peaks were used to determine the completion of the reaction, confirmed by PXRD data. The
  measurement provides an easy, versatile, and solvent-free process especially useful for mechanochemical reactions and formulations, particularly with judicious choice of reaction vessel allowing for in situ analysis as is described here. This new method may be applied to many real-life industrial processes and materials with proper adjustments, as already seen with shales and coals.43–45
In future work the  analysis method may be further improved by utilising a Look Locker manipulation in the T1 dimension instead of saturation recovery.55 This permits acquisition of multiple FIDs per saturation, instead of acquiring only one FID per saturation using our current
  measurement. Finally, low field benchtop MR instrument is the natural pathway to more routine implementation of these methods, as the lower static magnetic field also results in shorter T1 lifetimes, permitting more rapid overall measurement.
Author contributions
MEL: methodology, investigation, formal analysis, data curation, writing – original draft. JG: validation. BM: investigation, technical support. HMT: investigation, validation. TF: validation, writing. BJB: funding procurement, conceptualization, writing BAB: funding procurement, conceptualization, writing.Conflicts of interest
There are no conflicts to declare.Acknowledgements
The authors respectfully acknowledge support for this work from the University of New Brunswick. B. J. B. is grateful for financial support from Natural Science and Engineering Council of Canada (NSERC; RGPIN-2015-6122) and the Canada Research Chair Program (CRC-950-230894). B. A. B. also thanks NSERC (RGPIN-2018-04021) as well as the New Brunswick Foundation for Innovation (NBIF) Emerging Projects Program (EP-2020-005).References
- S. L. James, C. J. Adams, C. Bolm, D. Braga, P. Collier, T. Friščić, F. Grepioni, K. D. M. Harris, G. Hyett, W. Jones, A. Krebs, J. Mack, L. Maini, A. G. Orpen, I. P. Parkin, W. C. Shearouse, J. W. Steed and D. C. Waddell, Chem. Soc. Rev., 2012, 41, 413–447, 10.1039/C1CS15171A.
- D. Tan and T. Friščić, Eur. J. Org. Chem., 2018, 18–33, DOI:10.1002/ejoc.201700961.
- I. N. Egorov, S. Santra, D. S. Kopchuk, I. S. Kovalev, G. V. Zyryanov, A. Majee, B. C. Ranu, V. L. Rusinov and O. N. Chupakhin, Green Chem., 2020, 22, 302–315, 10.1039/c9gc03414e.
- D. Tan and F. García, Chem. Soc. Rev., 2019, 48, 2274–2292, 10.1039/c7cs00813a.
- A. Moores, Curr. Opin. Green Sustainable Chem., 2018, 12, 33–37, DOI:10.1016/j.cogsc.2018.05.004.
- N. R. Rightmire and T. P. Hanusa, Dalton Trans., 2016, 45, 2352–2362, 10.1039/c5dt03866a.
- D. Braga, L. Maini and F. Grepioni, Chem. Soc. Rev., 2013, 42, 7638–7648, 10.1039/c3cs60014a.
- A. Bose and P. Mal, Beilstein J. Org. Chem., 2019, 15, 881–900, DOI:10.3762/bjoc.15.86.
- T. Friščić, Chem. Soc. Rev., 2012, 41, 3493–3510, 10.1039/c2cs15332g.
- C. Mottillo and T. Friščić, Molecules, 2017, 22, 1–38, DOI:10.3390/molecules22010144.
- T. Friščić, I. Halasz, V. Štrukil, M. Eckert-Maksić and R. E. Dinnebier, Croat. Chem. Acta, 2012, 85, 367–378, DOI:10.5562/cca2014.
- K. S. McKissic, J. T. Caruso, R. G. Blair and J. Mack, Green Chem., 2014, 16, 1628–1632, 10.1039/c3gc41496e.
- T. Stolar and K. Užarević, CrystEngComm, 2020, 22, 4511–4525, 10.1039/D0CE00091D.
- P. Bhakat, A. Nigam and S. Jagtap, Nanotechnol. Environ. Eng., 2023, 8, 815–827, DOI:10.1007/s41204-023-00325-w.
- Y. Hu, B. Li, C. Yu, H. Fang and Z. Li, Nano-Struct. Nano-Objects, 2023, 63, 288–312, DOI:10.1016/j.nanoso.2023.100997.
- J. L. Howard, Q. Cao and D. L. Browne, Chem. Sci., 2018, 9, 3080–3094, 10.1039/c7sc05371a.
- J. G. Hernández and C. Bolm, J. Org. Chem., 2017, 82, 4007–4019, DOI:10.1021/acs.joc.6b02887.
- K. Užarević, I. Halasz and T. Friščić, J. Phys. Chem. Lett., 2015, 6, 4129–4140, DOI:10.1021/acs.jpclett.5b01837.
- A. A. L. Michalchuk, I. A. Tumanov, V. A. Drebushchak and E. V. Boldyreva, Faraday Discuss., 2014, 170, 311–335, 10.1039/c3fd00150d.
- R. Schmidt, C. F. Burmeister, M. Baláž, A. Kwade and A. Stolle, Org. Process Res. Dev., 2015, 19, 427–436, DOI:10.1021/op5003787.
- R. Schmidt, H. M. Scholze and A. Stolle, Int. J. Ind. Chem., 2016, 7, 181–186, DOI:10.1007/s40090-016-0078-8.
- A. Stolle, R. Schmidt and K. Jacob, Faraday Discuss., 2014, 170, 267–286, 10.1039/c3fd00144j.
- P. A. Julien, I. Malvestiti and T. Friščić, Beilstein J. Org. Chem., 2017, 13, 2160–2168, DOI:10.3762/bjoc.13.216.
- I. Halasz, S. A. J. Kimber, P. J. Beldon, A. M. Belenguer, F. Adams, V. Honkimäki, R. C. Nightingale, R. E. Dinnebier and T. Friščić, Nat. Protoc., 2013, 8, 1718–1729, DOI:10.1038/nprot.2013.100.
- T. Friščić, I. Halasz, P. J. Beldon, A. M. Belenguer, F. Adams, S. A. J. Kimber, V. Honkimäki and R. E. Dinnebier, Nat. Chem., 2013, 5, 66–73, DOI:10.1038/nchem.1505.
- D. Gracin, V. Štrukil, T. Friščić, I. Halasz and K. Užarević, Angew. Chem., Int. Ed., 2014, 53, 6193–6197, DOI:10.1002/anie.201402334.
- L. Batzdorf, F. Fischer, M. Wilke, K. J. Wenzel and F. Emmerling, Angew. Chem., Int. Ed., 2015, 54, 1799–1802, DOI:10.1002/anie.201409834.
- A. A. L. Michalchuk and F. Emmerling, Angew. Chem., Int. Ed., 2022, 61, e202117270, DOI:10.1002/anie.202117270.
- A. A. L. Michalchuk, I. A. Tumanov, S. Konar, S. A. J. Kimber, C. R. Pulham and E. V. Boldyreva, Adv. Sci., 2017, 4, 1700132, DOI:10.1002/advs.201700132.
- K. Singh and B. Blümich, TrAC, Trends Anal. Chem., 2016, 83, 12–26, DOI:10.1016/j.trac.2016.02.014.
- S. P. Brown, Solid State Nucl. Magn. Reson., 2011, 41, 1–27, DOI:10.1016/j.ssnmr.2011.11.006.
- A. J. Taylor, M. Salerno, R. Dharmakumar and M. Jerosch-Herold, JACC: Cardiovasc. Imaging, 2016, 9, 67–81, DOI:10.1016/j.jcmg.2015.11.005.
- Z. Dong, T. Andrews, C. Xie and T. Yokoo, BioMed Res. Int., 2015, 2015, 1–2, DOI:10.1155/2015/139043.
- J. Mitchell, T. C. Chandrasekera, D. J. Holland, L. F. Gladden and E. J. Fordham, Phys. Rep., 2013, 526, 165–225, DOI:10.1016/j.physrep.2013.01.003.
- G. R. Coates, L. Xiao and M. G. Prammer, NMR Logging Principles and Applications, Halliburton Energy Services, Gulf Publishing Company, Houston, 1st edn, 1999 Search PubMed.
- Q. Chen, A. E. Marble, B. G. Colpitts and B. J. Balcom, J. Magn. Reson., 2005, 175, 300–308, DOI:10.1016/j.jmr.2005.05.001.
- A. G. Marangoni, B. Macmillan, S. Marty and B. J. Balcom, Magnetic Resonance in Food Science, 2009, pp. 105–112 Search PubMed.
- S. Hemdane, P. J. Jacobs, G. M. Bosmans, J. Verspreet, J. A. Delcour and C. M. Courtin, Food Chem., 2017, 236, 68–75, DOI:10.1016/j.foodchem.2017.01.020.
- M. Y. Troutman, I. V. Mastikhin, B. J. Balcom, T. M. Eads and G. R. Ziegler, J. Food Eng., 2001, 48, 257–267, DOI:10.1016/S0260-8774(00)00167-9.
- F. Mariette, Curr. Opin. Colloid Interface Sci., 2009, 14, 203–211, DOI:10.1016/j.cocis.2008.10.006.
- J. O. Marreiros, R. de Oliveira-Silva, P. Iacomi, P. L. Llewellyn, R. Ameloot and D. Sakellarzou, J. Am. Chem. Soc., 2021, 143, 8249–8254, DOI:10.1021/jacs.1c03716.
- R. Enjilela, J. Guo, B. MacMillan, F. Marica, A. Afrough and B. J. Balcom, J. Magn. Reson., 2021, 326, 106961, DOI:10.1016/j.jmr.2021.106961.
- M. S. Zamiri, B. MacMillan, F. Marica, J. Guo, L. Romero-Zerón and B. J. Balcom, Fuel, 2021, 284, 119014, DOI:10.1016/j.fuel.2020.119014.
- M. S. Zamiri, M. Florea, L. Romero-Zerón and B. J. Balcom, Chem. Eng. J., 2021, 428, 131042, DOI:10.1016/j.cej.2021.131042.
- J. Guo, B. Macmillan, M. Sadegh Zamiri and B. J. Balcom, Fuel, 2021, 302, 121106, DOI:10.1016/j.fuel.2021.121106.
- J. G. Schiffmann, F. Emmerling, I. C. B. Martins and L. Van Wullen, Solid State Nucl. Magn. Reson., 2020, 109, 101687, DOI:10.1016/j.ssnmr.2020.101687.
- J. Guo, B. MacMillan, M. S. Zamiri and B. J. Balcom, J. Magn. Reson., 2021, 328, 107005, DOI:10.1016/j.jmr.2021.107005.
- P. A. Julien, K. Užarević, A. D. Katsenis, S. A. J. Kimber, T. Wang, O. K. Farha, Y. Zhang, J. Casaban, L. S. Germann, M. Etter, R. E. Dinnebier, S. L. James, I. Halasz and T. Friščić, J. Am. Chem. Soc., 2016, 138, 2929–2932, DOI:10.1021/jacs.5b13038.
- S. Tanaka, T. Nagaoka, A. Yasuyoshi, Y. Hasegawa and J. F. M. Denayer, Cryst. Growth Des., 2018, 18, 274–279, DOI:10.1021/acs.cgd.7b01211.
- T. Xiao and D. Liu, Microporous Mesoporous Mater., 2019, 283, 88–103, DOI:10.1016/j.micromeso.2019.03.002.
- K. S. Park, Z. Ni, A. P. Côté, J. Y. Choi, R. Huang, F. J. Uribe-Romo, H. K. Chae, M. O’Keeffe and O. M. Yaghi, Proc. Natl. Acad. Sci. U. S. A., 2006, 103, 10186–10191, DOI:10.1073/pnas.0602439103.
- J. Rô Me Canivet, A. Fateeva, Y. Guo, B. Coasne and D. Farrusseng, Chem. Soc. Rev., 2014, 43, 5594–5617, 10.1039/c4cs00078a.
- I. J. Lowe and R. E. Norberg, Phys. Rev., 1957, 107, 46–61, DOI:10.1103/PhysRev.107.46.
- W. Derbyshire, M. van den Bosch, D. van Dusschoten, W. MacNaughtan, I. A. Farhat, M. A. Hemminga and J. R. Mitchell, J. Magn. Reson., 2004, 168, 278–283, DOI:10.1016/j.jmr.2004.03.013.
- J. Guo, M. S. Zamiri and B. J. Balcom, J. Magn. Reson., 2022, 335, 107123, DOI:10.1016/j.jmr.2021.10712.
Footnote |
| † Electronic supplementary information (ESI) available. See DOI: https://doi.org/10.1039/d3cp05555h |
| This journal is © the Owner Societies 2024 |