Self-assembly morphology transition mechanism of similar amphiphilic molecules†
Received
19th September 2023
, Accepted 29th November 2023
First published on 29th November 2023
Abstract
Molecular self-assembly is a powerful synthesis method for nanomaterials. Promoting the development of self-assembly is not only conducive to the efficient preparation of nanomaterials but also promotes progress in other research fields. Therefore, it is necessary to enhance the advancement of molecular self-assembly, and the key is to deepen the understanding of the correlation between molecular characteristics and self-assembly morphologies. However, some similar amphipihlic molecules self-assemble into assemblies with significant morphology difference, which is challenging to clear the mechanism for experimenters. In this work, we explore the microscopic mechanism of six similar molecules by MD simulations, and the influences of molecular conformation, atomic groups, and polycyclic aromatic hydrocarbons on morphologies are discussed in detail. Our findings enrich the design principles of amphiphilic molecules for self-assembly, which promotes the modular design of molecular self-assembly.
1. Introduction
Molecular self-assembly is a powerful nanomaterial processing method using appropriate molecules and self-assembly pathways.1 In general, molecules can be categorized into two blocks, and through molecular design, people can manipulate interactions between blocks to yield various ordered morphologies. Many factors can affect the interactions between these blocks. For instance, Feringa and colleagues synthesized various chiral molecules and investigated the impact of residue groups, substituents, and solvents on helical supramolecular structures.2 With a deeper understanding of the self-assembly mechanism, more complex microscopic morphologies can be prepared by carefully designing molecules and the self-assembly process. For example, Yang et al. proposed a complex hierarchical assembly strategy to construct inorganic and organic nanotube composites.3 Lin et al. designed two polymers and prepared the nanotube rings with spiral patterns using the two-step self-assembly strategy.4 Exploring the molecular mechanism of self-assembly also promotes the understanding of microbiological phenomena, and people can obtain more design inspiration from nature for molecular self-assembly. For example, LaBean et al. summarized the self-assembly strategies of DNA and RNA, which utilize their inherent base pairing to construct various new biological nanomaterials.5
Overall, the development of molecular self-assembly is not only beneficial to the preparation of nanomaterials but also aids in the development of other research fields.6–11 However, how far can we push molecular self-assembly?12 What if one can use molecular self-assembly to build functional nanomaterials like Legos? It is imperative to elucidate the correlation between molecular characteristics and self-assembly morphologies to enhance the advancement of molecular self-assembly. Nowadays, various characterization techniques are developed,13 such as transmission electron microscopy (TEM), scanning electron microscopy (SEM), atomic force microscopy (AFM),14 optical microscopy (OM), neutron scattering (NS), X-ray scattering (XS), and light scattering (LS), and people can acquire comprehensive 2D15 or even 4D information regarding self-assembly morphologies and pathways with varying temporal-spatial resolutions. However, refining the underlying logic behind how different factors influence self-assembly morphologies, such as chemical structures, spatial arrangements, and intermolecular interactions, remains challenging for existing experimental methods. For example, Zhang et al. found that two amphiphilic molecules with similar chemical structures can self-assemble into different morphologies. However, because most experimental techniques lack the atomic details, it is difficult to understand the microscopic mechanism of causing morphological differences.16,17 Therefore, it is necessary to find appropriate research methods to explore the morphology regulatory mechanisms of molecular self-assembly. Molecular dynamics (MD) simulation, often recognized as the computational method, can describe intermolecular interactions, molecular structures, and kinetic information on the atomic scale, which has been widely used in molecular self-assembly.18–22 With the development of the force-field construction method,23,24 the morphology prediction ability of the simulation is enhanced, which provides a coherent picture of observables/properties obtained in different experiments.25,26 At the same time, Huang et al. have used the coarse-grained MD to give a statistical perspective on causing morphological differences found by Zhang et al.27 However, the computing cost prevents the direct observation of the morphology evolution process in larger simulation systems, impeding a deeper understanding of the underlying mechanisms.
In this work, we use the Brownian dynamics simulation to study the self-assembly kinetics of six similar amphiphilic molecules based on Zhang and Wang's reports.16,17,28 The influences of molecular conformation, atomic groups, and polycyclic aromatic hydrocarbons on self-assembly morphologies are studied carefully. This work constructs a larger simulation system and shows a direct self-assembly pathway compared with Huang's work so that it can provide a detailed relationship between molecular characteristics and self-assembly morphologies.
2. Model and simulation method
2.1 Simulation method
Brownian dynamics simulation is a molecular simulation method using implicit solvents. The effect of solvent molecules is implicitly treated by a noise term, which satisfies a fluctuation–dissipation relationship. The motion of molecules is controlled by Langevin dynamics which can be described by:| |  | (1) |
where γ is the friction coefficient, U(x) is the particle interaction potential, T is the temperature, kB is the Boltzmann constant, and R(t) is the delta-correlated stationary Gaussian process with zero-mean, satisfying 〈R(t)〉 = 0, 〈R(t)R(t′)〉 = δ(t − t′). The Brownian dynamic algorithm with the temperature controlling method (NVT ensemble) is based on the LAMMPS software.29 The time step is 0.05 ps. γ is 50 ps−1 (control temperature per 1000 steps). The morphologies are observed by OVITO.30
2.2 Model details
The amphiphilic molecules studied in this work can be divided into two building blocks, as shown in Fig. 1(a). By permutation of two blocks, we can obtain a series of amphiphilic molecules with similar chemical structures. In our work, we select six kinds of amphiphilic molecules, which are renamed for convenience. From Fig. 1(b), Wang et al. synthesized m-APO and s-APO; s-BPO and s-BPN are synthesized by Zhang et al., while m-APN and s-APN are complementary molecules in this work. To maximize the expansion of our simulation system, we use the coarse-grained molecular model, and the mapping rules between models and real molecules are shown in Fig. 1(c). The carbon groups of the pyridine are mapped to the SC5 bead, while the carbon groups of polycyclic aromatic hydrocarbons are mapped to the SC3 bead. The linear alkane in block B is mapped to C2–C1–C2. Furthermore, the unbonded interactions between beads are described by the cut-off Lennard-Jones (LJ) potential Uij| |  | (2) |
where the interaction parameters refer to the Dry Martini force field,31 which is introduced in Table S1 (ESI†). To reflect the dispersion behavior of the hydrophilic pyridine, the interaction cutoff of the pyridine is set to be 21/6σ (pure repulsive potential). To reflect the aggregation behavior of the hydrophobic blocks, the interaction cutoff is set to be 4σ. The modeling method is based on the work of Lin et al.,32 and we also successfully explain the microscopic mechanism of another self-assembly system.33 The harmonic potential is utilized to describe the bonded interactions of a bond and an angle. The bonded interaction parameters are obtained from all-atom MD sampling of the single molecule by the Boltzmann inversion method.34 The probability distribution of the bond length and angle is described by| |  | (3) |
where r is the bond length, θ is the bond angle, and φ is the dihedral angle. Hx(x) is the distribution histograms. Pr and Pθ are the volume normalized distribution functions.
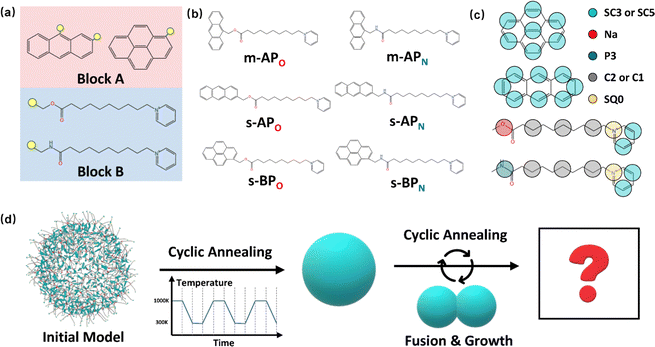 |
| | Fig. 1 (a) Two blocks of amphiphilic molecules. (b) Molecular formulas of amphiphilic molecules and their names in this work. (c) Mapping rules between the amphiphilic molecules and their coarse-grained models. (d) Diagram of the simulation process in this work. | |
The bonded coarse-grained potential can be written by
| | U(x) = −kBT![[thin space (1/6-em)]](https://www.rsc.org/images/entities/char_2009.gif) ln ln![[thin space (1/6-em)]](https://www.rsc.org/images/entities/char_2009.gif) P(x) P(x) | (4) |
By fitting
U(
x), the stiffness factors of the harmonic potential function can be obtained, which is introduced in Fig. S1 (ESI
†). For all-atom MD simulations, the bonded parameters are optimized by the Gaussion16,
35 Multiwfn,
36 and Sobtop software,
37 and the GAFF force field describes the unbonded interaction.
38 The atomic charges use the restrained electrostatic potential atomic partial (RESP) charges calculated by the Gasussian16 and Sobtop software for the all-atom MD simulation.
39 The OPC3 water model is used for the water molecules, and the equilibrium ion is bromine.
40 The size of the simulation system is 3 nm × 3 nm × 3 nm. The isothermal–isobaric (
NPT) ensemble is selected, using the V-rescale thermostat and the Berendsen barostat to control the temperature and pressure, and the time constants are 0.1 ps and 1 ps. All the all-atom MD systems are simulated 3 times, and the total time of every simulation is 1 μs. All the trajectories are saved every 0.1 ns for sampling. All-atom MD simulations are carried out by the open-source code GROMACS 2019.
41
2.3 Simulation process
Although implicit solvents and coarse-grained models are employed, it is still difficult for the current computational power to simulate the large space time scale of the real experimental system. Therefore, it is necessary to design a simulation process to observe variations in self-assembly morphologies. As shown in Fig. 1(d), we initially confine 500 molecules into a spherical space with a radius of 8 nm and make sure that the intermolecular distance is around 1 nm. Then, the simulation process is divided into two steps. Firstly, we explore whether the vesicle structure can be stable by cyclic annealing from 1000 K to 300 K. The simulation time of each window in the cyclic annealing process is set to be 106 steps (50 ns), and the total simulation time is 500 ns. Subsequently, the enhanced translational entropy of the small molecular solvent resulting from the proximity of large micelle particles contributes to an increase in the entropy of the whole system and a reduction in the system's free energy.42 In our simulation, we focus on investigating the morphology transition caused by the fusion after they get close. Hence, we place the two micelles obtained in the previous step close together and induce their fusion through cyclic annealing. Finally, the fusion step is repeated to make the micelles grow. Moreover, to increase the fusion efficiency, we make the two micelles a slight space overlap before fusion. All the simulation processes of 6 amphiphilic molecules are simulated 3 times, as shown in Fig. S2 and S3 (ESI†).
3. Results and discussion
3.1 The influence of molecular conformation on self-assembly morphologies
From Fig. 1(b), s-APO and m-APO are the isomers, where s-APO is linear, m-APO is T-shaped, and s-APO can assemble into the vesicle, while m-APO can assemble into the lamella according to Wang's report. In this section, we discuss the influence mechanism of molecular conformation on self-assembly morphologies. Fig. 2(a) and (b) show one of the morphology evolution processes of s-APO and m-APO in the first step of simulations. From Fig. 2(a), the porous spherical structure is formed in the early stage, and the s-APO micelle can keep the closed structure. Then, the micelle contracts to the vesicle with the disappearance of pore structures. However, from Fig. 2(b), the m-APO micelle can’t keep the closed surface structure, and the U-shaped micelle is formed in the early stage. The U-shaped micelle subsequently undergoes contraction, and the micelle stretches to the lamella structure. In addition, as shown in Fig. 2(c), through four times fusion, the m-APO micelle grows and keeps the lamella structure, which shows that the lamella structure is stable. To understand the mechanism of the morphology differences, the change of spatial orientations of two molecules with time is investigated. We use the angle θ between the vectors  and
and  and as shown in Fig. 3(c), to reflect the molecular spatial orientations, the two vectors, the vector
  is from the center of gravity of the polycyclic aromatic (A) to the center of gravity of the pyridine (B), and the vector
  is from the center of gravity of the molecule (C) to the center of gravity of the micelle (D). Fig. 3(a) and (b) show the distribution of θ over time for s-APO and m-APO, and the redder, the greater the proportion of some θ. From Fig. 3(a), for s-APO, θ is mainly distributed over 0° and 180°, indicating that the vectors
  and
and  are parallel (∼0°) or anti-parallel (∼180°). Fig. 3(a) shows that the long axis of s-APO tends to point to the center of gravity of the micelle as shown in Fig. 3(d), keeping the hydrophilic pyridine away from the hydrophobic polycyclic aromatic when forming a closed structure. In addition, two peaks in Fig. 3(a) also show that the hydrophilic pyridine has two distribution regions. When θ is near 180°, the hydrophilic pyridine distributes outside the micelle, and the hydrophilic pyridine distributes inside the micelle when θ is near 0°. Moreover, according to the peak value, the proportion of the hydrophilic pyridine outside the micelle is larger than inside the micelle. From Fig. 3(b), for m-APO, the distribution of θ exhibits a single peak at approximately 120°, and the distribution is wider than s-APO, showing that the long axis of m-APO can’t point to the center of gravity of the micelle. If the m-APO molecules form the closed vesicle, the hydrophilic pyridine will get close to the hydrophobic polycyclic aromatic, and the repulsive interaction between the hydrophilic blocks and the hydrophobic blocks is unfavored for the stability of the closed structure. In Fig. 3(e), after the four times fusion, the average radial distribution function (RDF) of the center of the gravity of polycyclic aromatic hydrocarbons of s-APO micelles shows the law of periodic attenuation, while the periodicity and peak of the RDF of m-APO become weakened, showing that the degree of closed packing of s-APO is larger than that of m-APO. At the same time, Fig. 3(f) directly shows the final morphologies and packing way of s-APO and m-APO. The polycyclic aromatic hydrocarbons of s-APO have an approximately close-packed structure, while some areas of the m-APO micelle show an orderly structure, which still needs improvement compared with the experimental results. In addition, Fig. 3(g) shows another microscopic difference in the spatial arrangement of molecules. s-APO molecules are stacked in the monolayer structure, while m-APO molecules self-assemble into the bilayer structure.
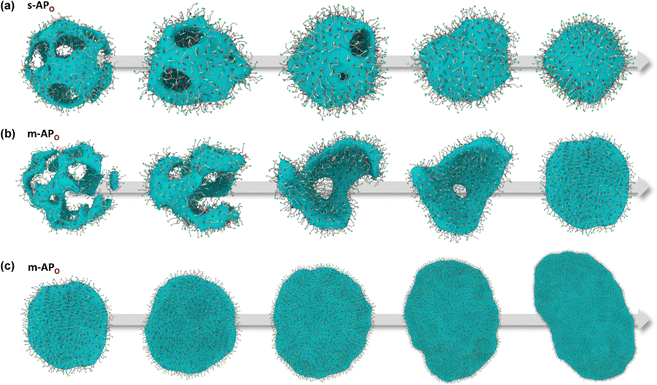 |
| | Fig. 2 Morphology evolution processes of s-APO (a) and m-APO (b) in the first step simulation. (c) The fusion process of m-APO. | |
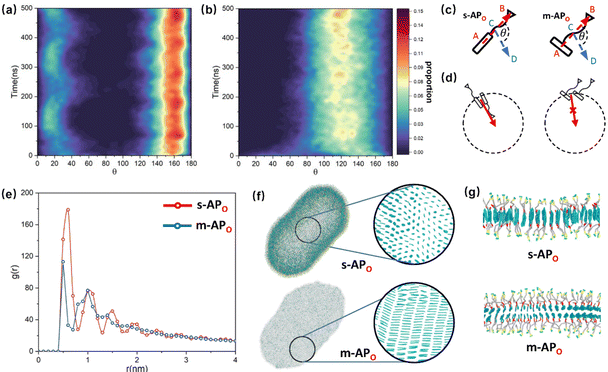 |
| | Fig. 3 (a) The change of the distribution of θ over time: (a) s-APO and (b) m-APO. (c) The sketch map of the angle θ. (d) The sketch map of the spatial arrangements of s-APO and m-APO molecules. (e) The average RDF of the center of the gravity of polycyclic aromatic hydrocarbons of s-APO and m-APO micelles after the four times fusion. (f) The final self-assembly morphology of s-APO and m-APO and the packing ways of polycyclic aromatic hydrocarbons after the four times fusion. (g) The layer structures of s-APO and m-APO. | |
3.2 The influence of atomic groups on self-assembly morphologies
For s-APO and s-APN, when carbamate replaces carboxylate ester, the self-assembly morphology is transformed from nanotubes to vesicles. It is confusing for experimenters that the slight variation of atomic groups can lead to a significant morphological difference. In this section, we further explore the influence mechanism of atomic groups on self-assembly morphologies. Fig. 4 shows the fusion processes of s-APO, s-APN, s-BPO, and s-BPN micelles. For s-APO and s-APN, the micelle of s-APO transforms into the nanotube after the four times fusion, while the micelle of s-APN forms the lamellar structure with porous structures as shown in Fig. 4(a) and (b). For s-BPO and s-BPN, the fusion process of the s-BPO micelle is similar to the s-APO micelle, while the micelle of s-BPN keeps the vesicle after the four times fusion. From Fig. 4(b) and (d), it is found that the structure of polycyclic aromatic hydrocarbons also affects the self-assembly morphologies, and its microscopic mechanism is discussed in the following section. Firstly, from Fig. 5(a) and (b), the average RDF of the center of gravity of the carboxylate ester and carbamate shows that the values of the RDF increase with fusion, showing that molecules pack closer because of fusion. In addition, the peak value of the carboxylate ester is larger than that of the carbamate, which shows that the attractive interaction strength of the carbamate is weaker than that of the carboxylate ester. Moreover, compared with s-BPN, the decrease of the attractive interaction strength of s-APN is more so that the closed structure can’t be kept, which will be discussed in the next section. To further understand the morphology differences of s-BPO and s-BPN, we use the vector between the center of gravity of blocks A and B to represent the molecular orientation, and the angles ϕ between every two vectors within 2 nm are sampled to reflect the intermolecular packing way as shown in Fig. 5(c). On the one hand, the distribution of ϕ becomes concentrated after 4 times fusion, showing that the spatial arrangement of molecules becomes orderly with fusion. On the other hand, the atomic groups will also influence the packing way of molecules. For s-BPN, the distribution of ϕ has two peaks at around 0° and 180°, which shows that s-BPN molecules tend to pack parallelly. For s-BPO, besides the parallel packing way, another distribution peak of s-BPO molecules’ ϕ around 90° gradually appears with fusion. In addition, the proportion of the parallel packing way is larger than the vertical packing way so that the micelles of s-BPO can keep the closed bilayer structure. However, from Fig. 5(d), the changes of the average specific surface area with fusion, and the specific surface area of s-BPN micelles decrease lower than s-BPO, showing that the vertical packing will hinder the shrinkage of micelles by impeding molecular diffusion. Fig. 5(e) directly visualizes the barriers of the vertical packing way to molecular diffusion. For s-BPO, there are clear boundaries between two micelles after the fourth fusion, while there is a higher degree of diffusion between two s-BPN micelles after the fourth fusion.
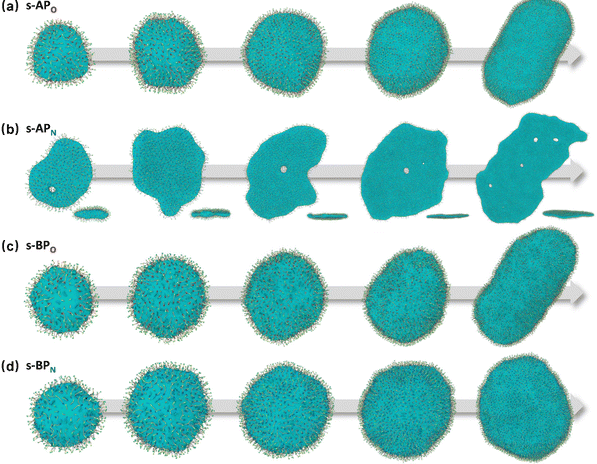 |
| | Fig. 4 The fusion processes of s-APO (a), s-APN (b) (the side view is in the lower right corner), s-BPO (c) and s-BPN (d). | |
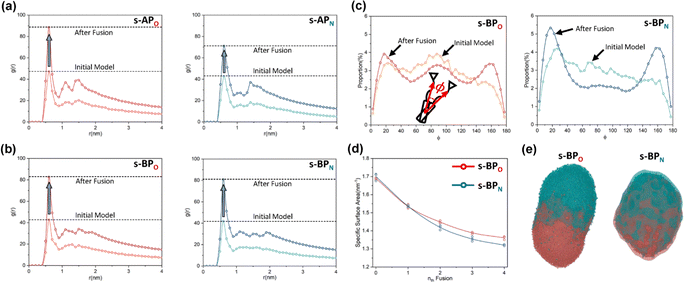 |
| | Fig. 5 The average RDF of the carboxylate ester (O) and carbamate (N) of s-AP (a) and s-BP (b). (c) The sketch map and distribution of the angle ϕ before and after four times fusion of s-BPO and s-BPN. (d) The change of the specific surface areas of s-BPO and s-BPN over the fusion. (e) The degree of s-BPO and s-BPN micelle fusion following the last fusion. | |
3.3 The influence of polycyclic aromatic hydrocarbons on self-assembly morphologies
Our simulations show a significant difference in morphologies between s-APN and s-BPN, showing that molecular structures of polycyclic aromatic hydrocarbons also affect the self-assembly morphology. Fig. 6 shows the morphology evolution processes of s-APN and s-BPN during cyclic annealing in the first step simulation. The morphology of s-APN is similar to that of s-BPN in the early stage. Then, the holes of the s-APN micelle gradually merge and expand to form the V-shaped intermediate morphology, and finally, the V-shaped micelle extends to the lamella structure. Compared with s-APN, the s-BPN micelle can keep the closed structure, and the vesicle is finally formed with the holes filled. According to the similar dissolve mutually theory, because the carbamate has stronger polarity than the carboxylate ester, the repulsive interaction from the nonpolar atomic groups increases, leading to a decrease in the carbamate groups’ packing density. Moreover, because of the monolayer structure, s-APN molecules need flip or reverse bending of straight alkanes to decrease the carbamate groups’ packing density. The flipping of s-APN molecules increases the distance between the carbamate groups on the molecular scale. In addition, the reverse bending of straight alkanes makes the pyridines close, and the repulsive interaction of hydrophilic groups makes the formation of holes. Based on the above reasons, the packing density of the carbamate significantly decreases, as shown in Fig. 5(a). Moreover, from Fig. 7(a), by the flipping of s-APN molecules, the number of the carbamate groups distributed on both sides of the membrane gradually becomes equal during cyclic annealing. However, if the vesicle is formed, the number of molecules in the inner layer should be less than the outer layer because of the higher curvature of the inner layer in the vesicle. Therefore, the equal distribution of s-APN molecules on both sides of the membrane is unfavorable for the formation of the vesicle. At the same time, the lamella structure promotes the close packing of polycyclic aromatic hydrocarbons compared with s-APO as shown in Fig. 7(b). Different from s-APN, s-BPN molecules self-assemble into the bilayer structure, and the density of close packing is far less than s-APN, which can provide more packing freedom. Therefore, as shown in Fig. 5(b), s-BPN molecules can decrease the influence of atomic groups on their packing density by adjusting the spatial arrangement of polycyclic aromatic hydrocarbons. At the same time, the bilayer structure can keep the stable ratio of molecules in the inner and outer layers, which is favorable for the formation of the closed sphere structure.
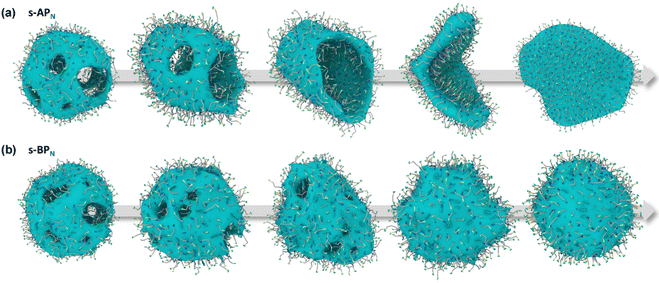 |
| | Fig. 6 The morphology evolution processes of s-APN (a) and s-BPN (b). | |
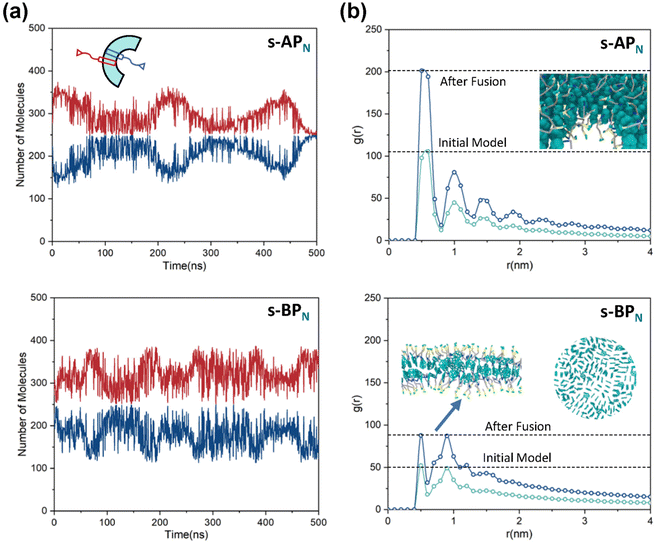 |
| | Fig. 7 (a) The average number of molecules in the inner and outer layers of s-APN and s-BPN micelles over time. (b) The average RDF of the center of the gravity of polycyclic aromatic hydrocarbons of s-APN and s-BPN micelles before and after four times fusion, and the packing ways of s-APN and s-BPN are shown in the graph. | |
3.4 Other details of the morphology evolution
In the study of the morphology evolution mechanism, some other microscopic details are also found. For s-APO and s-APN, although the monolayer structure limits most translational degrees of freedom of molecules, there is still the rotational degree of freedom. As shown in Fig. 8(a), we sample the distribution of the angular velocity of block A from the final 50 ns trajectories, and the direction of the rotation axis is defined by the direction from block A to block B. From Fig. 8(b), firstly, the distributions of s-APO and s-APN are almost symmetric, and there is no difference between the rotation ways of s-APO and s-APN. It is shown that the atomic groups have no effect on the molecular rotation. Subsequently, the distribution of angular velocities is predominantly centered around 10°, and the peak value of s-APO is slightly smaller than that of s-AP. It is shown that the closed structure will hinder the ferocious rotation of block A, because the opened boundary of the layer structure makes it easier to release stresses from the molecular rotation so that it allows greater rotation of block A. Besides this, for s-BPO and s-BPN, we study the change in the stacking way of block A. The radial angle and normal angle are used to describe the stacking way as shown in Fig. 9(c). From Fig. 9(a) and (b), the fusion has no effect on the distribution of the radial normal, but the distribution of the normal angle in the range of small angles increases, and the distribution in the range of large angles decreases. It is shown that the fusion of micelles can enhance the face stacking of block A. Moreover, the enhancement of face stacking will increase the resistance of the molecules to move, which explains that the tube structure of s-BPO will not appear until four fusions.
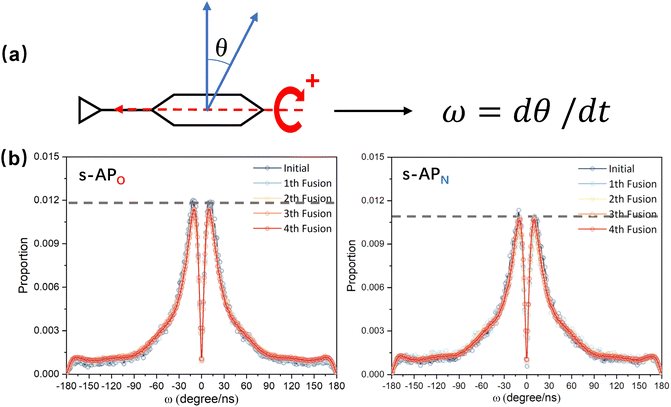 |
| | Fig. 8 (a) The definition of the rotation velocity of bock A. (b) The distribution of the rotation velocity of bock A to s-APO and s-APN. | |
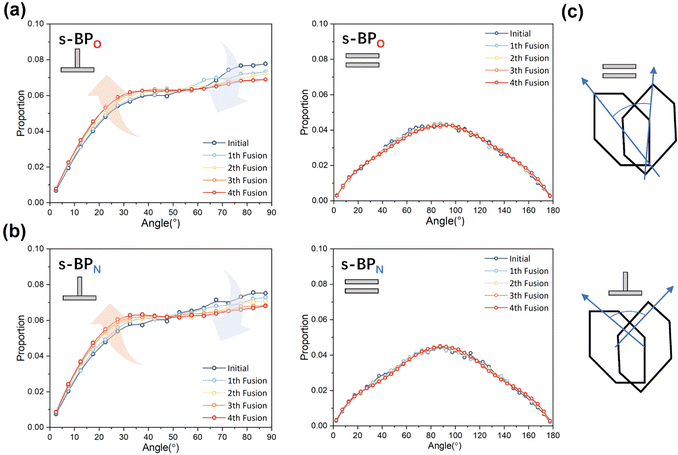 |
| | Fig. 9 (a) The distribution of the radial angle and the normal angle of block A to s-BPO. (b) The distribution of the radial angle and the normal angle of block A to s-BPN. (c) The definition of the radial angle and the normal angle of bock A. | |
4. Conclusions
In our work, we choose six similar molecules reported by Zhang et al. and Wang et al. as the research object to study the morphology transformation mechanism by the MD simulation method. For two isomers, s-APO has the linear molecular structure, while m-APO has the T-shaped molecular structure. Compared with the linear structure, the T-shaped structure makes the molecular orientation to present single and wide distributions, which hinders the molecules from pointing to the center of gravity of the micelle, and the hydrophilic groups can’t wrap the hydrophobic groups if the morphology is the closed sphere structure. For s-BPO and s-APN with the linear molecular structure, when carbamate replaces carboxylate ester, the repulsive interaction from surrounding nonpolar atomic groups increases because of the increase of the polarity of the atomic group, causing the vertical packing way between two molecules to disappear. Vanishing of the vertical packing way improves molecular diffusion during the fusion between micelles, promoting s-APN molecules to form the vesicle rather than the tube. For s-APN and s-BPN, when pyrene replaces anthracene, the monolayer structure will transform into the bilayer structure, and the degree of close packing will decrease. More freedom of packing makes the influence of the repulsive interaction decrease, and the ratio of molecules in the inner and outer layers is stable to keep the closed sphere structure. Besides this, other microscopic details are discussed in detail. Our work enriches the understanding of the self-assembly morphology evolution mechanism of amphiphilic molecules.
Conflicts of interest
There are no conflicts to declare.
Acknowledgements
National Natural Science Foundation of China (22288101).
References
- D. Pochan and O. Scherman, Introduction: molecular self-assembly, Chem. Rev., 2021, 121(22), 13699–13700 CrossRef CAS PubMed.
- Q. Zhang, R. Toyoda, L. Pfeifer and B. L. Feringa, Architecture-Controllable Single-Crystal Helical Self-assembly of Small-Molecule Disulfides with Dynamic Chirality, J. Am. Chem. Soc., 2023, 145(12), 6976–6985 CrossRef CAS PubMed.
- Y. Bi, C. Cheng, Z. Zhang, R. Liu, J. Wei and Z. Yang, Controlled Hierarchical Self-Assembly of Nanoparticles and Chiral Molecules into Tubular Nanocomposites, J. Am. Chem. Soc., 2023, 145(15), 8529–8539 CAS.
- P. Xu, L. Gao, C. Cai, J. Lin, L. Wang and X. Tian, Helical Toroids Self-Assembled from a Binary System of Polypeptide Homopolymer and its Block Copolymer, Angew. Chem., Int. Ed., 2020, 59(34), 14281–14285 CrossRef CAS PubMed.
- A. Krissanaprasit, C. M. Key, S. Pontula and T. H. LaBean, Self-assembling nucleic acid nanostructures functionalized with aptamers, Chem. Rev., 2021, 121(22), 13797–13868 CrossRef CAS.
- Z. Yan, Y. Liu, L. Zhao, J. Hu, Y. Du, X. Peng and Z. Liu, In Situ Stimulus-responsive Self-assembled Nanomaterials for Drug Delivery and Disease Treatment, Mater. Horiz., 2023, 10, 3197–3217 RSC.
- Z. Yao, Q. Hu, P. Jin, B. Li, Y. Huang, F. Zhang, M. Wang, J. Huang, J. Huang and S. Shao, A Self-Assembly Combined Nano-Prodrug to Overcome Gemcitabine Chemo-Resistance of Pancreatic Tumors, Adv. Funct. Mater., 2023, 2214598 CrossRef CAS.
- Q. Shen, Q. Song, Z. Mai, K.-R. Lee, T. Yoshioka, K. Guan, R. R. Gonzales and H. Matsuyama, When self-assembly meets interfacial polymerization, Sci. Adv., 2023, 9(18), eadf6122 CrossRef CAS PubMed.
- Y. Hou, H. Wu, J. Yoon, L. Zheng, D. Yang, T. Ye, K. Wang, K. Wang and S. Priya, Self-Assembly of 0D/3D Perovskite Bi-Layer from a Micro-Emulsion Ink, Adv. Energy Mater., 2023, 2300570 CrossRef CAS.
- X. Jia and L. Zhu, Photoexcitation-Induced Assembly: A Bottom-Up Physical Strategy for Driving Molecular Motion and Phase Evolution, Acc. Chem. Res., 2023, 56(6), 655–666 CrossRef CAS PubMed.
- R. Chang, L. Zhao, R. Xing, J. Li and X. Yan, Functional chromopeptide nanoarchitectonics: molecular design, self-assembly and biological applications, Chem. Soc. Rev., 2023, 52, 2688–2712 RSC.
- R. F. Service, How far can we push chemical self-assembly?, Science, 2005, 309(5731), 95 CrossRef CAS PubMed.
- A. Rizvi, J. T. Mulvey, B. P. Carpenter, R. Talosig and J. P. Patterson, A close look at molecular self-assembly with the transmission electron microscope, Chem. Rev., 2021, 121(22), 14232–14280 CrossRef CAS PubMed.
- P. Samorì, Exploring supramolecular interactions and architectures by scanning force microscopies, Chem. Soc. Rev., 2005, 34(7), 551–561 RSC.
- S. Scherb, A. Hinaut, R. Pawlak, J. Vilhena, Y. Liu, S. Freund, Z. Liu, X. Feng, K. Müllen and T. Glatzel, Giant thermal expansion of a two-dimensional supramolecular network triggered by alkyl chain motion, Commun. Mater., 2020, 1(1), 8 CrossRef PubMed.
- C. Wang, Q. Chen, H. Xu, Z. Wang and X. Zhang, Photoresponsive Supramolecular Amphiphiles for Controlled Self-Assembly of Nanofibers and Vesicles, Adv. Mater., 2010, 23(22), 2553–2555 CrossRef PubMed.
- C. Wang, S. Yin, S. Chen, H. Xu, Z. Wang and X. Zhang, Controlled self-assembly manipulated by charge-transfer interactions: from tubes to vesicles, Angew. Chem., Int. Ed., 2008, 47(47), 9049–9052 CrossRef CAS PubMed.
- S. Bae and K. G. Yager, Chain redistribution stabilizes coexistence phases in block copolymer blends, ACS Nano, 2022, 16(10), 17107–17115 CrossRef CAS PubMed.
- F. Jiménez-Ángeles, H.-K. Kwon, K. Sadman, T. Wu, K. R. Shull and M. Olvera de la Cruz, Self-assembly of charge-containing copolymers at the liquid–liquid interface, ACS Cent. Sci., 2019, 5(4), 688–699 CrossRef PubMed.
- J. Weng, M. Yang, W. Wang, X. Xu and Z. Tian, Revealing thermodynamics and kinetics of lipid self-assembly by Markov state model analysis, J. Am. Chem. Soc., 2020, 142(51), 21344–21352 CrossRef CAS PubMed.
- W. Dong, Y. Zhang, C. Yi, J. J. Chang, S. Ye and Z. Nie, Halogen Bonding-Driven Reversible Self-Assembly of Plasmonic Colloidal Molecules, ACS Nano, 2023, 17(3), 3047 CrossRef CAS PubMed.
- J. Pang, A. Y. Mehandzhiyski and I. Zozoulenko, A computational study of cellulose regeneration: Coarse-grained molecular dynamics simulations, Carbohydr. Polym., 2023, 313, 120853 CrossRef CAS PubMed.
- J. Vilhena, L. Greff da Silveira, P. R. Livotto, I. Cacelli and G. Prampolini, Automated parameterization of quantum mechanically derived force fields for soft materials and complex fluids: development and validation, J. Chem. Theory Comput., 2021, 17(7), 4449–4464 CrossRef CAS PubMed.
- M. P. Allen, Molecular simulation of liquid crystals, Mol. Phys., 2019, 117(18), 2391–2417 CrossRef CAS.
- G. Prampolini, L. Greff da Silveira, J. Vilhena and P. R. Livotto, Predicting Spontaneous Orientational Self-Assembly: In Silico Design of Materials with Quantum Mechanically Derived Force Fields, J. Phys. Chem. Lett., 2021, 13(1), 243–250 CrossRef PubMed.
- C.-A. Palma, M. Cecchini and P. Samorì, Predicting self-assembly: from empirism to determinism, Chem. Soc. Rev., 2012, 41(10), 3713–3730 RSC.
- X. Zheng, L. Zhu, X. Zeng, L. Meng, L. Zhang, D. Wang and X. Huang, Kinetics-controlled amphiphile self-assembly processes, J. Phys. Chem. Lett., 2017, 8(8), 1798–1803 CrossRef CAS PubMed.
- J. Hu, P. Wang, Y. Lin, J. Zhang, M. Smith, P. J. Pellechia, S. Yang, B. Song and Q. Wang, Self-Assembly of Pyridinium-Functionalized Anthracenes: Molecular-Skeleton-Directed Formation of Microsheets and Microtubes, Chem. – Eur. J., 2014, 20(25), 7603–7607 CrossRef CAS PubMed.
- S. Plimpton, P. Crozier and A. Thompson, LAMMPS-large-scale atomic/molecular massively parallel simulator, Sandia Natl. Lab., 2007, 18, 43 Search PubMed.
- A. Stukowski, Visualization and analysis of atomistic simulation data with OVITO–the Open Visualization Tool, Modell. Simul. Mater. Sci. Eng., 2009, 18(1), 015012 CrossRef.
- C. Arnarez, J. J. Uusitalo, M. F. Masman, H. I. Ingólfsson, D. H. De Jong, M. N. Melo, X. Periole, A. H. De Vries and S. J. Marrink, Dry Martini, a coarse-grained force field for lipid membrane simulations with implicit solvent, J. Chem. Theory Comput., 2015, 11(1), 260–275 CrossRef CAS PubMed.
- C. Yang, L. Gao, J. Lin, L. Wang, C. Cai, Y. Wei and Z. Li, Toroid formation through a supramolecular “cyclization reaction” of rodlike micelles, Angew. Chem., Int. Ed., 2017, 129(20), 5638–5642 CrossRef.
- L. Hou, J. Wang, S. Wang, W.-C. Li, G. Li and A.-H. Lu, Crystallization-assisted asymmetric assembly of polymer nanocrescents and fidelity carbon analogues: Experiment and simulation study, Nano Res., 2023, 16(8), 11503–11510 CrossRef CAS.
- W. Tschöp, K. Kremer, J. Batoulis, T. Bürger and O. Hahn, Simulation of polymer melts. I. Coarse-graining procedure for polycarbonates, Acta Polym., 1998, 49(2–3), 61–74 CrossRef.
-
M. e Frisch, G. Trucks, H. B. Schlegel, G. Scuseria, M. Robb, J. Cheeseman, G. Scalmani, V. Barone, G. Petersson and H. Nakatsuji, Gaussian 16, In Gaussian, Inc., Wallingford, CT, 2016 Search PubMed.
- T. Lu and F. Chen, Multiwfn: A multifunctional wavefunction analyzer, J. Comput. Chem., 2012, 33(5), 580–592 CrossRef CAS PubMed.
-
T. Lu, Sobtop, Version [1.0], 2023, https://sobereva.com/soft/Sobtop (accessed on 5th March 2023).
- J. Wang, R. M. Wolf, J. W. Caldwell, P. A. Kollman and D. A. Case, Development and testing of a general amber force field, J. Comput. Chem., 2004, 25(9), 1157–1174 CrossRef CAS PubMed.
- R. Woods and R. Chappelle, Restrained electrostatic potential atomic partial charges for condensed-phase simulations of carbohydrates, J. Mol. Struct., 2000, 527(1–3), 149–156 CrossRef CAS PubMed.
- A. Sengupta, Z. Li, L. F. Song, P. Li and K. M. Merz Jr, Parameterization of monovalent ions for the OPC3, OPC, TIP3P-FB, and TIP4P-FB water models, J. Chem. Inf. Model., 2021, 61(2), 869–880 CrossRef CAS PubMed.
- D. Van Der Spoel, E. Lindahl, B. Hess, G. Groenhof, A. E. Mark and H. J. Berendsen, GROMACS: fast, flexible, and free, J. Comput. Chem., 2005, 26(16), 1701–1718 CrossRef CAS PubMed.
- H. Aref, Order in chaos, Nature, 1999, 401(6755), 756–758 CrossRef CAS.
|
| This journal is © the Owner Societies 2024 |
Click here to see how this site uses Cookies. View our privacy policy here.  *ad and
Guohui
Li
 *a
*a


![[thin space (1/6-em)]](https://www.rsc.org/images/entities/char_2009.gif) ln
ln![[thin space (1/6-em)]](https://www.rsc.org/images/entities/char_2009.gif) P(x)
P(x) and
and  and as shown in Fig. 3(c), to reflect the molecular spatial orientations, the two vectors, the vector
  is from the center of gravity of the polycyclic aromatic (A) to the center of gravity of the pyridine (B), and the vector
  is from the center of gravity of the molecule (C) to the center of gravity of the micelle (D). Fig. 3(a) and (b) show the distribution of θ over time for s-APO and m-APO, and the redder, the greater the proportion of some θ. From Fig. 3(a), for s-APO, θ is mainly distributed over 0° and 180°, indicating that the vectors
  and
and  are parallel (∼0°) or anti-parallel (∼180°). Fig. 3(a) shows that the long axis of s-APO tends to point to the center of gravity of the micelle as shown in Fig. 3(d), keeping the hydrophilic pyridine away from the hydrophobic polycyclic aromatic when forming a closed structure. In addition, two peaks in Fig. 3(a) also show that the hydrophilic pyridine has two distribution regions. When θ is near 180°, the hydrophilic pyridine distributes outside the micelle, and the hydrophilic pyridine distributes inside the micelle when θ is near 0°. Moreover, according to the peak value, the proportion of the hydrophilic pyridine outside the micelle is larger than inside the micelle. From Fig. 3(b), for m-APO, the distribution of θ exhibits a single peak at approximately 120°, and the distribution is wider than s-APO, showing that the long axis of m-APO can’t point to the center of gravity of the micelle. If the m-APO molecules form the closed vesicle, the hydrophilic pyridine will get close to the hydrophobic polycyclic aromatic, and the repulsive interaction between the hydrophilic blocks and the hydrophobic blocks is unfavored for the stability of the closed structure. In Fig. 3(e), after the four times fusion, the average radial distribution function (RDF) of the center of the gravity of polycyclic aromatic hydrocarbons of s-APO micelles shows the law of periodic attenuation, while the periodicity and peak of the RDF of m-APO become weakened, showing that the degree of closed packing of s-APO is larger than that of m-APO. At the same time, Fig. 3(f) directly shows the final morphologies and packing way of s-APO and m-APO. The polycyclic aromatic hydrocarbons of s-APO have an approximately close-packed structure, while some areas of the m-APO micelle show an orderly structure, which still needs improvement compared with the experimental results. In addition, Fig. 3(g) shows another microscopic difference in the spatial arrangement of molecules. s-APO molecules are stacked in the monolayer structure, while m-APO molecules self-assemble into the bilayer structure.


