 Open Access Article
Creative Commons Attribution 3.0 Unported Licence
Unravelling the molecular interactions behind the formation of PEG/PPG aqueous two-phase systems†
Alexandre M. S.
Jorge‡
 a,
Gonçalo M. C.
Silva‡
 b,
João A. P.
Coutinho
 *b and
Jorge F. B.
Pereira
 *a
*a
aCIEPQPF, FCTUC, Department of Chemical Engineering, University of Coimbra, Rua Sílvio Lima, Pólo II – Pinhal de Marrocos, 3030-790 Coimbra, Portugal. E-mail: jfbpereira@eq.uc.pt
bDepartment of Chemistry, CICECO – Aveiro Institute of Materials, University of Aveiro Campus Universitário de Santiago, Aveiro, 3810-193, Portugal. E-mail: jcoutinho@ua.pt
First published on 1st February 2024
Abstract
The understanding of molecular interactions that control phase separation in polymer/polymer aqueous two-phase systems (ATPS) has been a subject of debate up to this day. In light of this, we set out to investigate the molecular interactions occurring in ternary mixtures composed of polyethylene glycol (PEG600), polypropylene glycol (PPG400) and water. The ternary phase diagram was plotted at two temperatures (298 K and 323 K), revealing a transition from a type 0 to a type I diagram. Molecular dynamics (MD) simulations were performed to elucidate the polymer–polymer and polymer–water interactions occurring at different temperatures and water concentrations. COnductor-like Screening Model for Realistic Solvents (COSMO-RS) was used to assess the thermodynamic properties of the polymer–water binary mixtures and their correlation with ATPS formation. The MD simulations clearly demonstrate the effect of segregation/separation with increasing water content and temperature, highlighting a significant reduction in PPG–water interactions compared to PEG–water counterparts. Polymer–water interactions were identified as those controlling the phase separation mechanism, and the thermodynamic properties determined with COSMO-RS for the polymer–water binary systems further support this view.
1. Introduction
Aqueous two-phase systems (ATPS), also known as aqueous biphasic systems (ABS), are mixtures that can be used in LLE (liquid–liquid equilibrium) extraction processes, where at least two water-soluble compounds form two immiscible aqueous phases when their concentrations exceed certain levels defined by a binodal curve.1 Since the discovery of ATPS, polymer/polymer systems have been extensively studied for their capability to separate, extract and purify biomolecules and other valuable compounds.2–6 However, despite several authors attempting to understand the intermolecular mechanisms governing ATPS formation, this phenomenon remains not fully understood.7–9Weak polymer–polymer interactions are often associated with the incompatibility that leads to phase separation in binary mixtures.10,11 In ternary mixtures of polymers and solvent, such as water, the mechanisms of phase separation may differ, as both polymer–solvent and polymer–polymer interactions play a key role in this phenomenon.12 This makes the study of ternary mixtures involving oligomers particularly interesting, as some high molecular weight polymers become water-insoluble, and phase separation is then determined by the hydrophobic nature of these compounds in the presence of water.
Poly(ethylene) glycol (PEG) and poly(propylene) glycol (PPG) are commonly used in the formulation of ATPS and are homopolymers with a wide range of applications, spanning from biomedicine,13,14 to nanotechnology.15 PPG differs from PEG due to the presence of an additional methyl group per monomer in its polymeric chain, which makes this polymer more hydrophobic and causes a rapid decrease in water solubility with increasing molecular weight.16 Despite PEG and PPG being the most widely used polymers in ABS, research on the thermodynamics and intermolecular interactions controlling the phase separation remains limited.
Malmsten et al.12 provided valuable insights into the phase behaviour of ternary aqueous solutions containing PEG with an average molecular weight of 600 g mol−1 (PEG600), PPG with an average weight of 400 g mol−1 (PPG400), and water. Their research revealed that phase separation in polymer/polymer aqueous systems was influenced by the degree of hydrophilicity of the polymers. The driving force behind the phase separation was primarily unfavourable PPG400/water interactions, especially at higher temperatures. More recently, researchers have reported an abrupt rearrangement of hydrogen bonds preceding the formation of polymer/polymer ATPS.17,18 This phenomenon has been linked to the presence of dissimilar water micro-domains in the system, which lead to phase separation once a certain polymer concentration threshold is reached.17,18 Similar findings were reported by Sadhegi and Maali,9 who found that PPG400/polymer/water solutions exhibited larger biphasic regions at higher temperatures and with higher polymer molecular weights. They also demonstrated that the system's phase-forming ability can be predicted by using the slopes of the isopiestic constant water activity lines. However, despite these interesting insights, direct insights into the molecular-level mechanisms and the specific intermolecular interactions responsible for the structural and thermodynamic changes leading to the phase separation of polymer/polymer aqueous mixtures remain elusive.
Although limited in number, some theoretical studies have delved into the separation phenomena in ATPS. For example, Schaeffer et al.19 used molecular dynamics (MD) to investigate the phase behaviour of a tetraalkyl phosphonium ([P4,4,4,14]+) surfactant in ionic ATPS mixtures. Their work suggested that phase separation is associated with the different characteristics of the solutes: the shielded nature of [P4,4,4,14]+ primarily led to aggregation driven by dispersive forces, while the smaller ions (Na+/H3O+) mainly interacted through electrostatic forces. Dubouis et al.20 also studied the phase behaviour of aqueous mixtures containing two ionic compounds that differed in the anion but shared the same Li+ cation. In this specific case, the authors found that the size asymmetry of the anions drove the formation of the ATPS. However, these conclusions cannot be applied to polymer/polymer/water systems, given the non-ionic characteristics of the constituents and similar size of the solutes. Therefore, an in-depth study, supported by theoretical methods, is warranted to obtain a direct insight that may lead to a sound understanding of the interactions and mechanisms behind phase separation in polymer/polymer aqueous mixtures.
To achieve a better understanding of the polymer–polymer and polymer–water interactions that dictate the phase separation of PEG/PPG aqueous solutions, this work presents experimental data on the ternary phase diagram PEG600 + PPG400 + water at two different temperatures (298 K and 323 K), while using MD simulations and COnductor-like Screening MOdel for Realistic Solvents (COSMO-RS) calculations to obtain a direct insight and lead the interpretation of the experimental evidence.
2. Experimental and theoretical methods
2.1 Determination of the phase diagrams
PEG600 and PPG400 were both purchased from Sigma-Aldrich (USA). The water used underwent a double-distillation process, passed through a reverse osmosis system, and was further treated with a Milli-Q plus 185 water purification system.The phase diagrams were determined at 298 and 323 K by cloud point titration,21 starting from aqueous solutions of each polymer at ≈80 wt%. A detailed description of the experimental procedure employed is available elsewhere.22 The composition of the system was determined by weighing all phase-forming compounds added, within an uncertainty of ±10−4 g. Temperature control was maintained using a thermostatic bath, and a glass flask was constantly agitated using a magnetic stirrer (22 × 5 mm) at 1200 rpm.
2.2 MD simulation details
MD simulations were performed for systems containing PEG600, PPG400 and water using Gromacs 2023.2.23 The water molecules were modelled with the TIP4P/200524 parametrization and the polyethers were described using the OPLS-AA25 force field. The equations of motion were calculated with a timestep of 2 fs using the leap-frog algorithm.26 A cut-off distance of 1.4 nm was applied to calculate the Coulombic and Lennard-Jones potentials. Long-range interactions were calculated with the PME27 algorithm and the missing pressure and energy components were added to the dispersive term. All bonds involving hydrogen atoms were constrained using the LINCS28 algorithm. Random initial cubic simulation boxes were generated using Packmol.29 The number of molecules in each simulation box is provided in Table S5 in the ESI.† The generated simulation box underwent an energy minimization stage of 20![[thin space (1/6-em)]](https://www.rsc.org/images/entities/char_2009.gif) 000 timesteps using the steepest descent method, followed by a pre-equilibration stage, in the NPT ensemble, which was run at a temperature of 298.15 K for 1 ns. Following this step, a run of 200 ns was carried out in the NpT ensemble, where the pressure, 1 bar, and temperature, 298.15 K, were kept constant with the Parrinello–Rahman30 barostat and the Nosé–Hoover,31,32 thermostat, using coupling constants of 10 and 0.5 ps, respectively. The final 10 ns of each simulation run were used for all the analyses presented in this study. VMD 1.9.4.33 was used to observe the trajectories and obtain snapshots of the configurations.
000 timesteps using the steepest descent method, followed by a pre-equilibration stage, in the NPT ensemble, which was run at a temperature of 298.15 K for 1 ns. Following this step, a run of 200 ns was carried out in the NpT ensemble, where the pressure, 1 bar, and temperature, 298.15 K, were kept constant with the Parrinello–Rahman30 barostat and the Nosé–Hoover,31,32 thermostat, using coupling constants of 10 and 0.5 ps, respectively. The final 10 ns of each simulation run were used for all the analyses presented in this study. VMD 1.9.4.33 was used to observe the trajectories and obtain snapshots of the configurations.
2.3 COSMO-RS calculations
The COSMO-RS calculations were performed with Biovia COSMOtherm 21.0, using the “BP_TZVP_21.ctd” parametrization.34 In these calculations, the Elbro combinatorial term35 was employed in combination with the COSMO-RS residual term to account for the asymmetry of molar volumes concerning entropy upon mixing. Turbomole36 was used to perform DFT calculations at the BP86/def-TZVP37–39 level of theory in order to obtain the σ-profiles. A fine mesh was used to more accurately sample the charge density within cavities, and a relaxation step was conducted with the BP86/def-SV(P) method to prevent the formation of unrealistically polarized zones. This procedure relied on the use of MD simulation to obtain more realistic polymer conformers, and all the technical details are available in a previous work.403. Results and discussion
3.1 Experimental phase diagrams
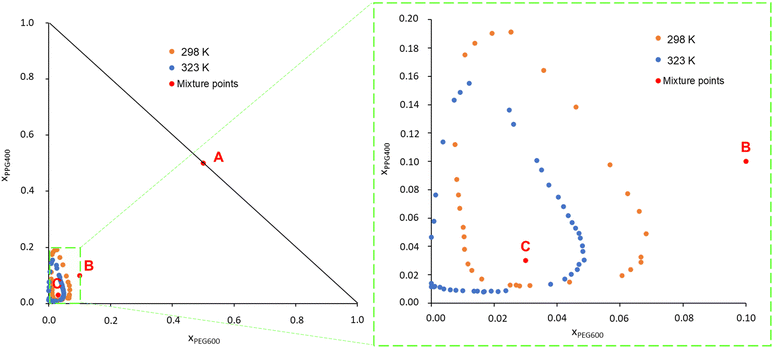
PEG600 and PPG400 were chosen as models for PEG and PPG polymers for being fully water soluble and small enough to allow for the all atom MD simulations and the DFT calculations at the BP86/def-TZVP level of theory necessary to obtain the σ-profiles for the COSMO-RS calculations. The phase diagrams of the system PEG600/PPG400/water were determined experimentally, and the data can be found in Table S1 in the ESI.† To facilitate comparison with the results from this study, experimental data obtained by Malmsten et al.12 were also retrieved through a graphical analysis of their phase diagrams and are presented in Fig. S1, ESI† (data in Table S2 in the ESI†).Fig. 1 presents the phase diagrams obtained in this work in terms of mole fraction (experimental data are available in Table S3, ESI†). This representation was chosen because the calculations and MD simulations were conducted for binary and ternary mixtures with predetermined molar compositions. Fig. S1 (ESI†) reveals that the data measured in this work are in good agreement with the literature data from Malmsten et al.,12 with the primary difference being noticeable in the phase diagrams at 323 K. In the current study, the biphasic region at 323 K appears slightly smaller compared to the previous report. This difference could be attributed to the challenges, reported by the other authors, related to temperature control. They measured the ternary phase diagram of this system at 326 K instead of the desired 323 K. This temperature variation is significant because PPG400 has a low consolute temperature (LCST) at approximately these temperatures. Therefore, even a slight temperature variation can result in significant differences in the phase diagram.12,41 Other factors contributing to the variation in the phase diagram include differences in the phase-forming compounds (purity) used in each study and the potential operator errors. Additionally, the use of a graphical method to retrieve the binodal curve points in the work of Malmsten et al.12 may have introduced some uncertainty into the plotted binodal data.
Upon analysing Fig. 1, it is observed that the biphasic region of this ATPS, at both temperatures, is very small. This indicates that considerable amounts of water must be added to the system to induce phase separation, i.e., ternary mixtures containing the studied phase-forming compounds must have a molar fraction of water exceeding 0.75 to induce a phase separation. Consequently, it can be inferred that the phase separation in this polymer/polymer ATPS is primarily driven by the water content in the system and the interaction between the polymers and water.9,12
Furthermore, as the temperature increases, the phase diagram of the ATPS at 298 K, which initially exhibited a closed immiscibility region (i.e., type 0 behaviour, where all binary mixtures of the phase-forming compounds are fully miscible, and immiscibility is observed only in the ternary mixture),42 transforms into a type I phase diagram at 323 K. In this type I phase diagram, the binary mixture of PPG400/H2O forms two immiscible phases, even without the presence of PEG600, within a certain concentration range. This change is linked to the lower solubility in water of PPG400 compared to PEG600. PPG400 has a lower critical solution temperature (LCST) close to 323 K,9 while the LCST of PEG600 is above 423 K.12 This difference explains why the phase diagram at 323 K intersects the PPG–water axis in Fig. 1.
These results lead to the suggestion by Malmsten et al.12 that the phase separation mechanism was mainly governed by polymer–water interactions, as this phenomenon is closely related to both the water concentration and the solvation ability of the polymers.
3.2 MD simulations
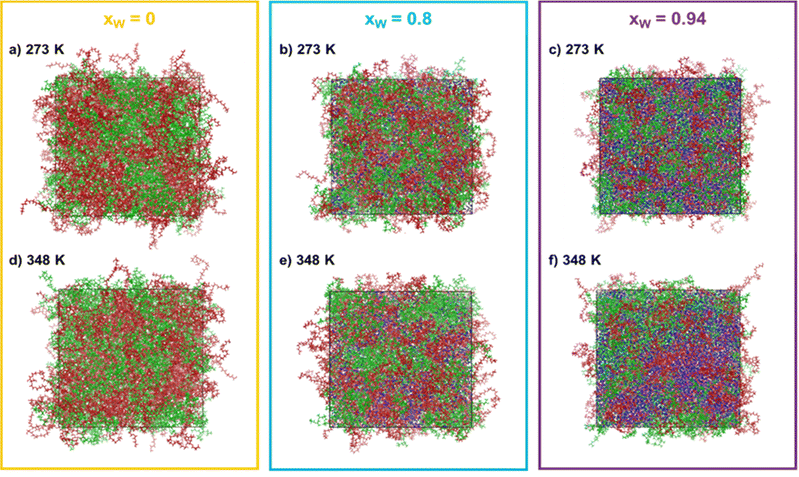
To try to achieve a direct insight into the phase separation and into the changes in intra- and inter-molecular interactions between the various phase-forming compounds, MD simulations were conducted for systems containing PEG600, PPG400 and water at two different temperatures, 278 K and 348 K. These two temperatures were chosen to enhance the effects experimentally observed and, thus, enabling us to more clearly see the impact of temperature on the organization of the ternary system. The molar ratio between PEG600 and PPG400 was kept at 1![[thin space (1/6-em)]](https://www.rsc.org/images/entities/char_2009.gif) :
:![[thin space (1/6-em)]](https://www.rsc.org/images/entities/char_2009.gif) 1 and the water molar fractions were increased from 0 (point A in Fig. 1) to 0.8 (point B in Fig. 1) and 0.94 (point C in Fig. 1). The snapshots corresponding to the final configurations of each simulation are presented in grid-form in Fig. 2.
1 and the water molar fractions were increased from 0 (point A in Fig. 1) to 0.8 (point B in Fig. 1) and 0.94 (point C in Fig. 1). The snapshots corresponding to the final configurations of each simulation are presented in grid-form in Fig. 2.
One immediate conclusion is readily apparent upon visual inspection of the trajectories: an increase in either the water composition or the temperature results in a higher degree of segregation/separation when water is present. On the other hand, when only PEG600 and PPG400 is present, the effect of temperature is not very noticeable. In the simulation snapshots, it is visible that domains containing both water (blue) and PEG600 (red) form as the water content and temperature increase, while PPG400 segregates from these regions. This behavior can be linked to the higher hydrophilicity and solvation energy of PEG600 in comparison to PPG400.9,12 Due to its higher hydrophilicity, PEG600 molecules are preferentially solvated, excluding the PPG400 molecules and enhancing the segregation phenomenon observed in the snapshots. Once it reaches a certain threshold, the preferentially hydrated PEG600 molecules are effectively excluded from the surface of the more hydrophobic PPG400 molecules, resulting in an entropically favorable phase splitting of the system and macroscopic phase separation.9
For a clearer assessment of inhomogeneities within the system's organization, we can turn to the interpretation of the radial distribution functions (RDFs), which will be discussed in the following Sections (3.2.1 and 3.2.2).
![[thin space (1/6-em)]](https://www.rsc.org/images/entities/char_2009.gif) :
:![[thin space (1/6-em)]](https://www.rsc.org/images/entities/char_2009.gif) 1 ratio, at two different temperatures, and three water molar fractions.
1 ratio, at two different temperatures, and three water molar fractions.
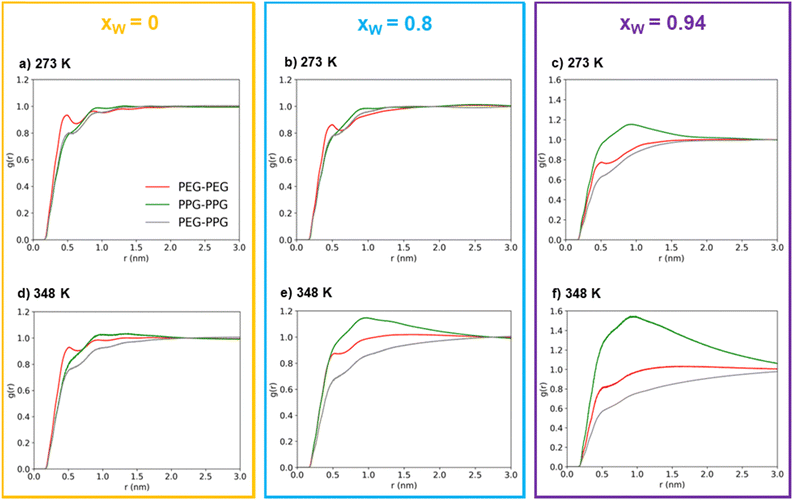
At first glance, the presence of a more well-defined first peak in the PEG–PEG RDF, when compared to the PPG–PPG RDF, corresponding to the first sphere of coordination, indicates a slightly higher degree of structuration corresponding to lateral packing between neighboring PEG600 chains. This type of interaction is hindered in the case of PPG400 due to the bulky –CH3 substituents that disrupt lateral packing.
In the absence of water, (Fig. 3(a) and (d)), the three RDFs (PEG–PEG, PPG–PPG and PEG–PPG) mostly overlap, indicating that there are no preferential contacts between the two polymer types, especially at the lowest simulated temperature (273 K). An increase in temperature does introduce a very slight shift in the RDFs, which can be attributed to a certain degree of segregation between the two polymers. At this temperature, the PEG–PPG contacts are slightly less frequent than any of the homo-contacts. However, this effect is accentuated by the presence of water. At a water molar fraction of 0.8 (Fig. 3(b) and (e)), the difference between the two simulated temperatures becomes more pronounced. An increase in temperature generates inhomogeneities in the system, leading to noticeable segregation at 348 K but not at 273 K. Further increasing the water molar fraction to 0.94 (Fig. 3(c) and (f)) induces more significant segregation between the two types of polymers, even at lower temperatures. At 273 K, PPG–PPG contacts are already dominant, and this effect is further intensified at 348 K. As previously discussed, the RDFs quantitatively confirm what was visually evident from the inspection of the simulation configurations (Fig. 2): an increase in temperature and in water content leads to a higher degree of segregation or separation. This conclusion is supported by the fact that at higher temperatures or water molar fractions (Fig. 3(c), (e) and (f)), the three curves are not overlapping. In these cases, the short-range PPG–PPG contacts are consistently more abundant, indicating a tendency of PPG400 to self-aggregate in the presence of water. The same behavior is also observed in the simulations of the binary PPG400/water system (see Fig. S2 and S3, ESI†). When the temperature is increased from 273 to 348 K, phase separation occurs as the LCST is reached. Conversely, in the case of the PEG600/water system, no significant structural changes are observed under the same conditions. These findings align with the experimental results, which indicate that PPG-rich phases tend to phase separate from aqueous phases as the temperature increases due to the lower LCST of PPG400 in water. The phase diagrams of the binary mixtures of PEG or PPG compounds with water are known to exhibit an LCST,43,44 so it is not surprising that the ternary mixture displays the same behavior.
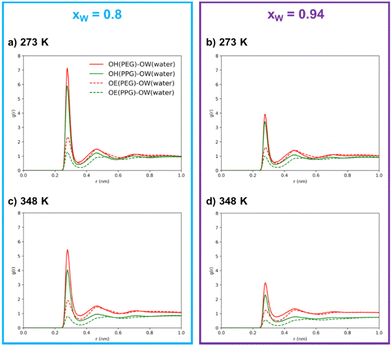
Through an examination of any individual subplot in Fig. 4, it is clear that interactions between polymer molecules and water are preferentially mediated by the hydroxyl groups rather than the ether groups. This observation is not surprising, given the hydroxyl group's dual role as both donors and acceptors, their higher polarity, and their easier accessibility in comparison to the ether groups. This interpretation is in agreement with the surmounting importance of hydrogen bonds over the remaining intermolecular interactions in polymer/polymer aqueous systems, as reported by previous researchers.9,18,45 It is further substantiated by the coordination numbers obtained through the integration of the RDFs, as shown in Table 1, where the number of neighboring water molecules is significantly higher around hydroxyl groups than around ether groups.
| Atom type pairs | x w = 0.8 | x w = 0.94 | ||
|---|---|---|---|---|
| 273 K | 348 K | 273 K | 348 K | |
| OH (PEG)–OW (water) | 1.47 | 1.31 | 2.22 | 2.08 |
| OH (PPG)–OW (water) | 1.19 | 0.93 | 1.83 | 1.42 |
| OE (PEG)–OW (water) | 0.73 | 0.64 | 1.32 | 1.09 |
| OE (PPG)–OW (water) | 0.37 | 0.25 | 0.74 | 0.44 |
| OW (water)–OW (water) | 2.09 | 2.24 | 3.29 | 3.53 |
The results in Table 1 also clearly show that, in the simulated systems, the PEG600–water hydrogen bonding interactions are more common than the PPG400–water interactions, as demonstrated by the larger peaks and higher coordination numbers observed for the interactions involving PEG600. By comparing the OH–OW interactions of the two polyethers with water, we can conclude that PEG600 interactions are favored by ∼30%, while in the case of OE–OW, they are favored by ∼100% upon water concentration increase. The presence of the hydrophobic methyl group along the PPG400 chain significantly inhibits the formation of hydrogen bonds, resulting in a different affinity towards water when compared to PEG600. Meanwhile, the number of water–water contacts (OW–OW) shows an increase with temperature at both concentrations, confirming the increased tendency for self-aggregation and segregation at higher temperatures. While the overall coordination numbers might be affected by the occurrence of phase separation, the same trends are observed for the homogeneous ternary system (xw = 0.8, T = 273 K), thus confirming the overall conclusions. These findings lead us to the interpretation that polymer–water interactions primarily govern the phase separation in this type of ATPS, with hydrogen bond rearrangement playing a crucial role in the enhancement of segregation above a certain threshold, transitioning from a mesoscopic segregation to a macroscopic segregation phenomenon, and inducing ATPS formation.
Naturally, due to thermal expansion and higher thermal agitation, an increase in temperature results in diminished hydrogen bonding interactions.9 This reduction in hydrogen bonds contributes to the segregation/separation that is observed at higher temperatures, with the perceived increasing hydrophobicity of PPG400 becoming more pronounced as temperature rises. Since the polymer–water interactions governing ATPS appear to be associated with the hydration of the polymers, the conformational effects of these polymers were further evaluated.
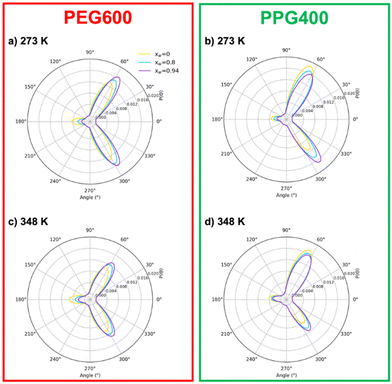
It is interesting to note that the “anti” conformations, corresponding to a dihedral angle of 180°, are less favorable than “gauche” ones (60 or 300°). While it might seem counterintuitive, these findings are consistent with previous MD simulations of PEG compounds,16 as well as NMR and IR spectroscopy experiments.46–48 The “gauche” conformation leads to an increase of the dipole moment, which enhances the interactions with polar solvents.42 It is also immediately noticeable that the distribution is symmetrical in the case of PEG600 but not for PPG400. This asymmetry is related to the chirality of the substituted carbon in the polypropylene monomer, which can result in different chain orientations depending on the tacticity of the polymer. In the case of our work, the PPG400 molecule was modeled as a syndiotactic chain, where the –CH3 substituents “alternate sides”. While syndiotactic polymers are less susceptible to curling than their isotactic counterparts, the effects of chirality are still observed, with some degree of spiraling occurring along the main chain.
The effect of concentration also provides valuable information. An increase in water content leads to more “gauche” conformations and a corresponding decrease in “anti” conformers for both polymers. Nevertheless, this effect is somewhat more complex in the case of PPG400 (Fig. 5(b)), where an increase in water concentration also leads to a lower degree of asymmetry between the two possible “gauche” states. The effect of temperature is expectable for both polymers: an increase in thermal agitation leads to a decrease in the peaks corresponding to the most stable conformations and an increase in the remaining ones (Fig. 5(c) and (d)).
3.3 Thermodynamic properties from COSMO-RS calculations
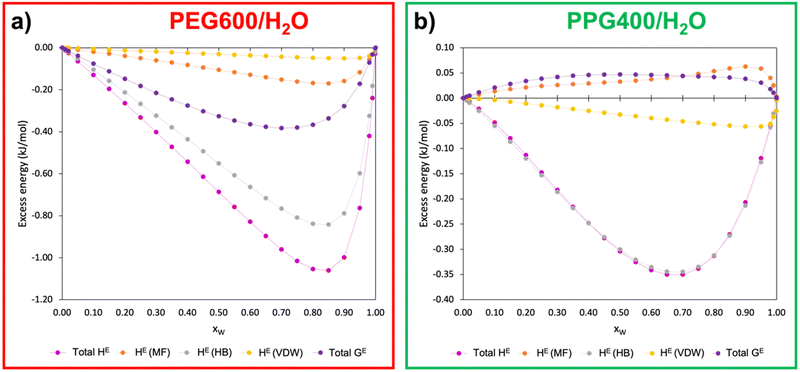
In pursuit of further understanding of the thermodynamics behind the ATPS formation and its quantification, the excess enthalpy (HE) and excess free Gibbs energy (GE) of the polymer–water binary systems were calculated using COSMOS-RS at 298.15 K. Fig. 6 presents the relationship between the excess energies of PEG600/H2O and PPG400/H2O as a function of the molar water fraction (xW). The calculated data can be found in Table S4 (ESI†).Analysing Fig. 6, it becomes evident that PEG–water interactions are considerably more favourable than PPG–water interactions, with hydrogen bonds being the main type of interaction involved in the polymer–water interactions for both types of polymers. This observation is in line with the results from the MD simulations (Section 3.2.2), which demonstrated that PEG600 has a higher ability to interact with water via hydrogen bonds than PPG400. Another very important insight pertains to the values of GE for both binary systems. While the GE of the PEG600/H2O system is negative, the values for PPG400/H2O are positive, demonstrating the clear difference in hydrophilicity between the two types of polyethers. These results corroborate the aforementioned tendencies, with PEG600 having a stronger interaction with water molecules than PPG400, which is further supported by the poorer solvency of the latter polymer when compared to the former.
To confirm that the disparities in interactions between both polymers and the water molecules govern the ATPS formation, the activity coefficients (γ) of the compounds comprising each polymer/water binary system (Table S4, ESI†) were plotted as a function of xW (Fig. 7).
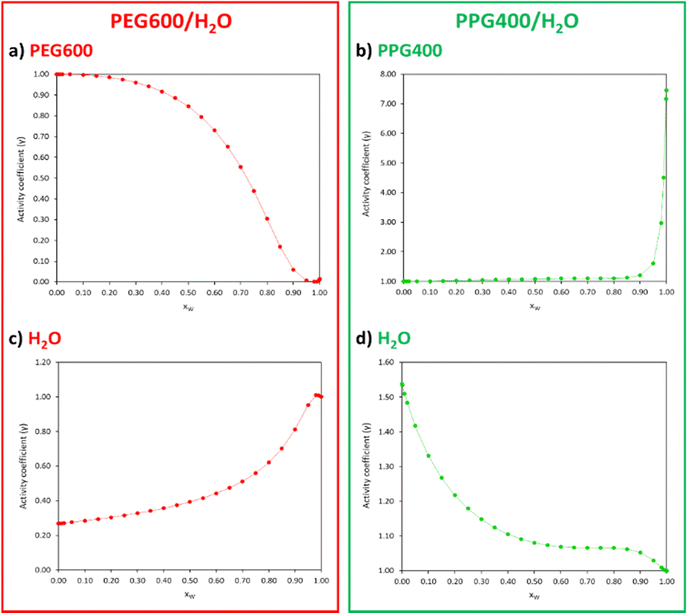 | ||
| Fig. 7 Activity coefficients (γ) of PEG600 (a), PPG400 (b) and water (c) and (d) for different xW of the PEG600/H2O and PPG400/H2O systems calculated with COSMO-RS at 298.15 K. | ||
Activity coefficients lower than 1 suggest the presence of strong attractive forces between the compounds in the mixture, while values higher than 1 indicate positive deviations from ideality due to hetero-interactions between the components being weaker than the homo-interactions. In the PEG600/H2O system (Fig. 7(a) and (c)), the γ < 1 values indicate a strong affinity between PEG and water, with an increase in xW leading to stronger interactions between these compounds. In the case of the PPG400/H2O system (Fig. 7(b) and (d)), the γ > 1 values indicate poor interactions between PPG and water molecules.
The correlations obtained between the thermodynamic properties of the polymer/water binary systems and the ATPS formation lead us to conclude that unfavourable PPG–water interactions are mostly responsible for inducing phase separation of the system PEG600/PPG400/H2O.
4. Conclusions
Experimental phase diagram measurements, combined with atomistic MD simulations and COSMO-RS calculations, were performed for PEG600/PPG400 aqueous solutions to obtain direct evidence and help clarify the role of the polymer –water interactions in aqueous two-phase systems formation. Ternary diagrams were plotted at two temperatures, revealing a type 0 phase diagram at 298 K, where the immiscibility gap shifted toward the PPG400-rich phase. At 323 K, this is changed into a type I diagram as the LCST of PPG–water is crossed. MD simulations provide direct evidence of the impact of water content and temperature on the observed phase separation. As water content increased, segregation became more evident, leading to increased self-aggregation of PPG400, while PEG600 displayed a higher degree of compatibility with water. The effect of temperature showed the well-known polymer in solvent effect of decreased solubility, as observed segregation increased with thermal agitation. Hydrogen bonds between the polymers and water were primarily formed within the terminal hydroxyl groups, with a slight preference for PEG600–OH groups to interact with water. The ether groups showed a more differentiated tendency to hydrogen bonds with the solvent between the two polymers, demonstrating the influence of the methyl group to inhibit hydrogen bonds. The difference in hydrogen bonding behaviour between the two polyethers explains the self-aggregation of PPG400, leading to its separation from the water-rich phase. COSMO-RS calculations of polymer–water binary systems confirmed that hydrogen-bonding interactions dominate the enthalpic term and highlighted the difference in hydrogen-bonding capacity between the polymers. Additionally, the activity coefficients of the PPG400/H2O and PEG600/H2O systems confirmed the clear difference in hydrophilicity between the two polyethers, resulting from the presence of an additional –CH3 group per monomer.Author contributions
Alexandre M. S. Jorge: data curation, formal analysis, investigation, visualization, writing – original draft, and writing – review & editing. Gonçalo M. C. Silva: data curation, formal analysis, investigation, visualization, writing – original draft, software, and writing – review & editing. João. A. P. Coutinho: conceptualization, methodology, funding acquisition, project administration, resources, supervision, and validation. Jorge F. B. Pereira: conceptualization, methodology, funding acquisition, project administration, resources, supervision, and validation.Conflicts of interest
There are no conflicts to declare.Acknowledgements
This work was partly developed within the scope of the project CICECO-Aveiro Institute of Materials, UIDB/50011/2020 (DOI: 10.54499/UIDB/50011/2020), UIDP/50011/2020 (DOI: 10.54499/UIDP/50011/2020) & LA/P/0006/2020 (DOI: 10.54499/LA/P/0006/2020), financed by national funds through the FCT/MCTES (PIDDAC). CIEPQPF is supported by the Fundação para a Ciência e a Tecnologia (FCT) through the projects UIDB/EQU/00102/2020 and UIDP/EQU/00102/2020. J. F. B. Pereira and A. M. S. Jorge acknowledge FCT for funding the project DRI/India/0044/2020 (https://doi.org/10.54499/DRI/India/0044/2020).References
- J. F. B. Pereira and J. A. P. Coutinho, Liquid-Phase Extraction, Elsevier, 2020, pp. 157–182 Search PubMed.
- J. A. Asenjo and B. A. Andrews, J. Chromatogr. A, 2011, 1218(49), 8826–8835 CrossRef CAS PubMed.
- M. Iqbal, Y. Tao, S. Xie, Y. Zhu, D. Chen, X. Wang, L. Huang, D. Peng, A. Sattar, M. A. B. Shabbir, H. I. Hussain, S. Ahmed and Z. Yuan, Biol. Proced., 2016, 18(1), 1–18 CrossRef PubMed.
- M. Marchel and I. M. Marrucho, Sep. Purif. Rev., 2023, 52, 413–437 CrossRef.
- A. M. Ferreira, H. Passos, A. Okafuji, A. P. M. Tavares, H. Ohno, M. G. Freire and J. A. P. Coutinho, Green Chem., 2018, 20(6), 1218–1223 RSC.
- J. H. P. M. Santos, E. V. Capela, I. Boal-Palheiros, J. A. P. Coutinho, M. G. Freire and S. P. M. Ventura, Biochem. Mol. Biol. Educ., 2018, 46(4), 390–397 CrossRef CAS PubMed.
- Å. Gustafsson, H. Wennerström and F. Tjerneld, Fluid Phase Equilib., 1986, 29(C), 365–371 CrossRef.
- B. Y. Zaslavsky, T. O. Bagirov, A. A. Borovskaya, N. D. Gulaeva, L. H. Miheeva, A. U. Mahmudov and M. N. Rodnikova, Polymer, 1989, 30(11), 2104–2111 CrossRef.
- R. Sadeghi and M. Maali, Polymer, 2016, 83, 1–11 CrossRef CAS.
- A. R. Ajitha and S. Thomas, Compatibilization of Polymer Blends, Elsevier, 2020, ch. 1, pp. 1–29 Search PubMed.
- D. Patterson, Polym. Eng. Sci., 1982, 22, 64–73 CrossRef.
- M. Malmsten, P. Linse and K. W. Zhang, Macromolecules, 1993, 26, 2905–2910 CrossRef CAS.
- K. Brewer, B. Gundsambuu, P. Facal Marina, S. C. Barry and A. Blencowe, Polymers, 2020, 12, 367 CrossRef CAS PubMed.
- X. Hu, A. Fukutani, X. Liu, K. Kimbara and F. Kawai, Appl. Microbiol. Biotechnol., 2007, 73, 1407–1413 CrossRef CAS PubMed.
- G. Gkogkos, L. Panariello, E. Grammenou, M. A. Cornwell, A. Afrashtehpour, A. J. MacRobert, I. P. Parkin and A. Gavriilidis, Chem. Eng. J., 2023, 467, 143350 CrossRef CAS.
- S. Hezaveh, S. Samanta, G. Milano and D. Roccatano, J. Chem. Phys., 2012, 136(12), 124901 CrossRef PubMed.
- A. R. Titus, L. A. Ferreira, A. I. Belgovskiy, E. E. Kooijman, E. K. Mann, J. A. Mann, W. V. Meyer, A. E. Smart, V. N. Uversky and B. Y. Zaslavsky, Phys. Chem. Chem. Phys., 2020, 22(8), 4574–4580 RSC.
- N. da Silva, L. A. Ferreira, A. I. Belgovskiy, P. P. Madeira, J. A. Teixeira, E. K. Mann, J. Adin Mann, W. V. Meyer, A. E. Smart, V. Y. Chernyak, V. N. Uversky and B. Y. Zaslavsky, J. Mol. Liq., 2021, 335, 116288 CrossRef CAS.
- N. Schaeffer, G. Pérez-Sánchez, H. Passos, J. R. B. Gomes, N. Papaiconomou and J. A. P. Coutinho, Phys. Chem. Chem. Phys., 2019, 21(14), 7462–7473 RSC.
- N. Dubouis, C. Park, M. Deschamps, S. Abdelghani-Idrissi, M. Kanduc, A. Colin, M. Salanne, J. Dzubiella, A. Grimaud and B. Rotenberg, ACS Cent. Sci., 2019, 5(4), 640–643 CrossRef CAS PubMed.
- J. C. Merchuk, B. A. Andrews and J. A. Asenjo, J. Chromatogr. B: Anal. Technol. Biomed. Life Sci., 1998, 711, 285–293 CrossRef CAS PubMed.
- A. M. S. Jorge, J. A. P. Coutinho and J. F. B. Pereira, Sep. Purif. Technol., 2023, 320, 124183 CrossRef CAS.
- D. Van Der Spoel, E. Lindahl, B. Hess, G. Groenhof, A. E. Mark and H. J. C. Berendsen, J. Comput. Chem., 2005, 26, 1701–1718 CrossRef CAS PubMed.
- J. L. F. Abascal and C. A. Vega, J. Chem. Phys., 2005, 123, 234505 CrossRef CAS PubMed.
- W. L. Jorgensen, D. S. Maxwell and J. Tirado-Rives, J. Am. Chem. Soc., 1996, 118(15), 11225–11236 CrossRef CAS.
- R. W. Hockney, S. P. Goel and J. Eastwood, J. Comput. Phys., 1974, 14, 148–158 CrossRef.
- T. Darden, D. York and L. Pedersen, J. Chem. Phys., 1993, 98(15), 10089–10092 CrossRef CAS.
- B. Hess, H. Bekker, H. J. C. Berendsen and J. G. E. M. Fraaije, J. Comput. Chem., 1997, 18(12), 1463–1472 CrossRef CAS.
- L. Martínez, R. Andrade, E. G. Birgin and J. M. Martínez, J. Comput. Chem., 2009, 30(10), 2157–2164 CrossRef PubMed.
- M. Parrinello and A. Rahman, J. Appl. Phys., 1981, 52(12), 7182–7190 CrossRef CAS.
- S. Nosé, Mol. Phys., 1984, 52(2), 255–268 CrossRef.
- W. G. Hoover, Phys. Rev. A: At., Mol., Opt. Phys., 1985, 31(3), 1695–1697 CrossRef PubMed.
- W. Humphrey, A. Dalke and K. Schulten, J. Mol. Graphics, 1996, 14, 33–38 CrossRef CAS PubMed.
- F. Eckert and A. Klamt, AIChE J., 2002, 48, 369–385 CrossRef CAS.
- H. S. Elbro, A. Fredenslund and P. Rasmussen, Macromolecules, 1990, 23, 4707–4714 CrossRef CAS.
- TURBOMOLE; a Development of University of Karlsruhe and Forschungszentrum Karlsruhe GmbH, 2017; available from https://www.turbomole.com.
- A. D. Becke, Phys. Rev. A: At., Mol., Opt. Phys., 1988, 38, 3098–3100 CrossRef CAS PubMed.
- J. P. Perdew, Phys. Rev. B: Condens. Matter Mater. Phys., 1986, 33, 8822–8824 CrossRef PubMed.
- A. Schaefer, C. Huber and R. Ahlrichs, J. Chem. Phys., 1994, 100, 5829–5835 CrossRef CAS.
- G. G. M. C. Silva, D. A. Pantano, S. Loehlé and J. A. P. Coutinho, Ind. Eng. Chem. Res., 2023, 62, 20936–20944 CrossRef CAS.
- A. D. King, J. Colloid Interface Sci., 2001, 243, 457–462 CrossRef CAS.
- L. I. N. Tomé, J. F. B. Pereira, R. D. Rogers, M. G. Freire, J. R. B. Gomes and J. A. P. Coutinho, Phys. Chem. Chem. Phys., 2014, 16(6), 2271–2274 RSC.
- S. Saeki, N. Kuwahara, M. Nakata and M. Kaneko, Polymer, 1976, 17, 685–689 CrossRef CAS.
- L. Zhao, C. Wu and N. Huang, Fluid Phase Equilib., 2011, 310(1–2), 32–38 CrossRef CAS.
- J. Pavelec, D. DiGuiseppi, B. Y. Zavlavsky, V. N. Uversky and R. Schweitzer-Stenner, J. Mol. Liq., 2019, 275, 463–473 CrossRef CAS.
- Y. Sasanuma and K. Sugita, Polym. J., 2006, 38, 983–988 CrossRef CAS.
- Y. Sasanuma, H. Ohta, I. Touma, H. Matoba, Y. Hayashi and A. Kaito, Macromolecules, 2002, 35, 3748–3761 CrossRef CAS.
- J. J. Shephard, P. J. Bremer and A. J. McQuillan, J. Phys. Chem. B, 2009, 113, 14229–14238 CrossRef CAS PubMed.
Footnotes |
| † Electronic supplementary information (ESI) available. See DOI: https://doi.org/10.1039/d3cp05539f |
| ‡ Alexandre M. S. Jorge and Gonçalo M. C. Silva contributed equally to this work. |
| This journal is © the Owner Societies 2024 |

