
Sensing platform for the highly sensitive detection of catechol based on composite coupling with conductive Ni3(HITP)2 and nanosilvers†
Yuandong
Xu
 *a,
Yingying
Ben
a,
Lili
Sun
a,
Jishan
Su
a,
Hui
Guo
a,
Rongjia
Zhou
a,
Yaqing
Wei
a,
Yajun
Wei
b,
Yongjuan
Lu
b,
Yizhan
Sun
a and
Xia
Zhang
*a
*a,
Yingying
Ben
a,
Lili
Sun
a,
Jishan
Su
a,
Hui
Guo
a,
Rongjia
Zhou
a,
Yaqing
Wei
a,
Yajun
Wei
b,
Yongjuan
Lu
b,
Yizhan
Sun
a and
Xia
Zhang
*a
aSchool of Chemistry and Chemical Engineering, Henan University of Technology, Zhengzhou 450001, China. E-mail: ydx11@126.com; zhx8206@126.com
bSchool of Chemical Engineering, Northwest Minzu University, Lanzhou 730030, China
First published on 29th December 2023
Abstract
Catechol, which has a high toxicity and low degradability, poses significant risks to both human health and the environment. Tracking of catechol residues is essential to protect human health and to assess the safety of the environment. We constructed sensing platforms to detect catechol based on the conductive metal–organic frameworks [Ni3(HITP)2] and their nanosilver composites. The reduction process of catechol at the Ni3(HITP)2/AgNP electrode is chemically irreversible as a result of the difference in compatibility of the oxidation stability and conductivity between the Ni3(HITP)2/AgNS and Ni3(HITP)2/AgNP electrodes. The electrochemical results show that the Ni3(HITP)2/AgNS electrode presents a lower detection limit of 0.053 μM and better sensitivity, reproducibility and repeatability than the Ni3(HITP)2/AgNP electrode. The kinetic mechanism of the catechol electrooxidation at the surface of the electrode is controlled by diffusion through a 2H+/2e− process. The transfer coefficient is the key factor used to illustrate this process. During the electrochemical conversion of phenol to ketone, more than half of ΔG is used to change the activation energy. We also studied the stability, anti-interference and reproducibility of these electrode systems.
1. Introduction
Catechol, which has a dihydroxy benzene structure, is found in many natural foods, including tea, vegetables, tobacco, fruits, and other plants. It has negative effects on both human health and the environment as a result of its high toxicity and low degradability. As a main hydroxylation product of phenolic contaminants, catechol can be easily oxidized to generate reactive oxygen species, such as cytotoxic semiquinone radicals and quinones.1,2 Catechol is extremely miscible with water and easily migrates into the soil and aquatic environments, posing a serious threat to both human health and aquatic organisms, including central nervous system damage, mutations, vascular collapse, DNA breakage and chromosomal aberrations.3,4 Catechol pollutants exist in various industries, including pharmaceutical production, the chemical industries and agriculture, and it is estimated that 25![[thin space (1/6-em)]](https://www.rsc.org/images/entities/char_2009.gif) 000 tons of catechol are discharged into the environment every year.5,6 Therefore, it is necessary to develop a well-operated, dependable and sensitive technique to detect residual catechol.
000 tons of catechol are discharged into the environment every year.5,6 Therefore, it is necessary to develop a well-operated, dependable and sensitive technique to detect residual catechol.
At present, analytical methods such as gas chromatography, high-performance liquid chromatography, surface plasmon resonance, and spectrophotometry are commonly utilized for catechol detection. However, limitations such as low selectivity, complicated operation and expensive pre-treatments restrict their extensive practical application. Electrochemical sensing technology has been increasing in importance because of its strong selectivity, sensitivity, rapid analytical response, simple operation, and cost-effectiveness7,8 and is a promising detection method, especially for fast, on-site detection.
As the central part of electrochemical sensors, the working electrode mainly determines the performance. The critical processes during the construction of sensors with high sensitivity and high selectivity are the enhancement of the charge transfer rate on the electrode surface and the specific recognition of the target molecules.9,10 It has been reported that chemical modification of the bare electrode using functional materials is an effective method of changing the microstructure of the interface between the electrode and the electrolyte and can significantly improve the redox properties of the electrode and the sensing performance toward specific target molecules.11,12 Hence it is efficient to improve the selectivity and sensitivity of sensors via the functional modification of electrode surfaces.
Carbon materials and conductive polymers are often used in electrochemical sensors due to their superior conductivity. Carbon nanotubes and graphene have received much attention in the field of electrochemical sensors as some of the most promising advanced materials as a result of their unique electrical and mechanical properties and high electron transfer ability, leading to the potential to construct a variety of sensing systems. Conductive polymers, such as polypyrroles and polyanilines, show further advantages, such as high conductivity, high storage ability, easy synthesis, and enhanced thermal and chemical stability. However, the recognition of target molecules often requires direct links between the functional materials and the target molecules. Carbon materials and conductive polymers with a lack of groups that can bond to the target molecules result in inferior selectivity and sensitivity of the sensor.13,14
Metal–organic frameworks (MOFs) formed through self-assembly coordination between organic ligands and metals are potential electrode materials due to the advantages of their large specific surface area, high porosity, orderly structure and easy functionalization.15,16 The structure of MOFs can be designed by selecting metal ions with different coordination numbers and functional groups by adjusting the length and type of the organic ligand chain. As a result, the topological structure of MOFs can be controlled and MOFs with different pore structures, pore sizes, specific surface areas, and a large number of redox active centers can be obtained. The limited effect of pore size can selectively identify size-matched guest molecules.17 However, the inferior electrical conductivity possessed by MOFs has a negative effect on the electron transport rate, which seriously restricts its development and application in the electrochemical field.
To solve this problem, 2D conductive MOFs (2D-ECMOFs) with superior conductivity (up to 1580 S cm−1) have been developed. They can be designed with π–π stacking or a π–d conjugated structure to realize carrier transfer paths via through-space and through-valence strategies.18–20 The electron transfer process can be controlled by regulating the π–π accumulation of the ligands and the symmetry or overlap of the orbitals between metals and ligands, so that the conductivity can be further regulated.
Presently, most research is focused on 2D-ECMOFs based on the coordination of transition metals ligands, such as Co, Ni, Cu, benzene derivatives and triphenyl derivatives.21–23 ECMOFs with mixed ligands and alloys have also been explored to expand their diversity. Among them, Ni3(2,3,6,7,10,11-hexaiminotriphenylene)2 (Ni3(HITP)2) has been targeted on account of its high charge carrier mobility and excellent conductivity derived from its in-plane charge delocalization and layered extended conjugation.23
Liu's group developed a Ni3(HITP)2/graphene-based composite aerogel for the oxidation removal of phenol from coking wastewaters. The as-constructed 3D electrode system possessed a high in situ self-electrolysis capacity and achieved the highly efficient degradation of phenol.24 Ni3(HITP)2 shows superior electrocatalytic ability, with electrons transferring via through-space and through-valence to stimulate the electrocatalytic activity on the surface, leading to a promising electrode material.
We developed a Ni3(HITP)2/AgNS and Ni3(HITP)2/AgNP composite with high electrical conductivity and electrocatalytic activity by combing Ni3(HITP)2 with nanosilvers (nanosheets and nanoparticles). In this electrochemical sensor, nanosilvers with different morphologies have a specific impact on the sensing performance due to the compatibility between oxidation stability and excellent conductivity. The electrochemical results show that the reduction of catechol on the Ni3(HITP)2/AgNP electrode is a chemically irreversible oxidation process. Based on this sensor platform, catechol was electrocatalyzed to o-benzoquinone through the 2H+/2e− pathway, the kinetic mechanism of which has also been explored. We found that more than half of the ΔG is used to change the activation energy of the phenol-to-ketone reaction. A wide linear range and low detection limit were achieved with the obtained materials. The proposed electrocatalytic system can significantly supplement the applications of Ni3(HITP)2 in electrochemical sensors.
2. Experimental section
2.1. Materials
All chemicals were used without further purification. Nickel chloride hexahydrate (NiCl2·6H2O), ammonium hydroxide (NH3·H2O), silver nitrate (AgNO3), citric acid monohydrate (C6H8O7·H2O), sodium citrate (C6H5O7Na3), sodium chloride (NaCl), hydrogen peroxide solution (H2O2), catechol and sodium borohydride (NaBH4) were purchased from Aladdin Chemicals Reagent Co., Ltd. Ascorbic acid (C6H8O6) was purchased from Tianjin Kemio Chemical Reagent Co., Ltd. Methanol (CH3OH), ethylene glycol (C2H6O2) and acetone (C3H6O) were purchased from Shanghai Macklin Biochemical Co., Ltd and 2,3,6,7,10,11-hexaaminotriphenylene hexahydrochloride (HATP·6HCl) was obtained from Zhengzhou Alpha Chemical Co., Ltd.2.2. Synthesis of Ni3(HITP)2
HATP·6HCl (40 mg) was dissolved in 20 ml of deionized water to form solution A. NiCl2·6H2O (26.4 mg) and NH3·H2O (1.2 mL) were mixed in 20 ml of deionized water to form solution B. Under the constant temperature of an oil-bath, solution B was slowly dropped into solution A with continuous stirring. After reacting at 60 °C for 2 h, the obtained precipitate was filtered and washed several times with water and absolute ethanol. Ni3(HITP)2 was obtained by drying at 80 °C for 12 h.2.3. Synthesis of Ni3(HITP)2/AgNS
AgNO3 (0.6 ml of a 0.01 mol L−1 solution) and sodium citrate (23.5 ml of a 2.5 × 10⁻⁴ mol L−1 solution) were mixed evenly with stirring, then 0.1 ml of H2O2 and 0.6 ml of NaBH4 (0.1 mol L−1) were added. The solution then turned yellow. The nanosilver seed crystal was obtained by standing at room temperature for 2 h. The seed crystal (14 ml), 1 ml of sodium citrate (0.075 mol L−1), 2 ml of ascorbic acid (0.01 mol L−1) and the prepared Ni3(HITP)2 were added to 16 ml of deionized water. With continuous stirring, 9.4 ml of AgNO3 (0.01 mol L−1) were added. The solution changed from red to purple, then to dark green and finally to blue. Ni3(HITP)2/AgNS was obtained after drying under vacuum at 60 °C for 6 h.2.4. Synthesis of Ni3(HITP)2/AgNP
The prepared Ni3(HITP)2, 0.5 ml of AgNO3 (0.2 mol L−1) and 0.5 ml of citric acid (0.2 mol L−1) were added to 19 ml of deionized water to form a uniform solution. After stirring for 5 min, 0.6 ml of NaBH4 (0.2 mol L−1) was added and the mixture was stored at 4 °C for 48 h. Ni3(HITP)2/AgNP was obtained by centrifugation and vacuum drying at 60 °C for 8 h.2.5. Electrochemical measurements
All electrochemical performances were measured on a CHI 660E electrochemical workstation (Chenhua, China). A standard three-electrode electrochemical cell was used for all electrochemical tests in 0.1 mol L−1 phosphate buffer solution (PBS). The bare or modified glassy carbon electrode (GCE, d = 3 mm), Ag/AgCl and a platinum wire were used as the working electrode, reference electrode and auxiliary electrode, respectively. The working electrode was prepared as follows. Before modification, the bare GCE was polished to a mirror-like surface with 0.3 and 0.05 μm alumina slurry and then sonicated in anhydrous ethanol and double-distilled water, respectively. The modified electrode was then fabricated by depositing a Ni3(HITP)2/AgNS and Ni3(HITP)2/AgNP suspension (5 μL) onto the freshly cleaned GCE before drying under an infrared lamp.2.6. Material characterization
The structure of the prepared materials was measured by X-ray diffraction (XRD, Rigaku SmartLab SE) with Cu Kα radiation (λ = 1.5418 Å). The morphology and elemental mapping were characterized by scanning electron microscopy (SEM, Zeiss Merlin Compact) and transmission electron microscopy (TEM, Titan G260-300). The nitrogen adsorption–desorption isotherm was measured using a Specific Surface Area and Aperture Analyzer (ASAP 2020).3. Results and discussion
Fig. 1a shows the XRD patterns of the as-prepared Ni3(HITP)2 and its composites. The individual Ni3(HITP)2 presents a 2D hexagonal lattice structure with long range order peaks located at 4.7, 9.4, 12.4 and 16.4°, which are indexed to the (100), (200), (220) and (300) planes of Ni3(HITP)2, respectively. In addition, there is another wide peak at 27.5° corresponding to the (001) plane, an indication of a covalent layered material and long range order along the c direction.24,25 As for the composite samples, in addition to the presence of the characteristic peaks of Ni3(HITP)2, the characteristic diffraction peaks at 38.0, 44.1, 64.3, 77.3 and 81.6° belong to the face-centered cubic silver crystal planes of (111), (200), (220), (311) and (222) (JCPDS No. 04-0783), respectively. This result reveals that nanosilver with different morphologies successfully grew on the surface of Ni3(HITP)2.26 The peak intensity varies significantly with the morphological changes in the nanosilvers. Among all the peaks, the intensity of the (111) plane is strongest, revealing priority growth along this direction. The stereo-hindrance effect for silver nanoparticles may inhibit growth along the (111) plane, resulting in the homogenous growth of all planes and particle formation. | ||
| Fig. 1 (a) XRD patterns, (b) nitrogen adsorption–desorption isotherms, (c) SSA and (d) APS of Ni3(HITP)2 and its composites. | ||
The N2 adsorption–desorption isotherms of the samples are illustrated in Fig. 1b. The change trends of the isotherms corresponding to Ni3(HITP)2 and the composites are nearly the same, belonging to type IV isotherms based on the IUPAC classification. That is, the surface and structural characteristics of Ni3(HITP)2 mainly determine the aperture characteristic of the nanocomposites. This can be further confirmed by the specific surface area (SSA) and average pore size (APS) results (Fig. 1c and d). Taking Ni3(HITP)2 as an example, at the beginning of the adsorption, the initial adsorption capacity is close to 100 cm3 g−1. Then, in the low pressure range, N2 is slightly adsorbed on the sample. However, the adsorbed volume significantly increases at p/p0 = 0.8, which is an indication of the presence of macropores.
The structural properties of the four samples are illustrated in Fig. 1c and d. The SSA and APS of the composites are slightly different from those of Ni3(HITP)2 with the change in the nanosilver morphology. The SBET and SMicro/SBET are similar for Ni3(HITP)2, Ni3(HITP)2/AgNS and Ni3(HITP)2/AgNP. Ni3(HITP)2/AgNS has the lowest SMicro, but the highest APS value, suggesting a large proportion of mesopores and macropores and a low proportion of micropores. Compared with individual Ni3(HITP)2, the values of SMicro/SBET and VMicro/VTotal increase, whereas the APS value decreases from 9.43 to 10.19 nm. This means that the introduction of nanosilver reduces the number of micropores and creates a large number of mesopores and macropores to speed up the reaction.
The SEM and TEM images of the different samples are displayed in Fig. 2 and 3. As shown in Fig. 2a and b, Ni3(HITP)2 has a sea-urchin-like structure with many nanorods twisting together. The diameter of the nanorods is approximately 5–20 nm. It has been reported that the growth of Ni3(HITP)2 in the ab plane is controlled by the continuous formation and fracture of strong metal–ligand bonds, whereas growth along the c direction is dominated by reversible and much weaker π-stacking interactions. The c direction therefore dominates and a nanorod morphology is obtained, which is consistent with the XRD analysis.27
 | ||
| Fig. 2 SEM images: (a) and (b) Ni3(HITP)2, (c) Ni3(HITP)2/AgNP and (d) Ni3(HITP)2/AgNS. (e) and (f) EDS maps of nanosilver corresponding to parts (c) and (d), respectively. | ||
 | ||
| Fig. 3 TEM images: (a) and (b) Ni3(HITP)2, (c) and (d) Ni3(HITP)2/AgNP and (e) and (f) Ni3(HITP)2/AgNS. | ||
Fig. 2c and d show the images of Ni3(HITP)2/AgNP and Ni3(HITP)2/AgNS, respectively. The morphology of Ni3(HITP)2 in Ni3(HITP)2/AgNS is in accordance with the individual Ni3(HITP)2, except for the decoration of Ag nanoparticles on the Ni3(HITP)2 surface. This is supported by the mapping analysis in Fig. 2e. Fig. 2d shows that the morphology of Ni3(HITP)2 has a great variation due to the Ag nanosheet, which is supported by the EDS mapping (Fig. 2e). The bright spots on the Ni3(HITP)2 in Fig. 2c are Ag nanoparticles, which is also supported by EDS mapping (Fig. 2f).
The TEM images are displayed in Fig. 3. Ni3(HITP)2 is composed of uniform nanorods with superior transmittance, manifesting its porous structure (Fig. 3a and b). Fig. 3c and d show that silver nanoparticles are uniformly decorated on the surface of Ni3(HITP)2. For Ni3(HITP)2/AgNS (Fig. 3e and f), nanosilver is successfully loaded on the surface of Ni3(HITP)2.
The charge transfer behavior of the obtained electrodes was investigated further via electrochemical impedance spectroscopy (EIS) in the frequency range 10−2–105 Hz in 5 mM [Fe(CN)6]3−/4− with 0.1 M KCl as the supporting electrolyte. Fig. 4a and b show that the semicircles in the Nyquist plots are all depressed in the high-frequency region. It is obvious that the semicircle for the bare GCE is larger than that of the modified electrodes, revealing the high resistance of the bare GCE. That is to say, the charge transfer rate has been improved after the modification of the GCE using the electrode materials. The sloping straight line in the low-frequency region corresponds to the Warburg impedance, relating to the solid-state diffusion of charges in the bulk electrode.
 | ||
| Fig. 4 (a) Nyquist plots of the different electrodes. (b) Enlarged image of part (a). (c) Zr − ω−1/2 curves for the different electrodes in the low-frequency region. (d) Bode phase plots of the different electrodes. | ||
To explore further information from the Warburg impedance, Fig. 4c shows the Zr ∼ ω−1/2 (ω = 2πf) curves in the low-frequency region (<1.0 Hz), where ω is the angular frequency. D is the ion diffusion coefficient, which can be obtained from the following equations. Zr is the real part of the EIS. Re and Rct are the kinetic parameters that are independent of frequency. σW is the slope of the fitted line. R, F and T are the gas constant, Faraday's constant and temperature, respectively. A is the effective contact area between the electrode and the electrolyte. n is the number of transfer electrons per mole of active material during the reaction. C is the molar concentration of ions in the electrode. As shown in eqn (2), it is clear that the smaller the value of σW, the higher the value of D. Therefore, as shown in Fig. 4c, the Ni3(HITP)2, Ni3(HITP)2/AgNP and bare GCE electrodes have similar D values, verifying the excellent interface kinetics with faster ion diffusion.
| Zr = Re + Rct + σWω−1/2 | (1) |
| D = 0.5(RT/An2F2C)2/σW2 | (2) |
Because it is very difficult to identify the charge transfer resistance and bulk electron conduction resistance separately using only the Nyquist plots, a Bode phase plot was used to solve this problem according to the different frequency responses of the two processes.28Fig. 4d shows that the peaks represent the semicircles at mid- and high frequencies. The peaks around the frequency of 10–100 Hz for Ni3(HITP)2/AgNS and Ni3(HITP)2/AgNP relate to the bulk electron transfer resistance. For the bare GCE, the peak around 1000 Hz may be attributed to its surface state before electrocatalysis.29
To evaluate the electrochemical performance of the different electrodes, cyclic voltammetry (CV) was conducted in a PBS containing 5 μM catechol. Fig. 5a shows that clear redox peaks are present at all the electrodes, whereas Ni3(HITP)2/AgNS exhibits the highest current response. The redox peak potentials for Ni3(HITP)2/AgNS shift in a negative direction, indicating the good electrocatalytic activity toward catechol. This excellent electrochemical response might be due to the increase in pore size, which is beneficial to electron transport. This is supported by BET analysis. Compared with pure Ni3(HITP)2, the current response of the composites is obviously increased due to the excellent electrocatalytic activity. The following reasons can be proposed: (1) the outstanding conductivity of silver promotes the electron transfer rate of the composites; and (2) the mesopores and macropores of the composites can accelerate the ion transport rate and provide more active sites.
 | ||
| Fig. 5 (a) CV curves of the different electrodes. (b) and (c) Enrichment time and effect of pH on the Ni3(HITP)2/AgNS and Ni3(HITP)2/AgNP electrodes. (d) Linear relationship between Ep and pH. | ||
To examine the influence of pH and the accumulation time of the different electrodes toward catechol oxidation, Fig. 5b and c display the current response of Ni3(HITP)2/AgNS and Ni3(HITP)2/AgNP. As shown in Fig. 5b, the oxidation peak current reaches a maximum when the accumulation time is 240 and 270 s, respectively, for the two electrodes. The subsequent experiments were carried out under these conditions. With increasing pH, the oxidation peak current first increases and then decreases, reaching a maximum at pH 7.0 for Ni3(HITP)2/AgNS and pH 7.5 for Ni3(HITP)2/AgNP (Fig. 5c). This can be explained as follows: (1) dehydrogenating oxidation is relatively difficult under acidic conditions; and (2) under alkaline conditions, catechol can easily react with OH−, leading to a decrease in the catechol concentration involved in electrode reaction. A neutral environment is therefore favorable for catechol oxidation.
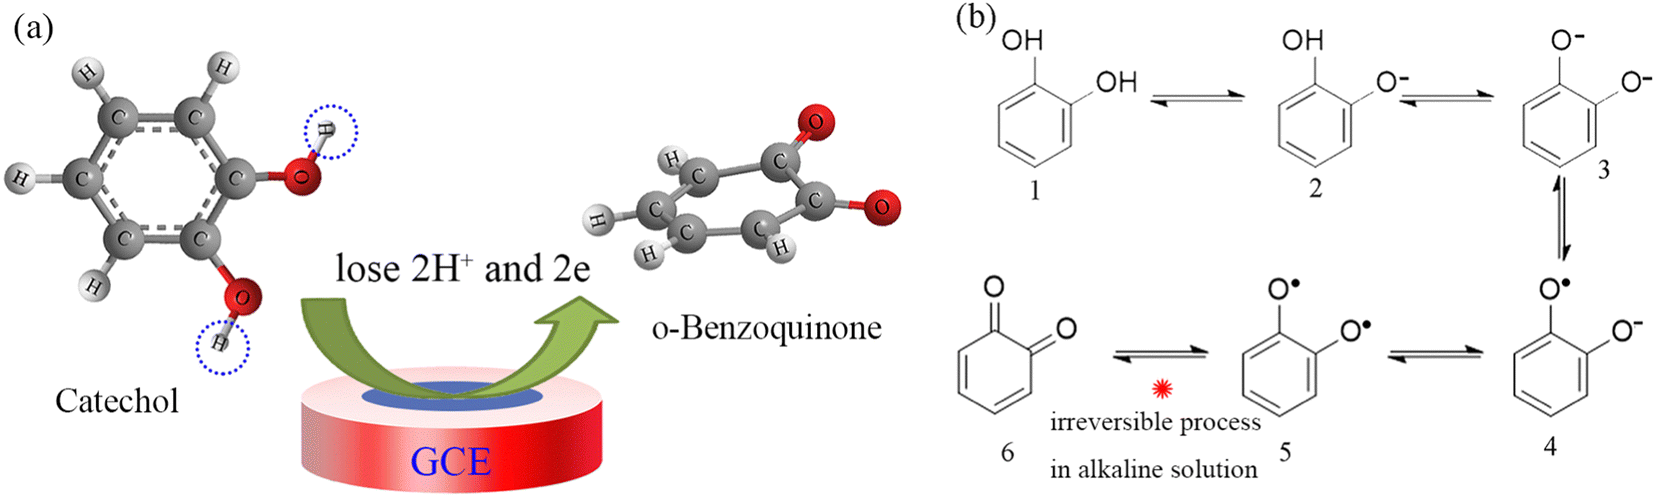
When the pH increases from 6.0 to 9.0 (Fig. 5d and Fig. S1, ESI†), the oxidation peak potential moves in a negative direction, which is related to the Nernst slope (0.059 V/n, where n is the number of electrons consumed in the electrochemical process). The negative slope indicates that, as the pH increases, the potentials move to lower negative values, demonstrating that the oxidation of catechol involves H+ (protons) and requires a lower oxidation energy at higher pH values.30,31 The slopes of the Epa–pH curves are close to the Nernst constant, 0.059 V/pH, indicating a 2H+/2e− relation between the protons and electrons, which can be presented as in Scheme 1a. The phenolic hydroxyl group of catechol is oxidized into a ketone group during the electrochemical oxidation process, changing from colorless to a pink color. This pH dependence of the catechol redox process is known as a proton-coupled electron transfer reaction.32
 | ||
| Scheme 1 (a) Mechanism of the redox reaction of catechol at the electrode and (b) the specific oxidation path. | ||
The electrochemical mechanism of the different materials was investigated further based on the CV curves at different scan rates. Fig. 6a and b show that, as the scan rate increases, the anodic peak shifts in a positive direction, indicating that there is a kinetic restriction process during the catechol electrochemical oxidation process. At the same time, the reduction peak potential of catechol at the Ni3(HITP)2/AgNS electrode is more negative than that at the Ni3(HITP)2/AgNP electrode, demonstrating that the reduction process requires a low reduction energy, leading to a thermodynamically feasible electron transfer reaction at the more negative potential. In particular, the reductive peak current of the Ni3(HITP)2/AgNP electrode is weaker than that of the Ni3(HITP)2/AgNS electrode. This probably indicates a mechanistic transition from chemically reversible to chemically irreversible—that is, the reduction process of catechol at the Ni3(HITP)2/AgNP electrode is a chemically irreversible process. The probable reason can be attributed as follows. Because catechol is oxidized to o-benzoquinone, it undergoes a nucleophilic attack by the hydroxyl ions through a 1,4-Michael addition reaction in relatively alkaline solutions. This hydroxylation consumes o-benzoquinone and hence the overall reaction becomes chemically irreversible.32,33 This can also be tested by the pH test.
 | ||
| Fig. 6 (a) and (b) CV curves of catechol at the Ni3(HITP)2/AgNS and Ni3(HITP)2/AgNP electrodes in PBS at different scan rates. (c) and (d) Linear fitting of the peak current (ip) vs. scan rate (v). | ||
Fig. S2 (ESI†) shows that the logarithm values of the peak current of the CV curves is linearly related to the logarithm of the scan rate. According to the equation in Fig. S2 (ESI†), the slopes are 0.3566 and 0.3636 for the Ni3(HITP)2/AgNS and Ni3(HITP)2/AgNP electrodes, respectively, showing that a mass diffusion controlled process is involved in the catechol redox reactions at the surface of both electrodes. Any hydroxylation or dimerization reactions are very slow because the catechol electrooxidation involves 1,4-Michael addition reactions, which use two electrons per molecule of catechol and convert it into its derivative o-benzoquinone. The mechanism of electrochemical catalysis of catechol at the electrodes is shown in Scheme 1b. The electron transfer number n can be calculated according to the following equation:34,35
 | (3) |
ν). The transfer coefficient (α) can be calculated according to the regression equation and Laviron's equation.36,37 The slope value of the Epa–lnv curve can be expressed as  , from which α is calculated as 0.77 and 0.61 for the Ni3(HITP)2/AgNP and Ni3(HITP)2/AgNS electrodes, respectively. In general, the transfer coefficient ranges from 0 to 1.
In practice, α gives the ratio of the change in height of the energy barrier the electron has to surmount during charge transfer with respect to the change in electrode potential—that is, in the change in the total Gibbs free energy (ΔG) due to the change in potential, what percentage of the total energy is used to change the activation energy of the reaction? In other words, α is the effective extent of the activation energy and the reaction rate of the electrode reaction affected by the change in electric potential. Generally, when α is 0.5, half of ΔG is used to change the activation energy of the forward reaction and the other half is used to change the activation energy of the reverse reaction. The forward and reverse reaction rates are equally affected by the change in electric potential. When α is >0.5, more than half of ΔG can be used to change the activation energy of the forward reaction. The change in potential will drastically affect the rate and current of the forward reaction and vice versa.38,39 Here, for the Ni3(HITP)2/AgNP and Ni3(HITP)2/AgNS, α is 0.77 and 0.61, respectively, suggesting that the rate and current of the catechol oxidation reaction is vigorously influenced by the potential, and this effect is more remarkable for the Ni3(HITP)2/AgNP electrode than the Ni3(HITP)2/AgNS electrode.
Fig. 7 displays the differential pulse voltammetry (DPV) response of catechol at the surface of the Ni3(HITP)2/AgNP and Ni3(HITP)2/AgNS electrodes. The oxidation peak current clearly increases with catechol concentration. Fig. 7b and d show that a linear relationship can be established between the peak current and the concentration of catechol. The parallel results of the calibration curves revealed in Fig. S3 in the ESI† suggest consistent results with Fig. 7. The linear range and the low detection limit (LOD) compared with the existing reports are listed in Table 1,40–43 exhibiting the wide linear range and excellent detection ability for the Ni3(HITP)2/AgNS and Ni3(HITP)2/AgNP electrodes toward catechol. The LOD is calculated using LOD = 3σ/S, where σ is the standard deviation of the response and S is the slope of the calibration curve.44 In addition, the excellent sensitivity was calculated as 1.326 and 0.874 μA μM−1 for the Ni3(HITP)2/AgNS and Ni3(HITP)2/AgNP electrodes, respectively, suggesting the potential electrochemical application of the obtained electrodes.
 | ||
| Fig. 7 (a) and (b) DPV responses of catechol at the Ni3(HITP)2/AgNP and Ni3(HITP)2/AgNS electrodes. (c) and (d) Calibration plots of the peak current with different concentrations of catechol. | ||
The repeatability and reproducibility were determined using one electrode to test six parallel catechol solutions and six modified electrodes to detect one catechol solution. Fig. 8a and b shows that the six current responses were similar and the corresponding relative standard deviations (RSDs) for the Ni3(HITP)2/AgNS and Ni3(HITP)2/AgNP electrodes were 3.65 and 3.98%. There was almost no attenuation in current after storing the three electrodes for one week (Fig. 8c). These results indicate the excellent repeatability, reproducibility and stability of the constructed sensors.
 | ||
| Fig. 8 (a) Peak currents of catechol at the six electrodes. (b) Repeatability of different electrodes in 0.1 M PBS containing 5 μM catechol with error bars. (c) Stability and anti-interference results. | ||
The interference measurements were carried out to evaluate the selectivity of the three electrodes. Fig. 8c shows that the presence of ten-fold amounts of uric acid, glucose, ascorbic acid, dopamine, sucrose, KCl and Al2(SO4)3 caused almost no significant interference in the determination of catechol, implying that the fabricated sensors based on the Ni3(HITP)2/AgNS and Ni3(HITP)2/AgNP electrodes exhibited good anti-interference ability.
To evaluate the practical applicability of the proposed sensors, Ni3(HITP)2/AgNS and Ni3(HITP)2/AgNP were used to determine catechol in simulated samples using a standard addition method. Table 2 shows that the recovery percentages of the two electrodes were 98.9–102.8 and 97.2–100.6%, with RSD values of 0.49–4.15% and 2.88–4.95%, respectively. These results demonstrate the availability of the proposed sensors for the determination of catechol.
| Materials | Original found (×0.1 μM) | Standard added (×0.1 μM) | Total found (×0.1 μM) | RSD (%) | Recovery (%) |
|---|---|---|---|---|---|
| Ni3(HITP)2/AgNS | 8.3 | 1.25 | |||
| 20 | 29.1 | 4.15 | 102.8 | ||
| 15 | 42.8 | 1.75 | 98.9 | ||
| 10 | 54.3 | 0.49 | 101.9 | ||
| Ni3(HITP)2/AgNP | 12.1 | 4.95 | |||
| 20 | 31.6 | 3.37 | 98.4 | ||
| 15 | 47.4 | 3.23 | 100.6 | ||
| 10 | 55.5 | 2.88 | 97.2 |
4. Conclusions
Electrochemical sensors based on Ni3(HITP)2/AgNS and Ni3(HITP)2/AgNP were fabricated to use as electrodes for the determination of catechol. Based on investigations of the effect of the nanosilvers, the sensing behavior of the electrodes showed some differences. The Ni3(HITP)2/AgNS electrode displayed a lower detection limit of 0.053 μM and better sensitivity, reproducibility and repeatability than the Ni3(HITP)2/AgNP electrode, which may be because the reduction process of catechol at the Ni3(HITP)2/AgNP electrode is chemically irreversible. The calibration curves reveal that the kinetic mechanism in the process of catechol electroxidation is the transformation of a phenolic hydroxyl group to a ketone group, during which more than half of ΔG is used to change the activation energy of the phenol-to-ketone reaction. This result can be derived from the transfer coefficient. Tests on real samples indicate that the compound materials have potential applications in the detection of catechol.Conflicts of interest
The authors declare no conflicts of interest.Acknowledgements
This work was financially supported by the National Natural Science Foundation of China (NSFC No. 22066020), The Scientific and Technological Project of Henan Province (No. 232102321115), The Youth Backbone Teacher Foundation Project of Henan University of Technology (No. 21420109), The Natural Science Innovation Fund Support Plan of Henan University of Technology (No. 2022ZKCJ08), and The National Innovation and Entrepreneurship Training Program for College Students (No. 202310463054).References
- H. Choi and K. Lee, Crosslinking mechanisms of phenol, catechol, and gallol for synthetic polyphenols: A comparative review, Appl. Sci., 2022, 12, 11626 CrossRef CAS.
- J. H. Yin, M. X. Liu, C. W. Lan, B. Q. Chu, L. Meng and N. Xu, Catechol oxidase nanozyme based colorimetric sensors array for highly selective distinction among multiple catecholamines, Anal. Chim. Acta, 2023, 1279, 341823 CrossRef CAS PubMed.
- H. Meskher and F. Achi, Electrochemical sensing systems for the analysis of catechol and hydroquinone in the aquatic environments: A critical review, Crit. Rev. Anal. Chem., 2022, 2114784, DOI:10.1080/10408347.2022.2114784.
- Z. An, J. Sun, Q. Mei, B. Wei, M. Li, J. Xie, M. He and Q. Wang, Unravelling the effects of complexation of transition metal ions on the hydroxylation of catechol over the whole pH region, J. Environ. Sci., 2022, 115, 392–402 CrossRef CAS PubMed.
- H. Meskher, S. B. Belhaouari, K. Deshmukh, C. M. Hussain and F. Sharifianjazi, A magnetite composite of molecularly imprinted polymer and reduced graphene oxide for sensitive and selective electrochemical detection of catechol in water and milk samples: An artificial neural network (ANN) application, J. Electrochem. Soc., 2023, 170, 047502 CrossRef CAS.
- J. Wang, J. Yang, P. Xu, H. Liu, L. Zhang, S. Zhang and L. Tian, Gold nanoparticles decorated biochar modified electrode for the high-performance simultaneous determination of hydroquinone and catechol, Sens. Actuators, B, 2020, 306, 127590 CrossRef CAS.
- Z. Rahmati, M. Roushani and H. Hosseini, Hierarchical hollow sea-urchin-like Ni–Co diselenide encapsulated in N-doped carbon networks as an advanced core-shell bifunctional electrocatalyst for fabrication of nonenzymatic glucose and hydrogen peroxide sensors, Sens. Actuators, B, 2020, 324, 128730 CrossRef CAS.
- M. Roushani, Z. M. Karazan and H. Hosseini, Farshad rabiei designing a novel microfluidic sensor based on Cu(OH)2/Ni(OH)2 core–shell nanostructural arrays on the surface of SPCE as a flow injection amperometric sensor for regular insulin measurement, Measurement, 2023, 215, 112853 CrossRef.
- G. T. Chandran, X. Li, A. Ogata and R. M. Penner, Electrically transduced sensors based on nanomaterials, Anal. Chem., 2017, 89, 249–275 CrossRef CAS PubMed.
- S. Farokhi, M. Roushani and H. Hosseini, Synthesis and characterization of NiCo-X (X = OH, S, Se, P) nanodiscs and comparison of their electrocatalytic performances in an electrochemical sensing platform, New J. Chem., 2022, 46, 14616 RSC.
- A. K. Kammoun, M. H. Abdelrahman, A. N. Khayyat, S. S. Elbaramawi, T. S. Ibrahim and N. A. Abdallah, Exploitation of multi-walled carbon nanotubes/Cu(ii)-metal organic framework based glassy carbon electrode for the determination of orphenadrine citrate, RSC Adv., 2023, 13, 31017–31026 RSC.
- A. Kazemzadeh and H. Kazemzadeh, Determination of Hg2+ by diphenylcarbazone compound in polymer film, J. Compos. Compd., 2019, 2, 27–30 Search PubMed.
- H. Meskher, T. Ragdi, A. K. Thakur, S. Ha, I. Khelfaoui, R. Sathyamurthy, S. W. Sharshir, A. K. Pandey, R. Saidur, P. Singh, F. Sharifian Jazi and I. Lynch, A review on CNTs-based electrochemical sensors and biosensors: unique properties and potential applications, Anal. Chem., 2023, 1–24, DOI:10.1080/10408347.2023.2171277.
- H. Meskher, H. C. Mustansar, A. K. Thakur, R. Sathyamurthy, G. I. Lynch, P. Singh, T. K. Han and R. Saidur, Recent trends in carbon nanotube (CNT)-based biosensors for the fast and sensitive detection of human viruses: a critical review, Nanoscale Adv., 2023, 5, 992–1010 RSC.
- X. Zhang, Y. Xu and B. Ye, An efficient electrochemical glucose sensor based on porous nickel-based metal organic framework/carbon nanotubes composite (Ni-MOF/CNTs), J. Alloys Compd., 2018, 767, 651–656 CrossRef CAS.
- Z. Xu, Q. Wang, H. Zhangsun, S. Zhao, Y. Zhao and L. Wang, Carbon cloth-supported nanorod-like conductive Ni/Co bimetal MOF: A stable and high-performance enzyme-free electrochemical sensor for determination of glucose in serum and beverage, Food Chem., 2021, 349, 129202 CrossRef CAS PubMed.
- H. Meskher, S. B. Belhaouari and F. Sharifianjazi, Mini review about metal organic framework (MOF)-based wearable sensors: Challenges and prospects, Heliyon, 2023, 9, e21621 CrossRef CAS PubMed.
- S. Y. Zhou, X. Y. Kong, B. Zheng, F. W. Huo, M. Strømme and C. Xu, Cellulose nanofiber@conductive metal-organic frameworks for high performance flexible supercapacitors, ACS Nano, 2019, 13, 9578–9586 CrossRef CAS PubMed.
- X. Huang, P. Sheng, Z. Tu, F. Zhang, J. Wang, H. Geng, Y. Zou, C. A. Di, Y. Yi, Y. Sun, W. Xu and D. Zhu, A two-dimensional p-d conjugated coordination polymer with extremely high electrical conductivity and ambipolar transport behaviour, Nat. Commun., 2015, 6, 7408–7415 CrossRef CAS PubMed.
- W. H. Li, J. Lv, Q. Li, J. Xie, N. Ogiwara, Y. Huang, H. Jiang, H. Kitagawa, G. Xu and Y. Wang, Conductive metal–organic framework nanowire arrays for electrocatalytic oxygen evolution, J. Mater. Chem. A, 2019, 7, 10431–10438 RSC.
- Y. N. Zhou, L. Sheng, L. L. Chen, Q. Q. Luo, W. H. Zhao, W. H. Zhang and J. L. Yang, Two-dimensional conductive metal-organic frameworks as efficient electrocatalysts for oxygen evolution and reduction reactions, Inorg. Chem. Front., 2023, 10, 5044–5052 RSC.
- D. W. Luo, J. F. Huang, Y. H. Jian, A. Singh, A. Kumar, J. Q. Liu, Y. Pan and Q. Ouyang, Metal-organic frameworks (MOFs) as apt luminescent probes for the detection of biochemical analytes, J. Mater. Chem. B, 2023, 11, 680–6822 Search PubMed.
- M. L. Cai, L. Li, J. Cao, D. Chen, H. Tu, J. Li and W. Han, A highly conductive MOF of graphene analogue Ni3(HITP)2 as a sulfur host for high-performance lithium-sulfur batteries, Small, 2019, 15, 1902605 CrossRef PubMed.
- S. J. Gao, W. F. Liu, M. L. Wang, Z. B. Zhao and X. G. Liu, A three-dimensional in situ self-electrolysis system based on Ni3(HITP)2/graphene-based composite aerogel particle electrodes for efficient deep removal of phenol from coking wastewater, Appl. Catal., B, 2024, 340, 123276 CrossRef CAS.
- A. Nazir, H. T. T. Le, C. W. Min, A. Kasbe, J. Kim, C. S. Jin and C. J. Park, Coupling of a conductive Ni3(2,3,6,7,10,11-hexaiminotriphenylene)2 metal-organic framework with silicon nanoparticles for use in high-capacity lithium-ion batteries, Nanoscale, 2020, 12, 1629–1642 RSC.
- Z. Zhang, D. Dell'Angelo, M. R. Momeni, Y. Shi and F. A. Shakib, Metal-to-semiconductor transition in two-dimensional metal-organic frameworks: an ab initio dynamics perspective, ACS Appl. Mater. Interfaces, 2021, 13, 25270–25279 CrossRef CAS PubMed.
- W. C. Zhang, X. L. Wu, C. X. Kan, F. M. Pan, H. T. Chen, J. Zhu and P. K. Chu, Surface-enhanced Raman scattering from silver nanostructures with different morphologies, Appl. Phys. A: Mater. Sci. Process., 2010, 100, 83–88 CrossRef CAS.
- Y. Zhang, T. Qiu, F. Jiang, S. Amzil, Y. Wang, H. Fu, C. Yang, Z. Fang, J. Huang and G. Dai, Spindle-like Ni3(HITP)2 MOFs: synthesis and Li+ storage mechanism, Appl. Surf. Sci., 2021, 556, 149818 CrossRef CAS.
- Y. Fang, Y. Y. Lv, F. Gong, A. A. Elzatahry, G. F. Zheng and D. Y. Zhao, Synthesis of 2D-mesoporous-carbon/MoS2 heterostructures with well-defined interfaces for high-performance lithium-ion batteries, Adv. Mater., 2016, 28, 9385–9390 CrossRef CAS PubMed.
- K. He, F. Lin, Y. Zhu, X. Yu, J. Li, R. Lin, D. Nordlund, T. Weng, R. M. V. Richards, X. Yang, M. M. Doeff, E. A. Stach, Y. Mo, H. Xin and D. Su, Sodiation kinetics of metal oxide conversion electrodes: A comparative study with lithiation, Nano Lett., 2015, 15, 5755–5763 CrossRef CAS PubMed.
- O. Yanez, M. I. Osorio, E. Osorio, W. Tiznado, L. Ruíz, C. García, O. Nagles, M. J. Simirgiotis, G. Castaneta, C. Areche and O. García-Beltrán, Antioxidant activity and enzymatic of lichen substances: A study based on cyclic voltammetry and theoretical, Chem.-Biol. Interact., 2023, 372, 110357 CrossRef CAS PubMed.
- Q. Q. Lin, Q. Li, C. Batchelor-McAuley and R. G. Compton, The two electron, two proton oxidation of catechol: Kinetics and apparent catalysis, J. Phys. Chem. C, 2015, 119, 1489–1495 CrossRef CAS.
- F. Zhao, S. Zhou and Y. Zhang, Ultrasensitive detection of hydrogen peroxide using Bi2Te3 electrochemical sensors, ACS Appl. Mater. Interfaces, 2021, 13, 4761–4767 CrossRef CAS PubMed.
- F. C. Anson, Application of potentiostatic current integration to the study of theadsorption of cobalt(III)-ethylenedinitrilo(tetraacetate) on mercury electrodes, Anal. Chem., 1964, 36, 932–934 CrossRef CAS.
- C. Chen, P. Zhao, C. Li, Y. Xie and J. Fei, Highly sensitive temperature-responsive sensor based on PS-PDEA-PS/C60-MWCNTs for reversible switch detection of catechol, Electroanal, 2019, 31, 913–921 CrossRef CAS.
- H. Lei, H. Zhu, S. Sun, Z. Zhu, J. Hao, S. Lu, Y. Cai, M. Zhang and M. Du, Synergistic integration of Au nanoparticles, Co-MOF and MWCNT as biosensors for sensitive detection of low-concentration nitrite, Electrochim. Acta, 2021, 365, 137375 CrossRef CAS.
- X. Zhang, D. Li, C. Dong, J. Shi, Y. Sun, B. Ye and Y. Xu, Molybdenum sulfide-based electrochemical platform for high sensitive detection of taxifolin in Chinese medicine, Anal. Chim. Acta, 2020, 1099, 85–93 CrossRef CAS PubMed.
- R. Guidelli, R. G. Compton, J. M. Feliu, E. Gileadi, J. Lipkowski and W. Schmickler, Definition of the transfer coefficient in electrochemistry IUPAC recommendations, Pure Appl. Chem., 2014, 86, 259–262 CrossRef CAS.
- R. Guidelli, R. G. Compton, J. M. Feliu, E. Gileadi, J. Lipkowski and W. Schmickler, Defining the transfer coefficient in electrochemistry: An assessment (IUPAC Technical Report), Pure Appl. Chem., 2014, 86, 245–258 CrossRef CAS.
- X. Liu, X. Cao, S. Zhao, Z. Liu, G. Lu and Q. Liu, N,S co-doped Co3O4 core-shell nanospheres with high peroxidase activity for the fast colorimetric detection of catechol, Anal. Methods, 2021, 13, 5377–5382 RSC.
- M. L. Hui Mao, Z. Q. Cao, C. G. Ji, Y. Sun, D. L. Liu, S. Y. Wu, Y. Zhang and X. M. Song, Poly(4-vinylphenylboronic acid) functionalized polypyrrole/graphene oxide nanosheets for simultaneous electrochemical determination of catechol and hydroquinone, Appl. Surf. Sci., 2017, 420, 594–605 CrossRef.
- B. Kapan, S. Kurbanoglu, E. N. Esenturk, S. Soylemez and L. Toppare, Electrochemical catechol biosensor based on β-cyclodextrin capped gold nanoparticles and inhibition effect of ibuprofen, Process Biochem., 2021, 108, 80–89 CrossRef CAS.
- T. Zhong, Q. Guo, X. Zhu, R. Liu and S. Huang, Based on gold nanoparticles-L-Tyr-Amino functionalized mesoporous materials-polyphenol oxidase modified biosensor for the detection of resorcinol, Anal. Sci., 2021, 37, 817–823 CrossRef CAS PubMed.
- Y. Deng, H. Zheng, X. Yi, C. Shao, B. Xiang, S. Wang, Z. Zhao, X. Zhang and G. Hui, Paralytic shellfish poisoning toxin detection based on cell-based sensor and non-linear signal processing model, Int. J. Food Prop., 2019, 22, 890–897 CrossRef CAS.
Footnote |
| † Electronic supplementary information (ESI) available. See DOI: https://doi.org/10.1039/d3cp05391a |
| This journal is © the Owner Societies 2024 |