
Two-photon excited-state dynamics of mEGFP-linker-mScarlet-I crowding biosensor in controlled environments
Sarah A.
Mersch
a,
Sarah
Bergman
a,
Erin D.
Sheets
 a,
Arnold J.
Boersma
b and
Ahmed A.
Heikal
*a
a,
Arnold J.
Boersma
b and
Ahmed A.
Heikal
*a
aDepartment of Chemistry and Biochemistry, Swenson College of Science and Engineering, University of Minnesota Duluth, Duluth, MN 55812, USA. E-mail: aaheikal@d.umn.edu; Tel: +1-218-726-7036
bCellular Protein Chemistry, Bijvoet Centre for Biomolecular Research, Faculty of Science, Utrecht University, Utrecht, The Netherlands
First published on 8th January 2024
Abstract
Macromolecular crowding affects many cellular processes such as diffusion, biochemical reaction kinetics, protein–protein interactions, and protein folding. Mapping the heterogeneous, dynamic crowding in living cells or tissues requires genetically encoded, site-specific, crowding sensors that are compatible with quantitative, noninvasive fluorescence micro-spectroscopy. Here, we carried out time-resolved 2P-fluorescence measurements of a new mEGFP-linker-mScarlet-I macromolecular crowding construct (GE2.3) to characterize its environmental sensitivity in biomimetic crowded solutions (Ficoll-70, 0–300 g L−1) via Förster resonance energy transfer (FRET) analysis. The 2P-fluorescence lifetime of the donor (mEGFP) was measured under magic-angle polarization, in the presence (intact) and absence (enzymatically cleaved) of the acceptor (mScarlet-I), as a function of the Ficoll-70 concentration. The FRET efficiency was used to quantify the sensitivity of GE2.3 to macromolecular crowding and to determine the environmental dependence of the mEGFP-mScarlet-I distance. We also carried out time-resolved 2P-fluorescence depolarization anisotropy to examine both macromolecular crowding and linker flexibility effects on GE2.3 rotational dynamics within the context of the Stokes–Einstein model as compared with theoretical predictions based on its molecular weight. These time-resolved 2P-fluorescence depolarization measurements and conformational population analyses of GE2.3 were also used to estimate the free energy gain upon the structural collapse in crowded environment. Our results further the development of a rational engineering design for bioenvironmental sensors without the interference of cellular autofluorescence. Additionally, these results in well-defined environments will inform our future in vivo studies of genetically encoded GE2.3 towards the mapping of the crowded intracellular environment under different physiological conditions.
1. Introduction
Macromolecular crowding has attracted increasing scrutiny over the past few decades for its importance in the regulation of cellular processes.1–4 Cells are known to be approximately 40% macromolecules by volume, equivalent to a concentration of 300–400 g L−1 in E. coli.1,2,5–7 Crowding has been observed to alter protein–protein interactions, equilibria, protein folding, diffusion and transport, and reaction kinetics.1–3,7–9 Due to the dynamic nature of macromolecular crowding, understanding the role of crowding in living cells remains a challenge. Designing site-specific, non-toxic, and well-characterized probes for measurement of macromolecular crowding is therefore critical for improving our understanding of this complex environmental milieu.Several macromolecular crowding sensors have been designed by Boersma and co-workers.10–14 These sensors are composed of cyan fluorescent proteins (CFPs: mCerulean3, mTurquoise2, and mTurquoise2.1) as donor molecules paired with a yellow fluorescent protein (YFP: mCitrine) as an acceptor.15–22 In these sensors, the donor–acceptor pairs are tethered together via a flexible linker region of varying amino acid sequence (i.e., different length and flexibility). The environmental sensitivity of these donor–acceptor pairs can be characterized quantitatively by measuring the corresponding Förster resonance energy transfer (FRET) from the donor to the acceptor.10–12 Using time resolved one-photon excitation fluorescence measurements23–25 as well as time-resolved fluorescence depolarization anisotropy23,26 and fluorescence correlation spectroscopy27, we have characterized the impact of donor identity and linker design on the FRET sensitivity of these sensors to macromolecular crowding using controlled in vitro solutions.23,24,26,28–30 Our studies have indicated that a short, flexible linker region, composed of two electrostatically neutral α-helices, is highly sensitive to macromolecular crowding.23,24 Crowding sensors with CFPs as donors, however, are excited using near-UV lasers (375–475 nm), which can have negative impacts on cells, and may not be accessible in every microscopy lab. The corresponding emission of these CFP donors also requires specialized optics and is not ideal for traditional optical microscopes. Additionally, the emission spectra of many CFPs (450–550 nm) overlaps with the intrinsic autofluorescence of flavins such as NADH and FAD.31–37
To overcome these challenges, Boersma et al. recently introduced a new macromolecular crowding sensor, namely a mEGFP–linker-mScarlet-I construct (or GE2.3).14 This sensor contains two electrostatically neutral α-helices in the linker region (Fig. 1A) between the donor (mEGFP) and acceptor (mScarlet-I), which has been shown to be a promising probe to macromolecular crowding.24,26 Importantly, the maximum absorption (490 nm) and emission (505 nm) of mEGFP in the GE2.3 sensor (Fig. 1B) would allow for minimum interference with the cellular autofluorescence (e.g., intrinsic NADH and flavins) for reliable imaging of site-specific cellular crowding in living cells or tissues.
 | ||
| Fig. 1 The chemical structure and steady-state spectroscopy of GE2.3 construct. (A) GE2.3 consists of a donor (mEGFP) and acceptor (mScarlet-I) that are tethered together via neutral double α-helices [-(GSG)6A(EAAAK)6A(GSG)6A(EAAAK)6A(GSG)6-] in the linker region. We hypothesize that the conformations (stretched and collapsed) of the donor–acceptor pair in GE2.3 will reach an equilibrium in a crowded environment, which leads to enhanced FRET for the collapsed structure. (B) The normalized absorption and emission spectra of GE2.3 in PBS buffer exhibits two major absorption peaks (solid line), one at 490-nm (mEGFP, donor: D) and another at 570-nm (mScarlet-I, acceptor: A). The emission of the donor (dashed curve) peaks at 505 nm as compared with the 590 nm emission peak of the acceptor (dotted curve). The asterisk indicates the 2P pulsed excitation (900 nm) of the donor at twice the indicated wavelength (450 nm) on the steady-state absorption. The horizontal dashed arrow around 520/60-nm indicates the detection filter used for time-resolved 2P-fluorescence at magic angle detection (54.7°). However, the dashed arrow (555–690 nm) indicates the detection emission filter used for polarization (parallel and perpendicular) analysis for rotational and FRET-induced depolarization experiments. Depolarization analysis due to rotational dynamics of GE2.3 alone were carried out under the 2P-excitation (900 nm) and detection (520/60 nm) of the donor's emission. | ||
In this contribution, we investigate a novel mEGFP-linker-mScarlet-I macromolecular crowding construct (GE2.3; Fig. 1A) to characterize its environmental sensitivity in biomimetic crowded solutions (Ficoll-70, 0–300 g L−1) using time-resolved 2P-fluorescence measurements of the donor (mEGFP) in the presence and absence (enzymatic cleavage) of the acceptor (mScarlet-I). The mEGFP of this GE2.3 construct has an absorption peak around 488 nm (accessible laser wavelength for most optical microscopy laboratories) and emits fluorescence near 510 nm (Fig. 1B), which rules out potential interference from cellular autofluorescence. The environmental sensitivity of these sensors is correlated with the measured FRET efficiency and the donor–acceptor distance. Two different modalities of 2P excitation (single-point versus laser-scanning mode as in 2P-FLIM) were also compared to examine the sensitivity of the estimated FRET efficiency (i.e., environmental sensitivity) to the employed method for lifetime measurements. We also carried out time-resolved 2P-fluorescence depolarization anisotropy to examine both macromolecular crowding and linker flexibility effects on GE2.3 rotational dynamics within the context of the Stokes–Einstein model as compared with theoretical predictions based on its molecular weight. In addition, these 2P-depolarization analyses of GE2.3 were used to determine the equilibrium constant (K) and the Gibbs free energy changes (ΔG°) associated with the structural conformations in response to environmental crowding.
2. Materials and methods
2.1. Materials
The plasmids encoding the donor-linker-acceptor GE2.3 constructs14 in the pRSET A host vector were transfected into the E. coli strain BL21(DE)pLysS (Invitrogen). The GE2.3 construct (Fig. 1A) was purified via nickel resin affinity chromatography (ProBond, Life Technologies), and the peak fraction was dialyzed against 1X PBS before being aliquoted and flash frozen in liquid nitrogen for storage at −80 °C until use. Here we assume that both the donor (mEGFP) and acceptor (mScarlet-I) in the purified GE2.3 sample from E. coli are matured concerning both the integrity of the β-barrel and the embedded chromophore. This assumption is based on the observed steady-state spectroscopy and the fact that the embedded chromophore is unlikely to absorb light or emit fluorescence without the intact β-barrel and the surrounding amino acids (in either mEGFP or mScarlet-I) of the GE2.3 sensor. As a control, enzymatic cleavage of the linker region using the serine protease Proteinase K was used to investigate the excited-state dynamics of the donor molecule in the absence of the acceptor under the same experimental conditions. For this cleavage reaction, 0.56 ng of proteinase K was added per μmol of purified probe and was allowed to react for one minute at 25 °C. The cleavage reaction was quenched after one minute using 20 μmol PMSF per mg of proteinase K. SDS-PAGE analysis with Coomassie staining was used to ensure complete cleavage of the linker region. The crowding agent (namely, Ficoll-70) was dissolved in 1X PBS at different concentrations (0–300 g L−1) and combined with intact or cleaved sensors at a concentration of ∼8 μM for two-photon (2P) excited state dynamics studies. No significant background signal was observed for blank Ficoll-70 solutions.2.2. Methods and data analysis
The experimental setup for time-resolved fluorescence measurements, using time-correlated single-photon counting (TCSPC), has been detailed elsewhere.24,29,33,34 Briefly, the infrared laser pulses (900 nm, 76 MHz, Mira 900-F, Coherent) were generated using a titanium-sapphire laser followed by a pulse picker for reducing the repetition rate of the laser pulses (4.2 MHz, Mira-900, Coherent). The laser pulses were conditioned and steered toward a laser-scanning unit (FV300, Olympus) prior to an inverted microscope (IX-81, Olympus), a dichroic mirror (690DMSP), and then the microscope objective (1.2NA, Olympus UPlanApo IR, water immersion, 60×) for sample (a droplet on a coverslip) excitation. The epifluorescence from the donor, in the presence and absence of the acceptor, was filtered using a band-pass filter (520/60) and detected using a microchannel plate photomultiplier tube (R3809U, Hamamatsu) at the theoretical magic-angle polarization (54.7°) setting of a Glan–Thomson polarizer. It is worth noting that our laser beam waist was smaller than the diameter of the back aperture of the microscope objective (i.e., the NA is less than 1.2) and the fluorescence beam entering the Glan–Thomson polarizer is not exactly collimated, which might skew the exact magic-angle polarization.38 However, the setup was calibrated using a fluorophore with known fluorescence lifetime under the same experimental conditions for both cleaved and intact GE2.3 sensor measurements. For time-resolved 2P-anisotropy, the epifluorescence of mostly the acceptor's emission (555–690 nm) was split into parallel and perpendicular polarizations using a polarizing beam splitter and detected simultaneously using two microchannel plate photomultiplier tubes. The 2P-fluorescence signal was then amplified and routed toward a synchronized SPC-150 module (Becker & Hickl) for TCSPC detection. The system was calibrated using rhodamine-110 and rhodamine B (RhB), respectively, as reference fluorophores, and the acquired fluorescence lifetime data deconvoluted (SPCImage software, Becker & Hickl) with the measured system response function (full-width half-maximum of ∼45 ps), generated using second harmonic generation from sodium phosphate dibasic crystal powder. Using SPCImage, a maximum likelihood estimation (MLE) fitting model provided a better fitting quality as compared with a weighted least-squares (WLS) model.The time-resolved 2P-fluorescence of the donor (mEGFP) or cleaved GE2.3 can be satisfactorily described as a single exponential following complete cleavage reaction. In the presence of the acceptor (i.e., intact sensors), however, the fluorescence decay of the donor molecule is described as a biexponential such that:23,24,29
 | (1) |
To distinguish between changes in the average fluorescence lifetime of GE2.3 due to FRET and the environmental refractive index (n), we measured both cleaved and intact sensor under the same environmental conditions prior to the energy transfer efficiency calculations. When the concentration of enzymatically-cleaved GE2.3 was too low to measure the cleaved sample under all Ficoll concentrations, we used the Strickler–Berg equation to predict the changes of the excited-state fluorescence lifetime due to the refractive index of a given Ficoll-70 solution as compared with buffer, where:39
 | (2) |
The FRET efficiency of GE2.3 was calculated using the observed 2P-fluorescence lifetime of intact (τDA) and cleaved (τD) sensor such that:23,24,29,40
 | (3) |
In this case, the average 2P-fluorescence lifetime of the intact (τDA) was used to calculate the ensemble-averaged FRET efficiency. When possible, the 2P-fluorescence lifetime of the cleaved GE2.3 (i.e., the donor alone) were measured in the same Ficoll solutions under the same experimental conditions to account for the refractive index effect on the observed fluorescence decay rates. Due to low concentration of the enzymatically cleaved GE2.3, however, we used the fluorescence decay rate of cleaved GE2.3 in a buffer with and without the refractive index correction using Strickler–Berg equation (eqn (2)) to highlight its effect on the FRET analysis. We also compare our estimated FRET efficiency using eqn (3) with another model using the fast and slow decay components (eqn (1)) that is routinely used in 2P-fluorescence lifetime imaging microscopy (2P-FLIM) studies for FRET analyses. This model (eqn (4)) reports the FRET efficiency of the subpopulation undergoing energy transfer, which is expected to be larger than the ensemble averaged FRET efficiency. In this alternative method of data analysis, the energy transfer efficiency (E) is calculated according to:41
 | (4) |
The time-resolved 2P fluorescence depolarization anisotropy of GE2.3 was also determined for both rotational dynamics (when exciting and detecting mEGFP) and FRET analysis (when exciting mEGFP and detecting the polarization analysis of mostly the acceptor's emission). In these measurements, time-resolved fluorescence with parallel, I‖(t), and perpendicular, I⊥(t), polarizations were recorded simultaneously using beam-splitter and two channel detection, where the time-resolved anisotropy can be calculated such that40:
 | (5) |
When exciting and detecting the fluorescence polarization of mEGFP, the observed time-resolved anisotropy (depolarization) reflects the rotational dynamics of the sensor with a flexible linker such that:23,26,28
| r(t) = r0e−(φ−1)t | (6) |
 | (7) |
When exciting mEGFP and detecting the fluorescence polarization analysis of mostly the acceptor's emission, the observed 2P-anisotropy (depolarization) decays as a biexponential due to both FRET (first term with an amplitude β1) and rotational dynamics (second term with an amplitude β2) such that:23,26,28
| r(t) = β1e−(KET + φ−1)t + β2e−(φ−1)t | (8) |
 | (9) |
Once the energy transfer efficiency (E-value) is determined using either time-resolved fluorescence or depolarization, the corresponding donor–acceptor distance (RDA) can be calculated using the following equation40,44 as a function of the surrounding environment:
 | (10) |
3. Results and discussion
3.1. 2P-Fluorescence lifetime and FRET analysis of GE2.3 in crowded solutions
We hypothesize that GE2.3 in a crowded environment (i.e., high Ficoll concentration) would favor a collapsed conformation due to steric hinderance, which brings mEGFP (donor) and mScarlet-I (acceptor) closer to each other and therefore enhances the FRET efficiency. To test this hypothesis, we measured the sensitivity of the excited-state dynamics (detected at magic-angle 54.7° polarization to rule out rotational motion) of GE2.3 to the surrounding environment using time-resolved 2P-fluorescence measurements of the cleaved and intact sensor as a function of Ficoll-70 concentration (0–300 g L−1). Due to our laser-system limitations, the 900-nm laser pulses were used to excite the 2P-fluorescence (520/60) of the donor (mEGFP), in the presence (intact GE2.3) and absence (cleaved GE2.3) of the acceptor (mScarlet-I) in PBS buffer as a function of the Ficoll-70 concentration. The 2P-fluorescence of the cleaved GE2.3 (i.e., mEGFP) in PBS buffer decays satisfactorily as a single exponential with an estimated excited-state lifetime of 2.75 ± 0.05 ns, which is in reasonable agreement with the literature values (2.6 ± 0.1 ns) using 2P-excitation.46–49 In contrast, the 2P-fluorescence of intact GE2.3 decays as a biexponential (Fig. 2) under the same conditions with 2.1 ± 0.05 ns (50%) and 3.0 ± 0.05 ns (50%) time constants (i.e., an estimated average lifetime of 2.57 ns). The observed biexponential decays of intact GE2.3 (Fig. 2) are attributed to the presence of an ensemble of two subpopulations, one undergoing FRET (collapsed conformation) and another with negligible FRET (stretched conformation). Fig. 2 shows a normalized 2P-fluorescence decay of intact GE2.3 in PBS, deconvoluted with the measured instrument response function (IRF) and the corresponding residuals of single and double exponential decay fittings are shown. Similar measurements also show that as the Ficoll concentration (crowding) increases, the average fluorescence decay time constant decreases, which is attributed to FRET since both the cleaved and intact GE2.3 were measured under the same environmental refractive indices. | ||
| Fig. 2 The time-resolved 2P-fluorescence of the intact GE2.3 decays as a biexponential in PBS buffer. (A) Exciting (900-nm) and detecting (520/60 nm) the donor in the presence of the acceptor, the observed fluorescence decays are best described as biexponential (dotted gray curve) under magic-angle detection (54.7°) to rule out the effects of rotational mobility of the donor on the observed excited state dynamics. In addition to the χ2, the residuals for both single and double exponential fitting are also shown (top). The instrument response function (full width half maximum of ∼50 ps) was measured (A: gray solid curve) daily for deconvolution fitting using the second harmonic of sodium phosphate dibasic crystal powder. Similar measurements on GE2.3 were carried out in different Ficoll solutions (0 – 300 g L−1). Under the same experimental conditions, the fluorescence of mEGFP (cleaved GE2.3) decays as a single exponential with an estimate lifetime of 2.75 ns (not shown). | ||
As a control, we used the measured 2P-fluorescence lifetime of both cleaved and intact GE2.3 in a PBS buffer (n = 1.33) and Ficoll-70 solutions (with known refractive indices) under the same experimental conditions to assess the refractive index effect on the observed excited state lifetime. We concluded that the observed fluorescence lifetime of the intact GE2.3 was shorter by about 10% due to FRET as compared with the projected change due to the refractive index according to the Strickler–Berg equation (eqn (2)).39
Using the fitting parameters of the observed 2P-fluorescence decays of both cleaved and intact GE2.3, we calculated the energy transfer efficiency using several methods traditionally employed in literature for both single-point40,44,50 and 2P-FLIM51,52 measurements. Fig. 3, for example, shows the FRET efficiency of GE2.3, calculated using the average 2P-fluorescence lifetime of the intact GE2.3, as a function of the Ficoll concentration (0–300 g L−1). The only difference between curves 1 and 2 (Fig. 3) is the fluorescence lifetime of the cleaved counterpart for FRET analysis. Since the cleaved GE2.3 concentration was too low to measure directly at different concentrations of Ficoll-70, we used the Strickler–Berg equation (eqn (2)) to predict the corresponding change in the fluorescence lifetime of cleaved GE2.3 (buffer) at different Ficoll-70 concentrations of known refractive indices (Fig. 3, curve 1). Accordingly, the refractive index effect on the excited state lifetime of the donor in both cleaved and intact GE2.3 can be ruled out in our energy transfer efficiency calculations (Fig. 3, curve 1, solid black spheres). To test the refractive index effect on the estimated FRET efficiency, however, we also calculated the energy transfer efficiency (Fig. 3, curve 2, gray solid squares) using the measured 2P-fluorescence lifetime of intact GE2.3 as a function of Ficoll concentration and the fluorescence lifetime (2.75 ns) of the cleaved counterpart in buffer (Fig. 3, curve 2). The difference between curve 1 and curve 2 (Fig. 3) indicates the importance of refractive index in FRET studies of hetero-FRET systems such as GE2.3. The observed trends remain the same (i.e., the energy transfer efficiency increases as the Ficoll concentration increases, which supports our hypothesis); however, the environmental refractive index influences the dynamic range of the FRET efficiency per 1 g L−1 of the crowding agent (Ficoll-70).
 | ||
| Fig. 3 The energy transfer efficiency of GE2.3 increases as the Ficoll concentration increases. The measured 2P-fluorescence decays of the donor (mEGFP) in the presence (Fig. 2) and absence of the acceptor (mScarlet-I) were used to calculate the FRET efficiency as a measure of its sensitivity to crowding. The corresponding FRET efficiency of GE2.3 in each environment (0–300 g L−1 Ficoll-70) was calculated using eqn 3. Curve(1) represents the observed of FRET efficiency of GE2.3 (solid black spheres), where the 2P-fluorescence decays of both cleaved and intact sensor were measured in the same Ficoll solution (i.e., refractive index effect on the excited-state lifetime and therefore FRET efficiency can be ruled out). Due to the low concentration of cleaved GE2.3, we also calculated the FRET efficiency of GE2.3 (curve 2, gray solid squares) in Ficoll solutions using the 2P-fluorescence lifetime of the donor alone (cleaved sensor). The dashed line shown here is for eye guidance only with no theoretical significance. | ||
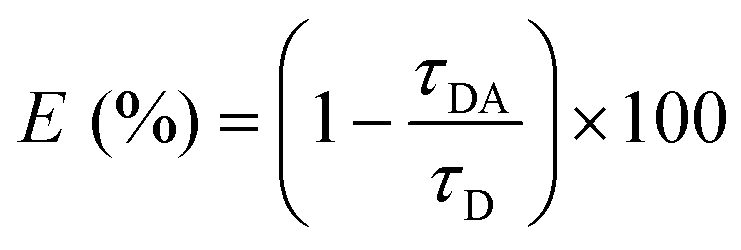
Using the estimated energy transfer efficiency shown in Fig. 3, we also calculated the corresponding donor–acceptor distance of GE2.3 (with an estimated Förster distance of ∼5.7 nm) in response to Ficoll crowding (Fig. 4, curves 1 and 2). In PBS buffer, the donor–acceptor distance using ensemble averaging (eqn (3)) is 7.5 nm (eqn (10)) as compared with 6.5 nm for the FRETing subpopulation alone (eqn (4)). As the concentration of Ficoll-70 increases (0–300 g L−1), the donor–acceptor distance decreases (Fig. 4) in support of our stated hypothesis.
 | ||
| Fig. 4 The donor–acceptor distance of GE2.3 decreases as the Ficoll concentration increased. The estimated FRET efficiency of GE2.3 (Fig. 3, curves 1 and 2) as a function of the Ficoll concentration was used to calculate corresponding donor–acceptor distance (eqn (10)) shown here. In these calculations, we used steady-state spectroscopy of GE2.3 (Fig. 1) and the refractive index of the Ficoll solutions to estimate the Förster distance (R0). The dashed line shown here is for eye guidance only with no theoretical significance. | ||
These results indicate that GE2.3 is sensitive to Ficoll crowding over a 0–300 g L−1 concentration range with an estimated dynamic range of 10 ± 2% after ruling out the refractive index effect (Fig. 3, curve 1) as compared with 16 ± 2% if we used the fluorescence lifetime of the cleaved counterpart (i.e., donor) in a buffer only (Fig. 3, curve 2). The estimated sensitivity of GE2.3 is relatively comparable with previous crowding sensors such as GE24 and GE2.030 with similar linker design, but different donor–acceptor pairs.10,12 GE2.3 also has a different spectral overlap (∼3.1 × 10¹⁵ M−1 cm−1 nm4) as compared with GE (∼2.08 × 10¹⁵ M−1 cm−1 nm4)45, which should impact the observed FRET efficiency. For future genetically encoded GE2.3 in living cells or tissues, the donor's emission is clearly separated from the cellular autofluorescence emitted by NAD(P)H or flavins31,32 for in vivo FRET studies.
These FRET analyses are in general agreement with other crowding sensors with somewhat similar linker amino acid sequence, but different donor–acceptor pairs, such as GE (mCerulean3-linker-mCitrine)23,24 and mTurquoise2.1-linker-mCitrine (GE2.1)30 using complementary time-resolved 1P-fluorescence measurements.
During the preparation of this manuscript, Lecinski et al. (2022)53 have also reported the use of one-photon (488 nm) time-resolved spectroscopy to investigate crGE2.3 (same as GE2.3) in vitro (glycerol, Ficoll-70, and Ficoll-400 over the range of 0–50% w/v) as well as in living cells of budding yeast Saccharomyces cerevisiae.53 The authors observed a decrease in the average fluorescence lifetime as the concentration of Ficoll-70 and Ficoll-400 increased, which agrees with our 2P-fluorescence results in Ficoll-70. However, neither the energy transfer efficiency nor the donor–acceptor distance of crGE2.3 in those environments were reported by Lecinski and co-workers.53 Using 50-MHz pulsed excitation at 488 nm in a cuvette and 0–50 ns observation window, the authors have reported a triple exponential decay of crGE2.3 with an estimated average fluorescence lifetime of 5.36 ns in 10 mM NaPi buffer at pH 7.4 as compared with our biexponential 2P-fluorescence decays with an average lifetime of 2.58 ns in PBS (pH 7.4). Such disagreement could be attributed to the excitation wavelength (488 nm versus 900 nm), the different buffers (NaPi versus PBS), the time window (0–50 ns versus 0–24 ns), and the sample preparation (a cuvette versus a droplet) used in both studies. As a control, Lecinski et al.53 also used mGFP as compared with our mEGFP using the enzymatically cleaved GE2.3, where the fluorescence lifetime of mEGFP is known to be approximately 2.6 ns,46–49 in relative agreement with our estimated 2P-fluorescence lifetime of 2.75 ns in enzymatically cleaved GE2.3.
3.2. Different modalities of 2P laser excitations of GE2.3 for FRET analysis
Laser-scanning, 2P-fluorescence lifetime imaging microscopy (FLIM)54,55 is typically used for cellular and tissue studies to exploit the inherent spatio-temporal resolution of both the nonlinear excitation and the sensitivity of the excited state fluorescence lifetime of a given probe to the surrounding environment as well as protein–protein interactions. Towards that goal, we compared the above-mentioned findings using single-point (no laser scanning) time-resolved 2P-fluorescence with 2P-FLIM on GE2.3 in a solution droplet of either PBS buffer or Ficoll solutions. This is important since each modality (single point versus FLIM) has its own advantages and limitations.Fig. 5A shows a representative histogram of the frequency of FRET efficiency (eqn (4)) in each 2P-FLIM image (maximum binning of 10) of a droplet of GE2.3 in PBS (solid curve, panel A) and 300 g L−1 Ficoll solutions (dashed curve, panel A). The results show distinct histograms of 2P-fluorescence lifetime distributions for the FRET efficiency of GE2.3 in Ficoll-crowded as compared with a buffer at room temperature. Similar measurements were carried out as a function of Ficoll concentration and the mean values of FRET efficiency (eqn (4)) as well as the full-width-half-maximum (as a standard deviation) of each histogram (Fig. 5B). It is worth noting that both the single-point and 2P-FLIM measurements of the 2P-fluorescence lifetime of GE2.3 were deconvoluted (MLE fitting model) with the measured system response function (FWHM ∼45 ps), which was recorded under the same experimental conditions. Importantly, the FRET efficiency of both measurements was analyzed using the fast and slow decay time constants (eqn (4)), which rules out the refractive index effect among the FRETing (fast decay component) and non-FRETing (slow decay component) subpopulations. Our results show that both single-point and 2P-FLIM measurements of GE2.3 yield similar trends, where the FRET efficiency increases with the Ficoll concentration (Fig. 5B). However, the estimated values of the FRET efficiency of GE2.3 using single-point excitation (no laser scanning) yield a larger dynamic range (by a factor of ∼3.4) as compared with 2P-FLIM over the 0–300 g L−1 Ficoll concentration range (Fig. 5B).
 | ||
| Fig. 5 Comparative assessment of single-point and laser-scanning (FLIM) modalities of 2P-fluorescence lifetime measurements of GE2.3 in Ficoll crowded solutions. (A) 2P-laser scanning FLIM of GE2.3, in both PBS buffer (solid curve) and 300 g L−1 Ficoll solution (dashed curve), yield distinct histograms (i.e., normalized pixel frequency versus FRET efficiency), where the FRET efficiency was calculated using the fast and slow decay components of the observed biexponential fluorescence decay parameters per pixel (eqn (4)). (B) The estimated average FRET efficiency per 2P-FLIM image (solid gray spheres, curve 2) as compared with the corresponding single-point (solid black squares, curve 1) measurements of GE2.3 as a function of the Ficoll concentrations. Both single-point (4.2 MHz) and 2P-FLIM (76 MHz) measurements were carried out under 900 nm pulsed excitations and 520/60 nm detection wavelength window. The error bars on the 2P-FLIM results (curve 2) reflect the full-width-half maximum of the observed histogram per lifetime image of GE2.3 droplet. The dashed lines shown here (panel B) is for eye guidance only with no theoretical significance. | ||
The observed difference in Fig. 5B can be attributed to the following inherent differences between single-point (no laser scanning measurements) and laser-scanning FLIM. Single-point 2P-fluorescence lifetime measurements, which lack the spatial resolution of 2P-FLIM, have high temporal resolution (e.g., 1024–time bins per decay, 24.4 ps per time bin in each decay) and are carried out at a low repetition rate (e.g., 4.2 MHz and 238 ns between pulses) such that the excited molecules have enough time to fully relax to the ground electronic state. In contrast, 2P-FLIM provides the spatial resolution needed for cellular mapping, but usually suffers from low signal-to-noise level fluorescence decays per pixel and is usually done at a high repetition rate (e.g., 76 MHz and 13.2 ns between pulses) to minimize laser exposure time and reduce the data acquisition time during our 2P-FLIM (e.g., 256 × 256 pixels and 256 time bins per decay per pixel) measurements. For the same reasons, the time bins per pixel is also lower (48.8 ps per time bin in each recorded fluorescence decay per pixel). Importantly, while we used magic-angle detection here for both our single-point and FLIM measurements for significant comparison, many published FLIM studies do not report the use of magic-angle detection. Such omission is a means to enhance the fluorescence detection efficiency by ruling out the loss of photons introduced by the Glan–Thompson polarizer for magic-angle detection. Finally, high binning may be used in FLIM data analysis to enhance the signal-to-noise ratio per decay, which inherently reduces the spatial resolution.
Taken together, the modality of the 2P-fluorescence lifetime measurements of GE2.3 has a negligible effect on the observed trends of the FRET efficiency as a function of crowding using single-point and FLIM measurements, although the absolute values (or excitation-mode dependent sensitivity) may differ. It is also conceivable that the difference between single-point and FLIM may be attributed to the low FRET efficiency of the GE2.3 sensor.
3.3. Time-resolved 2P-Fluorescence depolarization of GE2.3 due to rotational dynamics alone
Fluorescence depolarization of donor-linker-acceptor constructs, due to the rotational dynamics alone, can also be probed under the excitation (900 nm) and detection (520/60 nm) of the donor's emission in the presence and absence of the acceptor. These measurements allow us to elucidate the role of segmental mobility and molecular weight on the rotational time of this construct (non-spherical with a flexible linker and in a crowded, heterogeneous viscosity) and whether the rotational diffusion coefficient still obeys the Stokes–Einstein model for a spherical molecule in a heterogenous viscosity (i.e., Ficoll-crowded solutions).56–60Fig. 6 shows representative time-resolved anisotropy decays of the donor in the presence of the acceptor in GE2.3 as a function of the Ficoll concentration (0–300 g L−1). Under the excitation (900 nm) and detection (520/60 nm) of the donor (mEGFP) in intact GE2.3 (PBS, pH 7.4), the time-resolved anisotropy can be described satisfactorily as a single-exponential decay. In addition, the initial anisotropy (∼0.47) is smaller than the theoretical value (r0 = 0.57) for 2P-excitation,43 which is usually attributed to faster non-radiative processes beyond our temporal resolution. The overall rotational time of the intact GE2.3 is relatively slower than the cleaved counterpart due to the difference in the molecular weight and perhaps the flexible linker region (i.e., potential segmental mobility). For example, the measured rotational time constants of cleaved (∼32 kDa) and intact (63.5 kDa) GE2.3 in PBS at room temperature are 14.9 ns and 16.8 ns, respectively. Under the same experimental condition, the 2P-anisotropy of rhodamine-110 (in water) decays as a single exponential with a rotational time of 159 ps and an initial anisotropy of 0.37. Using the Stokes–Einstein model, we estimate a hydrodynamic volume of 64 ± 5 nm3 and 75 ± 5 nm3 for cleaved and intact GE2.3 sensor in PBS buffer at room temperature (295 K). Although the signal to noise ratio in these time-resolved anisotropy decays is relatively high, these rotational time constants are longer than the corresponding excited state lifetimes (2.75 ns and 2.58 ns, respectively) and therefore these hydrodynamic volumes should be considered as a lower-limit approximation. Using the Perrin equation (eqn (7)), we also calculated an approximate hydrodynamic volume of cleaved (50.4 nm3) and intact (100.0 nm3) GE2.3 based on their molecular weights.
 | ||
| Fig. 6 Time-resolved 2P-fluorescence depolarization (anisotropy) of intact GE2.3 due to rotational dynamics alone (no FRET). Exciting (900-nm) and detecting (520/60 nm) the 2P-fluorescence depolarization of the donor (mEGFP) in intact GE2.3, the time-resolved 2P-anisotropy decays as a single exponential with an overall rotational time that increases as the concentration of Ficoll increases (vertical arrow) due to enhanced bulk viscosity. These measurements were used to test the validity of Stokes–Einstein model in describing the rotational dynamics of GE2.3 in crowded Ficoll solutions (Fig. 7). Under the same experimental conditions, the G-factor of our experimental setup was measured (G = 1.559) using the time resolved anisotropy of Rh110 and tail-matching approach.40,73,74 | ||
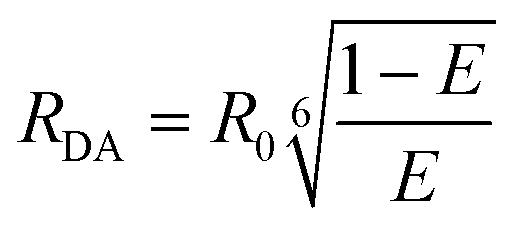
As the Ficoll concentration (i.e., heterogeneous viscosity) increases, the overall rotational time of intact GE2.3 also increases due to the enhanced bulk viscosity (Fig. 6). Using these results, we also plotted the rotational diffusion coefficient (D = 1/6φ) ratio (Db/Dc) of GE2.3 in a buffer (Db) with respect to rotational diffusion in Ficoll crowded solutions (Dc) as a function of the bulk viscosity ratio (ηc/ηb) of the crowded solution (ηc) to buffer (ηb) at room temperature (Fig. 7). The objective here is to see whether the rotational diffusion on the nanosecond time scale of this flexible construct follows the Stokes–Einstein model in polymer-crowded, heterogeneous solutions. Our results indicate that the relative rotational diffusion of GE2.3 in a Ficoll-crowded, heterogeneous bulk viscosity solution deviates from the Stokes–Einstein model predictions (dashed straight line in Fig. 7). Similar trends have been reported previously using NMR58,61–64 and fluorescence correlation spectroscopy65 studies of different proteins and crowded environments. The observed deviation of GE2.3 rotational dynamics on this time scale could be attributed to confinement in crowded spaces, steric hinderance, and/or possible weak interactions with the crowding agent (Ficoll-70 is a neutral polymer). Potential entanglement of the Ficoll polymer with the linker region of GE2.3 could also cause retardation of the rotational mobility of the sensor. However, this is not supported by our studies of Ficoll-70 effects on the FRET efficiency using the same time-resolved fluorescence depolarization when exciting the donor and detecting mostly the acceptor's emission (see below).
 | ||
| Fig. 7 The rotational dynamics of intact GE2.3 deviates from the Stokes–Einstein model in Ficoll-crowded solutions. Exciting (900-nm) and detecting (520/60 nm) the 2P-fluorescence depolarization of the donor (mEGFP) in intact GE2.3, the measured rotational time (φ) of GE2.3 in different Ficoll solutions was used to calculate the corresponding rotational diffusion coefficient (D = 1/6φ). The rotational diffusion coefficient ratio (Db/Dc) versus the viscosity ratio (ηc/ηb) of Ficoll solutions deviates from the Stokes–Einstein model prediction (dashed line). The dashed straight line is the projected trend according to the Stokes–Einstein model. | ||
Complementary time-resolved 2P-anisotropy measurements on GE2.3 were carried out under 900-nm excitation of the donor and polarization analysis of 520/60 nm emission of the donor as a function of glycerol (0–300 g L−1), a homogenous bulk viscosity in contrast with the heterogeneous Ficoll solutions. A single-exponential fitting model was satisfactory for describing the observed 2P anisotropy decays of both cleaved and intact GE2.3, where the corresponding rotational time increases as the glycerol concentration increased (data not shown) as expected according to the Stokes–Einstein model.
3.4. Time-resolved 2P-fluorescence depolarization of GE2.3 due to both FRET and rotational dynamics
Recently, we have developed an experimental approach for investigating the wavelength-dependent time-resolved one-photon (1P) fluorescence depolarization of hetero-FRET (donor-linker-acceptor) constructs.23,26,28 In this approach, we used pulsed laser 1P-excitation of the donor and the time-resolved fluorescence polarizations (parallel and perpendicular with respect to the laser polarization) of mostly the acceptor's emission (with some overlap with the donor's emission) of these constructs detected simultaneously. The observed biexponential time-resolved depolarization (anisotropy) of the intact sensor was attributed to the presence of both FRET from the donor to the acceptor as well as the rotational dynamics.23,26,28 Here we examined the time-resolved 2P-fluorescence depolarization of GE2.3 due to FRET and rotational diffusion (eqn 8) as a function of Ficoll-70 concentration. In these experiments, the donor was excited at 900 nm and the time-resolved 2P-fluorescence polarization of mostly the acceptor (555–690 nm) was analyzed and used to calculate the corresponding anisotropy decays for FRET analysis (eqn (8) and (9)) using the estimated energy transfer rate (kET).Fig. 8 shows representative time-resolved 2P-fluorescence (555–690 nm) depolarization of GE2.3 (PBS, pH 7.4) excited in the presence (curve 2) and absence (curve 1) of the acceptor. In these measurements, the parallel and perpendicular polarizations were separated at right angles using a polarizing beam splitter and detected simultaneously to rule out the effects of potential laser intensity fluctuations during data acquisition. The time-resolved 2P-anisotropy of the cleaved counterpart (i.e., the donor alone) decays as a single exponential with a rotational time of φ = 12.05 ± 0.26 ns (r0 = 0.44 ± 0.005) due to the rotational dynamics alone (i.e., no FRET). In contrast, the observed 2P-anisotropy of the intact GE2.3 (PBS, pH 7.4) decays as a biexponential (β1 = 0.076 ± 0.009, φ1 = 0.89 ± 0.21 ns, β2 = 0.328 ± 0.007, φ2 = 9.25 ± 0.21 ns) in the presence of FRET. The fast decay component of the time-resolved anisotropy of the intact GE2.3 was used to calculate the energy transfer rate (1.02 ns−1) and efficiency (14%, eqn (8) and (9)) as well as the donor–acceptor distance in a buffer at room temperature as described above.
 | ||
| Fig. 8 The time-resolved 2P-fluorescence depolarization (anisotropy) of GE2.3 (PBS buffer) is sensitive to the presence of the acceptor. Exciting the donor (900-nm), the time-resolved 2P-fluorescence of mostly the acceptor (555–690 nm) was analyzed as parallel and perpendicular polarizations and used to calculate the corresponding anisotropy decays. The observed 2P-anisotropy of the intact GE2.3 decays as a biexponential (curve 2) due to FRET as a compared with a single-exponential decay for the cleaved counterpart (curve 1) due to rotational dynamics alone (no FRET). In these measurements, the parallel and perpendicular polarizations were separated at right angles using a polarizing beam splitter and detected simultaneously to rule out potential laser intensity fluctuations. Under the same experimental conditions, the G-factor of our experimental setup was measured (G = 1.594) using the time resolved anisotropy of RhB and tail-matching approach.40,73,74 | ||
The observed difference between the rotational time of cleaved (single exponential, 12.05 ns) and intact (the slow component, 9.25 ns, of a biexponential decay) seems counterintuitive. However, it is worth remembering that the estimated rotational time constants for cleaved and intact GE2.3 are relatively larger than the excited state fluorescence lifetime, during which the rotational dynamics is monitored (i.e., larger uncertainty).40 In addition, the relatively small amplitude of the second, slow rotational time constant of the intact GE2.3 might yield a larger uncertainty as well. The observed time-resolved fluorescence depolarization due to both the rotational dynamics and FRET is likely to contribute to the apparent short rotational time of the intact GE2.3 sensor as compared with the cleaved counterpart. It might be conceivable that the observed fluorescence depolarization in the presence of FRET under our experimental design (exciting the donor and detecting mostly the acceptor's polarization-analyzed emission) could encompass a contribution of segmental mobility due to the flexible linker region. Similar observation has been reported previously on homo-FRET studies of GFP dimers.66
We also examined the effects of crowding (i.e., Ficoll concentration) on the time-resolved 2P-fluorescence depolarization (anisotropy) of intact GE2.3 (Fig. 9A) under the same experimental conditions of excitation (900 nm) and polarization detection wavelengths (555–690 nm) as in Fig. 8. The time constant of the fast component in the observed anisotropy decay of the intact GE2.3 remains unchanged as the Ficoll concentration increases, though the population-normalized fast component amplitude increases, resulting in increasing FRET efficiency in crowded environments (Fig. 9A). The time constant of the slow component of the anisotropy decays of GE2.3, however, increases slightly due to the enhanced overall rotational time as the bulk viscosity of the crowded environment increases. As the Ficoll concentration increases, the estimated FRET efficiency also increases (Fig. 9B) using these Ficoll-dependent anisotropy decays, which is a similar trend to that observed using the time-resolved 2P-fluorescence of the donor in the presence of the acceptor under magic-angle detection (Fig. 3). Using time-resolved 2P-depolarization measurements, the estimated dynamic range of FRET efficiency response Ficoll crowding (0–300 g L−1; Fig. 9B) was slightly smaller (7.9%) using time-resolved fluorescence depolarization (anisotropy) than our estimated value (10.3 ± 2.1%) using refractive index corrected 2P-fluorescence lifetime measurements (Fig. 3, curve 1).
 | ||
| Fig. 9 The time-resolved 2P-fluorescence depolarization (anisotropy) of intact GE2.3 is sensitive to the concentrations of Ficoll-70 (heterogeneous viscosity) and glycerol (homogeneous viscosity). Exciting the donor (900-nm), the time-resolved 2P-fluorescence of mostly the acceptor (555–690 nm) was analyzed as parallel and perpendicular polarizations and used to calculate the corresponding anisotropy decays as function of the environment. (A) As the Ficoll concentration increases, the time constant of the fast decay component decreases (downward arrow) due to FRET, while the time constant of the slow decay component increases (upward arrow) due to overall rotation in crowded environment (bulk viscosity). (B) The estimated FRET efficiency (%) (solid squares) of GE2.3 using the observed biexponential anisotropy decays (eqn (9)) as a function of Ficoll concentration. (C) As the homogeneous viscosity (glycerol concentration) increases, however, both the time constants of both the fast and slow anisotropy decay components increases in contrast with Ficoll-crowding (A). (D) The estimated FRET efficiency (%) (solid spheres) of GE2.3 using the observed biexponential anisotropy decays (eqn (9)) as a function of glycerol concentration. | ||
Complementary time-resolved 2P-anisotropy measurements on GE2.3 were carried out under 900-nm excitation and 555–690 nm fluorescence polarizations detection as a function of glycerol (0–300 g L−1, Fig. 9C) for homogeneous versus heterogeneous (Ficoll-70, Fig. 9A) viscosity assessment. A biexponential fitting model was satisfactory for describing the observed 2P anisotropy decays of the intact GE2.3, where both the fast and slow decay components were sensitive to glycerol concentrations. As the glycerol concentration increased, the corresponding rotational times of GE2.3 increased, but the corresponding energy transfer efficiency slightly decreases (Fig. 9D), which contrasts the observed trend associated with the crowding effect in Ficoll solutions.
3.5. Chemical equilibria analysis of GE2.3 conformations in crowded environment
The observed biexponential of the 2P-fluorescence anisotropy decays of the intact GE2.3 was attributed to the presence of two subpopulations of collapsed (FRETing, enhanced depolarization) and stretched (non-FRETing, negligible depolarization) conformations at equilibrium. We hypothesize that both collapsed and stretched conformations of GE2.3 coexist at equilibrium such that:Stretched (S) ![[left over right harpoons]](https://www.rsc.org/images/entities/char_21cb.gif) Collapsed (C) Collapsed (C) |
and we hypothesize that increasing macromolecular crowding will increase the thermodynamic favorability of the collapsed conformation. The amplitude fractions of the fast and slow decay components of the 2P-anisotropy decays of GE2.3 in Ficoll solutions were used to investigate the thermodynamics equilibrium between collapsed and stretched conformations (Fig. 1A) of this sensor in response to crowding. When exciting the donor and detecting mostly the 2P-fluorescence depolarization of the acceptor, the proposed stretched conformation of GE2.3 due to ensemble thermal fluctuation excludes copies of the sensor where the acceptor is in a dark (non-fluorescent) electronic state or immature FRET pairs (see above). The excited-state 2P-fluorescence lifetime is fast (nanoseconds) as compared with the known blinking time constant (μs-ms) of intrinsically fluorescent proteins observed using single-molecule studies.67–69 We used the normalized amplitude fractions, fi = βi/(β1 + β2), of the fast (i = 1) and slow (i = 2) anisotropy decays of intact GE2.3 to calculated the corresponding equilibrium constant (eqn (11)) and the Gibbs free energy changes (eqn (12), 295 K) as follows:28
 | (11) |
ΔG° = RT![[thin space (1/6-em)]](https://www.rsc.org/images/entities/char_2009.gif) ln(K) ln(K) | (12) |
To elucidate the crowding effect, we also calculate the Ficoll-dependent change of ΔG° with respect to that of the PBS buffer (ΔΔG°) such that:
| ΔΔG° = ΔG°(Ficoll) − ΔG°(PBS) | (13) |
Fig. 10 shows ΔΔG° as a function of the Ficoll concentration (0-300 g L−1). Our results indicate that as the crowding (i.e., Ficoll-70 concentration) increasing, the ΔΔG°-value decreases to reach −1.4 kJ mol−1 at 300 g L−1 Ficoll concentration. Although the observed interaction energy changes are relatively small for a single protein, it can be quantified using time-resolved 2P-fluorescence depolarization. Importantly, such interaction energy changes of GE2.3 in crowded Ficoll solutions are significantly different from that in the homogeneous buffer. These results are in general agreement with recent studies by Groen et al. on another crowding sensor (namely, mseCFP-linker-cp173mVenus) using a different approach.70 The negative ΔΔG°-values suggest spontaneous conformational change to the favorable collapsed form of GE2.3 in a crowded environment (Fig. 10). These approximate calculations suggest that the thermodynamic equilibrium analyses support the stated working hypothesis and the notion that the energy transfer efficiency (i.e., sensitivity) of GE2.3 is higher in a crowded environment. The results also agree with previous analysis of the thermodynamics equilibrium of another crowding sensor, namely mCerulean3-linker-mCitrine (G12) using time-resolved 1P-fluorescence measurements.71 Similar thermodynamic analysis can be carried out using the amplitude fractions of fast and slow decay components of donor-linker-acceptor constructs in response to environmental crowding or ionic strength.71
 | ||
| Fig. 10 Crowding effect on the Gibbs free energy changes of GE2.3 conformational equilibrium. Using the observed biexponential anisotropy decays of the intact GE2.3 in each Ficoll solution (Fig. 9), we estimated the corresponding equilibrium constant (eqn (11)) and the Gibbs free energy change (ΔΔG°, eqn (13)) for stretched-to-collapsed conformational equilibrium. As the Ficoll concentration increases (0 – 300 g L−1), the ΔΔG° value decreased in the and the negative values suggest that crowding facilitate the spontaneous conformational changes of GE2.3. The dashed line shown here is for eye guidance only with no theoretical significance. | ||
4. Conclusions
Towards the development of a rational design for donor-linker-acceptor constructs, we examined different structural aspects (linker amino acid sequence and donor–acceptor FRET pair) of environmental sensors and their influence on environmental sensitivity. The construct studied here, mEGFP-linker-mScarlet-I (GE2.3), is a newly developed macromolecular crowding sensor, where the donor (mEGFP) has a peak absorption around 488 nm, which is compatible with the capabilities of most research laboratories. GE2.3 also has an enhanced spectral overlap between the mEGFP-mScarlet-I FRET pair compared with previous environmental sensors. Importantly, both the absorption and emission of mEGFP in GE2.3 are distinct from the autofluorescence in cells or tissues due to NAD(P)H and flavins.In addition, the FRET efficiency (i.e., the sensitivity) of GE2.3 increases as the concentration of Ficoll-70 increases (0–300 g L−1). Our results are also in general agreement with Lecinski et al. qualitatively on the same sensor (crGE2.3) in Ficoll-crowded NaPi buffer.53 We also demonstrated that the outcome of these studies seems independent of the 2P-excitation mode of GE2.3 (i.e., single-point versus laser scanning FLIM mode). Such control experiments are rather important since 2P-FLIM is compatible with future 2P-FLIM studies in cultured living cells or even thick tissues as a better model for in vivo studies for mapping the correlation between macromolecular crowding and diseased conditions.
Our complementary wavelength-dependent, time-resolved 2P-fluorescence depolarization anisotropy of cleaved and intact GE2.3 enabled us to examine (1) the experimental design for FRET analysis, (2) the role of rotational dynamics and FRET on the depolarization mechanisms, and (3) the linker flexibility effects on the rotational dynamics within the context of the Stokes–Einstein model as compared with theoretical predictions based on molecular weight. Supported by the traditional time-resolved 2P-fluorescence, these time-resolved 2P-depolarization anisotropy measurements offer a new experimental approach for FRET and protein–protein interactions studies. In addition, the fitting parameters of the observed 2P-fluorescence anisotropy of intact GE2.3 were used to determine the equilibrium constant (K) and the Gibbs free energy changes (ΔΔG°) associated with the structural conformations in response to environmental crowding.
Our results on the GE2.3 crowding sensor represent another aspect of donor-linker-acceptor protein engineering design, where we compare a different FRET pair (i.e., mEGFP-mScarlet-I) in GE2.3 with previous mCerulean3-linker-mCitrine constructs.23,29 These results also complement another crowding sensor (namely, mNeonGreen-linker-mScarlet-I, or CRONOS), which has recently been designed by Miyagi et al. with mNeonGreen as a donor.72 It was demonstrated that the CRONOS sensor was also sensitive to Ficoll-70 crowding and with negligible sensitivity to homogeneous viscosity in D-glucose or PEG300 using ratiometric FRET from fluorometry.72
Our previous studies on other families of crowding sensors (e.g., G12, G18, E6G2, and GE) indicate that a short and flexible linker region enhances the sensitivity (i.e., the FRET efficiency) to macromolecular crowding.24,26 Accordingly, we would suggest combining the advantages of the shorter linker –(GSG)12– or –(GSG)18– as in G12 or G18 sensors, respectively, with the desirable spectroscopic properties of mEGFP-Scarlet-I FRET pair in GE2.3 towards a more versatile crowding sensor design. For significant comparison, we are currently investigating the FRET efficiency and translational diffusion of GE2.3 at the single molecule level using fluorescence correlation spectroscopy to complement these ensemble, ultrafast studies outlined in this report. Additionally, these results in well-defined environments will inform our future in vivo studies of genetically encoded GE2.3 towards the mapping of crowded intracellular environments under different physiological conditions.
Author contributions
A. A. H., E. D. S., and A. J. B. designed the experiments and supervised this project. A. J. B., sensor design and synthesis. E. D. S. helped in isolating and purifying GE2.3 sensor from the DNA. S. A. M. and S. B. prepared the samples, data acquisition, and data analysis with the help of A. A. H. The original draft of the manuscript was written by S. A. M., where A. A. H., A. J. B., E. D. S. and S. A. M. edited the manuscript to its final form. A. A. H. and S. A. M prepared the final figures.Conflicts of interest
The authors have no conflict of interest to disclose.Acknowledgements
We would like to acknowledge Clint McCue, Dan Bamigbade, and Austin Yang for their assistance in data collection. S. M. is grateful for the support provided by teaching assistantships from the Department of Chemistry & Biochemistry, University of Minnesota Duluth. S. B. acknowledges the support of the University of Minnesota SURP and UROP programs. A. A. H. and E. D. S. also acknowledge the Grant-in-Aid of Research, Artistry, and Scholarship program (GIA) award provided by the University of Minnesota.References
- H.-X. Zhou, G. Rivas and A. P. Minton, Macromolecular Crowding and Confinement: Biochemical, Biophysical, and Potential Physiological Consequences, Annu. Rev. Biophys., 2008, 37(1), 375 CrossRef CAS PubMed.
- G. Rivas and A. P. Minton, Macromolecular Crowding In Vitro, In Vivo, and In Between, Trends Biochem. Sci., 2016, 41(11), 970 CrossRef CAS PubMed.
- T. J. Mitchison, Colloid osmotic parameterization and measurement of subcellular crowding, Mol. Biol. Cell, 2019, 30(2), 173 CrossRef CAS PubMed.
- A. Pastore and P. A. Temussi, Crowding revisited: Open questions and future perspectives, Trends Biochem. Sci., 2022, 47(12), 1048 CrossRef CAS PubMed.
- S. B. Zimmerman and S. O. Trach, Estimation of macromolecule concentrations and excluded volume effects for the cytoplasm of Escherichia coli, J. Mol. Biol., 1991, 222(3), 599–620 CrossRef CAS PubMed.
- A. P. Minton, The Influence of Macromolecular Crowding and Macromolecular Confinement on Biochemical Reactions in Physiological Media, J. Biol. Chem., 2001, 276(14), 10577 CrossRef CAS PubMed.
- D. Hall and A. P. Minton, Macromolecular crowding: qualitative and semiquantitative successes, quantitative challenges, Biochim. Biophys. Acta, Proteins Proteomics, 2003, 1649(2), 127 CrossRef CAS PubMed.
- A. Mourão Márcio, B. Hakim Joe and S. Schnell, Connecting the Dots: The Effects of Macromolecular Crowding on Cell Physiology, Biophys. J., 2014, 107(12), 2761 CrossRef PubMed.
- R. J. Ellis, Macromolecular crowding: obvious but underappreciated, Trends Biochem. Sci., 2001, 26(10), 597–604 CrossRef CAS PubMed.
- A. J. Boersma, I. S. Zuhorn and B. Poolman, A sensor for quantification of macromolecular crowding in living cells, Nat. Methods, 2015, 12(3), 227 CrossRef CAS PubMed.
- B. Liu, C. Åberg, F. J. Van Eerden, S. J. Marrink, B. Poolman and A. J. Boersma, Design and Properties of Genetically Encoded Probes for Sensing Macromolecular Crowding, Biophys. J., 2017, 112(9), 1929 CrossRef CAS PubMed.
- B. Liu, S. N. Mavrova, J. van den Berg, S. K. Kristensen, L. Mantovanelli and L. M. Veenhoff, et al., Influence of Fluorescent Protein Maturation on FRET Measurements in Living Cells, ACS Sensors, 2018, 3(9), 1735 CrossRef CAS PubMed.
- B. Liu, B. Poolman and A. J. Boersma, Ionic Strength Sensing in Living Cells, ACS Chem. Biol., 2017, 12(10), 2510 CrossRef CAS PubMed.
- S. N. Mouton, D. J. Thaller, M. M. Crane, I. L. Rempel, O. T. Terpstra and A. Steen, et al., A physicochemical perspective of aging from single-cell analysis of pH, macromolecular and organellar crowding in yeast, eLife, 2020, 9, e54707 CrossRef CAS PubMed.
- P. J. Cranfill, B. R. Sell, M. A. Baird, J. R. Allen, Z. Lavagnino and H. M. de Gruiter, et al., Quantitative assessment of fluorescent proteins, Nat. Methods, 2016, 13(7), 557 CrossRef CAS PubMed.
- J. Goedhart, D. von Stetten, M. Noirclerc-Savoye, M. Lelimousin, L. Joosen and M. A. Hink, et al., Structure-guided evolution of cyan fluorescent proteins towards a quantum yield of 93%, Nat. Commun., 2012, 3(1), 751 CrossRef PubMed.
- M. L. Markwardt, G.-J. Kremers, C. A. Kraft, K. Ray, P. J. C. Cranfill and K. A. Wilson, et al., An Improved Cerulean Fluorescent Protein with Enhanced Brightness and Reduced Reversible Photoswitching, PLoS One, 2011, 6(3), e17896 CrossRef CAS PubMed.
- M. A. Rizzo, G. Springer, K. Segawa, W. R. Zipfel and D. W. Piston, Optimization of Pairings and Detection Conditions for Measurement of FRET between Cyan and Yellow Fluorescent Proteins, Microsc. Microanal., 2006, 12(3), 238 CrossRef CAS PubMed.
- E. Balleza, J. M. Kim and P. Cluzel, Systematic characterization of maturation time of fluorescent proteins in living cells, Nat. Methods, 2018, 15(1), 47–51 CrossRef CAS PubMed.
- M. Mastop, D. S. Bindels, N. C. Shaner, M. Postma, T. W. J. Gadella and J. Goedhart, Characterization of a spectrally diverse set of fluorescent proteins as FRET acceptors for mTurquoise2, Sci. Rep., 2017, 7(1), 11999 CrossRef PubMed.
- R. Leben, R. L. Lindquist, A. E. Hauser, R. Niesner and A. Rakhymzhan, Two-Photon Excitation Spectra of Various Fluorescent Proteins within a Broad Excitation Range, Int. J. Mol. Sci., 2022, 23(21), 13407 CrossRef CAS PubMed.
- M. Drobizhev, N. S. Makarov, S. E. Tillo, T. E. Hughes and A. Rebane, Two-photon absorption properties of fluorescent proteins, Nat. Methods, 2011, 8(5), 393 CrossRef CAS PubMed.
- M. Currie, H. Leopold, J. Schwarz, A. J. Boersma, E. D. Sheets and A. A. Heikal, Fluorescence Dynamics of a FRET Probe Designed for Crowding Studies, J. Phys. Chem. B, 2017, 121(23), 5688 CrossRef CAS PubMed.
- J. Schwarz, H. Leopold, R. Leighton, R. C. Miller, C. P. Aplin and A. J. Boersma, et al., Macromolecular crowding effects on energy transfer efficiency and donor-acceptor distance of hetero-FRET sensors using time-resolved fluorescence, Methods Appl. Fluoresc., 2019, 7(2), 025002 CrossRef CAS PubMed.
- S. Mersch, M. Brink, R. Simonet, A. Boersma, E. Sheets and A. Heikal, Integrated laser-induced fluorescence spectroscopy of donor-linker-acceptor constructs for bioenvironmental sensing, Proc. SPIE, 2022, 12228 Search PubMed.
- H. J. Leopold, R. Leighton, J. Schwarz, A. J. Boersma, E. D. Sheets and A. A. Heikal, Crowding Effects on Energy-Transfer Efficiencies of Hetero-FRET Probes As Measured Using Time-Resolved Fluorescence Anisotropy, J. Phys. Chem. B, 2019, 123(2), 379 CrossRef CAS PubMed.
- T. M. Kay, C. P. Aplin, R. Simonet, J. Beenken, R. C. Miller and C. Libal, et al., Molecular Brightness Approach for FRET Analysis of Donor-Linker-Acceptor Constructs at the Single Molecule Level: A Concept, Front. Mol. Biosci., 2021, 8 Search PubMed.
- C. P. Aplin, R. C. Miller, T. M. Kay, A. A. Heikal, A. J. Boersma and E. D. Sheets, Fluorescence depolarization dynamics of ionic strength sensors using time-resolved anisotropy, Biophys. J., 2021, 120(8), 1417 CrossRef CAS PubMed.
- R. C. Miller, C. P. Aplin, T. M. Kay, R. Leighton, C. Libal and R. Simonet, et al., FRET Analysis of Ionic Strength Sensors in the Hofmeister Series of Salt Solutions Using Fluorescence Lifetime Measurements. The, J. Phys. Chem. B, 2020, 124(17), 3447 CrossRef CAS PubMed.
- C. Aplin, T. Kay, R. Miller, A. Boersma, E. Sheets and A. Heikal, Integrated fluorescence approach for FRET analysis of environmental sensors, Proc. SPIE, 2019, 11122, 111220E Search PubMed.
- P. M. Schaefer, S. Kalinina, A. Rueck, C. A. F. von Arnim and B. von Einem, NADH Autofluorescence— A Marker on its Way to Boost Bioenergetic Research, Cytometry, Part A, 2019, 95(1), 34–46 CrossRef PubMed.
- H. Ranawat, S. Pal and N. Mazumder, Recent trends in two-photon auto-fluorescence lifetime imaging (2P-FLIM) and its biomedical applications, Biomed. Eng. Lett., 2019, 9(3), 293–310 CrossRef PubMed.
- A. T. Q. Cong, R. M. L. Pimenta, J. Holy and A. A. Heikal, Associated anisotropy of intrinsic NAD(P)H for monitoring changes in the metabolic activities of breast cancer cells (4T1) in three-dimensional collagen matrix, Phys. Chem. Chem. Phys., 2021, 23(22), 12692 RSC.
- A. Cong, R. M. L. Pimenta, H. B. Lee, V. Mereddy, J. Holy and A. A. Heikal, Two-photon fluorescence lifetime imaging of intrinsic NADH in three-dimensional tumor models, Cytometry, Part A, 2019, 95(1), 80–92 CrossRef CAS PubMed.
- A. A. Heikal, A multiparametric imaging of cellular coenzymes for monitoring metabolic and mitochondrial activities, Reviews in Fluorescence 2010, Springer, 2011, pp. 223–43 Search PubMed.
- Q. Yu and A. A. Heikal, Two-photon autofluorescence dynamics imaging reveals sensitivity of intracellular NADH concentration and conformation to cell physiology at the single-cell level, J. Photochem. Photobiol., B, 2009, 95(1), 46–57 CrossRef CAS PubMed.
- A. A. Heikal, Intracellular coenzymes as natural biomarkers for metabolic activities and mitochondrial anomalies, Biomarkers Med., 2010, 4(2), 241 CrossRef CAS PubMed.
- J. J. Fisz, Another Look at Magic-Angle-Detected Fluorescence and Emission Anisotropy Decays in Fluorescence Microscopy, J. Phys. Chem. A, 2007, 111(50), 12867 CrossRef CAS PubMed.
- S. Strickler and R. A. Berg, Relationship between absorption intensity and fluorescence lifetime of molecules, J. Chem. Phys., 1962, 37(4), 814 CrossRef CAS.
- J. R. Lakowicz, in Instrumentation for Fluorescence Spectroscopy, Principles of Fluorescence Spectroscopy, ed. Lakowicz J. R., Springer US, Boston, MA, 2006 Search PubMed.
- W. Becker, The bhTCSPC Handbook, 9th edn, 2021 Search PubMed.
- H. P. Erickson, Size and Shape of Protein Molecules at the Nanometer Level Determined by Sedimentation, Gel Filtration, and Electron Microscopy, Biol. Proced. Online, 2009, 11(1), 32 CrossRef CAS PubMed.
- P. Allcock and D. L. Andrews, Two-photon fluorescence: Resonance energy transfer, J. Chem. Phys., 1998, 108(8), 3089 CrossRef CAS.
- R. M. Clegg, Chapter 1 Förster resonance energy transfer—FRET what is it, why do it, and how it's done. Laboratory Techniques in Biochemistry and Molecular Biology, Elsevier, 2009. pp. 1–57 Search PubMed.
- T. J. Lambert, FPbase: a community-editable fluorescent protein database, Nat. Methods, 2019, 16(4), 277 CrossRef CAS PubMed.
- H. Murakoshi, A. C. Shibata, Y. Nakahata and J. Nabekura, A dark green fluorescent protein as an acceptor for measurement of Förster resonance energy transfer, Sci. Rep., 2015, 5(1), 1–11 Search PubMed.
- H. Murakoshi, S.-J. Lee and R. Yasuda, Highly sensitive and quantitative FRET–FLIM imaging in single dendritic spines using improved non-radiative YFP, Brain Cell Biol., 2008, 36(1), 31–42 CrossRef PubMed.
- T. Laviv, B. B. Kim, J. Chu, A. J. Lam, M. Z. Lin and R. Yasuda, Simultaneous dual-color fluorescence lifetime imaging with novel red-shifted fluorescent proteins, Nat. Methods, 2016, 13(12), 989 CrossRef CAS PubMed.
- R. Yasuda, C. D. Harvey, H. Zhong, A. Sobczyk, L. van Aelst and K. Svoboda, Supersensitive Ras activation in dendrites and spines revealed by two-photon fluorescence lifetime imaging, Nat. Neurosci., 2006, 9(2), 283 CrossRef CAS PubMed.
- A. Zeug, A. Woehler and E. Neher, Evgeni. Quantitative Intensity-Based FRET Approaches—A Comparative Snapshot, Biophys. J., 2012, 103(9), 1821 CrossRef CAS PubMed.
- D. W. Piston and G.-J. Kremers, Fluorescent protein FRET: the good, the bad and the ugly, Trends Biochem. Sci., 2007, 32(9), 407 CrossRef CAS PubMed.
- W. Becker, Fluorescence lifetime imaging – techniques and applications, J. Microscopy, 2012, 247(2), 119 CrossRef CAS PubMed.
- S. Lecinski, J. W. Shepherd, K. Bunting, L. Dresser, S. D. Quinn and C. MacDonald, et al., Correlating viscosity and molecular crowding with fluorescent nanobeads and molecular probes: in vitro and in vivo, Interface Focus, 2022, 12(6), 20220042 CrossRef PubMed.
- R. Datta, T. Heaster, J. Sharik, A. Gillette and M. Skala, Fluorescence lifetime imaging microscopy: fundamentals and advances in instrumentation, analysis, and applications, J. Biomed. Opt., 2020, 25(7), 071203 CAS.
- X. Liu, D. Lin, W. Becker, J. Niu, B. Yu and L. Liu, et al., Fast fluorescence lifetime imaging techniques: A review on challenge and development, J. Innovative Opt. Health Sci., 2019, 12(05), 1930003 CrossRef CAS.
- D. Lavalette, M. A. Hink, M. Tourbez, C. Tétreau and A. J. Visser, Proteins as micro viscosimeters: Brownian motion revisited, Eur. Biophys. J., 2006, 35(6), 517 CrossRef CAS PubMed.
- S. Zorrilla, M. A. Hink, A. J. Visser and M. P. Lillo, Translational and rotational motions of proteins in a protein crowded environment, Biophys. Chem., 2007, 125(2–3), 298–305 CrossRef CAS PubMed.
- Y. Wang, C. Li and G. J. Pielak, Effects of Proteins on Protein Diffusion, J. Am. Chem. Soc., 2010, 132(27), 9392 CrossRef CAS PubMed.
- C. Li and G. J. Pielak, Using NMR to Distinguish Viscosity Effects from Nonspecific Protein Binding under Crowded Conditions, J. Am. Chem. Soc., 2009, 131(4), 1368 CrossRef CAS PubMed.
- R. Holyst, A. Bielejewska, J. Szymański, A. Wilk, A. Patkowski and J. Gapiński, et al., Scaling form of viscosity at all length-scales in poly(ethylene glycol) solutions studied by fluorescence correlation spectroscopy and capillary electrophoresis, Phys. Chem. Chem. Phys., 2009, 11(40), 9025 RSC.
- A. H. Gorensek-Benitez, A. E. Smith, S. S. Stadmiller, G. M. Perez Goncalves and G. J. Cosolutes Pielak, Crowding, and Protein Folding Kinetics, J. Phys. Chem. B, 2017, 121(27), 6527 CrossRef CAS PubMed.
- Y. Wang, M. Sarkar, A. E. Smith, A. S. Krois and G. J. Pielak, Macromolecular Crowding and Protein Stability, J. Am. Chem. Soc., 2012, 134(40), 16614 CrossRef CAS PubMed.
- S. S. Stadmiller and G. J. Pielak, Protein-complex stability in cells and in vitro under crowded conditions, Curr. Opin. Struct. Biol., 2021, 66, 183 CrossRef CAS PubMed.
- C. J. Stewart, G. I. Olgenblum, A. Propst, D. Harries and G. J. Pielak, Resolving the enthalpy of protein stabilization by macromolecular crowding, Protein Sci., 2023, 32(3), e4573 CrossRef CAS PubMed.
- H. B. Lee, A. Cong, H. Leopold, M. Currie, A. J. Boersma and E. D. Sheets, et al., Rotational and translational diffusion of size-dependent fluorescent probes in homogeneous and heterogeneous environments, Phys. Chem. Chem. Phys., 2018, 20(37), 24045 RSC.
- Y. Teijeiro-Gonzalez, A. Crnjar, A. J. Beavil, R. L. Beavil, J. Nedbal and A. Le Marois, et al., Time-Resolved Fluorescence Anisotropy and Molecular Dynamics Analysis of a Novel GFP Homo-FRET Dimer, Biophys. J., 2021, 120(2), 254 CrossRef CAS PubMed.
- U. Haupts, S. Maiti, P. Schwille and W. W. Webb, Dynamics of fluorescence fluctuations in green fluorescent protein observed by fluorescence correlation spectroscopy, Proc. Natl. Acad. Sci. U. S. A., 1998, 95(23), 13573 CrossRef CAS PubMed.
- E. J. G. Peterman, S. Brasselet and W. E. Moerner, The Fluorescence Dynamics of Single Molecules of Green Fluorescent Protein, J. Phys. Chem. A, 1999, 103(49), 10553 CrossRef CAS.
- J. Hendrix, C. Flors, P. Dedecker, J. Hofkens and Y. Engelborghs, Dark States in Monomeric Red Fluorescent Proteins Studied by Fluorescence Correlation and Single Molecule Spectroscopy, Biophys. J., 2008, 94(10), 4103 CrossRef CAS PubMed.
- J. Groen, D. Foschepoth, E. te Brinke, A. J. Boersma, H. Imamura and G. Rivas, et al., Associative Interactions in Crowded Solutions of Biopolymers Counteract Depletion Effects, J. Am. Chem. Soc., 2015, 137(40), 13041 CrossRef CAS PubMed.
- C. McCue, S. Mersch, S. Bergman, E. Sheets and A. Heikal, Conformational equilibrium analysis of mCerulean3–linker–mCitrine constructs using time-resolved fluorescence measurements in controlled environments, Proc. SPIE, 2023, 12681 Search PubMed.
- T. Miyagi, Y. Yamanaka, Y. Harada, S. Narumi, Y. Hayamizu and M. Kuroda, et al., An improved macromolecular crowding sensor CRONOS for detection of crowding changes in membrane-less organelles under stressed conditions, Biochem. Biophys. Res. Commun., 2021, 583, 29–34 CrossRef CAS PubMed.
- A. M. Davey, R. P. Walvick, Y. Liu, A. A. Heikal and E. D. Sheets, Membrane Order and Molecular Dynamics Associated with IgE Receptor Cross-Linking in Mast Cells, Biophys. J., 2007, 92(1), 343 CrossRef CAS PubMed.
- A. M. Davey, K. M. Krise, E. D. Sheets and A. A. Heikal, Molecular Perspective of Antigen-mediated Mast Cell Signaling, J. Biol. Chem., 2008, 283(11), 7117 CrossRef CAS PubMed.
| This journal is © the Owner Societies 2024 |