Development and test of highly accurate endpoint free energy methods. 3: partition coefficient prediction using a Poisson–Boltzmann method combined with a solvent accessible surface area model for SAMPL challenges†
Received
29th August 2023
, Accepted 21st November 2023
First published on 21st November 2023
Abstract
Accurately predicting solvation free energy is the key to predict protein–ligand binding free energy. In addition, the partition coefficient (log![[thin space (1/6-em)]](https://www.rsc.org/images/entities/char_2009.gif) P), which is an important physicochemical property that determines the distribution of a drug in vivo, can be derived directly from transfer free energies, i.e., the difference between solvation free energies (SFEs) in different solvents. Within the Statistical Assessment of the Modeling of Proteins and Ligands (SAMPL) 9 challenge, we applied the Poisson–Boltzmann (PB) surface area (SA) approach to predict the toluene/water transfer free energy and partition coefficient (logPtoluene/water) from SFEs. For each solute, only a single conformation automatically generated by the free software Open Babel was used. The PB calculation directly adopts our previously optimized boundary definition – a set of general AMBER force field 2 (GAFF2) atom-type based sphere radii for solute atoms. For the non-polar SA model, we newly developed the solvent-related molecular surface tension parameters γ and offset b for toluene and cyclohexane targeting experimental SFEs. This approach yielded the highest predictive accuracy in terms of root mean square error (RMSE) of 1.52 kcal mol−1 in transfer free energy for 16 small drug molecules among all 18 submissions in the SAMPL9 blind prediction challenge. The re-evaluation of the challenge set using multi-conformation strategies based on molecular dynamics (MD) simulations further reduces the prediction RMSE to 1.33 kcal mol−1. At the same time, an additional evaluation of our PBSA method on the SAMPL5 cyclohexane/water distribution coefficient (logDcyclohexane/water) prediction revealed that our model outperformed COSMO-RS, the best submission model with RMSEPBSA = 1.88 versus RMSECOSMO-RS = 2.11 log units. Two external logPtoluene/water and logPcyclohexane/water datasets that contain 110 and 87 data points, respectively, are collected for extra validation and provide an in-depth insight into the error source of the PBSA method.
P), which is an important physicochemical property that determines the distribution of a drug in vivo, can be derived directly from transfer free energies, i.e., the difference between solvation free energies (SFEs) in different solvents. Within the Statistical Assessment of the Modeling of Proteins and Ligands (SAMPL) 9 challenge, we applied the Poisson–Boltzmann (PB) surface area (SA) approach to predict the toluene/water transfer free energy and partition coefficient (logPtoluene/water) from SFEs. For each solute, only a single conformation automatically generated by the free software Open Babel was used. The PB calculation directly adopts our previously optimized boundary definition – a set of general AMBER force field 2 (GAFF2) atom-type based sphere radii for solute atoms. For the non-polar SA model, we newly developed the solvent-related molecular surface tension parameters γ and offset b for toluene and cyclohexane targeting experimental SFEs. This approach yielded the highest predictive accuracy in terms of root mean square error (RMSE) of 1.52 kcal mol−1 in transfer free energy for 16 small drug molecules among all 18 submissions in the SAMPL9 blind prediction challenge. The re-evaluation of the challenge set using multi-conformation strategies based on molecular dynamics (MD) simulations further reduces the prediction RMSE to 1.33 kcal mol−1. At the same time, an additional evaluation of our PBSA method on the SAMPL5 cyclohexane/water distribution coefficient (logDcyclohexane/water) prediction revealed that our model outperformed COSMO-RS, the best submission model with RMSEPBSA = 1.88 versus RMSECOSMO-RS = 2.11 log units. Two external logPtoluene/water and logPcyclohexane/water datasets that contain 110 and 87 data points, respectively, are collected for extra validation and provide an in-depth insight into the error source of the PBSA method.
Introduction
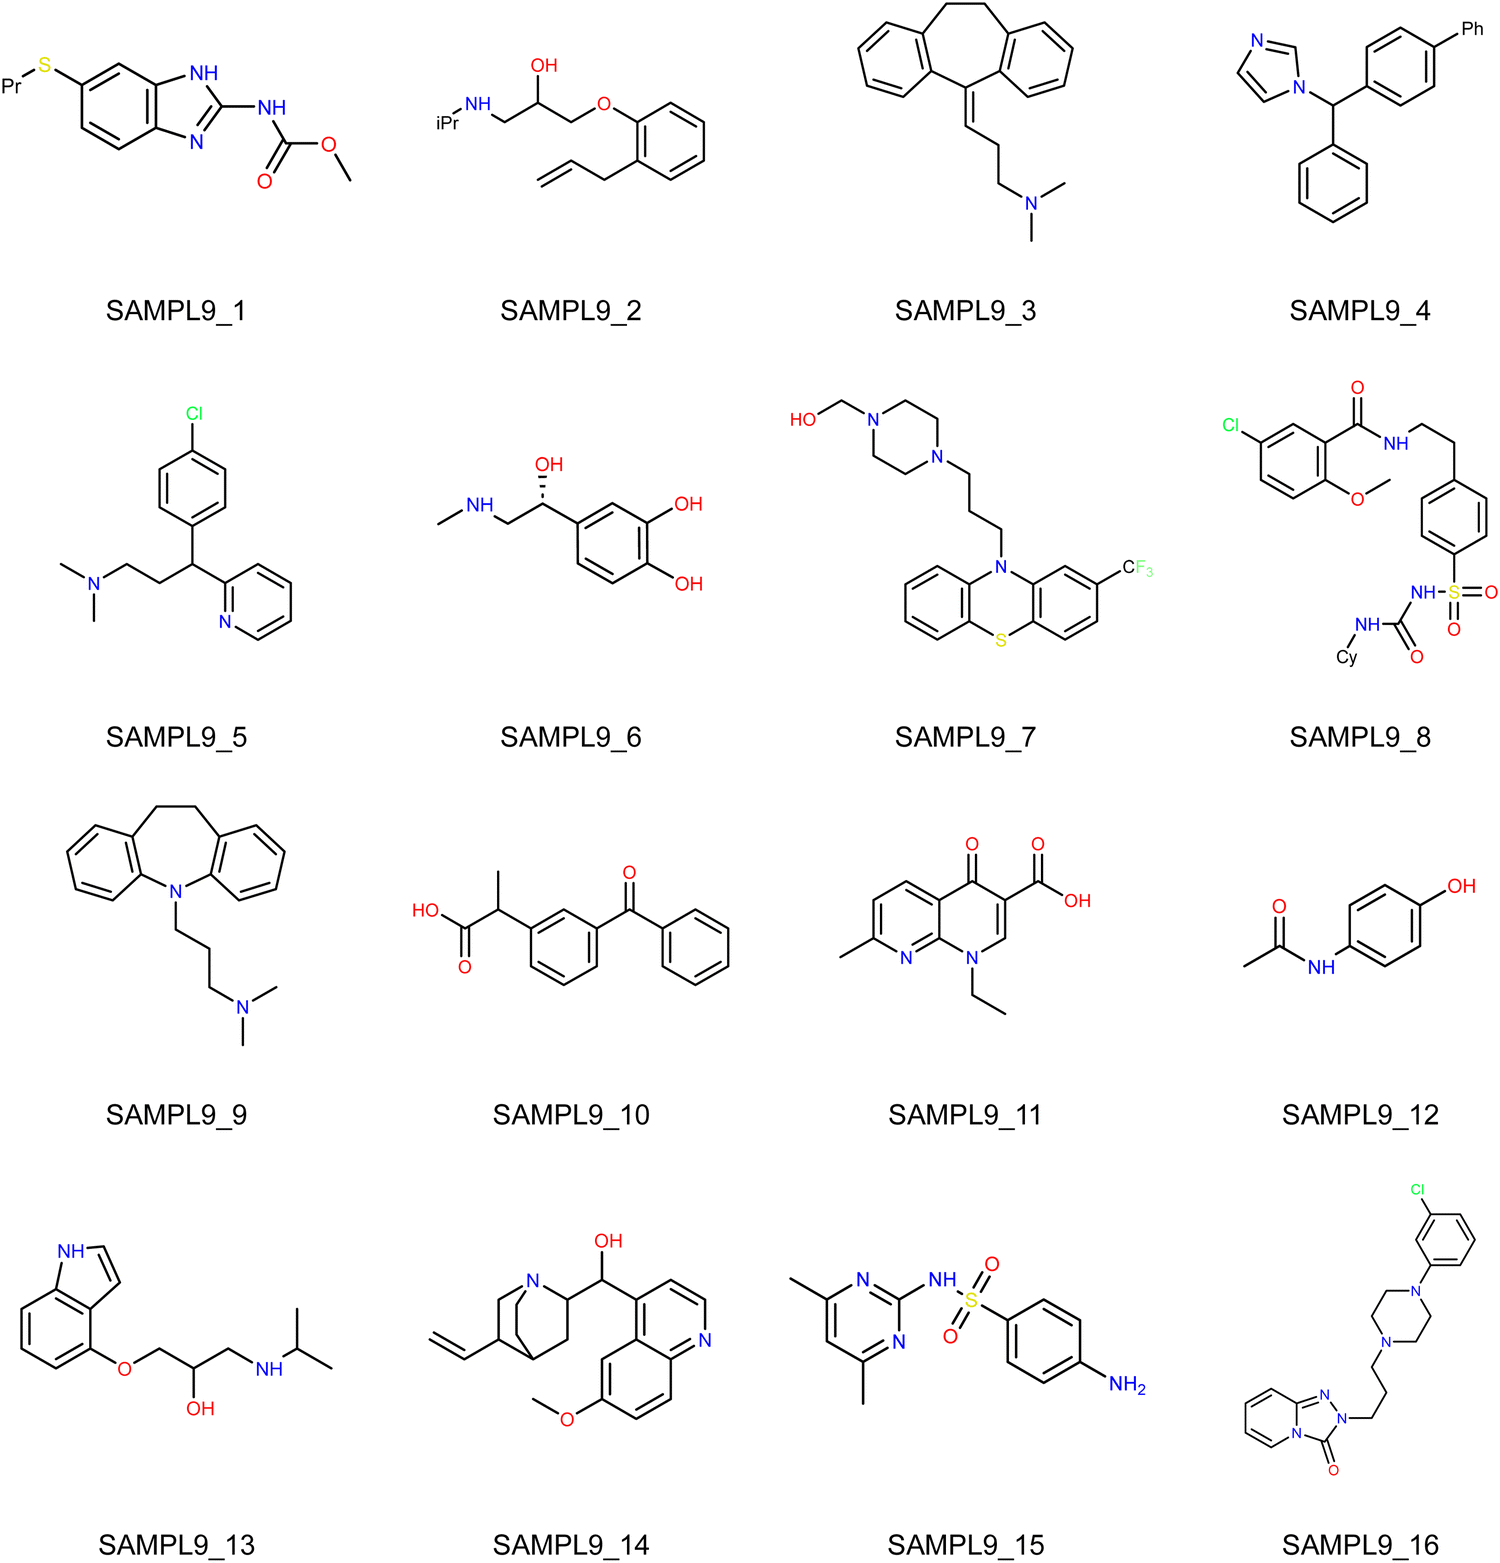
In this Statistical Assessment of the Modeling of Proteins and Ligands (SAMPL) 9 challenge, the organizers provided the simplified molecular-input line-entry system (SMILES) strings of 16 drug molecules as shown in Fig. 1 and solicited blind prediction of toluene–water partition coefficients (logPtoluene/water) on this set of molecules.1 Unlike the distribution coefficient (logD) predictions of the previous SAMPL challenge,2,3 the logP predictions do not require to account for the ionization state and the tautomer of the solute molecules. Therefore, it is unnecessary to re-model or introduce external empirical corrections for the charges. This also reduces the difficulty of making predictions based on the Poisson–Boltzmann surface area (PBSA) method in this study.
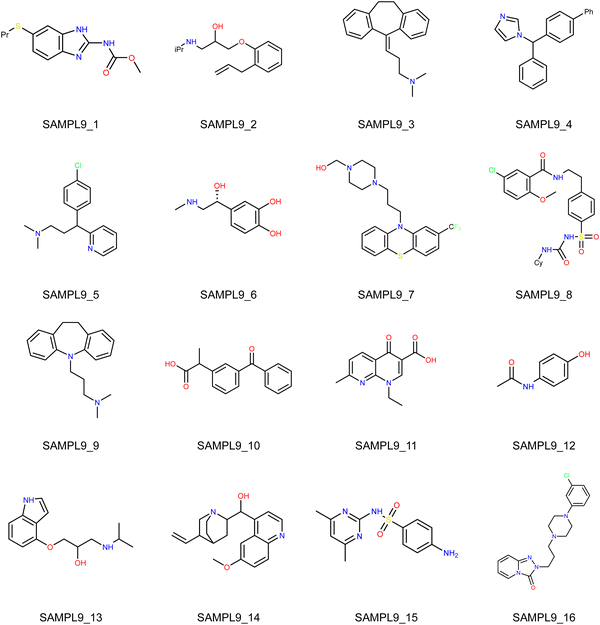 |
| | Fig. 1 Structures of the 16 molecules involved in the SAMPL9 partition coefficient challenge. | |
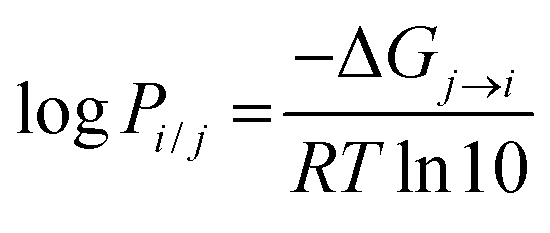
In most cases, logPi/j is proportional to the transfer free energy of the solute molecule from solvent j to solvent i:
| |  | (1) |
where
i,
j are two immiscible solvents,
R is the gas constant (8.314 J mol
−1 K
−1), and
T is the thermodynamic temperature.
Transfer free energy can be derived from the difference between the solvation free energies (SFEs) of the solute in these two solvents:
In PBSA-based SFE predictions, electrostatic interactions are usually derived from the Poisson–Boltzmann (PB) equation, and the free energy associated with cavitation and dispersion is usually described using a solvent accessible surface area (SASA) model.
4| | | ΔGsolv = ΔGPB + ΔGSASA | (3) |
The solute–solvent boundary has uncertainty in implicit solvent models that include the PB method. This is due to the homogenization approximation of the solvent by implicit solvent models and the fact that the solute–solvent boundaries cannot be fully defined by atomic radii based on the atomic number. This also implies that it is necessary to clarify the coupled electronic structure method when discussing the definition of solute–solvent boundaries. Moreover, the separating measurements of the electrostatic and non-electrostatic contributions to the solvation effect are typically not available, and hence it is difficult to optimize the electrostatic and non-electrostatic contributions individually.
5 Modeling the solvent effect as a whole may lead to overfitting and the unbalanced contributions of the two types of solvent effect.
Therefore, recently we conducted a series of studies on the development of a highly accurate PBSA model for SFE prediction,6,7 which is combined with the general AMBER force field 2 (GAFF2) and our recently developed ABCG2 charge model.8 In this new PBSA model, we developed a set of atom radii for PB calculations targeting the electrostatic (polar) contribution from the thermodynamic integration (TI) calculations of hydration free energy (HFE); then the non-electrostatic (non-polar part) term was fitted targeting the experimental values of HFE or SFE. We implemented this new PBSA strategy and obtained a root mean square error (RMSE) of 1.05 kcal mol−1 on the HFEs of 544 molecules.6 Extending this method to the solvent n-octanol yielded a prediction error of RMSE = 0.91 log units on logPoctanol/water calculations of 707 drug molecules in the ZINC database.7 We called this transfer free energy-based logP method as FELogP. Note that the PB atomic radii optimized from HFE were directly utilized for SFE calculations in organic solvents; by this way only the non-polar ΔGSASA model needs to be redeveloped for individual organic solvents. In this study, we essentially used the previously developed PB boundary definitions6,8 and derived the solvent dependent parameters γ and b for toluene and cyclohexane solvents. The parameterization of γ and b targeted to fit experimental SFEs and using multiple conformations to avoid overfitting.
In addition to blind testing on the SAMPL9 dataset, we collected 110 molecules of toluene/water logP for additional testing. Furthermore, we tested FELogP for cyclohexane using both the SAMPL5 logDcyclohexane/water dataset (110 solutes) and an additional logPcyclohexane/water dataset (87 solutes) compiled by us.
Method
Data preparation
In training sets, all the experimental data of SFE in organic solvents, in this work toluene and cyclohexane, were taken from the Minnesota Solvation Database v2012,9 and the experimental data of HFE were taken from the FreeSolv v0.52 database.10 All the initial structures from the Minnesota Solvation Database v2012 are in the xyz format, and all initial structures from the FreeSolv v0.52 database are in the mol2 format. All the structures were imported to Schrödinger Maestro v11.211 for visual inspection and were saved in mol2 files for further processing. In total, 47 molecules have both HFE and SFE in toluene, and 83 molecules have both HFE and SFE in cyclohexane.
The initial structures of SAMPL9 molecules are converted from SMILES strings to mol2 files by Open Babel 3.1.0 with the “-gen3d” option.12 The additional logP test set data were taken from the works done by Leo et al.,13 Shalaeva et al.,14 and Byrne et al.,15 and the structures were downloaded from PubChem as sdf files and converted to mol2 files by Open Babel 3.1.0.12
The modified module of ANTECHAMBER16 in AMBER Tools was utilized to assign GAFF2 topologies and ABCG2 charges.
Molecular dynamics simulations
Selected solute molecules were solvated in explicit water molecules with at least 15 Å distance from any solute atom to the edges of the cubic simulation box. The solute molecules were treated with the GAFF2 force field parameters.17 The adopted water model was TIP3P. The periodic boundary conditions and the NPT ensemble were applied with P = 1.0 atm and T = 298.15 K. The time step was set to 1.0 fs and the total simulation time was 10.0 ns for each system. The software AMBER1818 was utilized for molecular dynamics (MD) simulations.
PBSA calculations
All PB calculations were performed using Delphi V4 release 1.1.19,20 The salt concentration was set to 0 mol L−1; the grid spacing was set to 1.2 grids per Å; the percentage of the object longest linear dimension to the lattice linear dimension was set to 80%; and the boundary condition was set as the coulombic boundary with a 1.4 Å probe radius. The internal dielectric constant was always set to 1.00, and the dielectric constant of the solvent was set to 80.00 for water, 2.3741 for toluene, and 2.0165 for cyclohexane. The calculation mode was set as reaction field energy, which is regarded as the electrostatic component of solvation free energy ΔGPB. The solvent accessible surface area (SASA) was generated by an internal program called MS21 using Bondi's van der Waals radii22 and water probe (radius of 1.4 Å). This program is also available upon request. SASA was used to derive the non-electrostatic term ΔGSASA using eqn (4).21
Toluene and cyclohexane modeling
The same PB radius parameters derived using HFEs in our previous work6,7 are directly applied in toluene and cyclohexane; therefore, the only parameters of toluene and cyclohexane that differ from those of water are γ and b in eqn (4) in addition to the dielectric constant. The parameterization of γ and b can be obtained directly by linear regression analysis (single data point per solute), but given the limited amount of data in organic solvents, we used the multi-conformation approach to conduct the linear regression process (multiple data points per solute). All conformations are generated by the “-conformer” option of the Open Babel software through the genetic algorithm,12 with the generation criterion being set to minimum energy and the maximum number of generated conformations being set to 20. The numbers of conformations m associated with individual molecules are listed in Table S1 (ESI†). The advantage of generating multiple conformations through Open Babel is that the number of conformations depends on the degree of freedom of the molecule. Therefore, the modeling of toluene and cyclohexane is the fitting of the following linear equations:| |  | (5) |
where RMk is the kth conformation of molecule M and s is the organic solvent, which here represents either toluene or cyclohexane.
Calculation of log![[thin space (1/6-em)]](https://www.rsc.org/images/entities/h3_char_2009.gif) D from logP
D from logP
Only one ionization state is considered for the logD calculation from logP. The modified Henderson–Hasselbalch equation is used:| | | logD = logP − log(1 + 10)pKa–PH | (6) |
| | | logD = logP − log(1 + 10)pH–pKa | (7) |
Eqn (6) is used for basic solutes and eqn (7) is used for acidic solutes. For amphipathic molecules, acidic pKa is adopted as the correction factor.
Thermodynamic integration simulation protocol
We compared the PBSA method with the thermodynamic integration (TI) method on SAMPL9 and SAMPL5 datasets, and the TI calculation details are elaborated in this section. The alchemical enhanced sampling (ACES) method,23 proposed by Lee et al. and implemented in the graphics processing unit (GPU) version24–26 of TI modules in AMBER22, was employed for HFE and SFE calculations.
The TLEAP module in AMBER22 was used to generate all solute–solvent boxes. For a solute molecule being solvated in water, the minimum distance between any solute atoms and an edge of the water box was set to 15 Å. Similarly, a solute molecule was solvated in the cubic box of toluene or cyclohexane utilizing TLEAP. Note that a toluene solvent box which has a dimension of 33.623 Å and a cyclohexane solvent box which has a dimension of 39.418 Å were first created following the standard procedure as detailed in our previous publication.8
The organic solute–solvent system was first subjected to an initial equilibration for 200 ps using the CPU-TI at λ = 0.01592. A 2 ns MD simulation was conducted for each of the 9 λ windows (0.01592, 0.08198, 0.19331, 0.33787, 0.5, 0.66213, 0.80669, 0.91802, and 0.98408). For the first λ window (λ = 0.01592), the initial configurations were sampled from the CPU-TI, while the initial configurations for the other eight λ windows were obtained from the preceding λ window. Following the system setup, periodic boundary conditions and the isothermal–isobaric NPT ensemble were produced in all simulations. The Langevin dynamics was used to maintain the temperature at 298 K, with the collision frequency (gamma_ln) set to 2.0 ps−1. The pressure was kept at 1.01325 bar with a Monte Carlo barostat and the pressure relaxation time was set to 5.0 ps. The SHAKE constraints were disabled for the solute and the time step was set to 1 fs. It is pointed out that the purpose of running GPU-TI here was to provide an equilibrium system for the ACES simulation protocol. Specifically, we enlarged the simulation boxes for the organic solvents about 15–40% from the last snapshots of the GPU TI runs for the λ = 0.5 window. The new simulation boxes have dimensions around 46.0 Å.
All the subsequent ACES simulations were based on the new simulation boxes following the same protocol of GPU-TI, except that the van der Waals and electrostatic interactions were scaled by smoothstep soft-core potential27,28 with the switching function W(rij):
| | | rVDWij(λ;αVDW) = [rnij + W(rij)·αVDW·SP(λ)·σnij]1/n | (8) |
| | | rElecij(λ;αCoul) = [rmij + W(rij)·αElec·SP(λ)·σmij]1/m | (9) |
The lower boundary of the switching function
W(
rij) was set to 8 Å and the upper boundary was set to 10 Å. Additionally, the internal VDW interactions scaling within the soft-core region were disabled by setting the gti_add_sc to 5. Nine equally-spaced
λ windows (0.1, 0.2, 0.3, 0.4, 0.5, 0.6, 0.7, 0.8, and 0.9) were applied to decouple the endpoint states. Hamiltonian exchange between different
λ windows was performed every 100
000 steps under the REMD
23 framework to achieve enhanced sampling. It is pointed out that the above ACES protocol is the same as that reported by Lee
et al.23 with an aim to achieve consistent performance. The free energies were derived from unweighted integration of the alchemical pathway as follows:
| |  | (10) |
Three independent ACES based GPU-TI runs were performed for each solute, with 2 ns MD simulations for each
λ window. For each MD run, the beginning 0.5 ns simulation was considered as the equilibration phase and excluded from the later free energy analysis. The final HFE and SFE were then derived from the arithmetic average of the three independent TI runs, while the standard deviation of the three independent runs was calculated to measure the precision of the protocol. The corresponding log
P was calculated from HFE and SFE using
eqn (1), and the log
D was calculated from log
P using
eqn (6) and (7).
Ab initio logP calculations
We used a quantum mechanics (QM) based SMD model implemented in the Gaussian 1629 software to derive the logP benchmark for our model. The principle of SMD derived logP is also based on the transfer free energy as given in eqn (1). Geometry optimization in the liquid phase at the B3LYP/6-31G* level of theory was first performed prior to SMD calculations, with the solvent specified directly by keywords; then the optimized geometries were read out to perform single point calculations in the gas phase at the same level of theory. The energy difference between the liquid and gas phases is regarded as the SFE.
Results and discussion
Modeling of toluene and cyclohexane
With the multi-conformation strategy described above applied on the training sets, the descriptors (γ and b) of toluene and cyclohexane for the SASA model were derived: γtoluene = −0.023556, btoluene = 4.40 and γtoluene = −0.024237, bcyclohexane = 4.64. ΔGexptSFE,M − ΔGcalcPB, and SASA data for molecules in the training set to conduct liner regression are listed in Table S1 (ESI†).
SAMPL9 toluene/water logP blind prediction
As required by the SAMPL9 organizer, we submitted predicted transfer free energies ΔGtoluene/water of the 16 drug molecules before the deadline. Note that only a single conformation (with minimum energy) automatically generated by Open Babel for each drug molecule was used for the PBSA calculation of HFEs in water and SFEs in toluene. Based on the analysis results on all 18 submissions provided by the organizer (https://github.com/samplchallenges/SAMPL9/tree/main/logP/Analysis/prelim_analysis), our submission achieved the lowest overall RMSE of 1.52 kcal mol−1. After the completion of this blind prediction contest, we also applied MD simulations conjugated with PBSA to re-calculate the transfer free energy ΔGtoluene/water for the 16 molecules and the results are summarized in Table 1 and Fig. 2. Table 1 reports the calculated HFE and SFE in toluene and the transfer free energy derived from the difference between the HFE and SFE. Fig. 2 shows the correlation between experimental and calculated transfer free energies. The re-calculated transfer free energies achieved a better RMSE of 1.33 kcal mol−1 and a Pearson correlation coefficient (R) of 0.94.
Table 1 Detailed experimental and calculated transfer free energies, calculated hydration free energies in water and solvation free energies in toluene using the PBSA method. The overall Pearson correlation coefficient (R), mean signed error (MSE), mean unsigned error (MUE) and root mean square error (RMSE) are listed for 16 SAMPL9 compounds
| Compound |
Experiment ΔG (kcal mol−1) |
Hydration ΔG (kcal mol−1) |
Solvation ΔG (kcal mol−1) |
Transfer ΔG (kcal mol−1) |
|
1
|
−5.11 |
−13.48 |
−15.75 |
−2.27 |
|
2
|
−3.26 |
−11.41 |
−14.38 |
−2.97 |
|
3
|
−7.49 |
−6.14 |
−12.57 |
−6.42 |
|
4
|
−7.44 |
−10.99 |
−16.07 |
−5.08 |
|
5
|
−4.91 |
−8.27 |
−13.37 |
−5.10 |
|
6
|
1.67 |
−18.37 |
−14.59 |
3.78 |
|
7
|
−5.94 |
−13.81 |
−19.83 |
−6.02 |
|
8
|
−3.79 |
−18.49 |
−22.40 |
−3.91 |
|
9
|
−6.87 |
−5.68 |
−12.39 |
−6.71 |
|
10
|
−3.36 |
−10.80 |
−14.07 |
−3.26 |
|
11
|
−1.99 |
−13.76 |
−14.10 |
−0.35 |
|
12
|
2.16 |
−15.42 |
−12.32 |
3.10 |
|
13
|
−0.49 |
−18.04 |
−17.19 |
0.85 |
|
14
|
−1.92 |
−14.16 |
−17.40 |
−3.24 |
|
15
|
1.01 |
−19.57 |
−17.75 |
1.82 |
|
16
|
−5.13 |
−12.52 |
−18.72 |
−6.20 |
|
R
|
|
|
|
0.94 |
|
MSE
|
|
|
|
0.68 |
|
MUE
|
|
|
|
1.03 |
|
RMSE
|
|
|
|
1.33 |
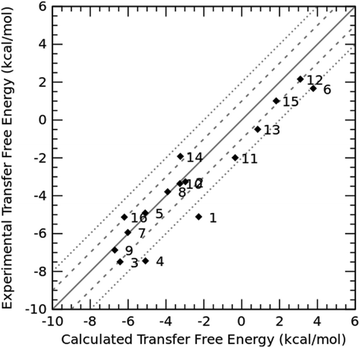 |
| | Fig. 2 Experimental transfer free energy versus calculated transfer free energy using the PBSA method for 16 drug molecules in the SAMPL9 challenge. | |
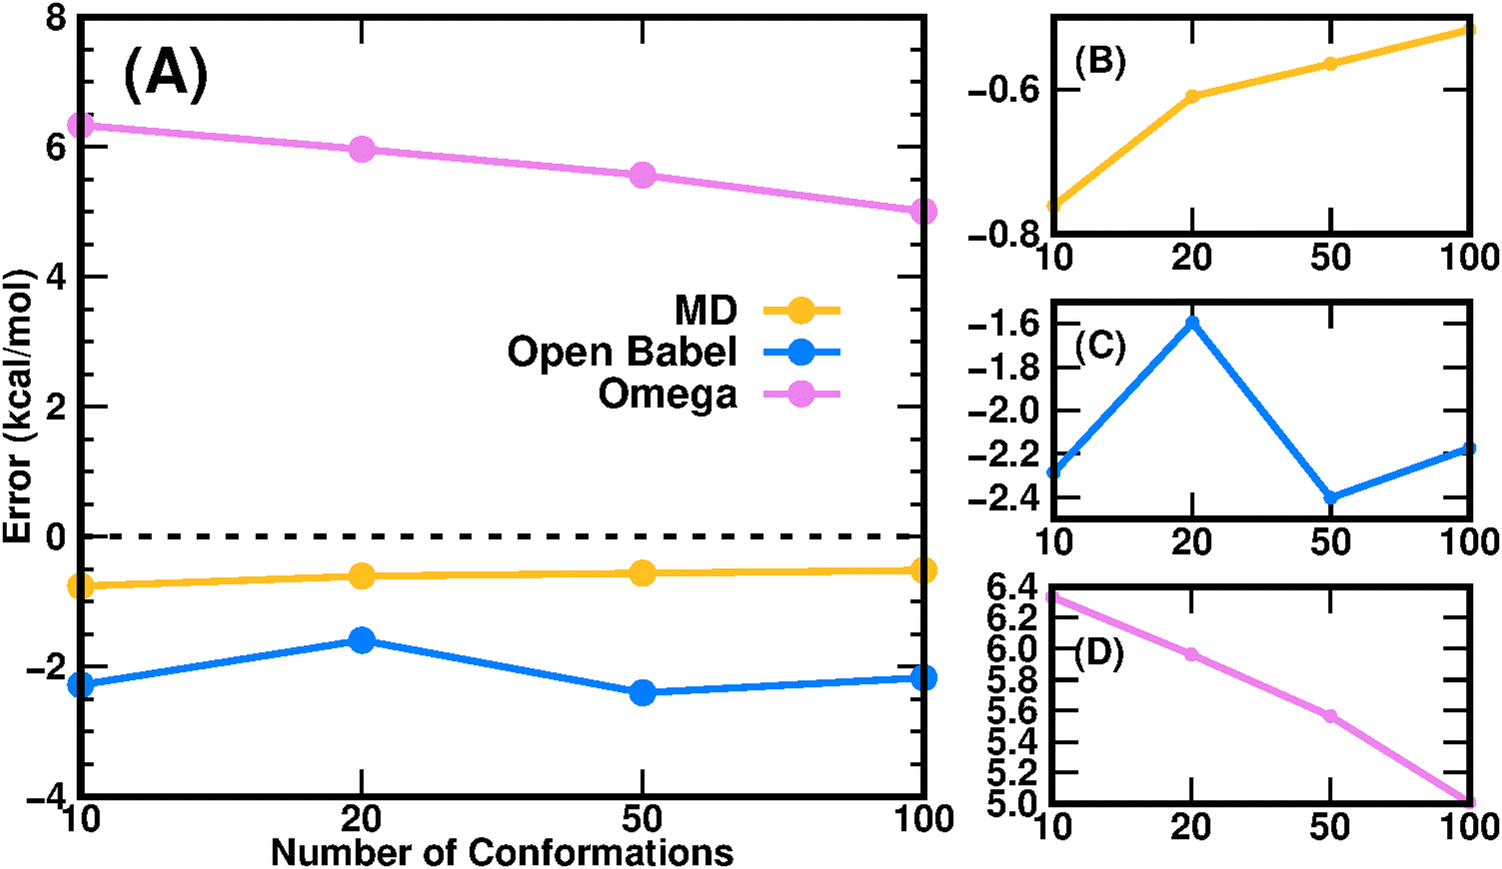
In addition to the PBSA parameters and charge model that can affect the prediction accuracy of SFEs and the corresponding transfer free energies, the adopted methodology and protocol for conformation generation are the other factors affecting the prediction performance. The prediction error of compound 8 significantly reduced after being treated by MD simulations compared to the value in our submission obtained with the single-conformation strategy. Also, compound 8 has the maximum solvent accessible area, 709.35 Å2 (B3LYP/6-31G* optimized geometry), and greater flexibility. Therefore, we focused on compound 8 to investigate the conformational effect on the prediction accuracy of transfer free energies and illustrate the results in Fig. 3. The error of the calculated transfer free energies from the experimental value was evaluated using 10, 20, 50 and 100 conformations. Conformations of compound 8 were generated through three different ways: MD simulations, genetic algorithm using Open Babel,12 and Omega using mmff94smod_NoEstat force field parameters.30 The conformations generated by MD simulations yielded the lowest computational errors among the three methods and demonstrated a trend that the error approached to zero as shown in panel B of Fig. 3 (from −0.76 kcal mol−1 on 10 conformations to −0.52 kcal mol−1 on 100 conformations). The magnitude of the computational error from the conformations generated by Omega also decreased as the number of conformations increases, just as the results from MD simulations; however, there was a much long way to go before the error could reduce to a certain low threshold. In contrast, the computational error from the conformations generated by Open Babel fluctuated around −2.0 kcal mol−1 as the number of conformations changed, with the magnitude of error higher than that from MD simulations (around −0.6 kcal mol−1) but lower than that from Omega (from −6.4 kcal mol−1 on 10 conformations to −5.0 kcal mol−1 on 100 conformations).
 |
| | Fig. 3 The relationship between the number of conformations and the prediction errors of the transfer free energies using the PBSA method. (A) Prediction errors of three conformation generation methods; (B)–(D) are re-ranged plots for individual methods. | |
Except for compound 8, other compounds which have prediction errors close to 2 kcal mol−1 should also be noticed. The prediction error of compounds 1, 6 and 11 most likely arose from the formation of intramolecular hydrogen bonds. As reported by Shalaeva et al.,14 the difference between logPoctanol/water and logPtoluene/water is a potential descriptor to indicate the formation of intramolecular hydrogen bonds. Molecular fragments that have the structural potential to form intramolecular hydrogen bonds in 6- or 7-membered rings are screened in a highly dielectric medium such as water (ε = 80) and form intermolecular hydrogen bonds with water molecules. Such a molecule first undergoes desolvation during water–toluene phase transfer and, due to the jump in the dielectric environment, is then more inclined to form intramolecular hydrogen bonds, thus decreasing the molecular polarity and increasing the solubility. As such, compounds 1 and 11 adopt different conformations in the two different solvents, and the large prediction errors of transfer free energies of the two compounds may be due to using the same set of conformations. Unfortunately, it is necessary to use the same set of conformations for the solvation free energy calculation in two different solvents to achieve the best error cancellation.31
Since the TI method demonstrates high accuracy in free energy calculations, we also employed the TI method to calculate the logPtoluene/water for the 16 molecules in the SAMPL9 dataset. The result of TI-calculated transfer free energies versus the experimental values is shown in Fig. 4, and the detailed data are summarized in Table S2 (ESI†). The overall prediction error of TI in terms of RMSE was 2.11 kcal mol−1, and the Pearson correlation coefficient of TI predictions was 0.92. Note that the prediction error of TI was slightly larger than that of the COSMO-RS method, but smaller than those of the other 11 submissions in this SAMPL9 challenge.
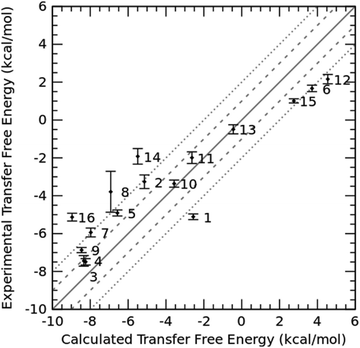 |
| | Fig. 4 Experimental transfer free energy versus calculated transfer free energy using the TI method for 16 drug molecules in the SAMPL9 challenge. The uncertainties of calculated transfer free energies were standard deviations derived from three independent TI runs. | |
SAMPL5 cyclohexane/water logD prediction
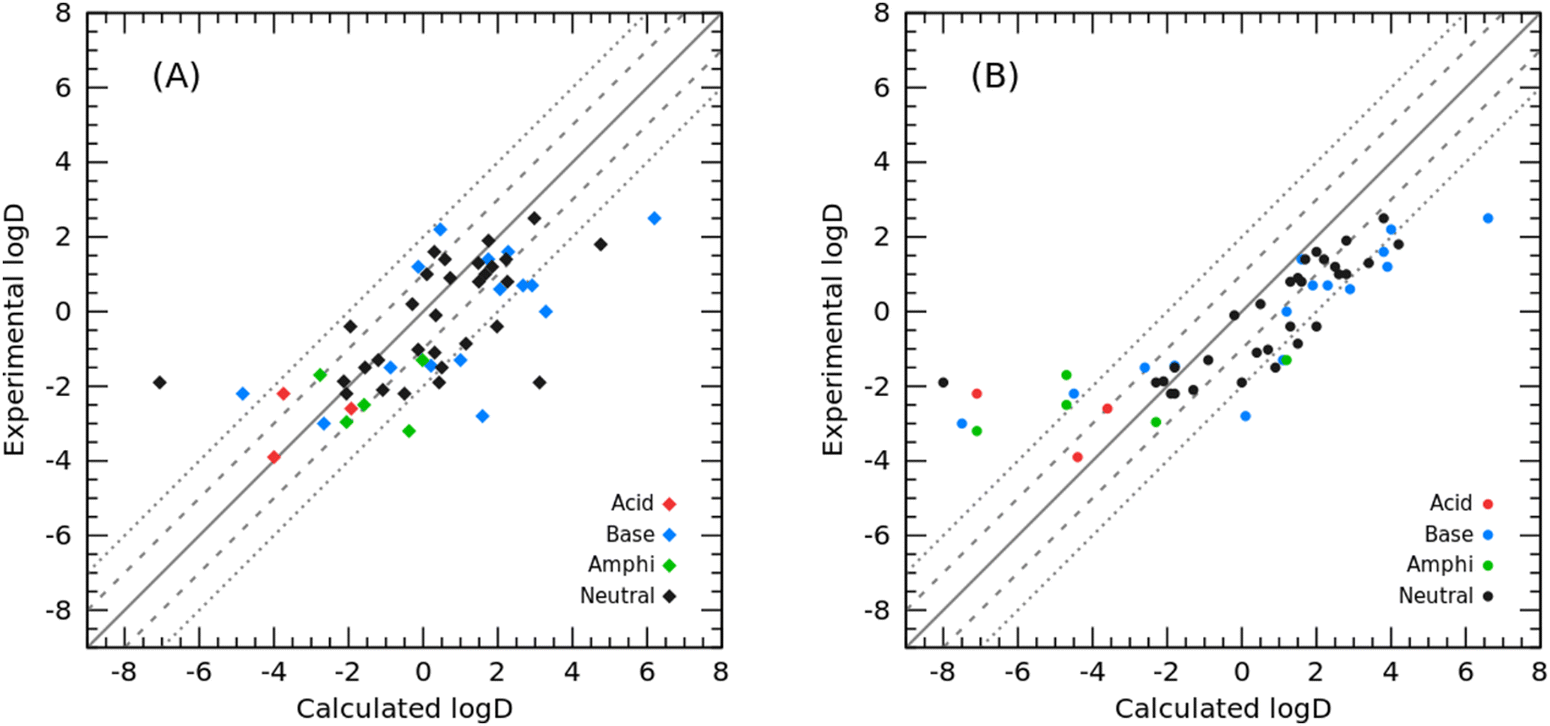
In addition to modeling toluene for the SAMPL9 challenge, we also modeled cyclohexane and tested the cyclohexane/water logD prediction for 53 organic molecules in the SAMPL5 challenge as well as the cyclohexane/water logP prediction for the 87 molecules we collected.2 The prediction results of comparing our PBSA method with the best-ranked SAMPL5 submission from Klamt et al. using the COSMO-RS method32 (hereafter referred to as COSMO-RS) are summarized in Fig. 5 and Table 2. Panel A in Fig. 5 shows the correlation between experimental logD and PBSA calculated logD, and panel B illustrates the correlation between the experimental logD value and the initial submitted logD using the COSMO-RS method by Klamt et al.32 The overall RMSE prediction error of our PBSA method is 1.88 log units, which is smaller than that of COSMO-RS (RMSE = 2.11 log units). It is worth noting, however, that the logD values calculated by the PBSA method were corrected from logP values using eqn (6) and (7), and the pKa values of the solutes were borrowed from Klamt et al. According to their report, the pKa values were predicted using the ab initio COSMOtherm program.33 In addition to COSMOtherm, ab initio calculations using the Schrödinger Jaguar pKa module34 can yield comparable accurate predictions (RMSD within 0.2–0.5 pKa units) for logD predictions. As shown in Fig. 5, the yielded large prediction errors by the PBSA method were mainly for some neutral and basic molecules, among which compounds 74 and 82 also had large prediction errors by the COSMO-RS method. Regarding compound 74, based on our experience in developing the PBSA method, the conformation of polyhydroxylated compounds represented by glycerol has a significant effect on the prediction accuracy, and the use of a multi-conformation approach sampled by MD simulations usually leads to a predicted SFE of such molecules closer to the experimental value. The prediction error for SAMPL5_083 arises from the use of a less dominant tautomer as reported by Klamt et al.32 Similarly, we conducted TI calculations on the SAMPL5 logDcyclohexane/water dataset for comparison. We also adopted the predicted pKa (summarized in Table 2) to correct the TI calculated logP to obtain logD. The performance of TI predictions is illustrated in Fig. 6 and the detailed data are listed in Table S3 (ESI†). The overall prediction error of TI in terms of RMSE was 2.15 log units, which was comparable to that of the COSMO-RS method.
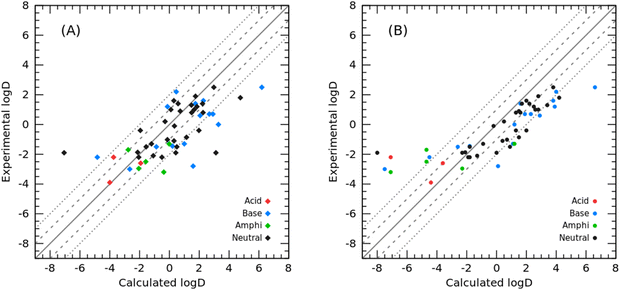 |
| | Fig. 5 Correlation between experimental and calculated logD: (A) calculated with the PBSA method (this work); (B) calculated using the COSMO-RS method. | |
Table 2 Experimental logD and calculated logP and logD values using the PBSA and COSMO-RS methods. The pKa values adopted to correct the ionization effect were from Klamt et al. If the molecule is an amphipathic molecule, the acidic pKa was used to compute the correction factor
| Compound |
Expt |
pKa |
Calc. logP |
Calc. logD |
| logD |
Acid |
Base |
COSMO-RS |
PBSA |
COSMO-RS |
PBSA |
|
SAMPL5_002
|
1.40 |
|
|
1.70 |
0.58 |
1.70 |
0.58 |
|
SAMPL5_003
|
1.90 |
|
|
2.80 |
1.75 |
2.80 |
1.75 |
|
SAMPL5_004
|
2.20 |
|
6.85 |
4.10 |
0.57 |
4.00 |
0.46 |
|
SAMPL5_005
|
−0.86 |
|
|
1.50 |
1.15 |
1.50 |
1.15 |
|
SAMPL5_006
|
−1.02 |
|
|
0.70 |
−0.14 |
0.70 |
−0.14 |
|
SAMPL5_007
|
1.40 |
|
7.02 |
1.80 |
1.90 |
1.60 |
1.74 |
|
SAMPL5_010
|
−1.70 |
4.86 |
6.03 |
−2.20 |
−0.22 |
−4.70 |
−2.76 |
|
SAMPL5_011
|
−2.96 |
4.01 |
4.55 |
1.10 |
1.33 |
−2.30 |
−2.06 |
|
SAMPL5_013
|
−1.50 |
|
|
0.90 |
0.50 |
0.90 |
0.50 |
|
SAMPL5_015
|
−2.20 |
4.35 |
|
−4.00 |
−0.70 |
−7.10 |
−3.74 |
|
SAMPL5_017
|
2.50 |
|
|
3.80 |
2.98 |
3.80 |
2.98 |
|
SAMPL5_019
|
1.20 |
|
6.55 |
4.00 |
−0.08 |
3.90 |
−0.13 |
|
SAMPL5_020
|
1.60 |
|
|
2.00 |
0.30 |
2.00 |
0.30 |
|
SAMPL5_021
|
1.20 |
|
|
2.50 |
1.85 |
2.50 |
1.85 |
|
SAMPL5_024
|
1.00 |
|
|
2.60 |
1.66 |
2.60 |
1.66 |
|
SAMPL5_026
|
−2.60 |
4.73 |
|
−0.90 |
0.74 |
−3.60 |
−1.93 |
|
SAMPL5_027
|
−1.87 |
|
|
−2.10 |
−2.13 |
−2.10 |
−2.13 |
|
SAMPL5_033
|
1.80 |
|
|
4.20 |
4.76 |
4.20 |
4.76 |
|
SAMPL5_037
|
−1.50 |
|
8.17 |
−1.70 |
−0.04 |
−2.60 |
−0.88 |
|
SAMPL5_042
|
−1.10 |
|
|
0.40 |
0.31 |
0.40 |
0.31 |
|
SAMPL5_044
|
1.00 |
|
|
2.80 |
0.10 |
2.80 |
0.10 |
|
SAMPL5_045
|
−2.10 |
|
|
−1.30 |
−1.08 |
−1.30 |
−1.08 |
|
SAMPL5_046
|
0.20 |
|
|
0.50 |
−0.29 |
0.50 |
−0.29 |
|
SAMPL5_047
|
−0.40 |
|
|
2.00 |
−1.95 |
2.00 |
−1.95 |
|
SAMPL5_048
|
0.90 |
|
|
1.50 |
0.72 |
1.50 |
0.72 |
|
SAMPL5_049
|
1.30 |
|
|
3.40 |
1.48 |
3.40 |
1.48 |
|
SAMPL5_050
|
−3.20 |
7.24 |
3.86 |
−6.70 |
0.01 |
−7.10 |
−0.38 |
|
SAMPL5_055
|
−1.50 |
|
|
−1.80 |
−1.56 |
−1.80 |
−1.56 |
|
SAMPL5_056
|
−2.50 |
8.09 |
−4.19 |
−4.60 |
−1.51 |
−4.70 |
−1.59 |
|
SAMPL5_058
|
0.80 |
|
|
1.60 |
1.49 |
1.60 |
1.49 |
|
SAMPL5_059
|
−1.30 |
|
|
−0.90 |
−1.20 |
−0.90 |
−1.20 |
|
SAMPL5_060
|
−3.90 |
4.95 |
|
−1.90 |
−1.55 |
−4.40 |
−4.00 |
|
SAMPL5_061
|
−1.45 |
|
7.03 |
−1.70 |
0.36 |
−1.80 |
0.21 |
|
SAMPL5_063
|
−3.00 |
|
9.05 |
−5.80 |
−1.00 |
−7.50 |
−2.66 |
|
SAMPL5_065
|
0.70 |
|
8.43 |
3.40 |
3.99 |
2.30 |
2.92 |
|
SAMPL5_067
|
−1.30 |
|
8.85 |
2.60 |
2.46 |
1.10 |
1.00 |
|
SAMPL5_068
|
1.40 |
|
|
2.20 |
2.22 |
2.20 |
2.22 |
|
SAMPL5_069
|
−1.30 |
8.91 |
7.74 |
1.70 |
−0.01 |
1.20 |
−0.02 |
|
SAMPL5_070
|
1.60 |
|
9.32 |
5.80 |
4.20 |
3.80 |
2.28 |
|
SAMPL5_071
|
−0.10 |
|
|
−0.20 |
0.34 |
−0.20 |
0.34 |
|
SAMPL5_072
|
0.60 |
|
8.62 |
4.10 |
3.30 |
2.90 |
2.06 |
|
SAMPL5_074
|
−1.90 |
|
|
−8.00 |
−7.06 |
−8.00 |
−7.06 |
|
SAMPL5_075
|
−2.80 |
|
8.50 |
1.30 |
2.72 |
0.10 |
1.59 |
|
SAMPL5_080
|
−2.20 |
|
|
−1.90 |
−2.06 |
−1.90 |
−2.06 |
|
SAMPL5_081
|
−2.20 |
|
8.28 |
−3.60 |
−3.90 |
−4.50 |
−4.84 |
|
SAMPL5_082
|
2.50 |
|
8.11 |
7.40 |
6.98 |
6.60 |
6.20 |
|
SAMPL5_083
|
−1.90 |
|
|
−2.30 |
3.12 |
−2.30 |
3.12 |
|
SAMPL5_084
|
0.00 |
|
8.18 |
2.00 |
4.13 |
1.20 |
3.29 |
|
SAMPL5_085
|
−2.20 |
|
|
−1.80 |
−0.50 |
−1.80 |
−0.50 |
|
SAMPL5_086
|
0.70 |
|
9.52 |
4.00 |
4.80 |
1.90 |
2.68 |
|
SAMPL5_088
|
−1.90 |
|
|
0.00 |
0.43 |
0.00 |
0.43 |
|
SAMPL5_090
|
0.80 |
|
|
1.30 |
2.26 |
1.30 |
2.26 |
|
SAMPL5_092
|
−0.40 |
|
|
1.30 |
1.98 |
1.30 |
1.98 |
|
R
|
|
|
|
0.79 |
0.55 |
0.85 |
0.68 |
|
MSE
|
|
|
|
1.05 |
1.26 |
0.49 |
0.71 |
|
MUE
|
|
|
|
1.79 |
1.84 |
1.65 |
1.44 |
|
RMSE
|
|
|
|
2.26 |
2.34 |
2.10 |
1.88 |
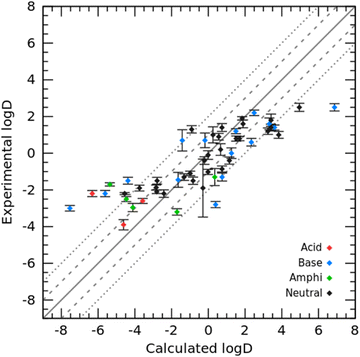 |
| | Fig. 6 Correlation between experimental logD and TI calculated logD. Uncertainties were standard deviations from three independent TI runs. | |
Test of the PBSA method on additional logP datasets
Finally, to further validate the developed PBSA models for toluene and cyclohexane, additional test molecules were collected to predict the logPtoluene/water and logPcyclohexane/water values. For 110 organic molecules in toluene, the PBSA method achieved an RMSE of 1.83 log units. In contrast, the QM-based SMD method calculated at the B3LYP/6-31G* level of theory had a prediction error of 2.31 log units. The comparison results are shown in a scatter plot between the experimental logP and calculated logP (Fig. 7), and the raw data are listed in Table S4 (ESI†).
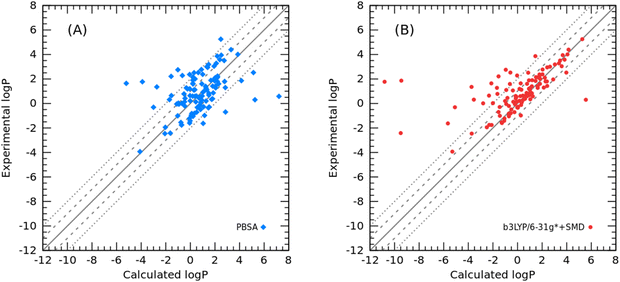 |
| | Fig. 7 Correlation between the experimental and calculated logPtoluene/water: (A) calculated logPtoluene/water using the PBSA method; (B) calculated logPtoluene/water using the SMD method. | |
Interestingly, there was a strong agreement between the PBSA method and the SMD method for molecules with large prediction errors, which are 8-hydroxyquinoline, 2-methyl-8-quinolinol, bromothymol blue, and Schiff base. Some others with larger errors by the PBSA method are phosphorus-containing molecules, for which the phosphorus-related bond charge correction parameters were not adequately adjusted for the ABCG2 charge model. Still the other six molecules with experimental logP values between 3.0 and 4.0 have systematic errors in the PBSA calculations, but not in SMD calculations. Examination of their structures revealed that most of them are halogen-substituted benzenes, except for cyclohexene. This systematic error is probably due to the inability of the implicit solvent model described by the dielectric constant to adequately model the π–π interactions arising from the benzene rings in the toluene and solute molecules. Of course, the systematic error may also come from the inadequate description of the σ-hole effect by the ABCG2 charge model. This systematic error in structure-dependent SFE calculations recurs in the PBSA model and has attracted our attention to deal with those “difficult” molecules in the future.
As to the 87 organic molecules in the additional cyclohexane test set, the PBSA method achieved an RMSE of 1.11 log units, which is slightly larger than that of the SMD method (RMSE = 0.99) as shown in Fig. 8. Nevertheless, the prediction error is much lower than the RMSE of logD prediction in the SAMPL5 challenge.
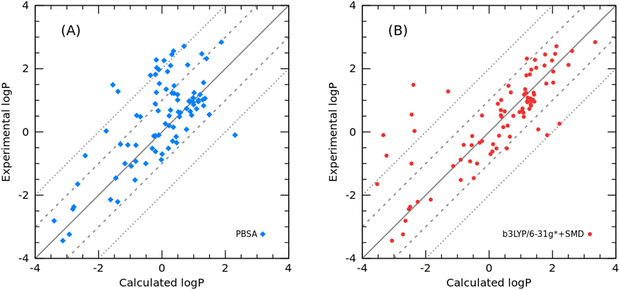 |
| | Fig. 8 Correlation between the experimental and calculated logPcyclohexane/water: (A) calculated logPcyclohexane/water using the PBSA method; (B) calculated logPcyclohexane/water using the SMD method. | |
Conclusion
In this study, we extended the scope of our PBSA method for predicting solvation free energies in toluene and cyclohexane for organic molecules by parameterizing the nonpolar part and successfully applied this model to predict toluene–water partition coefficients in the SAMPL9 challenge. The PBSA method performed the best out of a total of 18 submissions in terms of RMSE. The RMSE error of our submission, 1.52 kcal mol−1, was further reduced to 1.33 kcal mol−1 after using the multi-conformations generated through MD simulations. The distribution coefficient dataset from the SAMPL5 challenge was adopted to test the performance of the PBSA solvation free energy model for cyclohexane, and the prediction error of our model, RMSE = 1.88 log units, was better than that of COSMO-RS, which had the lowest prediction error (RMSE = 2.11 log units) among the 63 submissions of the SAMPL5 challenge. The ACES TI was conducted to calculate toluene–water transfer free energy in the SAMPL9 dataset and cyclohexane–water logD in the SAMPL5 dataset. The RMSEs of TI were 2.11 kcal mol−1 on the SAMPL9 dataset and 2.15 log units on the SAMPL5 dataset. This further proved the reliability of our PBSA-based approach for partition coefficient prediction. In addition, we discussed the potential sources of errors for some poor predictions. More excitingly, we found the prediction error of our models can be further reduced when using multiple conformations. Among the three conformational ensemble generation methods, MD simulations achieved the best performance. We further evaluated our two PBSA solvation free energy models using two larger molecule sets. Overall, the performance of our FELogP model is comparable to or better than that of the quantum mechanics based SMD method.
Author contributions
JW designed the experiment; TN collected the datasets, developed the PBSA-based models and performed the evaluation; all authors discussed and participated in manuscript writing.
Conflicts of interest
The authors declare that the research was conducted in the absence of any commercial or financial relationships that could be construed as a potential conflict of interest.
Acknowledgements
This work was supported by funds from the National Institutes of Health (R01GM147673 and R01GM149705) and the National Science Foundation (1955260). The authors would like to thank the Center for Research Computing (CRC) at the University of Pittsburgh and the Pittsburgh Supercomputer Center (PSC, grant no. BIO210185) for providing the computing resources. The authors are grateful for the software support from OpenEye Scientific Cadence Molecular Sciences, Santa Fe, New Mexico.
References
- W. J. Zamora, A. Viayna, S. Pinheiro, C. Curutchet, L. Bisbal, R. Ruiz, C. Ràfols and F. J. Luque, Phys. Chem. Chem. Phys., 2023, 25, 17952–17965 RSC.
- C. C. Bannan, K. H. Burley, M. Chiu, M. R. Shirts, M. K. Gilson and D. L. Mobley, J. Comput.-Aided Mol. Des., 2016, 30, 927–944 CrossRef CAS PubMed.
- T. D. Bergazin, N. Tielker, Y. Zhang, J. Mao, M. R. Gunner, K. Francisco, C. Ballatore, S. M. Kast and D. L. Mobley, J. Comput.-Aided Mol. Des., 2021, 35, 771–802 CrossRef CAS PubMed.
- J. Wang, T. Hou and X. Xu, Curr. Comput.-Aided Drug Des., 2006, 2, 287–306 CrossRef CAS.
- A. V. Marenich, C. J. Cramer and D. G. Truhlar, J. Phys. Chem. B, 2009, 113, 6378–6396 CrossRef CAS PubMed.
- Y. Sun, X. He, T. Hou, L. Cai, V. H. Man and J. Wang, J. Comput. Chem., 2023, 44, 1334–1346 CrossRef CAS PubMed.
- Y. Sun, T. Hou, X. He, V. H. Man and J. Wang, J. Comput. Chem., 2023, 44, 1300–1311 CrossRef CAS PubMed.
- X. He, V. H. Man, W. Yang, T.-S. Lee and J. Wang, J. Chem. Phys., 2020, 153, 114502 CrossRef CAS PubMed.
-
A. V. Marenich, C. P. Kelly, J. D. Thompson, G. D. Hawkins, C. C. Chambers, D. J. Giesen, P. Winget, C. J. Cramer and D. G. Truhlar, Minnesota Solvation Database – version 2012, University of Minnesota, Minneapolis, 2012.
- D. L. Mobley and J. P. Guthrie, J. Comput.-Aided Mol. Des., 2014, 28, 711–720 CrossRef CAS PubMed.
-
Maestro, Schrödinger LLC, New York, 2017.
- N. M. O'Boyle, M. Banck, C. A. James, C. Morley, T. Vandermeersch and G. R. Hutchison, J. Cheminf., 2011, 3, 33 Search PubMed.
- A. Leo, C. Hansch and D. Elkins, Chem. Rev., 1971, 71, 525–616 CrossRef CAS.
- M. Shalaeva, G. Caron, Y. A. Abramov, T. N. O’Connell, M. S. Plummer, G. Yalamanchi, K. A. Farley, G. H. Goetz, L. Philippe and M. J. Shapiro, J. Med. Chem., 2013, 56, 4870–4879 CrossRef CAS PubMed.
- F. P. Byrne, W. M. Hodds, S. Shimizu, T. J. Farmer and A. J. Hunt, J. Cleaner Prod., 2019, 240, 118175 CrossRef CAS.
- J. Wang, W. Wang, P. A. Kollman and D. A. Case, J. Mol. Graphics Modell., 2006, 25, 247–260 CrossRef CAS PubMed.
- J. M. Wang, R. M. Wolf, J. W. Caldwell, P. A. Kollman and D. A. Case, J. Comput. Chem., 2004, 25, 1157–1174 CrossRef CAS PubMed.
-
D. A. Case, I. Y. Ben-Shalom, S. R. Brozell, D. S. Cerutti, T. E. Cruzeiro III, T. A. Darden, R. E. Duke, D. Ghoreishi, M. K. Gilson, H. Gohlke, A. W. Goetz, D. Greene, R Harris, N. Homeyer, Y. Huang, S. Izadi, A. Kovalenko, T. Kurtzman, T.-S. Lee, S. LeGrand, P. Li, C. Lin, J. Liu, T. Luchko, R. Luo, D. J. Mermelstein, K. M. Merz, Y. Miao, G. Monard, C. Nguyen, H. Nguyen, I. Omelyan, A. Onufriev, F. Pan, R. Qi, D. R. Roe, A. Roitberg, C. Sagui, S. Schott-Verdugo, J. Shen, C. L. Simmerling, J. Smith, R. SalomonFerrer, J. Swails, R. C. Walker, J. Wang, H. Wei, R. M. Wolf, X. Wu, L. Xiao, D. M. York and P. A. Kollman, Amber 2018, University of California, San Francisco, 2018 Search PubMed.
- W. Rocchia, E. Alexov and B. Honig, J. Phys. Chem. B, 2001, 105, 6507–6514 CrossRef CAS.
- L. Li, C. Li, S. Sarkar, J. Zhang, S. Witham, Z. Zhang, L. Wang, N. Smith, M. Petukh and E. Alexov, BMC Biophys., 2012, 5, 9 CrossRef PubMed.
- J. Wang and T. Hou, J. Chem. Inf. Model., 2012, 52, 1199–1212 CrossRef CAS PubMed.
- A. Bondi, J. Phys. Chem., 1964, 68, 441–451 CrossRef CAS.
- T.-S. Lee, H.-C. Tsai, A. Ganguly and D. M. York, J. Chem. Theory Comput., 2023, 19, 472–487 CrossRef CAS PubMed.
- J. W. Kaus, L. T. Pierce, R. C. Walker and J. A. McCammon, J. Chem. Theory Comput., 2013, 9, 4131–4139 CrossRef CAS PubMed.
- T.-S. Lee, Y. Hu, B. Sherborne, Z. Guo and D. M. York, J. Chem. Theory Comput., 2017, 13, 3077–3084 CrossRef CAS PubMed.
- T.-S. Lee, D. S. Cerutti, D. Mermelstein, C. Lin, S. LeGrand, T. J. Giese, A. Roitberg, D. A. Case, R. C. Walker and D. M. York, J. Chem. Inf. Model., 2018, 58, 2043–2050 CrossRef CAS PubMed.
- T. Steinbrecher, D. L. Mobley and D. A. Case, J. Chem. Phys., 2007, 127, 214108 CrossRef PubMed.
- T. Steinbrecher, I. Joung and D. A. Case, J. Comput. Chem., 2011, 32, 3253–3263 CrossRef CAS PubMed.
-
M. J. Frisch, G. W. Trucks, H. B. Schlegel, G. E. Scuseria, M. A. Robb, J. R. Cheeseman, G. Scalmani, V. Barone, G. A. Petersson, H. Nakatsuji, X. Li, M. Caricato, A. V. Marenich, J. Bloino, B. G. Janesko, R. Gomperts, B. Mennucci, H. P. Hratchian, J. V. Ortiz, A. F. Izmaylov, J. L. Sonnenberg, D. Williams-Young, F. Ding, F. Lipparini, F. Egidi, J. Goings, B. Peng, A. Petrone, T. Henderson, D. Ranasinghe, V. G. Zakrzewski, J. Gao, N. Rega, G. Zheng, W. Liang, M. Hada, M. Ehara, K. Toyota, R. Fukuda, J. Hasegawa, M. Ishida, T. Nakajima, Y. Honda, O. Kitao, H. Nakai, T. Vreven, K. Throssell, J. A. Jr., J. E. Peralta, F. Ogliaro, M.
J. Bearpark, J. J. Heyd, E. N. Brothers, K. N. Kudin, V. N. Staroverov, T. A. Keith, R. Kobayashi, J. Normand, K. Raghavachari, A. P. Rendell, J. C. Burant, S. S. Iyengar, J. Tomasi, M. Cossi, J. M. Millam, M. Klene, C. Adamo, R. Cammi, J. W. Ochterski, R. L. Martin, K. Morokuma, O. Farkas, J. B. Foresman and D. J. Fox, Gaussian16, Gaussian Inc., Wallingford CT, 2016 Search PubMed.
- N. O. Friedrich, C. de Bruyn Kops, F. Flachsenberg, K. Sommer, M. Rarey and J. Kirchmair, J. Chem. Inf. Model., 2017, 57, 2719–2728 CrossRef CAS PubMed.
- Y. Sun, T. Hou, X. He, V. H. Man and J. Wang, J. Comput. Chem., 2023, 44, 1300–1311 CrossRef CAS PubMed.
- A. Klamt, F. Eckert, J. Reinisch and K. Wichmann, J. Comput.-Aided Mol. Des., 2016, 30, 959–967 CrossRef CAS PubMed.
- A. Klamt, F. Eckert, M. Diedenhofen and M. E. Beck, J. Phys. Chem. A, 2003, 107, 9380–9386 CrossRef CAS PubMed.
- J. J. Klicic, R. A. Friesner, S. Y. Liu and W. C. Guida, J. Phys. Chem. A, 2002, 106, 1327–1335 CrossRef CAS.
Footnote |
| † Electronic supplementary information (ESI) available: The calculated nonpolar free energies and SASA for each conformation (Table S1), SMILES strings for each molecule in the training set (Table S1), ACES based TI calculation results for the SAMPL9 dataset (Table S2) and SAMPL5 dataset (Table S3), additional logP experimental data and the corresponding molecules’ SMILES strings (Table S4). AMBER topology/coordinates, additional force field parameters (in the frcmod format) and molecular structures with ABCG2.1 charges (in the mol2 format) for training set molecules are accessible from https://mulan.pharmacy.pitt.edu/publication/supplementary/pccp_2023/Trainingset.tar.gz. The internal program for solvent-accessible surface area calculations, ms, is available upon request. See DOI: https://doi.org/10.1039/d3cp04174c |
|
| This journal is © the Owner Societies 2024 |
Click here to see how this site uses Cookies. View our privacy policy here. 
 ,
Fengyang
Han
,
Luxuan
Wang
and
Junmei
Wang
,
Fengyang
Han
,
Luxuan
Wang
and
Junmei
Wang