DOI:
10.1039/D3CE01012K
(Paper)
CrystEngComm, 2024,
26, 40-50
A facile recrystallization strategy for fabrication of nanocrystalline microspheres of sulfatic sodalite with high thermal stability†
Received
12th October 2023
, Accepted 14th November 2023
First published on 17th November 2023
Abstract
Sodalite as one prototype of zeolite-type crystal structures contains a β-cage with a pore size of ∼2.7 Å and can capture small-sized molecules such as ammonia and water. However, the low thermal stability of sodalite stemming from the presence of hydroxyl groups in the aluminosilicate framework adversely affects its high-temperature applications. Herein, a novel strategy for synthesizing a sulfatic modification of sodalite (S-sodalite) without any hydroxyl group in the framework, except water molecules in the cage, has been successfully developed. S-Sodalite was hydrothermally recrystallized from a gel, which was first digested from basic sodalite (B-sodalite) by sulfuric acid (H2SO4) and neutralized by alkali. Thermogravimetric analysis in combination with powder X-ray diffraction shows that the framework of S-sodalite has exceptionally high thermal stability up to at least 900 °C, which is attributed to the incorporation of the SO42− group rather than OH− into the structure. The robust framework of S-sodalite avoids the 14.5% volume expansion accompanying the conversion of hydrosodalite to anhydrous sodalite, which can cause cracking and affect applications. In addition, nitrogen (N2) adsorption–desorption measurements show that the specific surface areas of the nanocrystalline microspheres of S-sodalite are greatly enhanced to 48.8 m2 g−1 from 0.8 m2 g−1 of micro-sized B-sodalite. The adsorbed amount of ammonia (NH3) reaches 1.78 mmol g−1 at 25 °C under a pressure of 1 bar. Therefore, the new strategy for the synthesis of hydrophilic S-sodalite with exceptionally high thermal stability paves the way for its potential applications of water removal from mixed gases at elevated temperatures.
1. Introduction
Sodalite consisting of a cuboctahedral β-cage (known as SOD) is one of the most common zeolite-type materials. The SOD or β-cage is a truncated octahedron (i.e. 8 hexagonal rings and 6 square rings) at the corners of which silicon and aluminum atoms are located.1 Although the free dimension of the inscribed sphere of the β-cage in sodalite is up to 6.6 Å, the access to the cage through the 6-membered ring window (channel) is only ∼2.7 Å, which only allows very small molecules such as ammonia (∼2.55 Å), helium (∼2.60 Å) and water (∼2.65 Å) to permeate through.2–4 Correspondingly, the selectivity of the cages with a small aperture size allows preferential adsorption of small molecules and ions.5,6 Natural sodalite normally adopts a cubic cell with the space group of P![[4 with combining macron]](https://www.rsc.org/images/entities/char_0034_0304.gif) 3n (no. 218) and a chemical formula of Na8[SiAlO4]6Cl2.1,7,8 In comparison, synthetic sodalite usually has variable amounts of water and hydroxyl in the formulas dependent on the conditions of hydrothermal synthesis or subsequent heat treatments at elevated temperatures: i.e., the basic sodalite (B-sodalite) series Na8[AlSiO4]6(OH)2·nH2O (0 < n ≤ 4) and the hydrosodalite series Na6[AlSiO4]6·nH2O (0 < n ≤ 8).9 In order to obtain improved properties and applications,9–11 the sodalite family has evolved into diverse chemical, topological, geometrical, and crystallographic variants with a general formula Na6[AlSiO4]6(NaX)m·(H2O)n (where X = Cl, OH, SO4, CO3, …; m = 0–2; n = 0–8).12–14 Applications of sodalite zeolites include optical materials,15 hydrogen adsorption and storage, water sorption and separation,16 ammonia adsorption, etc.17 For example, membranes of hydroxyl sodalite can be used to produce ultra-pure water by desalination of seawater according to its absolute selectivity towards water.16 Supported sodalite membranes can also be used in water selectivity in steam permeation of H2O/H2, H2O/CH4, and H2O/CO2 up to 200 °C.17 However, industrial applications such as water removal from esterification, etherification, condensation or any other equilibrium-limited reaction, water removal from Fischer–Tropsch synthesis (220–350 °C), and ammonia recovery from the Haber process (300–550 °C) require membrane materials that can withstand relatively high temperatures without structural degradation.4 As is known, anhydrous sodalite, Na6[A1SiO4]6,18 of a rigid framework up to 850 °C (ref. 9) can be obtained from the decomposition of Na6[AlSiO4]6·8H2O (W-sodalite).9,19,20 However, with the increase of temperature, Na6[AlSiO4]6·8H2O transforms into anhydrous sodalite at ∼227 °C with 14.5% volume expansion,9 which can cause cracking and adversely impact its high-temperature applications. Literature data for the preparation or application of anhydrous sodalite are sparse. The primary, hydrothermally synthesized sodalite usually belongs to Na8[AlSiO4]6(OH)2·nH2O (2 ≤ n ≤ 4) (B-sodalite),21 not metastable Na6[AlSiO4]6·8H2O (W-sodalite).10,20 However, the thermal stability of B-sodalite is particularly low due to the presence of hydroxyl groups in the aluminosilicate framework. Therefore, direct synthesis of hydroxyl-free sodalite featuring improved thermal stability from common hydrothermal routes has not been possible so far, preventing potential applications of sodalite zeolites at elevated temperatures.
3n (no. 218) and a chemical formula of Na8[SiAlO4]6Cl2.1,7,8 In comparison, synthetic sodalite usually has variable amounts of water and hydroxyl in the formulas dependent on the conditions of hydrothermal synthesis or subsequent heat treatments at elevated temperatures: i.e., the basic sodalite (B-sodalite) series Na8[AlSiO4]6(OH)2·nH2O (0 < n ≤ 4) and the hydrosodalite series Na6[AlSiO4]6·nH2O (0 < n ≤ 8).9 In order to obtain improved properties and applications,9–11 the sodalite family has evolved into diverse chemical, topological, geometrical, and crystallographic variants with a general formula Na6[AlSiO4]6(NaX)m·(H2O)n (where X = Cl, OH, SO4, CO3, …; m = 0–2; n = 0–8).12–14 Applications of sodalite zeolites include optical materials,15 hydrogen adsorption and storage, water sorption and separation,16 ammonia adsorption, etc.17 For example, membranes of hydroxyl sodalite can be used to produce ultra-pure water by desalination of seawater according to its absolute selectivity towards water.16 Supported sodalite membranes can also be used in water selectivity in steam permeation of H2O/H2, H2O/CH4, and H2O/CO2 up to 200 °C.17 However, industrial applications such as water removal from esterification, etherification, condensation or any other equilibrium-limited reaction, water removal from Fischer–Tropsch synthesis (220–350 °C), and ammonia recovery from the Haber process (300–550 °C) require membrane materials that can withstand relatively high temperatures without structural degradation.4 As is known, anhydrous sodalite, Na6[A1SiO4]6,18 of a rigid framework up to 850 °C (ref. 9) can be obtained from the decomposition of Na6[AlSiO4]6·8H2O (W-sodalite).9,19,20 However, with the increase of temperature, Na6[AlSiO4]6·8H2O transforms into anhydrous sodalite at ∼227 °C with 14.5% volume expansion,9 which can cause cracking and adversely impact its high-temperature applications. Literature data for the preparation or application of anhydrous sodalite are sparse. The primary, hydrothermally synthesized sodalite usually belongs to Na8[AlSiO4]6(OH)2·nH2O (2 ≤ n ≤ 4) (B-sodalite),21 not metastable Na6[AlSiO4]6·8H2O (W-sodalite).10,20 However, the thermal stability of B-sodalite is particularly low due to the presence of hydroxyl groups in the aluminosilicate framework. Therefore, direct synthesis of hydroxyl-free sodalite featuring improved thermal stability from common hydrothermal routes has not been possible so far, preventing potential applications of sodalite zeolites at elevated temperatures.
It has been reported that the range of synthetic conditions for the production of B-sodalite is quite narrow.21 Adjusting synthetic conditions, particularly a slight variation in the Si/Al molar ratio, always leads to the formation of more stable minerals such as hydroxycancrinite (Na8[AlSiO4]6(OH)2·2H2O, trigonal, PDF#46-1457).21,22 Notice that sodalite synthesized under different conditions has variable chemical compositions (Na6+x[AlSiO4]6(OH)x·nH2O, where x = 0–2, n = 0–8) but the same crystal structure with similar unit-cell parameters. In this work, we focus on the effects of synthesis conditions with the aim of synthesizing sodalite without hydroxyl groups in the framework to improve its thermal stability. Herein, we report a facile strategy for hydrothermally synthesizing microspheres of sodalite nanoparticles by the crystallization–digestion–gel–recrystallization method. This novel method, which can be applied to water-insoluble sodalite, is clearly different from the traditional method of water-soluble materials by the crystallization–dissolution–recrystallization route. X-ray diffraction analysis in combination with infrared spectrum and chemical composition analysis indicated that micro-sized B-sodalite formed by primary crystallization is unexpectedly transformed into sulfatic sodalite (S-sodalite) by recrystallization of an intermediate gel formed from the digestion of B-sodalite after alkali neutralization. Interestingly, S-sodalite in the form of nanocrystalline microspheres has exceptionally high thermal stability: the framework is stable up to at least 900 °C. Moreover, the as-prepared hierarchical mesoporous sodalite composed of nanocrystalline aggregates in this study does not need any post-treatment, such as calcining or etching the templates with adverse effects. Therefore, our new recrystallization strategy is more facile, cost-efficient, and environmentally friendly. Efficient synthesis of zeolites with hierarchically structured morphologies is of great significance for both fundamental research and industrial application.23,24 Moreover, the specific surface areas of the nanocrystalline aggregates of S-sodalite are shown to be greatly enhanced in comparison with micro-sized B-sodalite. In addition, the microspheres of nanocrystalline S-sodalite are easily recovered and recycled from solutions after adsorption, thus overcoming the difficulties of nano-sodalite recycling.5,25 The high specific surface areas of the as-synthesized microspheres of S-sodalite nanoparticles, in particular, are shown to have improved performances in the removal of environmental pollutants such as Cu(II). Therefore, the hydrophilic S-sodalite without any hydroxyl in the framework, but featuring high specific surface areas, markedly improves its thermal stability and is expected to greatly expand its applications, especially those such as the removal of water from mixed gases at high temperatures.
2. Experimental section
2.1 Starting materials
B-sodalite (Na8[AlSiO4]6(OH)2·2H2O) was prepared from water-washed kaolin (−325 mesh or <0.045 mm in diameter) as the starting material, which is dominantly composed of kaolinite (Al4[Si4O10](OH)8) with the Si/Al molar ratio at unity.21 The as-received chemical reagents used in this study included sodium hydroxide (NaOH, ≥96 wt%, analytical reagent (AR), Xilong Chemical Co. Ltd), sulfuric acid (96% H2SO4, AR, Sigma-Aldrich), and methylene blue (MB) trihydrate (C16H18ClN3S·3H2O, AR, Xilong Chemical Co. Ltd). The solution of certified reference materials (CRMs: Cu(II) at 20 mg L−1 in 5% nitric acid) was purchased from Tanmo Quality Inspection Technology Co., Ltd.
2.2 Characterization
The powder X-ray diffraction (PXRD) patterns of the as-prepared samples were collected on a Bruker D8 Advance powder X-ray diffractometer (Bruker Corporation, Germany) using Cu Kα (λ = 1.54178 Å) radiation, operated at 40 kV and 40 mA with a scan range of 2θ of 3–63° at a step size of 0.01° and count of 0.1 s per step. The corresponding crystal morphologies and elemental compositions of the samples were characterized using an SU-70 field emission scanning electron microscope (SEM; Hitachi High-Technologies Corporation, Japan) with an Oxford energy-dispersive X-ray spectrometer (EDX), operated at 20 kV. The sample surface was sputtered with platinum for 120 s to improve its conductivity before SEM examination. The Fourier transform infrared (FT-IR) spectra were generated on a Nicolet iS10 FT-IR spectrometer (Thermo Fisher Scientific Inc., USA) over the range of 400–4000 cm−1 with a spectral resolution of 2 cm−1. Thermogravimetric and differential thermal analysis (TG-DTA) was performed on an STA 449F3 simultaneous thermal analyzer (Netzsch, Germany) at a heating rate of 10 °C min−1 from room temperature to 900 °C in air. A CHNOS elemental analyzer (Elementar vario EL III, Germany) was used to determine the C, H, and S contents.
The specific surface areas of the samples were determined by the Brunauer–Emmett–Teller (BET) method with a high-performance surface area and porosity analyzer (BELSORP-max, Microtrac BEL Corp, Japan). The pore size distributions were calculated using the Barrett–Joyner–Halenda (BJH) method. The static adsorption experiments of ammonia (NH3) were performed at room temperature on a Beishide BSD-PMC corrosive gas adsorption analyzer. The samples were outgassed at 110 °C under vacuum overnight before measurements. To verify the adsorption performance of the samples, the Cu(II) contents in aqueous solutions after adsorption were determined using an Agilent iCAP 7400 inductively coupled plasma optical emission spectroscopy (ICP-OES) analyzer (Thermo Fisher Scientific Inc., Germany). The sample time-dependent adsorption in methylene blue (MB) solutions was determined using a Lambda 750 UV-vis spectrophotometer (PerkinElmer, Inc., USA) at its maximum absorption wavelength of 664 nm for MB.
2.3 Primary crystallization of zeolites
Raw materials of kaolin were used as the silica and alumina sources for the synthesis of B-sodalite and first activated by the hydrothermal alkali activation method as described in our previous work.21,26,27 In total, twelve activation and crystallization experiments were used for comparison. For each activation and crystallization experiment, a mixture of 2.50 g of kaolin (SiO2 44.03 wt% (18.32 mmol), Al2O3 40.98 wt% (10.05 mmol)) and 50 mL of 6 M NaOH with a molar ratio Si![[thin space (1/6-em)]](https://www.rsc.org/images/entities/char_2009.gif) :Al:Na = 0.91:1.00:14.93 was first prepared. This mixture in a closed Teflon-lined stainless-steel autoclave was then heated to and kept at 200 °C in an oven for 4 h. After the activation and crystallization experiments, the resultant solid products were centrifuged and washed three times with deionized water. The solids were further dried at 75 °C for 24 h. Typically, ∼2.48 g solid product (referred to as SOD-1) (Fig. 1(a)) was obtained from each experiment with a yield of ∼84% (based on silicon).
:Al:Na = 0.91:1.00:14.93 was first prepared. This mixture in a closed Teflon-lined stainless-steel autoclave was then heated to and kept at 200 °C in an oven for 4 h. After the activation and crystallization experiments, the resultant solid products were centrifuged and washed three times with deionized water. The solids were further dried at 75 °C for 24 h. Typically, ∼2.48 g solid product (referred to as SOD-1) (Fig. 1(a)) was obtained from each experiment with a yield of ∼84% (based on silicon).
 |
| | Fig. 1 Comparison of the PXRD and FT-IR results of samples SOD-1 and SOD-2, synthesised from the two different routes (“crystallization” and “crystallization–digestion–gel–recrystallization”). a) PXRD patterns, the vertical bars represent the Bragg positions of B-sodalite (1) and S-sodalite (2). Also shown are the PXRD patterns of SOD-2-250 °C and SOD-2-700 °C, which are the SOD-2 samples after calcination at 250 and 700 °C for 1 h, respectively; (b) FT-IR spectra. | |
2.4 Secondary recrystallization of zeolites
In order to produce high-purity sodalite, a new route of “crystallization–digestion–gel–recrystallization” was introduced into our experiments. The twelve as-synthesized samples of SOD-1 described above, at ∼2.48 g each, were dissolved in 25 mL of 1 M sulfuric acid by stirring. After centrifugation and filtration of insoluble impurities (if present), different amounts of sodium hydroxide were respectively added into the resultant transparent solutions to form white silica–alumina gels at different pH values (pH = 4, 6, 8, 10, 12, and 14). Then the twelve gel samples were divided into two groups. Six gel samples in one group were dried at 75 °C for 12 h and named gel-4, gel-6, gel-8, gel-10, gel-12, and gel-14, respectively, for subsequent characterization (ESI† Table S1, Fig. S1 and S2). The other group of six wet gels without drying was directly transferred into 100 mL autoclave vessels, heated in an oven and kept at 100 °C for 48 h. After recrystallization, the resulting solid products were centrifuged and washed three times with deionized water. These solids recrystallized from the six wet gels were dried at 75 °C for 24 h, and named SOD-2-4, SOD-2-6, SOD-2-8, SOD-2-10, SOD-2-12, and SOD-2-14, respectively (Fig. 6, ESI† Table S1). In addition, the pure S-sodalite from sample SOD-2-14 (see below) was selected for various performance characterization techniques and is referred to as SOD-2 for short hereafter.
2.5 Experiments for adsorption performance
The adsorption of methylene blue (MB) and Cu(II) by samples SOD-1 and SOD-2 in solutions was studied at a temperature of 30 °C. Each sample at 300 mg was individually immersed in 50 mL methylene blue or Cu(II) solution with a concentration of 2 mg L−1 and placed in reagent bottles within an ultrasonic water bath of constant temperature. Time dependent adsorption experiments were performed on these solutions. The supernatants after the adsorption reactions for predetermined time intervals were filtered to determine the residual MB and Cu(II) concentrations. The changes of the dye's maximum absorbance intensity were detected by using a UV-visible spectrophotometer. The adsorption capacity Ce (%) or qt (mg g−1) of MB and Cu(II) was calculated from the following equations (eqn (1) or (2)):| |  | (1) |
| |  | (2) |
where C0 and Ct (mg L−1) are the initial concentration and the instantaneous concentration at time t (min) of MB or Cu(II) in aqueous solutions, respectively; V (L) is the volume of the solution (i.e., 50 mL), and M (g) is the mass of the SOD-1 or SOD-2 adsorbent (i.e., 300 mg).
3. Results and discussion
3.1 Characterization of synthetic zeolites
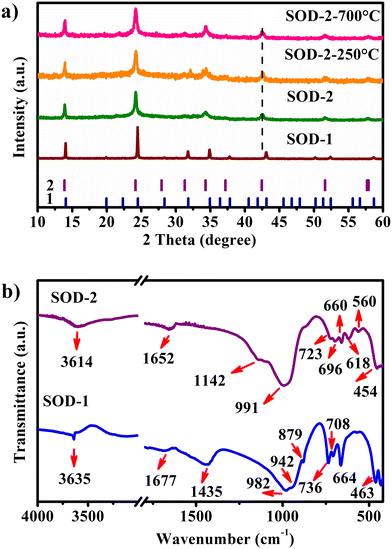
The characteristic PXRD reflections of sample SOD-1 at 2θ of 14.04, 24.47, 31.77, 34.89, and 43.08° are all consistent with those of PDF#76-1639, suggesting that the SOD-1 sample is B-sodalite (Fig. 1(a)).28 Indeed, the PXRD pattern of sample SOD-1 can be indexed in a cubic cell with parameters of a = 8.8999 (3) Å and V = 704.96 Å3 in the space group P3n (ESI† Table S2), which are also similar to those of B-sodalite in the literature.19,28 However, the main reflections at 2θ of 13.88, 24.17, 34.31, and 42.46° of sample SOD-2 are broadened and significantly shifted to the left (low angle), and some weak reflections are absent with respect to SOD-1. Moreover, an additional weak peak with a narrow peak-width at 2θ of 22.28° (d = 3.987 Å) was perceived in the SOD-2 pattern, attributable to impurity diaspore (2θ of 22.26°, d = 3.990 Å, AlO(OH), PDF#05-0355).21,29 This impurity peak can be used as an internal standard to calibrate the SOD-2 PXRD pattern, suggesting that the shifts of the main reflections in the SOD-2 pattern are not from experimental errors, but arise from the change of the unit cell. Moreover, repeated experiments showed that the reflection positions of the PXRD patterns of the SOD-2 sample are reproducible, further supporting the suggestion that the different diffraction peak positions between SOD-1 and SOD-2 are caused by different unit cells. The reflections of SOD-2 can be roughly indexed to a cubic cell of a = 9.031(4) Å, V = 736.64 Å3, but with a poor figure of merit (ESI† Table S3). Moreover, only one of the split peaks at 57.69 and 57.91° was successfully indexed to the cubic cell. On the other hand, all observed reflections, including the above unindexed peak, are readily accounted for by a trigonal unit-cell. Pattern indexing using Jade V6.5 led to a rhombohedral cell with parameters: a = b = 12.773 (3), c = 7.781 (3) Å, α = β = 90, γ = 120°, V = 1099.43 Å3, and space group R3m (ESI† Table S4). The transformation matrix from the cubic cell of B-sodalite to the trigonal cell of S-sodalite is (−1, 1, 0/ 0, −1, 1/0.5, 0.5, 0.5). The axial ratio a/c of S-sodalite is 1.6416, larger than 1.6330 (calculated from the cubic cell), suggesting a-axis expansion and c-axis compression with respect to the cubic cell. These cell parameters indexed from the SOD-2 pattern are very similar to those (a = 12.774(2), c = 7.824(1) Å) of a rhombohedral sodalite described in ref. 14, which was originally synthesized accidentally in a leaking autoclave under nonreproducible conditions about thirty years ago.30 The a-axis length of S-sodalite is the same as that of its polymorphic modification, hydroxycancrinite (PDF#46-1457: trigonal P3 (no. 143), a = 12.74, c = 5.183 Å),22 but different in c-axes. Note that sodalite can be transformed into cancrinite or hydroxycancrinite.21,31 A previous study reported that sodalite forms first and then transforms slowly into cancrinite at a rate that increases with increasing temperature.31 However, the first and second strongest reflections in SOD-2 are located at 2θ of 24.17 and 13.88° and clearly different from those of cancrinite (PDF#34-0176) and hydroxycancrinite (PDF#46-1457) at 2θ of 27.77 and 19.14° and 27.33 and 18.86°, respectively.22,32 In addition, no reflections close to 2θ of 27.5 and 19.0° in the SOD-2 PXRD pattern were observed (ESI† Fig. S3). Interestingly, the observed reflection intensities of SOD-2 are approximately consistent with those calculated from single crystal data of nosean (Na6[AlSiO4]6(Na2SO4)·H2O).33 Both EDX and CHNOS elemental analysis confirmed the presence of S in the sample SOD-2. Therefore, the SOD-2 sample most probably belongs to trigonal Na6[AlSiO4]6(Na2SO4)·nH2O, slightly deviated from nosean in water contents.34
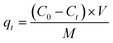
Interestingly, the PXRD pattern of SOD-2 displays significant peak broadening and has relatively low intensities and a slightly uplifted broad background in comparison with that of SOD-1. It is commonly believed that peak broadening arises from the size effect of nanocrystalline particles while the broad background uplifting is attributable to the presence of amorphous materials. The SEM image confirmed the spherical morphologies of SOD-2 composed of nanocrystalline crystallites (Fig. 2(f)).
 |
| | Fig. 2 Comparison of morphologies and chemical compositions between samples SOD-1 and SOD-2. a and d) SEM images for SOD-1 and SOD-2, respectively; b and e) corresponding EDX results; c and f) SEM images for recovered samples SOD-1 and SOD-2 after MB adsorption for 2 h. | |
The FT-IR spectra for samples SOD-1 and SOD-2 are relatively similar (Fig. 1(b)) and also closely comparable to those of sodalite.5,35 For both spectra, the broad peak in the range of 3700–3400 cm−1 and the weak peak at 1652 cm−1 are assigned to the symmetric stretching (υ1) and bending (υ2) vibration modes of the water molecules in the pores or channels of zeolites. The most intense broadband centred at 991 cm−1 is attributed to the asymmetric stretching vibration (υ3) of the T–O–T of the [TO4] (T = Si or Al) tetrahedra.36 The multiple weak bands in the range of 740–540 cm−1 arise from the symmetric stretching vibrations (υ1) of the T–O–T bonds in the Si–O–Al framework.5,35 The peak at 454 cm−1 is ascribed to the Si–O–Si asymmetrical bending vibrations (υ4).36,37 With respect to the major difference between the two spectra, a sharp weak peak at 3635 cm−1 and a broad peak 1435 cm−1 appear only in SOD-1 while a shoulder peak at 1142 cm−1 occurs only in SOD-2. The bands at 1435, 879, and 708 cm−1 in SOD-1 are attributed to the υ3, υ2, and υ4 vibration modes, respectively, of the carbonate (CO32−) group in tectosilicates.38–40 These bands of the carbonate group in the FT-IR spectra persist at least up to 800 °C (ESI† Fig. S4). The existence of carbon in SOD-1 has been further supported by CHNOS elemental analysis (ESI† Table S5). The carbonate groups are most likely derived from carbon dioxide in air, which is readily dissolved in alkaline starting solutions. The sharp peak at 3635 cm−1 is attributed to the OH-stretching mode, further confirming that only sample SOD-1 (i.e. B-sodalite) contains hydroxyl groups in its crystal structure, while sample SOD-2 (i.e. S-sodalite) does not. The shoulder peak at 1142 cm−1 and a weak but well-resolved band at 618 cm−1 in the FT-IR spectrum of SOD-2 are assigned to the asymmetric stretching vibration (υ3) and asymmetric bending vibration (υ4) of the [SO4]2− group, respectively (ESI† Tables S5 and S6).34 The ex situ FT-IR spectra vs. temperature show that the sharp peak of the (OH) group and the broad peak of the H2O molecule of the SOD-1 sample disappeared after calcination at 650 °C (ESI† Fig. S4). Surprisingly, the broad peaks of H2O molecules at 3614 and 1652 cm−1 persist in the FT-IR spectrum of sample SOD-2 even after calcination at 800 °C. In order to further clarify this abnormal thermal behaviour, the hydrogen content was measured using a CHNOS elemental analyzer. The SOD-2 sample after calcination at 800 °C contains about 0.57(2) wt% of hydrogen (ESI† Table S5), corresponding to about 5.1 wt% of water, close to that (6.6 wt%) determined for the pristine sample of SOD-2 (Fig. 3(b)). Note that the FT-IR and CHNOS elemental analyses of SOD-2 were done within 1 and 5 days, respectively. It is reasonable to conclude that these abnormal results of SOD-2 arise from its hydrophilic rigid zeolite framework that is stable up to 900 °C (Fig. 3 and ESI† Fig. S5(b)) and can reversely adsorb water from air after dehydration. This is in clear contrast to SOD-1, whose framework collapses after 650 °C (ESI† Fig. S5(a)) and therefore, can absorb only limited water (ESI† Table S5). Interestingly, it is easy to distinguish SOD-1 (i.e., B-sodalite) and SOD-2 (i.e., S-sodalite) by the range of the FT-IR “sodalite fingerprint” vibrations. The characteristic range of B-sodalite is 660–740 cm−1,41 whereas that of S-sodalite is 540–740 cm−1.
 |
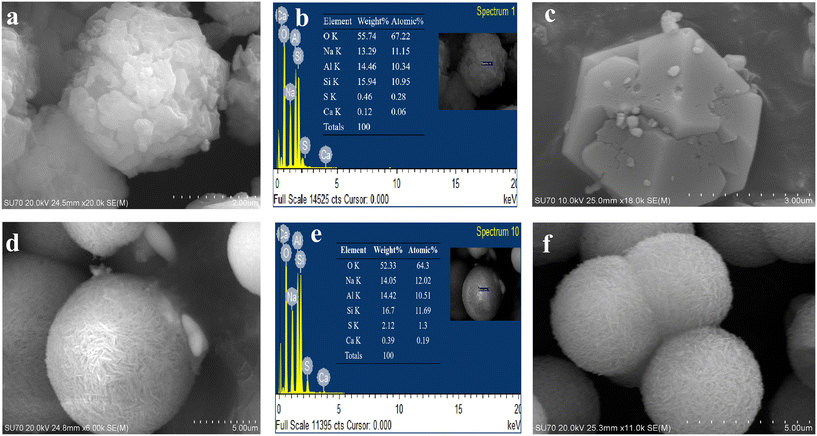
| | Fig. 3 Comparison of TG-DTA performance between samples SOD-1 (B-sodalite) (a) and SOD-2 (S-sodalite) (b). | |
The SEM images show that both samples SOD-1 and SOD-2 have spherical-like morphologies with uniform particle sizes of 3–4 μm in diameter. The B-sodalite of the SOD-1 sample exhibits isometric or dodecahedral crystal characteristics with irregular cracks on the surface.5 The S-sodalite of SOD-2 occurs as microspheres composed of nanoplates (Fig. 2), with dimensions of approximately 630 Å long and 250 Å wide calculated from PXRD using the program of Jade V6.5. EDX analyses show that the Si/Al molar ratios of samples SOD-1 and SOD-2 are at approximately 1:1 and 1.1:1, respectively (Fig. 2(b) and (e), ESI† Table S6). The Si/Al molar ratio of 1.1:1 in S-sodalite is also consistent with the presence of diaspore in the PXRD pattern of sample SOD-2. The EDX data show that the S content in SOD-2 is significantly larger than that in SOD-1 (ESI† Table S6), consistent with the incorporation of the SO42− group in the structure of SOD-2.
3.2 Thermal stability
As discussed above, the PXRD pattern of SOD-1 at room temperature is similar to that of B-sodalite (PDF#76-1639) with a formula of Na8[AlSiO4]6(OH)2·2H2O.28 Note that there are two different formulae for B-sodalite: Na8[AlSiO4]6(OH)2·2H2O (2 W) and Na8[AlSiO4]6(OH)2·4H2O (4 W).4 They might arise from different synthetic conditions because Na8[AlSiO4]6(OH)2·4H2O (4 W) can be transformed into Na8(Al6Si6O24)(OH)2·2H2O (2 W) at elevated temperatures up to 147 °C (Table 1).19 The B-sodalite in this study was synthesized at a temperature of 200 °C. Therefore, its formula should be Na8[AlSiO4]6(OH)2·2H2O (2 W), containing two water molecules.20,28 This water content has been confirmed by the results of the following thermal analysis. Fig. 3(a) shows that there were three steps of mass loss (exp. ∼11.7 wt%) in the TG curve as a function of temperature, which are attributed to the release of two zeolite water molecules, one hydroxyl group, and Na2O per formula of B-sodalite (calc. 3.72% of 2H2O, 1.86% of H2O, and 6.40% of Na2O, respectively, calc. total 11.98%). Interestingly, these results are consistent with the three different in situ PXRD patterns measured in the temperature ranges of 25–250, 300–600, and 700–800 °C of sodalite.4 Correspondingly, the sample of SOD-1 changes gradually from basic sodalite (Na8[AlSiO4]6(OH)2·2H2O) to Na8[AlSiO4]6(OH)2 and sodium aluminum silicate with the increase of temperature (ESI† Fig. S5(a)).4 These results suggest that the framework of SOD-1 collapses after the release of the hydroxyl groups.
Table 1 Summary of sodalite synthesis conditions and the corresponding chemical formulas
| Conditions |
Space groups |
Formulae |
References |
| 200 °C (SOD-1) |
P3n (no. 218) |
Na8[AlSiO4]6(OH)2·2H2O |
This report |
| 450 °C, 1.55 TPa |
P3n (no. 218) |
Na8[AlSiO4]6(OH)2·2H2O |
Hassan & Grundy (1983)28 |
| 350 °C, 110 MPa |
P3n (no. 218) |
Na8[AlSiO4]6(OH)2·2H2O |
Engelhardt et al. (1992)20 |
| 90–140 °C |
P3n (no. 218) |
Na8[AlSiO4]6(OH)2·4H2O |
Khajavi et al. (2010)4 |
| 77–147 °C |
P3n (no. 218) |
Na8[AlSiO4]6(OH)2·3–4H2O |
Felsche & Luger (1986)9 |
| 135 °C, pH at 7 |
P3n (no. 218) |
Na6[AlSiO4]6·6–8H2O |
Felsche & Luger (1986)9 |
| 100 °C, pH at 14 (SOD-2) |
R3m (no. 160) |
Na6[AlSiO4]6(Na2SO4)·nH2O, n = ∼4 |
This report |
In contrast, Fig. 3(b) shows that there is only one step of mass loss observed in the TG curve for sample SOD-2, quite different from SOD-1. A strong peak at 123 °C observed in the DTG curve, accompanied by ∼6.6 wt% mass loss, is attributed to the release of zeolite water. Above 250 °C, there is no apparent mass loss observed for sample SOD-2 (Fig. 3(b)). The ex situ PXRD patterns suggest that the framework of S-sodalite is stable up to at least 900 °C (ESI† Fig. S5(b)). Note that the SOD-2 samples synthesized from different batches are almost pure. But several batches of the SOD-2 samples contain small amounts of amorphous impurities, which are converted to zeolite A (PDF#83-2371)42 and gibbsite (Al(OH)3, 33-0018)43 after calcination at 300 °C or higher temperatures (ESI† Fig. S5(b)). Moreover, the main peaks of SOD-2 remain unchanged with the increase in temperature but become slightly sharper than those in the as-synthesized sample (ESI† Fig. S5(b)), indicative of enhanced crystallinity after calcination. This result suggests that there is only zeolite water involved in sample SOD-2 and no (OH)− group in the framework, which is confirmed by no sharp peak appearing in the FT-IR spectrum in the range of 3700–3500 cm−1. Considering the starting gel composition of Si/Al = 1.0, it is reasonable to suggest that the chemical formula of S-sodalite is most likely Na6[AlSiO4]6(Na2SO4)·nH2O. The number of water molecules, n = ∼4, can be calculated from the mass loss (obs. 6.6 wt% vs. calc. 6.8 wt% for an idea formula Na6[AlSiO4]6(Na2SO4)·4H2O) in Fig. 3(b). Note that the hydrosodalite series, Na6[AlSiO4]6·nH2O (0 < n ≤ 8), is characterized by abnormal expansion of structural characteristics during thermal dehydration but retains the space group.9 The unit-cell volume of Na6[AlSiO4]6·8H2O abnormally increases with a decrease in the water content as a function of temperature increase.9 The phase transition at ∼227 °C from Na6[AlSiO4]6·8H2O to Na6[AlSiO4]6 is accompanied by an ∼14.5% volume increase.9 In contrast, there are no apparent shifts in the peak positions in the ex situ PXRD patterns among the as-is SOD-2 and those after calcination at 250 °C and 700 °C (Fig. 1(a)). Thus, there is no apparent volume change with the release of water in SOD-2. This strongly suggests that the S-sodalite of SOD-2 reported herein is clearly different from the previously reported hydrosodalite series.9,19,44 It is also interesting to note that Na6[AlSiO4]6·8H2O was synthesized via the NaOH extraction (Soxhlet extraction) process from autoclave exchange experiments at 135 °C, using Na8[AlSiO4]6(OH)2·4H2O (note the typos in original references as Na8[AlSiO4]6·nH2O (n = 3–4))9,19 and water as the starting materials.20 Therefore, our successful preparation of S-sodalite reported herein is probably attributed to the synthesis conditions of low temperature (100 °C), low pressure, and high pH at 14, in comparison with those used for Na6[AlSiO4]6·8H2O (Table 1).9,19
3.3 BET analysis
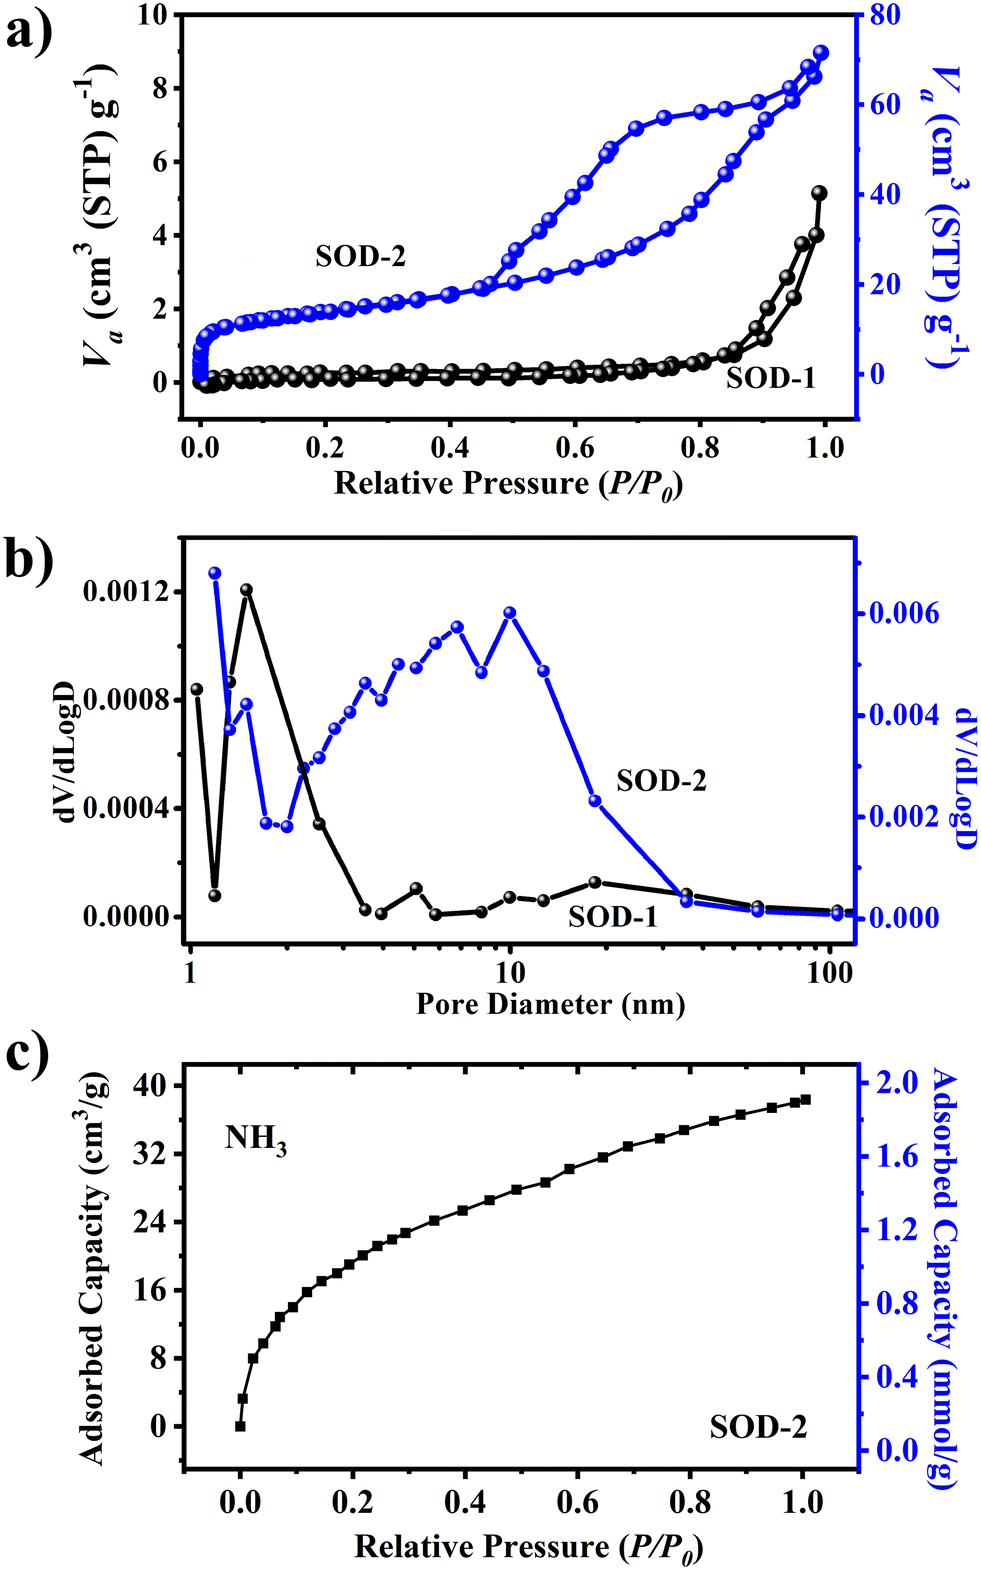
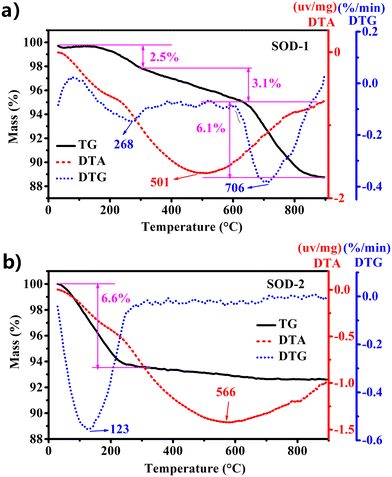
The specific surface area of sample SOD-2 recrystallized from a gel is 48.8 m2 g−1, much higher than that (only 0.8 m2 g−1) of sample SOD-1 composed of micro-sized crystals. Fig. 4(a) shows that the N2 adsorption–desorption curves of samples SOD-2 and SOD-1 are mainly attributed to the type IV isotherm with the type H3 hysteresis loop in the latter half (P/P0 = 0.5–1.0), according to the IUPAC classification.45,46 It is noteworthy that the S-sodalite of sample SOD-2 in the form of nanocrystalline microspheres features a well-developed hysteresis loop, whereas the B-sodalite of sample SOD-1 with micro-sized crystals only exhibits a slightly split hysteresis loop. The former case is commonly associated with mesoporous materials comprised of aggregates (loose assemblages) of plate-like particles forming slit-like pores.45 This suggests that the S-sodalite of sample SOD-2 has a typical mesoporous structure, which is consistent with the fact that it is composed of nanocrystalline microspheres as observed by SEM. The slightly split hysteresis loop of sample SOD-1 may be attributed to the cracks on the surface of this sample. Correspondingly, the pore size distribution for SOD-2 was ∼6.9 nm, in composition of only ∼1.8 nm for SOD-1 (Fig. 4(b)). The adsorbed amount of ammonia (NH3) by sample SOD-2 reaches 1.78 mmol g−1 at 25 °C under a pressure of 1 bar using the isotherm measurement method (Fig. 4(c)). The rapid rise of the curve at low relative pressure (P/P0) indicates that the ammonia uptake is caused by the β-cage because ammonia can efficiently permeate through the 6-membered ring window of sodalite.
 |
| | Fig. 4 Comparison of (a) N2 adsorption–desorption isotherms, (b) pore size distribution of materials, and (c) ammonia (NH3) adsorption capacity of SOD-2. | |
3.4 Removal of Cu(II) and methylene blue (MB) by surface adsorption
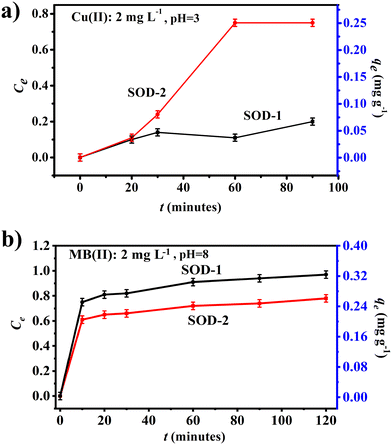
Fig. 5(a) shows that samples SOD-1 and SOD-2 have different capacities of removing Cu(II) from aqueous solutions, both approaching sorption equilibrium in 60 min for the Cu(II) solutions. The adsorption efficiency of sample SOD-2 (Ce: 75%) for the removal of Cu(II) from aqueous solutions is much higher than that of sample SOD-1 (Ce: 20%). Moreover, the removal efficiency of sample SOD-2 (qe: 0.25 mg g−1) as an adsorbent for the removal of a single adsorbate Cu(II) from aqueous solutions was superior to SOD-1 (qe: 0.07 mg g−1).
 |
| | Fig. 5 Comparison of adsorption experiments between samples SOD-1 and SOD-2. (a) Cu(II) as the adsorbate: Cu(II) = 2 mg L−1, pH = ∼3 and (b) MB as the adsorbent: C0 = 2 mg L−1, pH = ∼8. | |
Fig. 5(b) shows that both samples SOD-1 and SOD-2 can effectively remove methylene blue (MB) from aqueous solutions within 10 minutes, approaching sorption equilibrium within 120 minutes. The maximum adsorption efficiencies (Ct) of samples SOD-1 and SOD-2 are ∼97% and ∼78%, respectively. The adsorption capacities qe of samples SOD-1 and SOD-2 are 0.34 mg g−1 and 0.27 mg g−1, respectively. This reduced MB adsorption capacity of SOD-2 compared with SOD-1 is surprising but may point to the different adsorption mechanism of this molecule from that of the Cu(II) ions in aqueous solutions.47,48 We postulate that sample SOD-2 synthesized at pH 14 is more receptive to protons from acids, whereas MB is a cationic thiazine dye that is basic in nature.
The recovery and regeneration of adsorbents are crucial for resource recycling, circular economy, and environmental sustainability.49,50 Interestingly, both B-sodalite and S-sodalite are insoluble in aqueous solutions and are capable of recycling after MB adsorption. The recycled samples have been characterized by PXRD, FT-IR, and SEM analyses (Fig. 2(c) and (f)). The results showed that there are no significant differences between the pristine S-sodalite sample and its counterpart recycled after MB adsorption, indicating the high chemical stability of S-sodalite microspheres. In addition, the alkali-resistant test of sample SOD-2 also showed that S-sodalite has good chemical stability in NaOH solution (ESI† Fig. S6).
3.5 Effect of the alkalinity
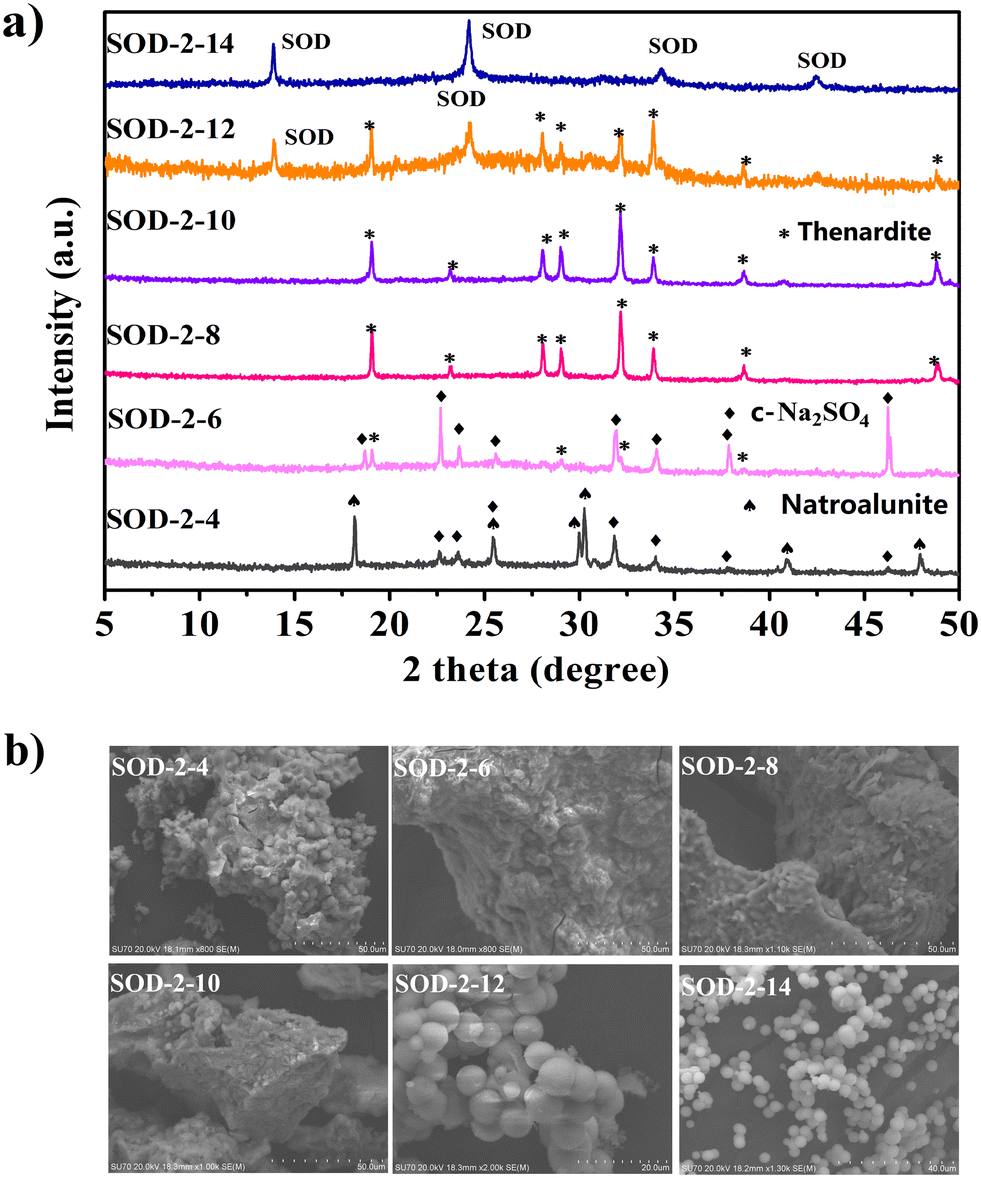
In order to determine the formation conditions of S-sodalite microspheres, six experiments were performed to establish the relationship between the pH values (4, 6, 8, 10, 12, and 14) and the resultant products. Note that the adjustment of different pH values in the reaction system was achieved by adding a NaOH solution dropwise into the acid digestion solution of SOD-1 (see Fig. 6 and ESI† Table S1). Therefore, the increased pH values from 4 to 14 result in incrementally increased Na+ contents in the system.
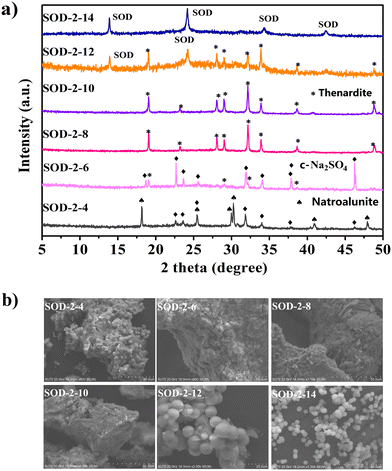 |
| | Fig. 6 Comparison of the PXRD patterns (a) and SEM images (b) of the samples (SOD-2-4, SOD-2-6, SOD-2-8, SOD-2-10, SOD-2-12, and SOD-2-14) synthesized at different pH values. The last digit, n, in the sample code of SOD-2-n represents its pH value. | |
Fig. 6(a) shows that C-Na2SO4 (Cmcm(63), PDF#79-1553)51 and natroalunite (NaAl3(SO4)2(OH)6, PDF#41-1467)52 formed in the gel recrystallization experiment at pH = 4. When the pH value reached 6, thenardite (Na2SO4, Fddd(70), PDF#37-1465)53 appeared at the expense of natroalunite. When the pH values were increased to 8 and 10, thenardite grew at the expense of C-Na2SO4 and eventually became a pure phase. Fig. 6(a) also shows that S-sodalite started to appear at the expense of thenardite in the experiment at pH = 12 and became the only solid phase at pH = 14. Therefore, pH = 14 is the optimal value for the synthesis of high-purity S-sodalite. Obviously, the formation of S-sodalite microspheres is highly dependent on the alkalinity and the content of Na+ ions.
3.6 Formation mechanism of S-sodalite microspheres
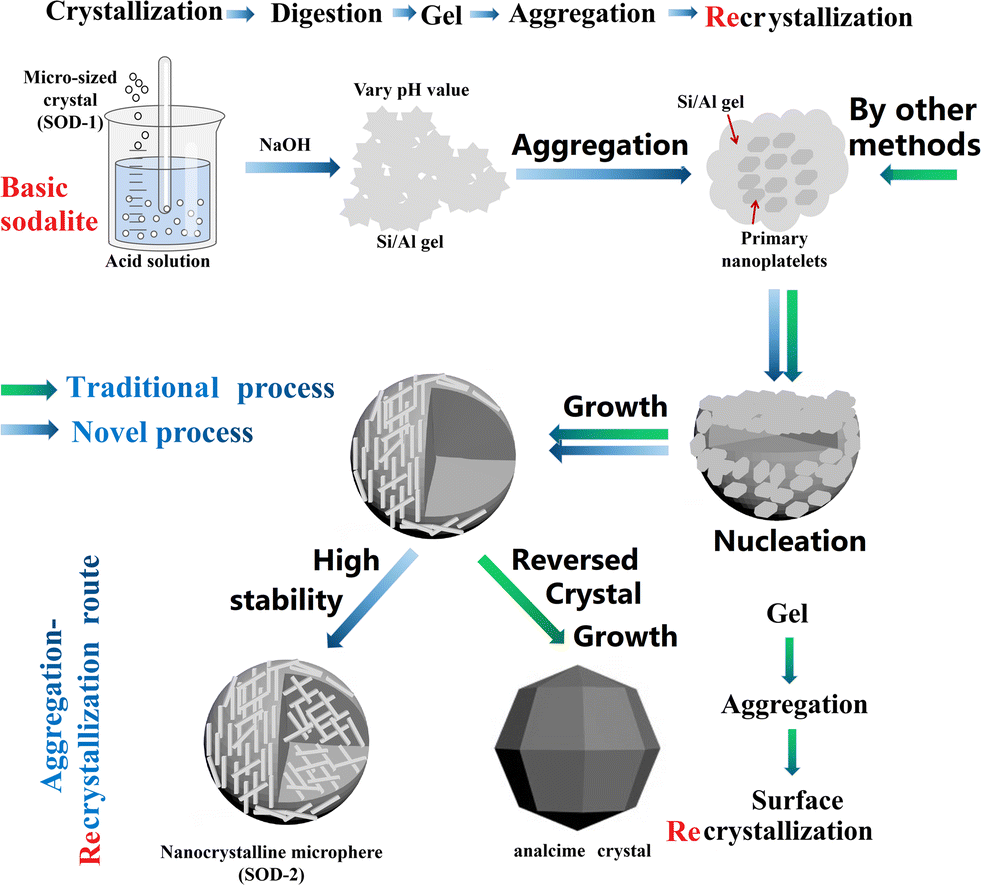
Sodalite crystals are well known to always appear in the form of dodecahedra (SOD-1 in Fig. 2).28 Therefore, the specific surface area of sodalite with the conventional morphology is generally small, which adversely limits its applications. Herein, we have developed a new facile strategy to produce sodalite microspheres composed of nanoplates with high specific surface areas by re-crystallization. This new strategy starts with the crystallization of B-sodalite from kaolin by alkali activation, followed by the preparation of a gel from B-sodalite using acid (H2SO4) digestion and alkali precipitation, and ends with the recrystallization of the gel to form microspheres of S-sodalite nanoparticles (Fig. 7). We hypothesize that the gel formed from B-sodalite had memory of some basic building units of its precursor and preserved its Si/Al atomic ratio, facilitating the formation of S-sodalite during recrystallization. Nucleation of S-sodalite could occur in the amorphous cores, followed by the growth of S-sodalite nanoplates. However, the S-sodalite nuclei were too many for further growth, resulting in the formation of the nanoplates. These nanoplates possess large surface areas and are aggregated to form the microspheres (SOD-2).54 Therefore, the formation mechanism of the S-sodalite microspheres is similar to that of analcime in the early stage of crystal growth, but is clearly different in the late stage. Analcime has been shown to undergo the so-called ‘reversed crystal growth’ process in the late stage of crystal growth,55i.e. recrystallized from the surface of aggregated microspheres to the core to develop into single crystalline polyhedra through Ostwald ripening. In contrast, S-sodalite does not undergo the Ostwald ripening process in the late stage of crystal growth, but eventually retains its morphology of nanocrystalline microspheres. We hypothesize that the fundamental reason why S-sodalite does not undergo the Ostwald ripening process in the late stage of crystallization is that it is highly stable in the alkali mother liquor. Our previous study showed that hydrothermal synthesis at an increased Si/Al molar ratio but at a constant Na/(Al + Si) molar ratio led to a change from B-sodalite to hydroxycancrinite and finally analcime.21 B-Sodalite is soluble in acid, but insoluble in alkali, while analcime is insoluble in most acids (excluding HF), but soluble in alkali. The pH-dependent experiments of the current study also suggest that alkalinity is a crucial factor controlling the formation of S-sodalite microspheres. Therefore, our proposed formation mechanism of S-sodalite may include the polymerization of the gel, nucleation, growth of nanoplates, and aggregation of nanoplates, but without Ostwald ripening in the late crystallization stage (Fig. 7). Therefore, nanocrystalline microspheres of S-sodalite were successfully prepared in alkali solutions. Buhl et al. reported their syntheses of nanocrystalline sodalite with spherical morphologies in the system of Na2O–SiO2–Al2O3–NaCl–H2O with triethanolamine (TEA).41 Our synthesis experiments are best described by the Na2O–SiO2–Al2O3–H2SO4–H2O system. The nanocrystalline spheres described in ref. 41 consist of cubic NaCl-sodalite, but nanocrystalline microspheres of trigonal sulfatic sodalite (S-sodalite) are observed in this study. The NaCl-sodalite and S-sodalite are easily distinguished in FT-IR spectra by their fingerprint vibrations located at 660–740 cm−1 (triplet) and 540–740 cm−1 (quintuplet), respectively. Moreover, additional experiments using HCl or HNO3 instead of H2SO4 as starting reagents failed to produce SOD-2, further supporting the above hypothesis that the SO42− group rather than OH− was incorporated into the structure of SOD-2.
 |
| | Fig. 7 Comparison of the formation mechanism between the nanocrystalline microspheres of S-sodalite and the icositetrahedral crystals of analcime.56 | |
4. Conclusions
This contribution is devoted to the development of a new synthesis method for the production of sodalite microspheres. Natural materials such as kaolin were used as the silica and alumina sources to prepare B-sodalite in one pot, which contains two water molecules in the formula, i.e. Na8[AlSiO4]6(OH)2·2H2O. B-Sodalite containing hydroxyl groups in the structure is not stable at high temperature because its framework collapses after the release of the hydroxyl groups above 300 °C, limiting its applications at high temperatures. Herein, we report a novel reproducible strategy for the synthesis of sulfatic sodalite nanocrystalline microspheres with high thermal stability through a crystallization–digestion–gel–recrystallization route, which is useful for applications at elevated temperatures. The prepared B-sodalite was digested in sulfuric acid, and a gel was prepared by the dropwise addition of a NaOH solution. This gel was then used for recrystallization at 100 °C to form microspheres of S-sodalite at pH = 14. TG-DTA, FT-IR and PXRD analyses show that S-sodalite has no hydroxyl group involved in its zeolite framework and has exceptionally high thermal stability of at least 900 °C. Data from EDX, FT-IR, and CHNOS elemental analysis suggest that the high thermal stability of SOD-2 is attributed to the incorporation of the SO42− group rather than OH− into its structure. Detailed PXRD, FT-IR, SEM, and BET investigations show that the S-sodalite microspheres consisting of nanoplates crystallized in the rhombohedral modification and had a much higher specific surface area than their B-sodalite precursor. The microspheres of S-sodalite nanoparticles were also shown to feature a high efficiency of Cu(II) adsorption at ∼75%, in comparison with an adsorption efficiency of 20% by the micro-sized B-sodalite. Therefore, our investigation demonstrates that the microspheres of hydrophilic S-sodalite nanoparticles can be used as a promising low-cost and effective adsorbent for water removal from mixed gases at elevated temperatures. The new method for the synthesis of sodalite microspheres is also important for the creation of new catalysts with accessible surface and active sites, as well as sorbents and other materials.
Abbreviations
| SOD | Sodalite |
| B-Sodalite | Basic sodalite |
| S-Sodalite | Sulfatic sodalite |
| W-Sodalite | Hydrosodalite |
| C-Na2SO4 | Na2SO4 of Cmcm(63) |
| MB | Methylene blue |
| PXRD | Powder X-ray diffraction |
| SEM | Scanning electron microscope |
| EDX | Energy-dispersive X-ray spectrometer |
| BET | Brunauer–Emmett–Teller |
| FT-IR | Fourier-transform infrared |
| Ref. | Reference |
Author contributions
Xiu-Zhen Xie: methodology, investigation, formal analysis, writing – original draft. Yuanming Pan: validation, visualization, writing – review & editing. Jin-Xiao Mi: conceptualization, resources, supervision, validation, writing – original draft, review & editing.
Conflicts of interest
The authors declare that they have no known competing financial interests or personal relationships that could have appeared to influence the work reported in this paper.
Acknowledgements
This work is supported by the funds from Xiamen Construction Bureau (No. XJK2019-1-12, No. XJK2021-1-23) and financial support from the Natural Science and Engineering Research Council of Canada (No. RGPIN 04106-2018). We thank two laboratories: the Xiamen Key Laboratory of Electronic Ceramic Materials and Devices and the Fujian Provincial Key Laboratory of Advanced Materials (Xiamen University) for providing test equipment.
References
- L. Pauling, Z. Kristallogr., Kristallgeom., Kristallphys., Kristallchem., 1930, 74, 213–225, DOI:10.1524/zkri.1930.74.1.213.
- B. G. Xu, P. Smith, C. Wingate and L. De Silva, Hydrometallurgy, 2010, 105, 75–81, DOI:10.1016/j.hydromet.2010.07.010.
- S. Khajavi, J. C. Jansen and F. Kapteijn, J. Membr. Sci., 2009, 326, 153–160, DOI:10.1016/j.memsci.2008.09.046.
- S. Khajavi, S. Sartipi, J. Gascon, J. C. Jansen and F. Kapteijn, Microporous Mesoporous Mater., 2010, 132, 510–517, DOI:10.1016/j.micromeso.2010.03.035.
- N. S. Gilani, S. E. Tilami and S. N. Azizi, J. Chin. Chem. Soc., 2021, 68, 2264–2273, DOI:10.1002/jccs.202100258.
- N. Kosinov, J. Gascon, F. Kapteijn and E. J. M. Hensen, J. Membr. Sci., 2016, 499, 65–79, DOI:10.1016/j.memsci.2015.10.049.
- G. Ulian and G. Valdrè, Minerals, 2022, 12, 1323, DOI:10.3390/min12101323.
- R. K. McMullan, S. Ghose, N. Haga and V. Schomaker, Acta Crystallogr., Sect. B: Struct. Sci., 1996, 52, 616–627, DOI:10.1107/S0108768196004132.
- J. Felsche and S. Luger, Ber. Bunsenges. Phys. Chem., 1986, 90, 731–736, DOI:10.1002/bbpc.19860900822.
- J. C. Buhl, Adv. Chem. Eng. Sci., 2017, 7, 277–290, DOI:10.4236/aces.2017.73021.
- M. O. Daramola, A. Dinat and S. Hasrod, J. Membr. Sep. Technol., 2015, 4, 1–7, DOI:10.6000/1929-6037.2015.04.01.1.
- W. Depmeier, Rev. Mineral. Geochem., 2005, 57, 203–240, DOI:10.2138/rmg.2005.57.7.
- M. E. Fleet, Acta Crystallogr., Sect. C: Cryst. Struct. Commun., 1989, 45, 843–847, DOI:10.1107/s0108270188013964.
- R. X. Fischer and W. H. Baur, Z. Kristallogr., 2009, 224, 185–197, DOI:10.1524/zkri.2009.1147.
- A. Stein, G. A. Ozin, P. M. Macdonald, G. D. Stucky and R. Jelinek, J. Am. Chem. Soc., 1992, 114, 5171–5186, DOI:10.1021/ja00039a032.
- S. Khajavi, J. C. Jansen and F. Kapteijn, J. Membr. Sci., 2010, 356, 52–57, DOI:10.1016/j.memsci.2010.03.026.
- N. Wang, Y. Liu, A. Huang and J. Caro, Microporous Mesoporous Mater., 2014, 192, 8–13, DOI:10.1016/j.micromeso.2013.08.013.
- E. C. Moloy, R. T. Cygan, F. Bonhomme, D. M. Teter and A. Navrotsky, Chem. Mater., 2004, 16, 2121–2133, DOI:10.1021/cm0352302.
- J. Felsche and S. Luger, Thermochim. Acta, 1987, 118, 35–55, DOI:10.1016/0040-6031(87)80069-2.
- G. Engelhardt, J. Felsche and P. Sieger, J. Am. Chem. Soc., 1992, 114, 1173–1182, DOI:10.1021/ja00030a008.
- L.-J. Tang, X.-Z. Xie, Y.-X. Huang, Y. M. Pan and J.-X. Mi, Mater. Chem. Phys., 2022, 290, 126570, DOI:10.1016/j.matchemphys.2022.126570.
- A. P. Khomyakov, T. N. Nadezhdina, R. K. Rastzvetaeva and E. A. Pobedimskaya, Zap. Vseross. Mineral. O-va., 1992, 121, 100–105 Search PubMed.
- P. Zhu, Y. Zhang, C. Liu, J. S. Wang, Y. F. Zhang, W. Zhang, H. O. Liu and X. F. Zhang, CrystEngComm, 2021, 23, 6892–6898, 10.1039/d1ce01005k.
- P. Wang, X. Xiao, Y. T. Pan, Z. Zhao, G. Y. Jiang, Z. D. Zhang, F. F. Meng, Y. M. Li, X. Q. Fan, L. Kong and Z. A. Xie, Catalysts, 2022, 12, 351, DOI:10.3390/catal12030351.
- J. F. Yao, L. X. Zhang and H. T. Wang, Mater. Lett., 2008, 62, 4028–4030, DOI:10.1016/j.matlet.2008.05.053.
- J. Q. Wang, Y. X. Huang, Y. M. Pan and J. X. Mi, Microporous Mesoporous Mater., 2014, 199, 50–56, DOI:10.1016/j.micromeso.2014.08.002.
- J. Q. Wang, Y. X. Huang, Y. M. Pan and J. X. Mi, Microporous Mesoporous Mater., 2016, 232, 77–85, DOI:10.1016/j.micromeso.2016.06.010.
- I. Hassan and H. D. Grundy, Acta Crystallogr., Sect. C: Cryst. Struct. Commun., 1983, 39, 3–5, DOI:10.1107/S0108270183003406.
- R. J. Hill, Phys. Chem. Miner., 1979, 5, 179–200 CrossRef CAS.
-
G. G. Lindner, Farbe, Elektronenstruktur und Konstitution ultramarinartiger Zeolithe mit eingelagerten Chalkogenspezies sowie ein Anhang über Synthese und magnetische Untersuchungen von einkristallinem Cu2(NO3)(OH)3, in Ph. D. Dissertation, Univ. of Marburg, Germany, 1994, p. 181 Search PubMed.
- M. C. Barnes, J. Addai-Mensah and A. R. Gerson, Microporous Mesoporous Mater., 1999, 31, 287–302, DOI:10.1016/s1387-1811(99)00079-7.
- H. D. Grundy and I. Hassan, Can. Mineral., 1982, 20, 239–251 CAS.
- I. Hassan and H. D. Grundy, Can. Mineral., 1989, 27, 165–172 CAS.
- F. Bellatreccia, G. D. Ventura, M. Piccinini, A. Cavallo and M. Brilli, Mineral. Mag., 2009, 73, 399–413, DOI:10.1180/minmag.2009.073.3.399.
- W. Fan, K. Morozumi, R. Kimura, T. Yokoi and T. Okubo, Langmuir, 2008, 24, 6952–6958, DOI:10.1021/la703838j.
- X.-Z. Xie, X. Liang, Y. M. Pan and J.-X. Mi, Chemosphere, 2022, 309, 136741, DOI:10.1016/j.chemosphere.2022.136741.
- J. Yang, Y. X. Huang, Y. M. Pan and J. X. Mi, Microporous Mesoporous Mater., 2020, 303, 110247, DOI:10.1016/j.micromeso.2020.110247.
- K. Hackbarth, T. M. Gesing, M. Fechtelkord, F. Stief and J. C. Buhl, Microporous Mesoporous Mater., 1999, 30, 347–358, DOI:10.1016/S1387-1811(99)00046-3.
- N. V. Chukanov, A. N. Sapozhnikov, R. Y. Shendrik, M. F. Vigasina and R. Steudel, Minerals, 2020, 10, 1042, DOI:10.3390/min10111042.
-
K. Nakamoto, Infrared and Raman Spectra of Inorganic and Coordination Compounds, in Handbook of Vibrational Spectroscopy, John Wiley & Sons, Ltd., 2006, pp. 1872–1892 Search PubMed.
- J.-C. Buhl, K. Schuster and L. Robben, Microporous Mesoporous Mater., 2011, 142, 666–671, DOI:10.1016/j.micromeso.2011.01.020.
- J. J. Pluth and J. V. Smith, J. Phys. Chem., 1979, 83, 741–749, DOI:10.1021/j100469a021.
- H. Saalfeld and M. Wedde, Z. Kristallogr., Kristallgeom., Kristallphys., Kristallchem., 1974, 139, 129–135, DOI:10.1524/zkri.1974.139.16.129.
- J. Felsche, S. Luger and C. Baerlocher, Zeolites, 1986, 6, 367–372, DOI:10.1016/0144-2449(86)90064-3.
- M. Kruk and M. Jaroniec, Chem. Mater., 2001, 13, 3169–3183, DOI:10.1021/cm0101069.
- K. S. W. Sing, D. H. Everett, R. A. W. Haul, L. Moscou, R. A. Pierotti, J. Rouquerol and T. Siemieniewska, Pure Appl. Chem., 1985, 57, 603–619, DOI:10.1351/pac198557040603.
- D. Ghosh and K. G. Bhattacharyya, Appl. Clay Sci., 2002, 20, 295–300, DOI:10.1016/S0169-1317(01)00081-3.
- N. H. Thang, D. S. Khang, T. D. Hai, D. T. Nga and P. D. Tuan, RSC Adv., 2021, 11, 26563–26570, 10.1039/D1RA04672A.
- A. V. Baskar, N. Bolan, S. A. Hoang, P. Sooriyakumar, M. Kumar, L. Singh, T. Jasemizad, L. P. Padhye, G. Singh, A. Vinu, B. Sarkar, M. B. Kirkham, J. Rinklebe, S. S. Wang, H. L. Wang, R. Balasubramanian and K. H. M. Siddique, Sci. Total Environ., 2022, 822, 153555, DOI:10.1016/j.scitotenv.2022.153555.
- Q. M. Hu, Y. X. Huang, W. Y. Zhang, G. T. Shao, Y. Xu, Y. H. Zhang, Y. M. Pan and J. X. Mi, Waste Manage., 2023, 163, 144–153, DOI:10.1016/j.wasman.2023.03.028.
- K. Tanaka, H. Naruse, H. Morikawa and F. Marumo, Acta Crystallogr., Sect. B: Struct. Sci., 1991, 47, 581–588 CrossRef.
- A. E. Schoch, G. J. Beukes, W. A. van der Westhuizen and H. de Bruiyn, S. Afr. J. Geol., 1989, 92, 20–28 CAS.
- H. McMurdie, M. Morris, E. Evans, B. Paretzkin, W. Wong-Ng and Y. Zhang, Powder Diffr., 1986, 1, 344 CrossRef.
- B. J. Schoeman, Microporous Mesoporous Mater., 1998, 22, 9–22, DOI:10.1016/s1387-1811(98)00080-8.
- X. Y. Chen, M. H. Qiao, S. H. Xie, K. N. Fan, W. Z. Zhou and H. Y. He, J. Am. Chem. Soc., 2007, 129, 13305–13312, DOI:10.1021/ja074834u.
- W. Z. Zhou, Adv. Mater., 2010, 22, 3086–3092, DOI:10.1002/adma.200904320.
|
| This journal is © The Royal Society of Chemistry 2024 |
Click here to see how this site uses Cookies. View our privacy policy here. 
 *a
*a