 Open Access Article
Creative Commons Attribution 3.0 Unported Licence
Perpendicular magnetic anisotropy and magneto-optical properties of Bi,Mn:YIG epitaxial films†
Jiewen
Jiang
ab,
Yun
Dai
ab,
Jiamin
Shang
ab,
Zhen
Zhang
ab,
Liangbi
Su
 ab,
Maojie
Cheng
c,
Dunlu
Sun
 *c,
A.
Stupakiewicz
d and
Anhua
Wu
 *ab
*ab
aState Key Laboratory of High Performance Ceramics and Superfine Microstructure, Shanghai Institute of Ceramics, Chinese Academy of Sciences, Shanghai 201899, China. E-mail: wuanhua@mail.sic.ac.cn
bCenter of Materials Science and Optoelectronics Engineering, University of Chinese Academy of Sciences, China
cCrystal Lab of Laser Technology Research Center, Anhui Institute of Optics and Fine Mechanics, Hefei Institutes of Physical Science, Chinese Academy of Sciences, Hefei, 230031, P. R. China. E-mail: dlsun@aiofm.ac.cn
dFaculty of Physics, University of Bialystok, Ciolkowskiego 1L, 15-245 Bialystok, Poland
First published on 29th November 2023
Abstract
Films with perpendicular magnetic anisotropy have obvious storage performance advantages, so being able to easily change the direction of magnetization of a Y3Fe5O12 (YIG) film is an important aim in the field of photo-magnetic storage. A series of Bi,Mn co-doped Y3Fe5O12 films with good crystallinity and great magneto-optical properties, were prepared via the liquid phase epitaxial method. These films are pseudomorphic structures in the substrate and have high perpendicular magnetic anisotropy. By comparing the change in the calculated magnetic anisotropy and the actual magnetic anisotropy, with Mn3+ content, we see that: the stress-induced magnetic anisotropy increases with the increase of lattice mismatch; on the other hand, with increasing Mn3+ content, the magnetostriction effect decreases first and then increases, which reflects the regulation effect of Mn3+ and lattice mismatch on the perpendicular magnetic anisotropy. Finally, the magnetic anisotropy field (>3000 Oe) is higher than that of Mn:YIG (<1000 Oe) as previously reported.
1 Introduction
Recently, ferrimagnetic garnet crystals shown potential in studies of magnetization dynamics induced by external stimuli from laser and electrical current/field pulses. Due to their room temperature magnetic ordering, high transmittance in the near-infrared band and good magneto-optical properties, Y3Fe5O12 (YIG) films have aroused extensive research interest for optical and magneto-optical device applications. In spin polarizer,1 spin-torque oscillator,2 magnonics devices,3 non-volatile photo-magnetic4 and optical-magnetic storage,5 a perpendicular magnetic anisotropic YIG film with an easily accessible out-of-plane (OP) magnetization axis is advantageous. Therefore, changing the direction of the magnetization axis of YIG films is one of the most important research directions to realize YIG functional materials in storage research.6–10 The magnetic anisotropy of the film is mainly composed of magnetocrystalline anisotropy, shape anisotropy, stress-induced anisotropy, etc. Utilizing the lattice distortion and magnetoelastic effect, the film can acquire perpendicular magnetic anisotropy (PMA),11–13 while Mn3+ ion has a strong magnetoelastic effect.14 At present, the research into Mn:YIG (MYG) has mostly concentrated on microwave fields and ceramic fields in which the Mn3+ ion is used to improve magnetic properties and reduce loss. There is only a small amount of research on changing anisotropy. For example, by growing YIG films on Y3Al5O12 (ref. 13) or quartz15 substrates with different thicknesses, it is found that the OP magnetocrystalline anisotropy reflects the tetragonal symmetry of the garnet lattice, which requires a large lattice strain. It has been suggested that doping with strong spin–orbit coupling ions such as Dy3+, Bi3+, Tm3+ induces controllable magnetic anisotropy,16 and Bi3+,Dy3+ co-doped YIG![[thin space (1/6-em)]](https://www.rsc.org/images/entities/char_2009.gif) 17 and Tm3Fe5O12 (ref. 18) have been reported that possess PMA properties; Jahn–Teller ions such as Mn3+ have also been used as dopants, and improve the magnetoelasticity of YIG
17 and Tm3Fe5O12 (ref. 18) have been reported that possess PMA properties; Jahn–Teller ions such as Mn3+ have also been used as dopants, and improve the magnetoelasticity of YIG![[thin space (1/6-em)]](https://www.rsc.org/images/entities/char_2009.gif) 14,19 (magnetostriction coefficient of pure YIG is −2.22 × 10⁻⁶ (ref. 20)). Although the PMA can be regulated by Mn3+,21 the concentration of Mn3+ required is large (x = 1.12) and the obtained magnetic anisotropy field is small. Therefore, combined with the above two methods to improve the PMA, Bi3+ can reduce the concentration of Mn3+ required for PMA. At the same time, it can raise magneto-optical properties, which is favorable for utilizing the Kerr effect to read storage information. Using such methods, YIG films with PMA can play a role in many fields, such as spintronic devices, photo-magnetic storage, magneto-optical or microwave devices, and so on.22,23
14,19 (magnetostriction coefficient of pure YIG is −2.22 × 10⁻⁶ (ref. 20)). Although the PMA can be regulated by Mn3+,21 the concentration of Mn3+ required is large (x = 1.12) and the obtained magnetic anisotropy field is small. Therefore, combined with the above two methods to improve the PMA, Bi3+ can reduce the concentration of Mn3+ required for PMA. At the same time, it can raise magneto-optical properties, which is favorable for utilizing the Kerr effect to read storage information. Using such methods, YIG films with PMA can play a role in many fields, such as spintronic devices, photo-magnetic storage, magneto-optical or microwave devices, and so on.22,23
Growth methods of YIG single crystal films include pulsed laser deposition (PLD), radio frequency magnetron sputtering (RFMS), chemical vapor deposition (CVD) and liquid phase epitaxy (LPE). Using LPE method,24 the melt creates a supersaturation state, which preferentially nucleates and grows on the single crystal substrate to directionally form the single crystal. According to the contact between the melt and the substrate, the LPE method can be divided into the tipping method,25 the rotating method26 and the dipping method,27 and the last includes the horizontal dipping method and the vertical dipping method. Compared with other methods, the LPE method has the advantages of high growth rate, easy and diverse ion doping, high crystalline quality, and the ability to prepare a thick film, which is the main choice for large area preparation and industrial production of YIG. However, the LPE method also has some problems such as: poor uniformity, rough surface, and lattice mismatch, etc.
The key questions are how Mn3+ ions and the lattice mismatch brought by Bi3+, affect the perpendicular magnetic anisotropy and how to maximize the perpendicular magnetic anisotropy of the YIG films. Therefore, we studied the change in perpendicular magnetic anisotropy with different Mn3+ content, and finally obtained film samples with good magneto-optical properties and a larger perpendicular magnetic anisotropy than reported in ref. 21.
2 Experimental
Y2O3, Fe2O3, Bi2O3, Mn2O3 powders with 4 N purity were selected as the raw materials, B2O3 and PbO were used as fluxes, in which Bi2O3 is both a flux and a dopant. After weighing the raw materials, they were milled, put into a crucible and sintered at 1350 °C for 12 h. The (111) oriented (GdCa)3(GaMgZr)5O12 (SGGG) substrate was used and is more suitable for epitaxial growth of high Bi doped YIG (BYG) than that of gadolinium gallium garnet (GGG) substrate. In this experiment, the horizontal dipping method was mainly used. We put the synthetic polycrystalline raw materials into a platinum crucible and placed in a furnace. The platinum triangle fixture was moved to the center of the crucible, so that the substrate located in the center of the melt to ensure uniform growth. The raw materials were melted and insulated for 2 h, above the saturation temperature (1200 °C), so that they fully melted and mixed. When they were cooled, the step-cooling method rather than the ultra-cooling method was adopted, resulting in higher crystalline quality, and they were dropped to below the saturation temperature to supersaturate the high temperature melt. The substrate needs to be pre-pickled and cleaned with the absolute ethyl alcohol in order to slightly erode the surface of the substrate, open the molecular bond and activate the surface, and then we placed it above the melt to preheat. The YIG films were obtained at a growth temperature (Tg) of about 1125–1175 °C, growth rotation rate (ωg) of 35–75 rpm and growth time (tg) of 2 h. After the growth, high-speed revolutions (ω) were used to remove the residual melt, and the films were treated with hydrochloric acid to further remove the residual melt. Maintaining a small angle tilt when the substrate rotates, was beneficial to remove the residual melt, and maintaining the periodic positive and negative rotation was also conducive to the uniform growth of the films. Because YIG would undergo a peritectic reaction at high temperature and is an incongruent melting compound, flux was needed to reduce the melting point in order to easily grow the single crystal. The PbO was generally used in the growth of the YIG, but in the growth of BYG, the Bi2O3 can play the role of the flux, however its viscosity is large. The combination of the two fluxes is better and can results in more Bi3+ ion doping. In addition, due to the consumption of raw material and the volatilization of PbO when growing, periodic supplements were needed to ensure the element composition consistency of the epitaxial films.The crystal structure of the films was measured using an X-ray diffractometer. The microstructure observation was performed using scanning electron microscopy. We used a physical property measurement system (SQUID) to measure the magnetization. The magneto-optical properties were studied using the Malus law.
3 Results and discussion
3.1. Growth process and process parameters
A series of (Y3−xBix)(Fe5−yMny)O12 film samples were successfully prepared using the LPE process. Table 1 shows the process parameters of epitaxial growth and composition of samples. Through trying to grow samples BYG01, BYG02a, BYG02b, BYG03, we finally found an optimal process route for preparing YIG films. By growing at 1125 °C for 1 h, stirring at 60 rpm, removing the residual melt at 120 rpm after raising the substrate, and then undergoing corrosion and polishing, we obtain samples BYG03, BMYG04, BMYG05, BMYG06 and BMYG09 with good crystalline quality (ESI† Fig. S1). Samples (BYG03, BMYG04, BMYG06, BMYG09) have different Mn3+ content (y = 0, 0.08, 0.16, 0.28, respectively) to regulate their magnetic properties. Because Bi2O3 also acts as a flux, it is difficult to precisely control the Bi3+ content.| Samples | T g/°C | t g/min | ω g/rpm | ω/rpm | Thickness/μm | x Bi(xBi%) | y Mn |
|---|---|---|---|---|---|---|---|
| a Vertical dipping. | |||||||
| BYG01 | 1000 | 120 | 100 | 400 | — | — | — |
| BYG02a | 1150 | 10 | 75 | 120 | — | — | — |
| BYG02ba | 1175 | 10 | 15 | 30 | — | — | — |
| BYG03 | 1125 | 60 | 60 | 120 | 60.2 | 0.34(11.33) | 0 |
| BMYG04 | 1125 | 60 | 60 | 120 | 35.2 | 0.19(6.33) | 0.08 |
| BMYG05a | 1125 | 90 | 45 | 75 | 19.1 | 0.25(8.33) | 0.07 |
| BMYG06a | 1125 | 60 | 45 | 75 | 20.1 | 0.11 | 0.16 |
| BMYG09 | 1125 | 60 | 60 | 120 | 55.0 | 0.10 | 0.28 |
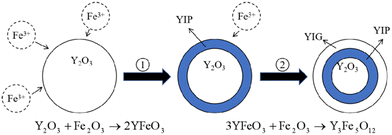
Holmquist28 has studied the YIG phase first formed at 600 °C, and the single-phase YIG was formed completely at 1200 °C (melting temperature (Tm) was 1200 °C), while Nazlan and Fang29,30 found that YIG could be fully crystallized at 1100 °C. Ali31 has studied the formation process of YIG at high temperatures, as shown in Fig. 1. From the outside to the inside, yttrium iron perovskite (YFeO3, YIP) is formed first on the surface, and then YIG is generated. Only when the temperature is higher than 1150 °C, does Fe3+ have enough energy to diffuse into the Y2O3 phase to continue the reaction. When YIP is converted to YIG, it needs to react with Fe2O3, so the iron-rich melt is easier and quicker to generate YIG. This is also confirmed in Fig. 2, which compares the XRD patterns of the raw material after solid-phase reaction, with the standard result of YIG (JCPDS: 43-0507) and YIP (JCPDS: 39-1489) and marks the peaks corresponding to the plane. We performed reactions multiple times at 1350 °C for 1 h, to completely convert the raw materials to the pure YIG phase.
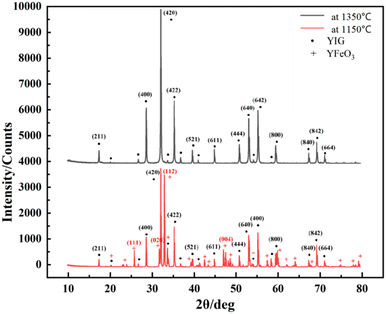 | ||
| Fig. 2 XRD patterns of raw material after solid-phase reaction at high temperature (1350 °C) and low temperature (1150 °C). | ||
We compared the growth rates of the vertical dipping and the horizontal dipping and their effects on defects. With the increase of growth rate, the Bi3+ content increased, the lattice tensile stress decreased, and the morphology of defects changed from cracks to pits.32–34 The pits slightly increase the optical absorption, but have little impact on the magnetic properties, horizontal dipping can be used to improve the crystalline quality of the YIG films.
3.2. Lattice mismatch and perpendicular magnetic anisotropy
Fig. 3 shows the XRD patterns of the films. It shows that the samples have only one peak (444) (Fig. 3(a)), indicating that the epitaxial growth is good, and the growth direction of samples is along the direction of the substrate (by calculation, the left peak is Kα1, and the right peak is Kα2). Through locally enlarged patterns of 50–52°, it can be found that with the increase of Bi3+ content, the diffraction peaks shift to the left and the lattice constant increase, see Fig. 3(b). This indicates that large-size ions (Bi3+) basically enter the lattice to replace Y3+. The lattice mismatch between the epitaxial film and the substrate is less than 1% (generally, the lattice mismatch of heteroepitaxy is less than 5–10%,35 and high-quality YIG films require GGG substrates with similar structures and a very small lattice mismatch (<0.06%)36).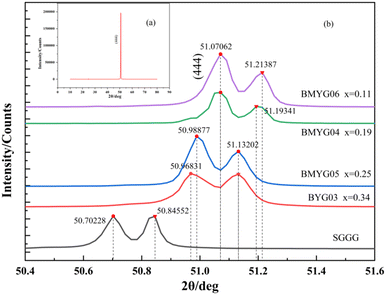 | ||
| Fig. 3 (a) XRD patterns of the samples (BYG03, BMYG04, BMYG05, BMYG06), (b) locally enlarged XRD patterns of the samples from 50° to 52°. | ||
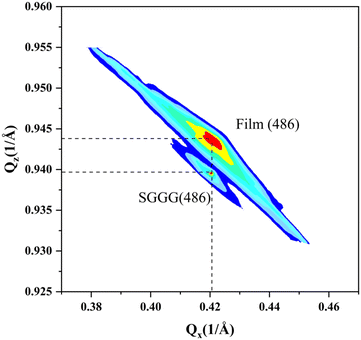
The reciprocal space mapping shows that the films have a pseudomorphic structure (see Fig. 4). The in-plane lattice constant of the films is equal to that of the substrate. On the one hand, the formation of this pseudomorphic structure is caused by the lattice mismatch between the films and the substrate, on the other hand the magnetostriction effect also plays a role.
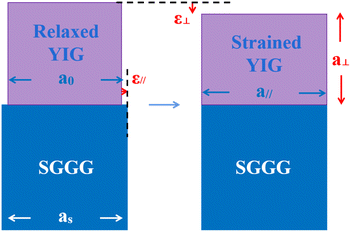
For epitaxial films, the YIG is paramagnetic above the Curie temperature. When the temperature is lower than the Curie temperature, spontaneous magnetization is generated due to the exchange interaction, thus generating spontaneous magnetostriction. Since the magnetostriction coefficient of pure YIG is negative, the lattice will be compressed along the direction of magnetization. Since all the prepared samples have PMA except BMYG04 (see Fig. 6), the direction of magnetization is in the perpendicular direction, which facilitates the horizontal stretching and the formation of pseudomorphic structures, see Fig. 5. For sample BMYG04, the effect is the opposite, so we have a negative value when calculating the contribution of its magnetostriction to the magnetic anisotropy. We first consider the surface effect on the magnetic anisotropy of the sample. According to the formula37,38Etotal = (γs + γi)/h + Mhklε2 (where h is the thickness of the sample), the surface effect is inversely proportional to the thickness of the sample, which means that the surface effect in YIG is only about one thousandth that of the literature values and is negligible.
According to the theory of pseudomorphic structures,39 we can calculate parameters such as lattice mismatch and lattice strain. The calculation procedure is shown in the ESI† (eqn (S1)–(S7)), and the results are shown in Table 2. The calculated in-plane lattice constants of the films are basically consistent with those of the substrate, which verifies the correctness of the theory and parameter values. Since the in-plane lattice strain of the YIG films is within 0–0.5%,40 stress-induced perpendicular magnetic anisotropy is more easily generated. Later we use these data to further calculate the value of the stress-induced magnetic anisotropy.
| Samples | 2θ/deg | a f⊥/Å | a f0/Å | 104ε// | σ ///GPa | Lattice mismatch/% | a f///Å |
|---|---|---|---|---|---|---|---|
| BYG03 | 50.96831 | 12.400 | 12.428 | +26.674 | +0.754 | −0.281 | 12.461 |
| BMYG05 | 50.98877 | 12.398 | 12.427 | +27.628 | +0.781 | −0.289 | 12.461 |
| BMYG04 | 51.07062 | 12.3815 | 12.418 | +34.799 | +0.983 | −0.361 | 12.461 |
| BMYG06 | 51.07062 | 12.379 | 12.416 | +35.281 | +0.997 | −0.377 | 12.460 |
| BMYG09 | 51.05016 | 12.3865 | 12.4205 | +0.32409 | +0.916 | −0.341 | 12.461 |
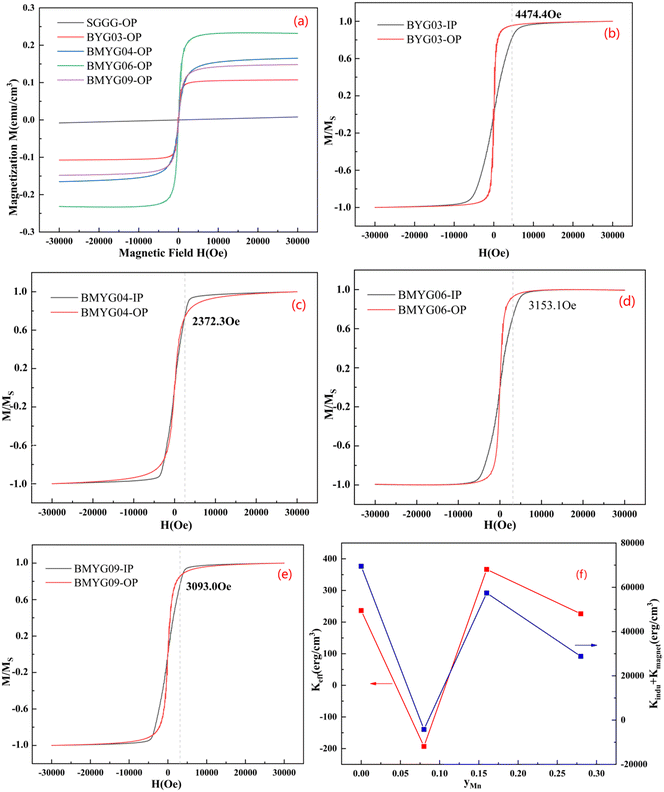
Fig. 6 shows the hysteresis loops of the YIG epitaxial films. It can be seen from Fig. 6(a) that all samples exhibit strong saturation magnetization and low coercivity, indicating the soft magnetic properties of the YIG materials. The saturation magnetization increases first and then decreases with increasing Mn3+ content, indicating that Mn3+ ions preferentially occupy the octahedral sites, because the magnetic moment of Mn3+ is smaller than that of Fe3+. We measured the hysteresis loops of the samples in the IP and OP directions at room temperature, as shown in Fig. 6(b–e). Except for BMYG04, the samples show a large PMA. With the increase of Mn3+ content, the magnetic anisotropy field of the samples changes. On the one hand, the Bi3+ content decreases and the lattice strain increases. And the positive in-plane lattice tensile strain (0 < ε// < 0.5%)39 makes the OP magnetic anisotropy stronger. On the other hand, the Mn3+ ion makes the magnetoelastic coefficient of the samples change from negative to positive and its absolute value becomes smaller, which makes the OP magnetic anisotropy lower. So both lead to the phenomenon of BMYG04 not having PMA. In contrast to the contribution of large-size ions (Bi3+) to PMA, the magnetoelastic ions (Mn3+) do not directly change the lattice constant and do not reduce the crystallinity.
From the above theoretical model, we calculate the magnetic anisotropy caused by the lattice mismatch and magnetostriction and compare it with the actual magnetic anisotropy. The calculation procedure of the magnetic anisotropy is shown in the ESI† (eqn (S8)–(S10), Table S2, Fig. S2). The actual magnetic anisotropy and calculated magnetic anisotropy first decrease and then increase with the increase of Mn3+ content, reflecting the regulatory effect of Mn3+ and lattice mismatch on PMA. On the one hand, with the increase of lattice mismatch, the stress-induced magnetic anisotropy increases; on the other hand, with the increase of Mn3+ content, the magnetoelastic constant changes from negative to positive, and the magnetostriction effect decreases first and then increases. From the comparison of the magnetic anisotropy constant and the magnetic anisotropy field (see Fig. S1†), we can see that the decrease of the magnetic anisotropy of sample BMYG09 is mainly caused by the decrease of its saturation magnetization. Because its magnetic anisotropy field is basically unchanged. Finally, the magnetic anisotropy field (>3000 Oe) is higher than that of Mn:YIG (<1000 Oe) as reported in the ref. 21.
3.3. Transmittance spectrum and magneto-optical hysteresis loops
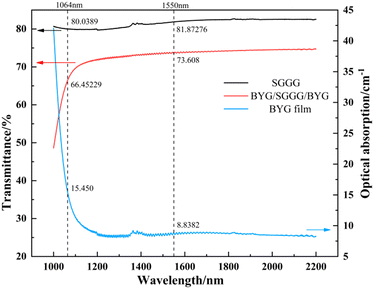
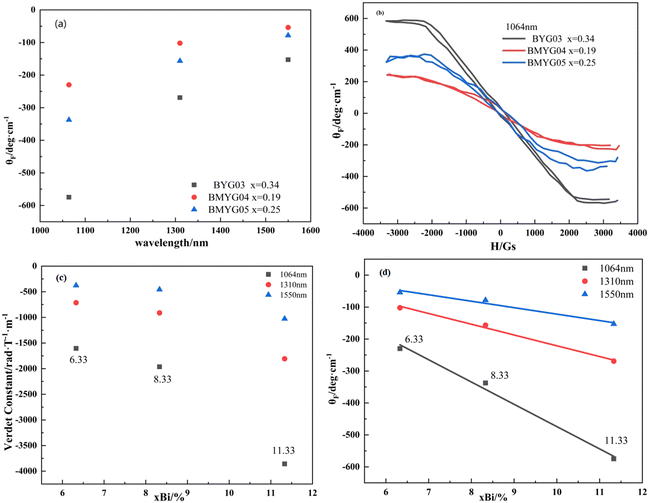
Fig. 7 shows the transmittance spectrum of the epitaxial films at wavelength 1000–2200 nm. The transmittance of the samples is 73.608% at 1550 nm, and the optical absorption coefficient at 1550 nm calculated without considering the reflection is 8.838 cm−1. The film has no obvious absorption peak at wavelength 1200–2200 nm and has a low absorption coefficient,41 which is favorable for magneto-optical applications.Fig. 8 shows the Faraday effect of the samples BYG03, BMYG04 and BMYG05. It can be described by the Verdet constant and the specific Faraday rotation angle as
| θ = VHL | (1) |
| θF = θ/L | (2) |
4 Conclusions
In summary, a series of Bi and Mn co-doped Y3Fe5O12 epitaxial films with good magneto-optical properties and good perpendicular magnetic anisotropy, were successfully prepared using the liquid phase epitaxy method. The results obtained are as follows:1. To improve the crystalline quality, Bi,Mn co-doped YIG films were obtained using methods such as reacting multiple times at 1350 °C for 1 h to completely convert the raw materials to a pure YIG phase, horizontal dipping.
2. The prepared films have greater perpendicular magnetic anisotropy than those found in the literature. By comparing the changes of the calculated value and the actual value with Mn3+ content: on the one hand, the stress-induced magnetic anisotropy increases with the increase of lattice mismatch; on the other hand, with the increase of Mn3+ content, the magnetostriction effect decreases first and then increases, which reflects the regulation effect of Mn3+ and lattice mismatch on the perpendicular magnetic anisotropy. So we believe that the perpendicular magnetic anisotropy will be stronger with the increase of the Mn3+ content, which will facilitate the application of YIG materials in spintronic devices or magneto-optical storage.
3. Bi3+ can improve the magneto-optical properties of the YIG materials. The specific Faraday rotation angle and the Verdet constant of Bi,Mn:YIG are −574.75 deg cm−1 and −3858.18 rad/(T × m) at 1064 nm, and the specific Faraday rotation angle is proportional to the Bi3+ content.
Author contributions
J. J., A. W., L. S., and D. S. conceived the project, wrote the paper, and were primarily responsible for the experiment. J. J., Y. D., and M. C. were responsible for the growth of YIG films. J. J., Z. Z., and J. S. carried out the experiments on transmittance and magneto-optical performance. J. J., and A. S. were responsible for the discussion of the effects of ion doping on magneto-optical properties and perpendicular magnetic anisotropy. All authors have given approval to the final version of the manuscript.Conflicts of interest
There is no conflict of interest in this manuscript.Acknowledgements
This work was supported by the National Key R&D Program of China (2021YFB3602503), the National Natural Science Foundation of China (52272014), Science and Technology Commission of Shanghai Municipality (21520711300, 20520750200). This work was also supported by the CAS Project for Young Scientists in Basic Research (YSBR-024) and the International Partnership Program of Chinese Academy of Sciences (121631KYSB20200039).References
- A. D. Kent, B. Ozyilmaz and E. del Barco, Appl. Phys. Lett., 2004, 84, 3897–3899 CrossRef CAS.
- D. Houssameddine, U. Ebels, B. Delaet, B. Rodmacq, I. Firastrau, F. Ponthenier, M. Brunet, C. Thirion, J. P. Michel and L. Prejbeanu-Buda, et al. , Nat. Mater., 2007, 6, 447–453 CrossRef CAS PubMed.
- V. Kruglyak, S. Demokritov and D. Grundler, J. Phys. D: Appl. Phys., 2010, 43, 264001 CrossRef.
- A. Stupakiewicz, K. Szerenos, D. Afanasiev, A. Kirilyuk and A. V. Kimel, Nature, 2017, 542, 71 CrossRef CAS.
- O. Kamada, T. Nakaya and S. Higuchi, Sens. Actuators, A, 2005, 119, 345–348 CrossRef CAS.
- X. L. Zhang, Y. B. Tang, F. Zhang and C. S. Lee, Adv. Energy Mater., 2016, 6, 1502588 CrossRef.
- S. E. Shirsath, C. Cazorla, T. Lu and D. Y. Wang, Nano Lett., 2020, 20, 1262–1271 CrossRef CAS PubMed.
- S. E. Shirsath, J. Zhang, N. Kumar and W. Walukiewicz, ACS Nano, 2022, 16, 15413–15424 CrossRef CAS.
- I. Muhammad, A. Ali, L. G. Zhou, W. Zhang, P. Kwan and J. Wong, J. Alloys Compd., 2022, 909, 164797 CrossRef CAS.
- J. Zhang, X. C. Wang, L. Zhou, G. X. Liu and W. Wu, Adv. Mater., 2022, 34, 2106728 CrossRef CAS.
- X. Liu, W. L. Lim, Z. Ge, S. Shen, M. Dobrowolska, J. K. Furdyna, T. Wojtowicz, K. M. Yu and W. Walukiewicz, Appl. Phys. Lett., 2005, 86, 112512 CrossRef.
- C. H. Du, R. Adur, H. L. Wang, A. J. Hauser, F. Y. Yang and P. C. Hammel, Phys. Rev. Lett., 2013, 110, 147204 CrossRef.
- H. L. Wang, C. H. Du, P. C. Hamme and F. Y. Yang, Phys. Rev. B: Condens. Matter Mater. Phys., 2014, 89, 134404 CrossRef.
- G. F. Dionne, IEEE Trans. Magn., 2011, 47, 272–278 CAS.
- E. Popova, N. Keller, F. Gendron, L. Thomas, M. C. Brianso, M. Guyot, M. Tessier and S. S. P. Parkin, J. Vac. Sci. Technol., 2001, 19, 2567–2570 CrossRef CAS.
- A. Kehlberger, K. Richter, M. C. Onbasli, G. Jakob, D. H. Kim and T. Goto, et al. , Phys. Rev. Appl., 2015, 4, 014008 CrossRef.
- K. Maeto, A. Itoh, S. Koike and F. Inoue, IEEE Trans. Magn., 1987, 2, 784–790 Search PubMed.
- M. Kubota, A. Tsukazaki, F. Kagawa, K. Shibuyay, Y. Tokunaga, M. Kawasaki and Y. Tokura, Appl. Phys. Express, 2012, 5, 103002 CrossRef.
- G. F. Dionne, J. Appl. Phys., 1979, 50, 4263–4272 CrossRef CAS.
- E. R. Callen, W. Coleman, A. E. Clarkand, B. Desavage and H. B. Callen, Phys. Rev., 1963, 130, 1735 CrossRef.
- C. T. Wang, X. F. Liang, Y. Zhang, X. Liang and Y. P. Zhu, et al. , Phys. Rev. B, 2017, 96, 224403 CrossRef.
- R. B. Borade, S. B. Kadam, D. S. Wagare, R. H. Kadam and S. E. Shirsath, et al. , J. Mater. Sci.: Mater. Electron., 2019, 30, 19782–19791 CrossRef CAS.
- R. B. Borade, S. E. Shirsath, G. Vats, A. S. Gaikwad and S. M. Patange, et al. , Nanoscale Adv., 2019, 1, 403–413 RSC.
- M. Copel, M. C. Reuter, E. Kaxiras and R. M. Tromp, Phys. Rev. Lett., 1989, 63, 632–635 CrossRef CAS PubMed.
- H. Nelson, RCA Rev., 1963, 24, 603–615 Search PubMed.
- J. Vilms and J. Garrett, Solid-State Electron., 1972, 15, 443–455 CrossRef CAS.
- S. Blank and J. Nielsen, J. Cryst. Growth, 1972, 17, 302–311 CrossRef CAS.
- W. R. Holmquist, C. F. Kooi and R. W. Moss, J. Am. Ceram. Soc., 1961, 44, 194–196 CrossRef CAS.
- M. H. Fang, J. T. Huang, Z. H. Huang, Y. G. Liu, B. Jiang and P. Peng, Key Eng. Mater., 2008, 368, 588–590 Search PubMed.
- R. Nazlan, M. Hashim, N. H. Abdullah, I. R. Ibrahim and I. Ismail, Adv. Mater. Res., 2012, 501, 324–328 CAS.
- W. Ali, M. Othman, M. F. Ain, N. S. Abdullah and Z. A. Ahmad, J. Am. Ceram. Soc., 2016, 99, 315–323 CrossRef.
- R. Hergt, Cryst. Res. Technol., 1980, 15, 673–682 CrossRef CAS.
- P. Goernert and F. W. Voigt, High temperature solution growth of garnets: theoretical models and experimental results, 1984 Search PubMed.
- I. I. Syvorotka, I. M. Syvorotka and S. B. Ubizskii, Solid State Phenom., 2013, 200, 250–255 Search PubMed.
- Z. H. Zhang, X. N. Yang, K. H. Liu and R. M. Wang, Adv. Sci., 2022, 9, 2105201 CrossRef CAS.
- T. Aichele, A. Lorenz, R. Hergt and P. Gornert, Cryst. Res. Technol., 2003, 38, 575–587 CrossRef CAS.
- S. E. Shirsath, X. X. Liu, Y. Yasukawa and S. Li, et al. , Sci. Rep., 2016, 6, 30074 CrossRef CAS.
- S. E. Shirsath, D. Y. Wang, J. Zhang and A. Morisako, et al. , ACS Appl. Electron. Mater., 2020, 11, 3650–3657 CrossRef.
- M. Mermoux, A. Crisci, F. Baillet and V. Destefanis, et al. , J. Appl. Phys., 2010, 107, 013512 CrossRef.
- M. Kubota, K. Shibuya and Y. Tokunaga, et al. , J. Magn. Magn. Mater., 2013, 339, 63–70 CrossRef CAS.
- Z. Shun, H. Xiyun, Z. Xia, Q. Pingsun, L. Liang and S. Dazhi, J. Inorg. Mater., 2022, 37, 773–779 CrossRef.
- G. A. Allen and G. F. Dionne, J. Appl. Phys., 1993, 73, 6130–6132 CrossRef CAS.
- A. Ikesue and Y. L. Aung, J. Am. Ceram. Soc., 2018, 101, 5120–5126 CrossRef CAS.
- A. Chakravarty, PhD, Michigan Technological University, 2015 Search PubMed.
Footnote |
| † Electronic supplementary information (ESI) available. See DOI: https://doi.org/10.1039/d3ce00760j |
| This journal is © The Royal Society of Chemistry 2024 |

