Assembly of MnIII ions into di-, tetra-, deca-nuclear coordination complexes, zero- to three-dimensional molecular frameworks: molecular spin flop to and short-range bulk magnetic spin flop ordering†
Jayasree
Kumar
a,
Ibtesham
Tarannum
 b,
Yan-Zhen
Zheng
 *c,
Saurabh Kumar
Singh
 *b and
Kartik Chandra
Mondal
 *a
*a
aDepartment of Chemistry, Indian Institute of Technology Madras, Chennai, India. E-mail: csdkartik@iitm.ac.in
bDepartment of Chemistry, Indian Institute of Technology Hyderabad, Kandi, Sangareddy, Telangana 502285, India
cFrontier Institute of Science and Technology, Xi'an Jiaotong University, 99 Yanxiang Road, Xi'an, Shaanxi 710054, P. R. China
First published on 16th November 2023
Abstract
Octahedral MnIII ions possess significant magnetic anisotropy due to second-order orbital contribution combined with Jahn–Teller distortion. This study reports the influence of O2N/O3N-donor ligands (H2L1, H2L2, H2L3, and H3L4) towards the coordination compound structures and their reaction with Mn(OAc)2·4H2O, leading to the isolation of complexes with different nuclearities, such as four MnIII ions containing [MnIII4(μ3-O)2(L1)2(OAc)4(HOMe)4] (1), dimeric [MnIII2(L2)2(μ-OMe)2(HOMe)2] (2), 2D multinuclear coordination polymer [MnIII(L3)(OMe)]n (3), and a decanuclear crown-like complex [Mn10(L4)10(L4O)2(DMF)4(MeOH)4(H2O)2] (4), respectively. Complexes 1 and 2 exist in tetrameric and dimeric forms in the crystal lattice with tetra and binuclear MnIIIO cores, respectively, while 3 forms a 2D polymeric network. Complex 4 reveals a macrocyclic crown-like topology. The temperature-dependent magnetic susceptibilities have been investigated for these complexes in the temperature range of 1.8–300 K under an applied dc magnetic field of 1000 Oe. The MnIII ions of all complexes are antiferromagnetically coupled. Tetranuclear complex 1 shows spin flop type behavior, which purely arises from its molecular origin above a critical dc field of 32![[thin space (1/6-em)]](https://www.rsc.org/images/entities/char_2009.gif) 000 Oe at low temperature due to some extent of spin frustration in the MnIII4O6 core with two sets of orthogonal Jahn-Teller axes. The 2D MnIII-polymer 3 displays conventional spin flop due to bulk magnetic ordering below 11 K. The macrocyclic crown-like complex 4 exhibits strong antiferromagnetic coupling between the MnIII-ions. In addition, ab initio calculations were performed to prove the spin flop behavior in 1. The spin–flop type behavior in 1 and 3 was confirmed by field-dependent heat capacity measurements. The sigmoidal shape of the M vs. H plot of 1 was also further supported by ab initio calculations.
000 Oe at low temperature due to some extent of spin frustration in the MnIII4O6 core with two sets of orthogonal Jahn-Teller axes. The 2D MnIII-polymer 3 displays conventional spin flop due to bulk magnetic ordering below 11 K. The macrocyclic crown-like complex 4 exhibits strong antiferromagnetic coupling between the MnIII-ions. In addition, ab initio calculations were performed to prove the spin flop behavior in 1. The spin–flop type behavior in 1 and 3 was confirmed by field-dependent heat capacity measurements. The sigmoidal shape of the M vs. H plot of 1 was also further supported by ab initio calculations.
1. Introduction
The coordination chemistry of transition metals with N and O donating ligands has received significant importance in the field of molecular magnetism, catalysis, and bio-inorganic chemistry owing to the structural diversities and mixed-valence states of the metal ions.1–3 The coordination polymeric complexes are suitable candidates to study/understand engrossing magnetic phenomena, such as spin canting and spin flop. The arrangement of anti-ferromagnetic spins, having magnetic anisotropy in a non-collinear/tilted fashion in a series of sub-lattices without being exactly parallel, is known as spin canting. A spin flop transition is expected to take place when the applied magnetic field is parallel to the easy-axis, leading the spins to rotate in a direction perpendicular to the applied magnetic field.4–6 Previously, several other studies have already shed light on such interesting magnetic features associated with the geometry and their structure-based properties. Zhao et al. investigated the anti-ferromagnetic spin canting in the CoII4(μ3-OH)2 framework due to the significant anisotropy of the CoII ions. A spin flop behavior was also shown by a 2D butterfly core comprising a MnII4(μ3-OH)2 clustering unit with significantly distorted octahedral MnII ions, which was identified by an S-shaped magnetization curve.6 Structural distorsion from perfect octaderal geometry induces zero-field splitting.6 Zhang et al. observed the field-induced spin flop transition in a 2D coordination polymeric network of {[Mn(cpdba)(H2O)3]·H2O}n.7 Large magnetic anisotropy in a magnetic polymer leads to a spin canting phenomenon while presence of a weak magnetic anisotropy prefers spin flop behavior.4–7 The magnetic polymers of the Co(II) ions thus often display spin canting due to a significant amount of magnetic anisotropy originating from the first-order orbital angular momentum and/or spin–orbit coupling of the Co(II) ions. The spin canting and/or spin frustration can lead to the complex magnetic behavior10 in zero-dimensional polynuclear metal complexes.8–10 Much attention and research interest have been paid in the past towards synthesizing higher valence manganese (Mn) complexes, ensuring a high-spin ground state.8–15 The presence of unpaired electrons in the MnIII-complexes with Jahn–Teller distortion makes them suitable ingredient for magnetic clusters to display engrossing slow relaxation of magnetization possessing a moderate spin ground state (S = 10–12) and favourable uni-axial magnetic anisotropy.16–18 The captivating magnetic phenomena are observed due to the inter-ion magnetic exchange interactions and the desirable single-ion magnetic anisotropy of the MnIII ion.16–18 The exchange interactions such as superexchange and double exchange can be best understood in the phenoxo-bridged metal complexes.19–21 Earlier reports suggest that the magnetic properties of the phenoxo-bridged MnIII complexes depend on various structural parameters, like the coordination geometry of the Mn ion, Mn–O–Mn bond angles, Mn–O bond lengths and Mn–Mn bond distances.19–21 For instance, the exchange coupling constant (J) of some of these complexes decreases on increasing the Mn–O bond distance.11 The anti-ferromagnetic interactions have been observed between the MnIII centers of doubly phenoxo-bridged dimeric complexes.21–23 Moreover, J also depends on the dihedral angle between the Jahn–Teller axes, as revealed from the recent theoretical and experimental studies on several dimeric MnIII complexes with μ-oxo and μ-dicarboxylate bridged ligands.21,24 All these findings triggered investigations for finding new Mn complexes with unusual magnetic applications. As a consequence, a large number of structurally characterized higher nuclearity Mn-complexes (Mn8, Mn10, Mn12, Mn24, Mn26, etc.) with diverse structural topologies have been reported, and their magnetic properties have been studied.25–28 Furthermore, several dimeric MnIII complexes have been reported in which intra-dimer anti-ferromagnetic interactions were noticed.29–31 However, some of the other complexes possess ferromagnetic interactions with the ground spin state (S = 4).32,33 Additionally, dimeric MnIII complexes can exhibit single molecule magnet (SMM) behavior.32–36 The Schiff-base ligands synthesized by the condensation of ortho-vanillin and phenyl/pyridyl hydrazine have received much attention due to their multiple coordination sites (O, N, O) that help in the multinuclear assembly of metal complexes.37 These types of ligands exhibit keto–enol tautomerism at different pKa values (for example, the pKa values of methoxy salicylaldehyde and benzoyl hydrazide ligand are 9.03 and 10.92, respectively), leading to the formation of monoanionic (HL)− or dianionic (L)2− ligands during the reaction.38–40 Using multidentate coordinating ligands, chemists have developed several mono-, di- and multinuclear complexes of Fe(III), V(V), Sn(IV), Cu(II) and Ti(IV) metals.40,41 However, very few Mn complexes with these ligands were reported, and their antimicrobial and catalytic uses were also studied.42 However, their detailed magnetic studies have not been performed. Kou et al. had reported on the azide-bridged ferromagnetic MnIII dimer complex [Mn(ins)(μ1,1-N3)(CH3OH)]2 (ins = N-isonicotinamidosalicylaldimine) with slow relaxation of magnetization.43 Another interesting report by Murugesu et al. established a mixed-valence complex [MnIII2MnII(hmi)2(OMe)2Cl2]∞·MeOH (where, H2hmi = 2-hydroxy-3-methoxyphenyl-methylene-isonicotinohydrazine), which shows SMM behavior at low temperature with an effective energy barrier of 8.1 K.44 In addition, Li et al. have reported on two MnIII complexes, i.e., [MnII2(HL)2(CH3OH)2(Py)2](ClO4)2·2Py and [MnIII4(μ3-O)2(L)2(OAc)4]·2CH3CN (where, L: 3-methoxysalicylaldehyde, benzoylhydrazide), which shows anti-ferromagnetic interactions between the magnetic centers.37Moreover, the magnetism of molecule-based coordination polymers (CPs) has progressed significantly in recent years because of their diverse structural topologies (1D, 2D and 3D chains), which can lead to interesting magnetic properties.45–47 One of the ways to construct such materials is by linking the paramagnetic centers into multinuclear or polymeric networks by short bridging ligands, which can effectively enhance magnetic exchange interactions.47 To date, several short bridging carboxylate ligands have been used to construct the CPs, and superexchange interactions between the metal centers were investigated.48–52 Herein, we report on the synthesis, crystal structure determination and magnetic properties of two MnIII-bearing coordination complexes [MnIII4(μ3-O)2(L1)2(OAc)4(HOMe)4] (1), [MnIII2(L2)2(μ-OMe)2(HOMe)2] (2), a coordination polymer [MnIII(L3)(OMe)]n (3) and a decanuclear crown-like complex [Mn10(L4)10(L4)(O)2(DMF)4(MeOH)4(H2O)2] (4) by systematically modifying the ON-donor ligands. The reaction scheme explaining the synthesis of complexes 1, 2, 3, and 4 is shown [see Scheme 2].
The salicyl/o-vanillin aldehyde has been condensed with benzoyl/pyridyl-hydrazide to obtain ONO/ONON donor ligands (Scheme 2). These ligands were reacted with Mn(OAc)2·4H2O in MeOH, leading to the formation of dark crystals of MnIII complexes (1–4) via slow evaporation/ether-diffusion at room temperature. The reactions have been carried out in open air to oxidize the MnII ion to the MnIII ion.
2. Results and discussion
2.1 Crystal structural description
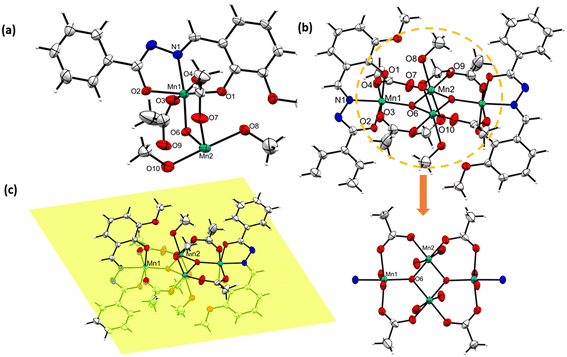
In order to determine the molecular structure, suitable single crystals of [MnIII4(μ3-O)2(L1)2(OAc)4(HOMe)4] (1) were grown by diffusing ether into the methanolic reaction mixture. Meanwhile, suitable single crystals of [MnIII2(L2)2(μ-OMe)2(HOMe)2] (2) and coordination polymer [MnIII(L3)(OMe)]n (3) were obtained from the methanolic solution by slow evaporation at room temperature. The crystal structure refinement data for complexes 1–2, coordination polymer 3 and decanuclear crown-like complex [Mn10(L4)10(L4O)2(DMF)4(MeOH)4(H2O)2] (4) have been given [see Table S1†].Complex [MnIII4(μ3-O)2(L1)2(OAc)4(HOMe)4] (1) crystallizes in a triclinic crystal system in the P![[1 with combining macron]](https://www.rsc.org/images/entities/char_0031_0304.gif) space group. The asymmetric unit of 1 contains half of complex, which includes two different MnIII ions, one dianionic L1, two acetate ions, one μ3-O2− and two coordinated solvent methanol molecules [see Fig. 1a]. The dimerization of the asymmetric molecular unit leads to complex 1 in the crystal lattice, as shown in Fig. 1b. Complex 1 contains two types of MnIII ions in the crystal structure, and their coordination modes with the adjacent molecules are described as follows: the Mn1 atom possesses an octahedral environment, where, L1 satisfies three coordination sites through bonding with O, N and O atoms. The other three coordination sites are occupied by one μ3-O2− bridged atom and two acetate molecules [see Fig. 1b]. Similarly, Mn2 also possesses an octahedral environment by coordinating with the adjacent oxygen atoms of two methanol molecules, two acetate molecules and two μ3-O2− bridged atoms [see Fig. 1b]. The Mn atoms in 1 exhibit a +3 oxidation state, as revealed from the bond valance sum (BVS) calculations [see Table S6.1 in ESI†]. The central [MnIII4O2]4+ core in complex 1 is truncated by four acetate and four MeOH ligands [see Fig. 1b]. All MnIII atoms and coordinated acetate molecules are lying on a single plane, which is bisecting the coordinated L1 units and ligated solvent molecules in a symmetrical fashion. Interestingly, the O8 atom of methanol is coordinated to either side of the Mn2 atoms, participating in O⋯H–C type interactions with the H13 atom of an adjacent complex molecule [see Fig. S1†]. Such emergent bonding interactions lead to a 1D H-bonded chain-like assembly in the crystal lattice. Similar O, N ligand donors containing Mn complexes have been reported by Chaudhuri et al., explaining the structural diversity offered by their wide variety of coordination with the metal centers.53 The calculated bond distance between the two Mn atoms in the [Mn4O2]4+ core is 2.884 Å, which is closer to a few reported similar tetranuclear clusters.54 Likewise, a few notable calculated bond distances existing between the Mn1–O1, O2, O3, O4, O6 and N1 atoms are 1.98, 1.92, 2.17, 2.17, 1.89 and 1.97 Å, respectively. Meanwhile, the calculated bond angles of Mn2–O–Mn2 and Mn2–O–Mn1 are 99.05° and 127.61°, respectively. The Mn–O bond distances observed at the equatorial position of the Mn1/Mn2 center are shortened, as compared to similar bonds existing at their axial position due to Jahn–Teller distortion. The observed bond lengths, bond angles, and weak bonding interactions of 1 are given in Table S2 and Fig. S1, respectively (see ESI†). The Jahn–Teller axes of two MnIII-ions at the wing positions are parallel, but they are nearly perpendicular to those of the other two MnIII-ions at the body positions [Fig. 1b].
space group. The asymmetric unit of 1 contains half of complex, which includes two different MnIII ions, one dianionic L1, two acetate ions, one μ3-O2− and two coordinated solvent methanol molecules [see Fig. 1a]. The dimerization of the asymmetric molecular unit leads to complex 1 in the crystal lattice, as shown in Fig. 1b. Complex 1 contains two types of MnIII ions in the crystal structure, and their coordination modes with the adjacent molecules are described as follows: the Mn1 atom possesses an octahedral environment, where, L1 satisfies three coordination sites through bonding with O, N and O atoms. The other three coordination sites are occupied by one μ3-O2− bridged atom and two acetate molecules [see Fig. 1b]. Similarly, Mn2 also possesses an octahedral environment by coordinating with the adjacent oxygen atoms of two methanol molecules, two acetate molecules and two μ3-O2− bridged atoms [see Fig. 1b]. The Mn atoms in 1 exhibit a +3 oxidation state, as revealed from the bond valance sum (BVS) calculations [see Table S6.1 in ESI†]. The central [MnIII4O2]4+ core in complex 1 is truncated by four acetate and four MeOH ligands [see Fig. 1b]. All MnIII atoms and coordinated acetate molecules are lying on a single plane, which is bisecting the coordinated L1 units and ligated solvent molecules in a symmetrical fashion. Interestingly, the O8 atom of methanol is coordinated to either side of the Mn2 atoms, participating in O⋯H–C type interactions with the H13 atom of an adjacent complex molecule [see Fig. S1†]. Such emergent bonding interactions lead to a 1D H-bonded chain-like assembly in the crystal lattice. Similar O, N ligand donors containing Mn complexes have been reported by Chaudhuri et al., explaining the structural diversity offered by their wide variety of coordination with the metal centers.53 The calculated bond distance between the two Mn atoms in the [Mn4O2]4+ core is 2.884 Å, which is closer to a few reported similar tetranuclear clusters.54 Likewise, a few notable calculated bond distances existing between the Mn1–O1, O2, O3, O4, O6 and N1 atoms are 1.98, 1.92, 2.17, 2.17, 1.89 and 1.97 Å, respectively. Meanwhile, the calculated bond angles of Mn2–O–Mn2 and Mn2–O–Mn1 are 99.05° and 127.61°, respectively. The Mn–O bond distances observed at the equatorial position of the Mn1/Mn2 center are shortened, as compared to similar bonds existing at their axial position due to Jahn–Teller distortion. The observed bond lengths, bond angles, and weak bonding interactions of 1 are given in Table S2 and Fig. S1, respectively (see ESI†). The Jahn–Teller axes of two MnIII-ions at the wing positions are parallel, but they are nearly perpendicular to those of the other two MnIII-ions at the body positions [Fig. 1b].
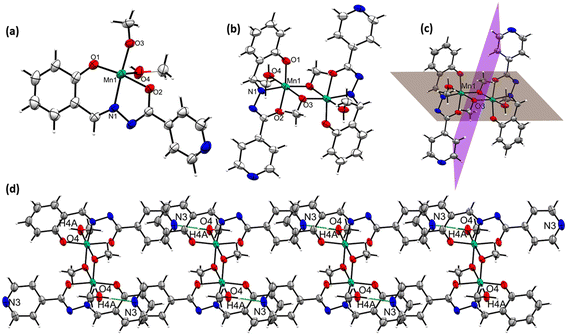
The complex [MnIII2(L2)2(μ-OMe)2(HOMe)2] (2) also crystallizes in a triclinic crystal system in the P![[1 with combining macron]](https://www.rsc.org/images/entities/char_0031_0304.gif) space group. The asymmetric crystallographic unit of 2 possesses one dianionic L2 ligand-coordinated MnIII ion, one μ-bridging OMe− group, and one terminally coordinating MeOH molecule was shown [see Fig. 2(a)]. In the asymmetric unit cell, the bridged μ-OMe is further coordinated to another set of asymmetric molecules in the crystal lattice to form complex 2 [see Fig. 2(b)]. The MnIII atoms possess an octahedral environment in order to fulfill their equatorial and axial coordination sites. The bonding type was described as follows: O1, N1, and O2 atoms from L2 (occupied three coordination sites out of six); the remaining sites are fulfilled by O3 and O3′ from μ-OMe and O4 from solvent methanol [see Fig. 2(b)]. Complex 2 possesses a center of symmetry, which can be bisected by passing the plane through two MnIII ions, along with ligated solvent molecules. Another plane for bisecting the complex is passing through the bridged methoxy molecules [see Fig. 2(c)].
space group. The asymmetric crystallographic unit of 2 possesses one dianionic L2 ligand-coordinated MnIII ion, one μ-bridging OMe− group, and one terminally coordinating MeOH molecule was shown [see Fig. 2(a)]. In the asymmetric unit cell, the bridged μ-OMe is further coordinated to another set of asymmetric molecules in the crystal lattice to form complex 2 [see Fig. 2(b)]. The MnIII atoms possess an octahedral environment in order to fulfill their equatorial and axial coordination sites. The bonding type was described as follows: O1, N1, and O2 atoms from L2 (occupied three coordination sites out of six); the remaining sites are fulfilled by O3 and O3′ from μ-OMe and O4 from solvent methanol [see Fig. 2(b)]. Complex 2 possesses a center of symmetry, which can be bisected by passing the plane through two MnIII ions, along with ligated solvent molecules. Another plane for bisecting the complex is passing through the bridged methoxy molecules [see Fig. 2(c)].
The oxidation state of Mn1 in 2 has been assigned as +3 by BVS calculations [see Table S6.2 in ESI†] and charge balance consideration. The bond distances Mn1–N1, Mn1–O1, Mn1–O2, and Mn1–O3 around the equatorial plane of the Mn1 center are 1.987, 1.881, 1.927 and 1.896 Å, respectively, whereas the two axial bond distances of Mn1–O3′ and Mn1–O4 bonds located along z-axis of the Mn1 center are 2.422 and 2.244 Å, respectively, which is usually due to the Jahn–Teller distortion of the MnIII ion. Two such axes are parallel to each other, being antiparallel to each other. Furthermore, the H4A atom of the axially coordinated methanol in 2 forms intermolecular N⋯H–O hydrogen-bonding interactions with the N3 atom of the pyridine ring of adjacent complexes, leading to the formation of the 1D H-bonded chain-like assembly in the crystal lattice [see Fig. 2(d)] of 2. The calculated bond distance and bond angle of the bonds associated with Mn1–Mn′1 and Mn1–O–Mn′1 in 2 are 3.159 Å and 99.21°, respectively [see Table S3.1 in ESI† for the bond lengths and bond angles of 2]. The details of those hydrogen bonding interactions are given in Table S3.2.† The L2 possesses the N-atom at the para-position of the pyridine ring with respect to the O2N primary donor sites of L2, whereas this N-atom is at the meta-position of L3 in [MnIII(L3)(OMe)]n (3). This pivotal positional change of the N-atom in the pyridine ring led to the isolation of a 2D polymeric magnetic network of the dimerized MnIII2 unit.
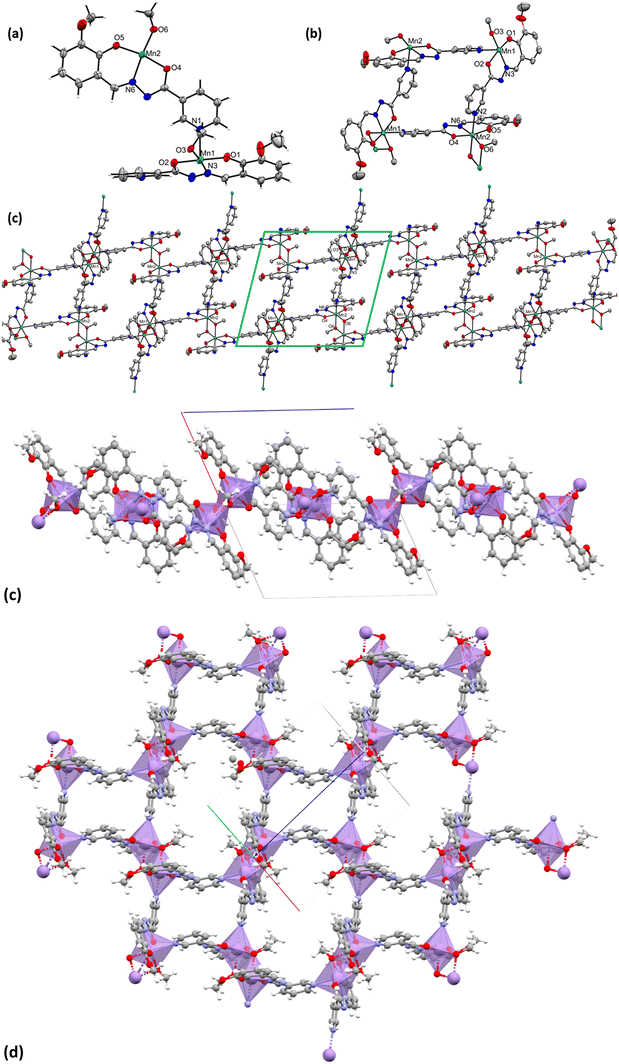
This coordination polymer [MnIII(L3)(OMe)]n (3) is also crystallized in a triclinic crystal system with a P![[1 with combining macron]](https://www.rsc.org/images/entities/char_0031_0304.gif) space group. The asymmetric unit of 3 consists of two MnIII atoms, two coordinated L3 ligands, and two μ-bridged OMe− ligands [see Fig. 3(a)]. There is no terminally coordinating neutral MeOH ligand like those of 2. Thus, dimerization of this asymmetric unit led to a parallelogram-like structure [see Fig. 3(b)], directing the formation of the 2D polymeric magnetic network of the MnIII2 unit in the crystal lattice of 3 [see Fig. 3(c) viewed along the b-axis]. The Mn ions in 3 also possess a distorted octahedral geometry [see Fig. 3(b)]. The equatorial coordination sites are occupied by coordinating with the N6, O4, and O5 atoms of the L3 and O6/O6′ atom from the bridged OMe− ligands (five coordination sites are satisfied out of six). Two axial sites along the Jahn–Teller axis are coordinated with one N2 atom from adjacent L3 and one bridged O6′ atom of the OMe− ligand [see Fig. 3(b)]. The BVS calculations and charge balance consideration reveal that all of the Mn ions in 3 possess a +3 oxidation state [see Table S6.3 in ESI†] like in complexes 1–2. The bond lengths and bond angles of a few crucial bonds in 3 are as follows: Mn1–Mn1, 3.11 Å; Mn1–O1, 1.88 Å; Mn1–N3, 1.97 Å; Mn1–O2, 1.97 Å; Mn1–N1, 2.31 Å; Mn1–O3, 1.88 Å; Mn1–O3′, 2.21 Å; N3–Mn1–O3, 174.92°, O1–Mn1–O2, 168.29°, N1–Mn1–O3, 166.53°, Mn1–O3–Mn1, 98.22° (see Table S4 in ESI† for bond lengths and bond angles of 3).
space group. The asymmetric unit of 3 consists of two MnIII atoms, two coordinated L3 ligands, and two μ-bridged OMe− ligands [see Fig. 3(a)]. There is no terminally coordinating neutral MeOH ligand like those of 2. Thus, dimerization of this asymmetric unit led to a parallelogram-like structure [see Fig. 3(b)], directing the formation of the 2D polymeric magnetic network of the MnIII2 unit in the crystal lattice of 3 [see Fig. 3(c) viewed along the b-axis]. The Mn ions in 3 also possess a distorted octahedral geometry [see Fig. 3(b)]. The equatorial coordination sites are occupied by coordinating with the N6, O4, and O5 atoms of the L3 and O6/O6′ atom from the bridged OMe− ligands (five coordination sites are satisfied out of six). Two axial sites along the Jahn–Teller axis are coordinated with one N2 atom from adjacent L3 and one bridged O6′ atom of the OMe− ligand [see Fig. 3(b)]. The BVS calculations and charge balance consideration reveal that all of the Mn ions in 3 possess a +3 oxidation state [see Table S6.3 in ESI†] like in complexes 1–2. The bond lengths and bond angles of a few crucial bonds in 3 are as follows: Mn1–Mn1, 3.11 Å; Mn1–O1, 1.88 Å; Mn1–N3, 1.97 Å; Mn1–O2, 1.97 Å; Mn1–N1, 2.31 Å; Mn1–O3, 1.88 Å; Mn1–O3′, 2.21 Å; N3–Mn1–O3, 174.92°, O1–Mn1–O2, 168.29°, N1–Mn1–O3, 166.53°, Mn1–O3–Mn1, 98.22° (see Table S4 in ESI† for bond lengths and bond angles of 3).
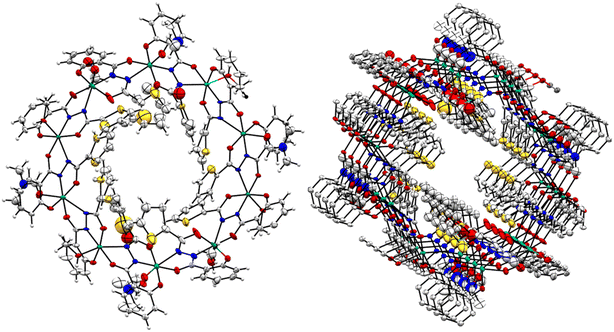
The complex [Mn10(L4)10(L4O)2(DMF)4(MeOH)4(H2O)2] (4) also crystallizes in the P![[1 with combining macron]](https://www.rsc.org/images/entities/char_0031_0304.gif) space group. Crystallographic data and refinement parameters of 4 have been given [see Table S1 in ESI†]. It contains ten MnIII ions, eight trianionic (L4)3− and two trianionic (L4O)3− ligands, and ten coordinated solvent molecules (four DMF, four MeOH, and two H2O) [see Fig. 4, left]. The oxidation state of the Mn-ions was estimated using BVS calculation and charge balance consideration [see Table S6.4 in ESI†]. The bond distances and bond angles of 4 are discussed [see Table S5 in ESI†]. Complex 4 is a 30-membered macrocycle with a small cavity in the center of the molecule. All of the MnIII ions adopted distorted octahedral geometry with an N2O4 donor set. The MnIII ion is able to exhibit Jahn–Teller elongation as expected. Hence, the Mn–O/N equatorial bond distances are shorter than those of the axial bonds.
space group. Crystallographic data and refinement parameters of 4 have been given [see Table S1 in ESI†]. It contains ten MnIII ions, eight trianionic (L4)3− and two trianionic (L4O)3− ligands, and ten coordinated solvent molecules (four DMF, four MeOH, and two H2O) [see Fig. 4, left]. The oxidation state of the Mn-ions was estimated using BVS calculation and charge balance consideration [see Table S6.4 in ESI†]. The bond distances and bond angles of 4 are discussed [see Table S5 in ESI†]. Complex 4 is a 30-membered macrocycle with a small cavity in the center of the molecule. All of the MnIII ions adopted distorted octahedral geometry with an N2O4 donor set. The MnIII ion is able to exhibit Jahn–Teller elongation as expected. Hence, the Mn–O/N equatorial bond distances are shorter than those of the axial bonds.
One phenolate oxygen atom, a carbonyl oxygen atom, and one hydrazide nitrogen atom of the ligand are bound with each manganese, whereas yet another carbonyl oxygen and another hydrazide nitrogen atom in the ligand are chelated to an adjacent manganese atom. The MnIII ions are back-to-back connected in a cyclic fashion (Mn–N–N–Mn) through the trans-N–N– linkage of each trianionic ligand [(L4)3−/(L4O)3−], displaying the η1:η1:η1:η1:η1:η2 bridging mode. The average Mn⋯Mn distance between the adjacent MnIII is 4.95 Å, while the inter-cluster Mn⋯Mn distance is in the range of 9.74–9.88 Å. The average Mn⋯Mn⋯Mn angle is 134°. The packing reveals that the complexes are placed one along with another in a specific direction [see Fig. 4, right].
2.2 Magnetic studies
 | ||
| Fig. 5 The χT vs. T plot of complex 1 under the applied dc magnetic field of 1000 Oe. Magnetic model (inset). Red line indicates fitting. | ||
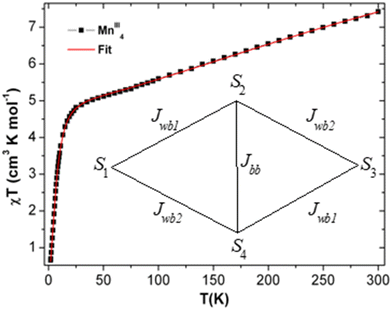
At room temperature, the experimental χT value is 7.351 cm3 K mol−1 [see Fig. 5], which is far less than the expected theoretical value given by eqn (1) for four uncoupled MnIII ions (3 cm3 K mol−1 for one MnIII ion, assuming S = 2 and g = 2), indicating the presence of intramolecular anti-ferromagnetic interaction among the metal centers in 1.55–60 The χT product of 1 falls gradually with the decreasing temperature down to 25 K (4.82 cm3 K mol−1) [see Fig. 5]. Below 25 K, the χT product sharply decreases to 0.66 cm3 K mol−1 at 1.8 K due to the strong intramolecular anti-ferromagnetic interactions and/or zero-field splitting (ZFS) of anisotropic MnIII ions, as suggested above. A similar trend has been observed for a few closely related MnIII4 complexes reported in the literature.59 As there is no sharp increase in the susceptibility peak [see Fig. S14 (right) in ESI†], the possibility of having the inter-lattice canted layer interaction is ruled out. The χ−1vs. T data of 1 was well fitted with the Curie–Weiss law in the temperature range of 10–300 K. The obtained Curie constant C and Weiss constant θ of 1 are 7.50 cm3 mol−1 K and −23.13 K, respectively. The relatively large negative θ value indicates the aforementioned existence of strong intramolecular anti-ferromagnetic interactions in 1.57–62
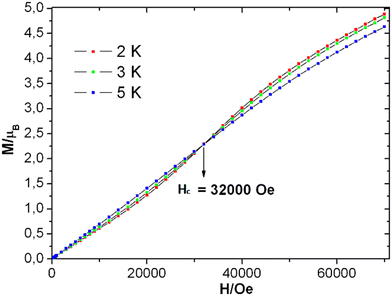
The field-dependent magnetization plots of complex 1 at temperatures 2 K and 3 K adopt a sigmoidal in shape. However, the shape of the similar curve at 5 K is almost linear [see Fig. 6], which could be near the critical temperature. The Tc can be verified with the χ vs. T graph [see Fig. S14† (right)] at 6 K. Similar to the real magnet, the magnetization (M) values increases linearly when the magnetic field elevates up to 5000 Oe, in a low field limit. Then, it follows the path of ordering below TC and the critical field (Hc) is believed to be from 5000 Oe to 32![[thin space (1/6-em)]](https://www.rsc.org/images/entities/char_2009.gif) 000 Oe [see Fig. S14† (left)]. The critical field enables the magnetic transition. The magnetization value of 4.9 μB at 70
000 Oe [see Fig. S14† (left)]. The critical field enables the magnetic transition. The magnetization value of 4.9 μB at 70![[thin space (1/6-em)]](https://www.rsc.org/images/entities/char_2009.gif) 000 Oe [see Fig. 6] is far from the theoretically obtained saturated magnetization value of 16 μB of four MnIII ions (for S = 2, g = 2), and it was predicted by following eqn (2).
000 Oe [see Fig. 6] is far from the theoretically obtained saturated magnetization value of 16 μB of four MnIII ions (for S = 2, g = 2), and it was predicted by following eqn (2).
Upon extrapolating the curve from its maximum plotted point, we have observed that the curve meets the y-axis around 0.6 μB, suggesting the presence of significant net magnetization even at zero field. This behavior is in contrast with our earlier observation from the Curie–Weiss parameter, but there is a plausible reason for the presence of the magnetic moment, which is further explored in the later discussions by evaluating exchange coupling constants. The crossover point is a critical field that is explicitly given in the derivative plot dM/dH vs. H at 2 K, which shows a broad maxima at the field 32![[thin space (1/6-em)]](https://www.rsc.org/images/entities/char_2009.gif) 000 Oe (Hc) [see Fig. S14† (left)]. Interestingly, when increasing the temperature from 2 K to 5 K, the broad maxima of the dM/dH vs. H plot shifted from the field of 32
000 Oe (Hc) [see Fig. S14† (left)]. Interestingly, when increasing the temperature from 2 K to 5 K, the broad maxima of the dM/dH vs. H plot shifted from the field of 32![[thin space (1/6-em)]](https://www.rsc.org/images/entities/char_2009.gif) 800 Oe to 28
800 Oe to 28![[thin space (1/6-em)]](https://www.rsc.org/images/entities/char_2009.gif) 500 Oe, respectively. In addition, the χ vs. T plots at fields 1000 Oe and 10
500 Oe, respectively. In addition, the χ vs. T plots at fields 1000 Oe and 10![[thin space (1/6-em)]](https://www.rsc.org/images/entities/char_2009.gif) 000 Oe show maxima at 6 K (TC) [see Fig. S14 (right), ESI†]. Moreover, the reduction of magnetization was noticed in the M vs. H/T plots at different temperatures (2, 3 and 5 K), indicating that the curves do not superimpose each other due to the presence of anisotropy in the system [see Fig. S15 in ESI†]. The core of MnIII4 in 1 was analyzed based on the following model [see Fig. 5, inset]. According to the structure (S1 = S2 = S3 = S4 = 2), the following simplifications were applied, J12 = J34 = Jwb1, J23 = J14 = Jwb2, D1 = D3 = Dw, D2 = D4 = Db and g1 = g2 = g3 = g4 = g. Thus, the Hamiltonian can be simplified as given by eqn (1).
000 Oe show maxima at 6 K (TC) [see Fig. S14 (right), ESI†]. Moreover, the reduction of magnetization was noticed in the M vs. H/T plots at different temperatures (2, 3 and 5 K), indicating that the curves do not superimpose each other due to the presence of anisotropy in the system [see Fig. S15 in ESI†]. The core of MnIII4 in 1 was analyzed based on the following model [see Fig. 5, inset]. According to the structure (S1 = S2 = S3 = S4 = 2), the following simplifications were applied, J12 = J34 = Jwb1, J23 = J14 = Jwb2, D1 = D3 = Dw, D2 = D4 = Db and g1 = g2 = g3 = g4 = g. Thus, the Hamiltonian can be simplified as given by eqn (1).
 | (1) |
The MAGPACK63,64 simulation studies provide the following: Jwb1 = −10.5 cm−1, Jwb2 = −6.9 cm−1, Jbb = −26.6 cm−1, Dw = −2.23 cm−1, Db = −2.09 cm−1 and g = 1.98 [see Fig. 5 (inset)]. The magnetization of 1 at 2 K and 3 K are well simulated at lower fields (below 4 T) [see Fig. S15 in ESI†]. Since all of the J-values are negative, it suggests that the anti-ferromagnetic state of the molecule is the ground state. A similar scenario was observed in the distorted MnIII4 with a butterfly-like core containing all negative J parameters.65 The unusual shapes of the M vs. H plots of 1 were observed [see Fig. 6], and the nature of the curves has been justified by J-values along with schematic representations of the spin structures [see Fig. S20 and S21 and Tables S9–S12†]. The angle between two planes containing the Jahn–Teller axes (i.e., anisotropic axes)58–61 of two sets of MnIII ions is 70.93°, which may be the reason why the M vs. H plots [see Fig. 6] look unusual when they are compared with those of other Mn-clusters.
 | ||
| Fig. 7 The χT vs. T plot of complex 2 at 1000 Oe. Red line indicates the fit. Plots of M vs. H of 2 at indicated temperatures (inset). | ||
According to the structure (S1 = S2 = 2), the core {MnIII2} of 2 was analyzed based on the following model Hamiltonian expression (2).
 | (2) |
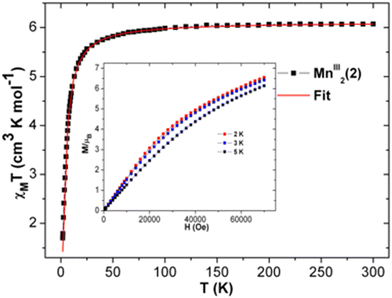
The experimental χT value of MnIII2 in 2 at room temperature is 6.074 cm3 K mol−1 [see Fig. 7], which is consistent with the expected χT product of the two uncoupled MnIII ions, 6 cm3 K mol−1,55 suggesting that the magnetization is neither suppressed nor amplified owing to any other phenomenon. The χT product of 2 remains almost constant from 300 K to 100 K, and then slowly decreases with declining temperature up to 25 K (5.67 cm3 K mol−1) [see Fig. 7]. Below 25 K, the χT value sharply decreases to 1.70 cm3 K mol−1 at 1.8 K due to weak intermolecular anti-ferromagnetic interaction and/or ZFS of anisotropic MnIII ions.69 The χ−1vs. T data of 2 was well fitted in the experimental temperature range using the Curie–Weiss equation. The obtained C and θ values of 2 are 6.15 cm3 mol−1 K and −3.38 K, respectively. The small negative θ value indicates the existence of weak anti-ferromagnetic interactions in 2.70,71 The field-dependent magnetization at 2 K increases gradually with increasing dc field, and remains linear in the lower field limit. However, it does not reach the saturation of magnetization. The highest magnetization values observed at 7 T at different temperatures of 2, 3, and 5 K are 6.54 μB, 6.42 μB and 6.14 μB, respectively [see Fig. 7, inset], which are yet to reach the predicted spin-only saturation value of 8.0 μB of the two MnIII ions (4 μB for each MnIII ion with g = 2 and S = 2). At low temperatures, the M vs. H/T plots [see Fig. S17 (left) in ESI†] are not superposed on a single master curve as expected for an isotropic system, verifying the presence of magnetic anisotropy in 2. The M vs. H plots at 2–5 K of 2 do not show sigmoidal shapes, for which the right combination of J and D values are needed.77–83
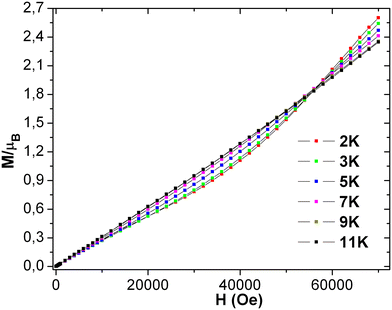
The geometry of the asymmetric unit shows that its two magnetic centers are separated by five atoms, making the likelihood of super, double, or direct exchange coupling virtually nonexistent. The field-dependent magnetization plot of 3 at different temperatures (2–11 K) shows the sigmoidal shape curve below 11 K [see Fig. 9], suggesting that 11 K is the critical temperature (TC). The sigmoidal transition is supported by an easy and slow drop in the curve at around 60![[thin space (1/6-em)]](https://www.rsc.org/images/entities/char_2009.gif) 000 Oe. The system also behaves like a paramagnet after the critical field and TC, as suggested by the correlation between the experimental and theoretically predicted χT product value. The magnetization increases linearly with the increasing field up to 10
000 Oe. The system also behaves like a paramagnet after the critical field and TC, as suggested by the correlation between the experimental and theoretically predicted χT product value. The magnetization increases linearly with the increasing field up to 10![[thin space (1/6-em)]](https://www.rsc.org/images/entities/char_2009.gif) 000 Oe, like typical magnetic behavior in the low field limit following the Brillouin function.
000 Oe, like typical magnetic behavior in the low field limit following the Brillouin function.
The system achieves magnetization of 2.60 μB at 7 T, which is much less than the predicted saturation magnetization value of 8 μB of two MnIII ions. Extrapolation of the data/curve at the higher field to the zero field leads to almost zero magnetization on the y-axis, directly implying the presence of non-subsidized anti-ferromagnetic coupling. The phase transition of the magnet at HC occurs from antiferromagnet to paramagnet with spin flop under the limit of the TC. Also, the linear curve at 11 K suggests the absence of any phase transition in the whole considered field limit. The derivative plot dM/dH vs. H at 2 K shows the maxima at 60![[thin space (1/6-em)]](https://www.rsc.org/images/entities/char_2009.gif) 000 Oe (Hc), indicating the critical field [see Fig. S19 (left) in ESI†]. Complex 3 clearly displays the characteristics of the bulk spin flop behavior. Previously, such behavior was observed in the Mn-azide 2D polymeric network, which has been investigated in detail.4 The M vs. H/T plots [see Fig. S19 (right) in ESI†] at low temperatures (2, 3, 5, 7, 9, and 11 K) are not superimposed on each other as expected for an isotropic system, which further indicates the presence of magnetic anisotropy and/or low-lying excited states. The spin Hamiltonian model applied for the dimeric {MnIII2} complex 2 is applied for complex 3 in order to get the following parameters: J = −2.7 cm−1, D1 = D2 = −5.0 cm−1, E1 = E2 = 0.6 cm−1 and g1 = g2 = 2.02. The fitting results show that 3 has some anti-ferromagnetic coupling between the magnetic centers of the asymmetric unit. The intermolecular interaction (zj′ = −0.28 K) was calculated by mean-field theory, employing expression (3).
000 Oe (Hc), indicating the critical field [see Fig. S19 (left) in ESI†]. Complex 3 clearly displays the characteristics of the bulk spin flop behavior. Previously, such behavior was observed in the Mn-azide 2D polymeric network, which has been investigated in detail.4 The M vs. H/T plots [see Fig. S19 (right) in ESI†] at low temperatures (2, 3, 5, 7, 9, and 11 K) are not superimposed on each other as expected for an isotropic system, which further indicates the presence of magnetic anisotropy and/or low-lying excited states. The spin Hamiltonian model applied for the dimeric {MnIII2} complex 2 is applied for complex 3 in order to get the following parameters: J = −2.7 cm−1, D1 = D2 = −5.0 cm−1, E1 = E2 = 0.6 cm−1 and g1 = g2 = 2.02. The fitting results show that 3 has some anti-ferromagnetic coupling between the magnetic centers of the asymmetric unit. The intermolecular interaction (zj′ = −0.28 K) was calculated by mean-field theory, employing expression (3).
 | (3) |
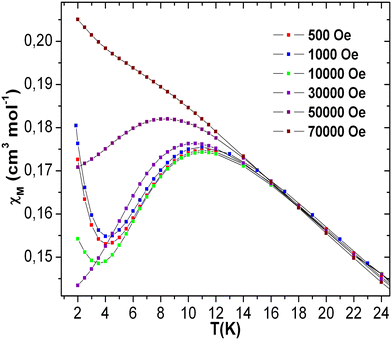
The dc magnetic susceptibilities of 3 were also recorded under different applied magnetic fields of 500–70![[thin space (1/6-em)]](https://www.rsc.org/images/entities/char_2009.gif) 000 Oe in order to understand the field-dependent susceptibility behavior [see Fig. 10]. The maximum of χ vs. T plot at 11 K was observed at 500 Oe. The maxima slowly moved to lower temperature with increasing applied magnetic field, and became almost straight at 70
000 Oe in order to understand the field-dependent susceptibility behavior [see Fig. 10]. The maximum of χ vs. T plot at 11 K was observed at 500 Oe. The maxima slowly moved to lower temperature with increasing applied magnetic field, and became almost straight at 70![[thin space (1/6-em)]](https://www.rsc.org/images/entities/char_2009.gif) 000 Oe. The upturns below 4 K of χ vs. T plots at different fields might be due to intermolecular interaction57–60 and/or a trace of paramagnetic impurity. The field cooling and zero-field cooling susceptibility curves of 3 at the field of 70
000 Oe. The upturns below 4 K of χ vs. T plots at different fields might be due to intermolecular interaction57–60 and/or a trace of paramagnetic impurity. The field cooling and zero-field cooling susceptibility curves of 3 at the field of 70![[thin space (1/6-em)]](https://www.rsc.org/images/entities/char_2009.gif) 000 Oe show very narrow bifurcation at the temperature of 15 K and below [see Fig. S18 (left), ESI†]. The temperature-dependent ac susceptibility measurements reveal the presence of a broad in-phase (χ′) susceptibility signal at 11 K, but out-of-phase susceptibility (χ′′) is negligible,77–82 which reflects the absence of any significant field-induced phase transition [see Fig. S18 (right) in ESI†]. This may be due to the short-range magnetic ordering, which also has been observed in other Mn-based magnets displaying short-range magnetic phase transition.77–82
000 Oe show very narrow bifurcation at the temperature of 15 K and below [see Fig. S18 (left), ESI†]. The temperature-dependent ac susceptibility measurements reveal the presence of a broad in-phase (χ′) susceptibility signal at 11 K, but out-of-phase susceptibility (χ′′) is negligible,77–82 which reflects the absence of any significant field-induced phase transition [see Fig. S18 (right) in ESI†]. This may be due to the short-range magnetic ordering, which also has been observed in other Mn-based magnets displaying short-range magnetic phase transition.77–82
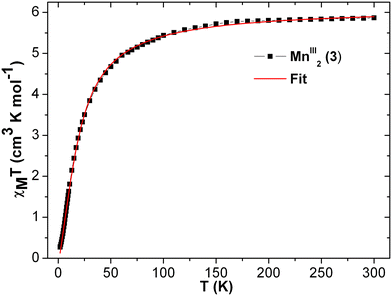
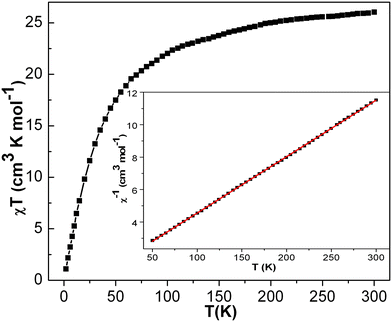
The theoretical prediction suggests the χT product value at room temperature to be 30 cm3 K mol−1 for decanuclear MnIII (considering each MnIII with S = 2 and g = 2), which is much higher than the abovementioned experimentally observed value. The lower value of χT at room temperature is expected for an antiferromagnetically coupled system. The linear fitting to the Curie–Weiss law produces C = 28.75(3) cm3 K mol−1 and θ = −30.86 (4) K using the data above at 50 K. The large negative value of θ verifies our interpretation of the presence of strong anti-ferromagnetic coupling in the system.
In our H-bonded MnIII2 complex 2, no spin flop or canting-like behavior is observed due to the large separation (inter-cluster Mn1–Mn1 = 9.995 Å through (OH⋯N) H-bond plus aromatic ring) between the dimeric MnIII2 units. Complex 3 possesses a 3D magnetic network of repeating MnIII2 units with similar intra Mn–Mn dimeric separation and coupling angle (Mn–O–Mn), and shows non-negligible magnetic interactions between the dimeric Mn2 units of 3. The sizeable intermolecular interactions propagate throughout the 2D network via connecting pyridine rings with comparatively shorter inter-dimer Mn1–Mn2 = 8.315 Å distance. Also, the structural parameter of MnIII2 in 3 slightly changed from those of 2. Consequently, the appropriate combination of intramolecular magnetic coupling (j), zero field splitting (D), and intermolecular anti-ferromagnetic interaction (zj′) leads to a short-range spin flop behavior (ordering) in 3. It is evident from the field-dependent magnetization study that the curve of 3, which deviates from the linearity at 2 K, shows a sigmoidal shape as expected for a spin flop transition.6 The high value of Hc (of 60![[thin space (1/6-em)]](https://www.rsc.org/images/entities/char_2009.gif) 000 Oe) is because of the stronger intramolecular anti-ferromagnetic interaction (J = −2.7 cm−1) between the two MnIII ions in 3 within a dimeric unit. It is interesting to note that the similarity and difference originating from their geometry, between 1 and 3, provide information that both have a sigmoidal-shaped curve in their dc magnetization plots. The characteristic emergence of magnetic property in 1 is dominant due to the non-collinear Jahn–Teller distortion, paving the way for a spin flop like behavior in this complex. Complex 1 has a comparatively lower capacity to maintain its ordering with significantly lesser TC and HC in comparison to 3, i.e., 6 K, 32
000 Oe) is because of the stronger intramolecular anti-ferromagnetic interaction (J = −2.7 cm−1) between the two MnIII ions in 3 within a dimeric unit. It is interesting to note that the similarity and difference originating from their geometry, between 1 and 3, provide information that both have a sigmoidal-shaped curve in their dc magnetization plots. The characteristic emergence of magnetic property in 1 is dominant due to the non-collinear Jahn–Teller distortion, paving the way for a spin flop like behavior in this complex. Complex 1 has a comparatively lower capacity to maintain its ordering with significantly lesser TC and HC in comparison to 3, i.e., 6 K, 32![[thin space (1/6-em)]](https://www.rsc.org/images/entities/char_2009.gif) 000 Oe, and 11 K, 60
000 Oe, and 11 K, 60![[thin space (1/6-em)]](https://www.rsc.org/images/entities/char_2009.gif) 000 Oe, respectively, for 1 and 3.
000 Oe, respectively, for 1 and 3.
Heat capacity. The specific heat capacity measurements were performed with powders of the crystals of 1 and 3 using Quantum Design Physical Property Measurement System (PPMS) with a maximum field limit of 9 T equipped with a super conducting magnet and 3He2 insert. This technique measures the change in entropy as a function of the magnetic field, and detects the phase boundaries during the corresponding heating and cooling process.78 For a high thermal coupling and temperature homogeneity, a tiny amount of Apiezon N grease was stuck between the Si plates. Initially, the addenda were measured. The Apiezon N grease and the silicon plates are responsible for the specific heat capacity that was obtained. The sample platform was measured separately. The crystals of complexes 1 and 3 were grinded into powders and subsequently pressed into form pellets. The specific heat capacity of complexes 1 and 3 was measured after subtracting the contribution of the addenda from the total heat capacity.78 Excellent agreements with respect to the sampling coupling were achieved for both complexes 1 (95.67%) and 3 (89.07%), respectively. This reveals that both the addenda and the sample are coupled with each other with respect to thermal coupling. So, the plots obtained for both complexes 1 and 3 are convincing and most reliable. The responses recorded for both systems are different because they both vary from their structure-related properties.
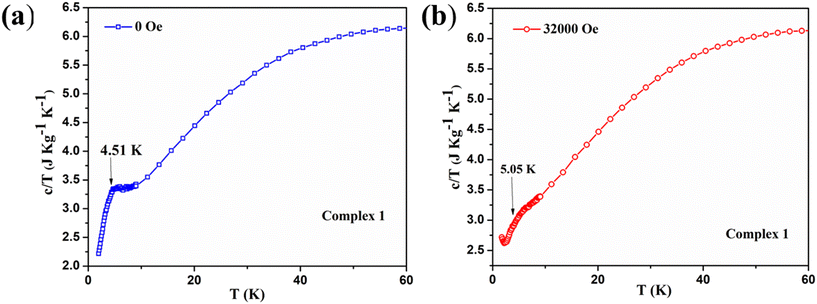
To further support our understanding on magnetic phase transition, we have performed the temperature-dependent specific heat capacity measurements of complexes 1 and 3 in the temperature range of 2 K ≤ T ≤ 100 K at both zero dc field and their corresponding critical fields. The specific heat capacity measurement of complex 1 shows the smeared λ-type peak at around 4.9 K with zero field [see Fig. 12a]. This indicates that the system undergoes a magnetic phase transition at the molecular level, and the λ-like anomaly at low temperature suggests the spin flop behavior, as previously noticed in the Schiff base ligated WV–MnIII molecular system.79 The bimetallic assembly shows a spin flop with a phase transition of antiferromagnetic to paramagnetic, as similarly observed in 1.79 A previously reported spin frustrated 3D-magnetic network containing Mn2+/Mn3+ with the triangular units also shows the spin flop behaviour.80 Notably, in the above-said system, the Mn2+/Mn3+ is present in the ratio of 1![[thin space (1/6-em)]](https://www.rsc.org/images/entities/char_2009.gif) :
:![[thin space (1/6-em)]](https://www.rsc.org/images/entities/char_2009.gif) 2. However, the specific heat capacity of 1 recorded under the field of 32
2. However, the specific heat capacity of 1 recorded under the field of 32![[thin space (1/6-em)]](https://www.rsc.org/images/entities/char_2009.gif) 000 Oe displayed a smeared hump from the 4–6 K temperature range, and the broad maxima was indicated at around 5.3 K [see Fig. 12b]. Meanwhile, overlaying both specific heat capacity curves obtained under zero and 32
000 Oe displayed a smeared hump from the 4–6 K temperature range, and the broad maxima was indicated at around 5.3 K [see Fig. 12b]. Meanwhile, overlaying both specific heat capacity curves obtained under zero and 32![[thin space (1/6-em)]](https://www.rsc.org/images/entities/char_2009.gif) 000 Oe indicates that the region between 4 and 6 K behaves differently with a spin flop featuring phenomenon [see Fig. 13]. Also, the Mn3+-containing Schiff base complexes were previously reported to exhibit a sigmoidal M vs. H curve as a sign of the spin flop phenomenon.81 In our complex 1, a similar sigmoidal curve was also observed in the M vs. H plot.
000 Oe indicates that the region between 4 and 6 K behaves differently with a spin flop featuring phenomenon [see Fig. 13]. Also, the Mn3+-containing Schiff base complexes were previously reported to exhibit a sigmoidal M vs. H curve as a sign of the spin flop phenomenon.81 In our complex 1, a similar sigmoidal curve was also observed in the M vs. H plot.
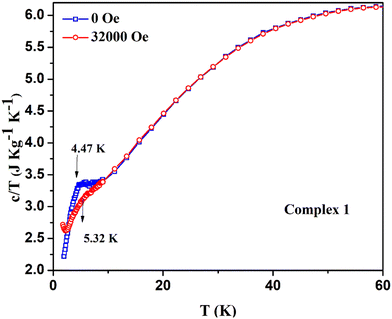 | ||
Fig. 13 Stacking plots of temperature and mass dependence of the specific heat capacity of the complex 1: (5.5 mg of the sample) at zero field (blue) and at 32![[thin space (1/6-em)]](https://www.rsc.org/images/entities/char_2009.gif) 000 Oe (red). 000 Oe (red). | ||
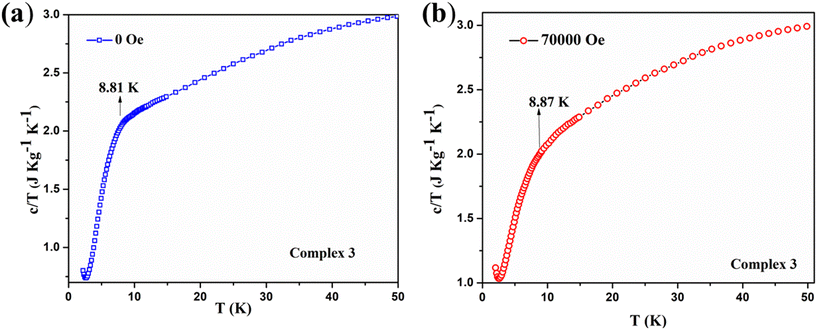
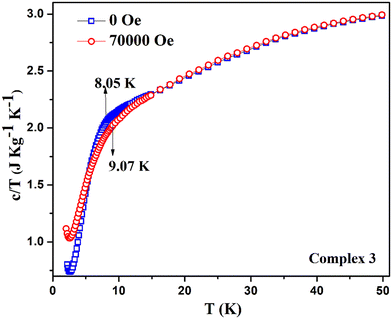
Instead of obtaining a usual sharp cusp of λ-type anomaly, we have acquired a broad upturn in the temperature-dependent specific heat capacity measurement on complex 3 [see Fig. 14a]. This indicates the spin flop phenomenon in 2D type materials, which is revealed from the comparison with a previously reported 3D system possessing a spin flop transition below 10 K at under zero field.82 By observing the broad feature of the upturn, it indicates that the magnetism associated with complex 3 mostly resembles the one-dimensional Mn-containing chains, as reported earlier.78 The corresponding curve under 70![[thin space (1/6-em)]](https://www.rsc.org/images/entities/char_2009.gif) 000 Oe looks similar and shows a broad peak spanning between 5–10 K [see Fig. 14b]. The two curves under zero field and 70
000 Oe looks similar and shows a broad peak spanning between 5–10 K [see Fig. 14b]. The two curves under zero field and 70![[thin space (1/6-em)]](https://www.rsc.org/images/entities/char_2009.gif) 000 Oe together reveal the different trends in the specific heat capacity below 10 K [see Fig. 15]. Due to a comparatively lower J value of 3 over 1, no cusp was observed. However, a broad peak in 3 was obtained. The broad feature in the specific heat capacity measurement is compatible with the previously reported antiferromagnetic MnIII system, [Mn(salphen)(H2O)]2[Fe(CN)5(NO)]·2CH3OH, which exhibits J and D values that are closer to those of 3.77 The 2D complex 3 does not reveal any λ-like anomaly as with molecular complex 1 due to its comparatively lesser J value obtained from the fitting. There are a few MnIII-based Schiff base complexes with a spin flop behavior that have been previously reported.79,81,83,84
000 Oe together reveal the different trends in the specific heat capacity below 10 K [see Fig. 15]. Due to a comparatively lower J value of 3 over 1, no cusp was observed. However, a broad peak in 3 was obtained. The broad feature in the specific heat capacity measurement is compatible with the previously reported antiferromagnetic MnIII system, [Mn(salphen)(H2O)]2[Fe(CN)5(NO)]·2CH3OH, which exhibits J and D values that are closer to those of 3.77 The 2D complex 3 does not reveal any λ-like anomaly as with molecular complex 1 due to its comparatively lesser J value obtained from the fitting. There are a few MnIII-based Schiff base complexes with a spin flop behavior that have been previously reported.79,81,83,84
3. Theoretical studies
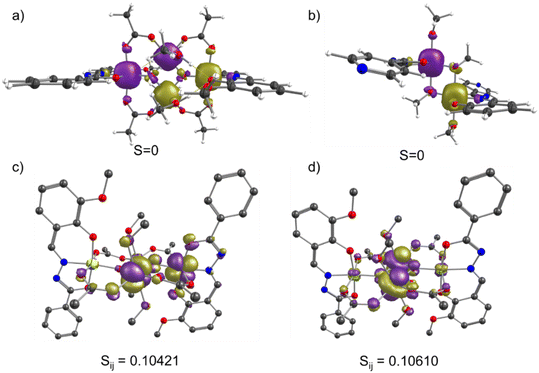
To assess the nature and strength of the magnetic exchange interaction in complexes 1 and 2, scalar-relativistic broken-symmetry density functional theory (BS-DFT)85 calculations were carried out on the X-ray crystal structures. In complex 1, the asymmetric unit comprised two MnIII ions, one dianionic L1, two coordinated solvent methanol molecules, one O2− ion, and two acetate ions. However, both Mn(III) centers are bridged by one O2− and acetate ion. As a result of the inversion symmetry, two asymmetric units are joined through O2− bridges in the μ3-fashion and generate a butterfly geometry with two Mn(III) centers on the body position and two Mn(III) centers coordinated to the dianionic L1 ligands on the wing position. The Mn⋯Mn distances are 2.881 Å, 3.396 Å, 3.398 Å and 6.152 Å for the body–body, wing–body(1), wing–body(2), and wing–wing positions, respectively. This structural topology results in one set of Jbb (body–body) interactions bridged by two μ3-O2− bridges, four sets of Jwb (wing–body) interactions (two sets Jwb1 and two sets Jwb2), where Mn⋯Mn is bridged by one μ3-O2− bridge and one acetate ion. The third interaction is the Jww (wing–wing) interaction, which is neglected while fitting the experimental data as the Mn(III) centers are 6.152 Å far apart. Due to the similarity in the structural parameters (inversion symmetry), both Jwb1 and Jwb2 interactions are expected to be similar in sign and magnitude. On the other hand, 2 is a dimeric complex where both Mn(III) centers are in the distorted octahedral geometry and bridged by two methoxy ligands.For both complexes 1 and 2, we have computed the magnetic exchange interaction between the Mn(III) centers using the broken symmetry density functional theory (BS-DFT) method.85 For 1, we have used a pair-wise exchange formulation to extract the J values. Tables S8, S9 and S13† provide all of the computed energies of the broken-symmetry solutions and J values for both complexes. DFT calculations predict an anti-ferromagnetic interaction among all of the centers in 1, and the computed Jwb1, Jwb2, and Jbb values are −7.6 cm−1, −7.6 cm−1, and −28.0 cm−1, respectively. The computed J values are in reasonably good agreement with the experiment. DFT calculations predict similar Jwb1 and Jwb2 values, which are in line with the local X-ray structural parameters. The computed Jww interaction is −0.6 cm−1, which is relatively much weaker than the Jwb1, Jwb2, and Jbb interactions, and is often neglected to avoid overparameterization while fitting the experimental magnetic susceptibility. For 2, DFT yields a J value of −0.4 cm−1 for the methoxy-bridged Mn(III) center, and the computed value agrees with the experimental value of −0.3 cm−1. The DFT computed ground state spin-density for complexes 1 and 2 is provided in Fig. 16. Most importantly, the DFT computed J values nicely reproduce the experimental magnetic susceptibility, adding more values to our computed parameters.
Next, we analyzed the molecular orbitals (MOs), spin density and unrestricted corresponding orbitals (UCOs) to shed light on the mechanism of the magnetic exchange interaction. In complex 1, the most significant interaction is the Jbb interaction between the Mn(III) centers, which are bridged by two μ3-O2− bridges. A careful analysis of the structural parameters reveals that both Mn(III) ions are in the distorted octahedral field with the J.–T. axis aligned towards the Mn–OCH3 bond (coordinated solvent molecules). As a result, the J.–T. axes of both Mn(III) centers (at body position) are parallel to each other and perpendicular to the Mn2O2 core. The Jbb interactions comprised both antiferromagnetic interactions (JAF) and arising ferromagnetic interactions (JF), where the orbital interactions between the non-orthogonal orbitals contribute to the earlier part. In contrast, the cross-interactions contribute to the JF interaction. In order to get the orbital overlap integral analysis, we have prepared a dimeric model complex 1a, representing only the Jbb interaction, where the Mn(III) centers at the wing positions are replaced with the diamagnetic ions. Calculations on 1a show a considerable negative J value of −62.3 cm−1, which corroborates the large Jbb value in 1 obtained from the pair-wise exchange interaction model. Due to z-out distortions around the Mn(III) centers, we observed the following d-orbital splitting pattern (dxz)1 ∼ (dyz)1 < (dxy)1 < (dz2)1 < (dx2−y2)0, where the dx2−y2 orbital located on the Mn2O2 core is vacant. Hence, the superexchange pathway via the bridges are expected to be weak in nature. Spin-density analysis on 1b shows marginal spin-density on the oxygen atom of the μ3-O2− bridges, indicating the lack of the spin-delocalization mechanism in mediating exchange through bridges. Four UCO pairs indicate the substantial orbital overlap responsible for the antiferromagnetic exchange interaction between the Mn(III) centers [see Fig. 16 and S24–S26†]. On the other hand, the Jwb interaction arises between the two Mn(III) centers bridged by one μ3-O2− and acetate group. A close inspection of the structural parameters reveals that both Mn(III) centers are in the distorted octahedral geometry with the J.–T. axes being perpendicular to each other. The J.–T. axis of the Mn(III) ions located at the wing position is oriented towards the M–O bond (carboxylate bridge), and this is perpendicular to the J.–T. axis of the Mn(III) center at the body position [see Scheme 2]. The change in the orientation of the J.–T. axes can significantly affect the magnetic exchange interactions.86–88 The Mn⋯Mn distances and bond angles are much larger in wing-body interactions (3.396 Å/127.6°) compared to body–body interactions (2.881 Å/99.05°). Hence, the Jwb interaction is expected to be weak compared to the Jbb interaction. Secondly, the counter complementarity effect on the orbitals caused by the carboxylate bridge between the Mn(III) centers considerably reduces the JAF contribution to the Jwb value.89–91 This explains why the Jwb interactions are small in magnitude compared to the Jbb values. Calculations on the dimeric model complexes representing the Jwb interactions further validate our observation on the polynuclear complex [see Tables S11 and S12†]. In complex 2, both Mn(III) centers are in the distorted Oh environment and bridged by two μ2-O− methoxy bridges. The J.–T. axes in both Mn(III) centers are parallel and oriented towards the Mn–O bond (bridging methoxy) in the Mn2O2 core. This J.–T. axis arrangement forces dx2−y2 to be HOMO and mediates exchange via the μ-O methoxy bridges, which largely depends on the ∠Mn–O–Mn bond angle and average Mn–O (bridging) bond distances.19–24
The computed spin density on the Mn(III) center is 3.742 a.u., showing a highly delocalized nature, while the sizable spin density on the bridging O atoms (0.038 each O atom) reflects a spin-delocalized mechanism that is operative through the bridges. Due to the large ∠Mn–O–Mn bond angle in 2 (∼99.4°), the orbital orthogonality decreases, and subsequently, the ferromagnetic contribution to the J value. On the other hand, the presence of other competing interactions and cross-interactions cancels out each other, resulting in the weak antiferromagnetic exchange interaction of ∼−0.4 cm−1 between the Mn(III) centers. The computed J values reasonably agree with the previous reports on the μ-oxo bridged Mn(III) centers.92–96
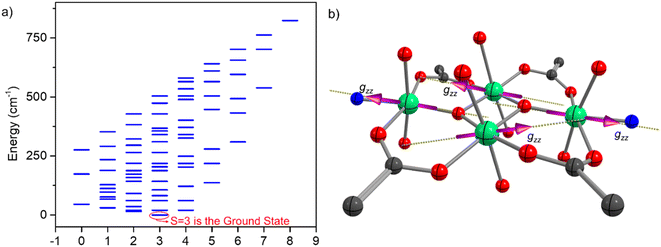
For complex 1, we have noticed a spin–flop behavior, which is typically a manifestation of the spin-frustration in the weakly anisotropic systems. To understand the spin frustration in 1, we have computed the energy ladder of the magnetic spin states (Heisenberg) resulting from the interaction of all of the Mn(III) centers in 1. Here, we have used DFT computed J values and computed the relative energies of all possible spin-states through diagonalization of the spin Hamiltonian. The DFT computed eigenvalue plot predicts the seven-fold degenerate S = 3 ground state for 1. The excited state is fivefold degenerate S = 2, which is ∼15 cm−1 higher in energy than the S = 3 state. This nested arrangement of the energy levels of the ground and excited state represents the spin frustration in 1. The strongest body–body interactions enforce the cancellation of these ions' magnetic moments. However, the relatively weak antiferromagnetic Jwb interactions (−7.6 cm−1) between the body–wing interactions cannot uniquely define the S = 0 spin state, thus resulting in the spin-frustration behavior. This can be better visualized in Fig. 16, where the most stable (S = 0) broken symmetry solution emerges from the strong antiferromagnetic interaction (Jbb) between the ferromagnetically coupled Mn(III) centers. The stabilization of the degenerate S = 3 spin ground state, followed by several other degenerate excited states, suggests spin-frustration behavior in 1.
We have also computed the g-tensor and D-tensor of the individual Mn(III) ions of 1 using complete active space self-consistent field (CASSCF) methodology.97 Using an active space of CAS(4,5), we computed 5 quintets and 35 triplet states and performed spin–orbit calculations using the spin–orbit mean field one electron operator (SOMF-1X).98 The computed D values are −3.06 cm−1 and −3.01 cm−1 for Mn(III) at the wing and body positions, respectively. The computed D values agree with the previously reported distorted octahedral complexes.9 The computed g-values are gmin = 1.9718 (1.9705); gmin = 1.9936 (1.9946), and gmax = 1.9968 (1.9952) for the Mn(III) ions located at the wing (body) positions. The computed orientation of the main magnetic axis (gzz) for all of the centers is plotted in Fig. 17b. The orientation of the gzz axis of the individual Mn(III) centers at body positions is opposite and lies in the plane formed by the Mn2O2 core. On the other hand, the gzz axis for the Mn(III) centers at the wing positions are pointed outwards towards the N atom. The orientation of the gzz axis of all Mn(III) centers together represents a typical picture of spin frustration. The spin frustration and weak zero-field splitting associated with the Mn(III) ions result in the spin–flop behavior in 1. A H-bonded 1D zig-zag chain of (H2O)2(salen)2MnIII2Fe(CN)5(NO) showed the spin–flop like behavior of the short-range, or mostly molecular origin via proper combination of antiferromagnetic interaction (J) and negative D value of the MnIII centers [J = −0.45 cm−1 and D = −2.46 cm−1]. These have been methodically elaborated, producing the sigmoidal shape of the M vs. H plots by the MAGPACK fits with the variation of J and D values.77 A H-bonded one-dimensional dicationic (H2O)2(saltmen)2MnIII2 dimer having weak intra-dimer ferromagnetic coupling [J1 = +1.79 cm−1] with negative D value [D = −2.53 cm−1] could also produce the sigmoidal shape of the M vs. H plot with the inter-dimer antiferromagnetic interaction [zJ = −0.79 cm−1].81 An antiferromagnetically coupled [MnIII(salen)H2O]3[WV(CN)8]·H2O with magnetic anisotropy having inter-molecular H-bonding interaction was previously reported to exhibit an antiferromagnetically ordered state below 4.6 K, and displayed spin–flop behavior at 1.9 K with the transition of the spin state from ST = 3/2 to 5/2 at H = 28![[thin space (1/6-em)]](https://www.rsc.org/images/entities/char_2009.gif) 000 Oe [MnIII3WV; J1 = −1.5 cm−1, J2 = −3.9 cm−1, J′ = −0.7 cm−1, and g = 1.99].84 Another antiferromagnetically coupled [g = 1.96, J = −5.4 cm−1, D = −3.8 cm−1, and zJ = −0.2 cm−1]79 H-bonded 3D polymeric complex [MnIII2WV⋯Mn(salen)+]n containing discrete anionic (salen)2MnIII2WV(CN)8 and cationic MnIII(salen)+ also displays a field-induced spin–flop magnetic phase transition from the antiferromagnetic to a paramagnetic state among the trimer–trimer and trimer–monomer.79 In general, the D values of MnIII ions with Jahn–Teller elongation and compression are found to be negative and positive, respectively.83 An antiferromagnetically coupled molecular wheel [Fe(OMe)2(O2CCH2Cl)]10 with a spin ground state S = 0 was previously isolated.73 It displayed a field-dependent population of different ms levels [0 → −1, −1 → −2, −2 → −3, −3 → −4], leading to the observation of a step-like feature in its M vs. H plot at 0.6 K.73 Spin-canted antiferromagnetism was observed in an anionic Co6 wheel [{K2[CoO3PCH2N(CH2CO2)2]}6·xH2O] below 20 K. It is believed to be originated from molecular origin, rather than bulk magnetic phase transition. The large single ion magnetic anisotropy of the Co(II) ion has been stated to be the reason for the unusual magnetic behavior.74
000 Oe [MnIII3WV; J1 = −1.5 cm−1, J2 = −3.9 cm−1, J′ = −0.7 cm−1, and g = 1.99].84 Another antiferromagnetically coupled [g = 1.96, J = −5.4 cm−1, D = −3.8 cm−1, and zJ = −0.2 cm−1]79 H-bonded 3D polymeric complex [MnIII2WV⋯Mn(salen)+]n containing discrete anionic (salen)2MnIII2WV(CN)8 and cationic MnIII(salen)+ also displays a field-induced spin–flop magnetic phase transition from the antiferromagnetic to a paramagnetic state among the trimer–trimer and trimer–monomer.79 In general, the D values of MnIII ions with Jahn–Teller elongation and compression are found to be negative and positive, respectively.83 An antiferromagnetically coupled molecular wheel [Fe(OMe)2(O2CCH2Cl)]10 with a spin ground state S = 0 was previously isolated.73 It displayed a field-dependent population of different ms levels [0 → −1, −1 → −2, −2 → −3, −3 → −4], leading to the observation of a step-like feature in its M vs. H plot at 0.6 K.73 Spin-canted antiferromagnetism was observed in an anionic Co6 wheel [{K2[CoO3PCH2N(CH2CO2)2]}6·xH2O] below 20 K. It is believed to be originated from molecular origin, rather than bulk magnetic phase transition. The large single ion magnetic anisotropy of the Co(II) ion has been stated to be the reason for the unusual magnetic behavior.74
A 3D frame work of [MnII(N(CN)2)2(pyrazine)]n exhibited a field-induced antiferromagnetic to spin–flop transition at 0.43 T and a spin–flop to paramagnetic transition at 2.83 T, which have been confirmed by magnetic susceptibility, specific heat capacity, neutron diffraction measurements and theoretical calculations.78 A mixed valence 3D polymeric magnetic network of MnIII2MnIIO(SeO3)3 displays two successive long-range antiferromagnetic orderings with ∼4.5 K and ∼45 K and a field-induced spin–flop transition at a critical field of 45![[thin space (1/6-em)]](https://www.rsc.org/images/entities/char_2009.gif) 000 Oe at low temperature, which have been confirmed by both magnetic and specific heat capacity measurements.80
000 Oe at low temperature, which have been confirmed by both magnetic and specific heat capacity measurements.80
4. Materials and measurement
All of the reactions were performed under aerobic conditions. All of the chemicals and solvents were purchased from commercial sources, and used as received. Chemical structures of ligands H2L1, H2L2 and H2L3 are shown in Scheme 1, which have been synthesized as per the reported procedure.99,100 The synthetic procedure of H2L4 was discussed [see ESI†]. FT-IR spectra of solid samples were recorded using a Jasco FT/IR-4100 spectrometer in the wavenumber range of 400–4000 cm−1. Elemental analysis was performed using a Thermo Scientific Flash 2000 elemental analyzer. Magnetic susceptibility measurements for complexes 1, 2, 3 and 4 were performed using the MPMS quantum design SQUID magnetometer with a 7 T magnet in the temperature range of 1.8–300 K. Single-crystal data of 1–3 were collected on a Bruker AXS Kappa APEX2 CCD diffractometer using graphite-monochromated Mo Kα (λ = 0.71073 Å) radiation source at 200 K. The single crystal data related to 4 were discussed in the ESI.† The data were integrated using SAINT PLUS, and the absorption corrections were performed using the multi-scan absorption correction method (SADABS). The structure was solved by the direct method (SHELXS-97)101 and refined using SHELXL-2018/3 associated with the WinGX program package.102,103 Anisotropic refinement was applied for non-hydrogen atoms, whereas isotropic refinement was applied for hydrogen atoms and their positions were calculated using a riding model. The disordered lattice solvent molecules in complexes 2 and 3 could not be modeled. Therefore, the contribution of their intensities was omitted using the SQUEEZE option in the PLATON program.104 The detailed crystallographic data and structural refinement parameters for complexes 1–4 are given [see Table S1 in ESI†].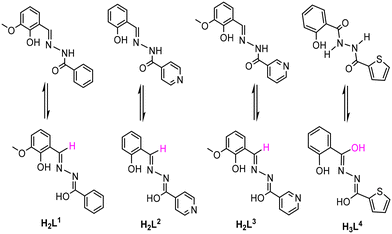 | ||
| Scheme 1 Keto and enol forms of multidentate organic ligands (H2L1, H2L2, H2L3 and H3L4) used for the synthesis of 1, 2, 3 and 4. | ||
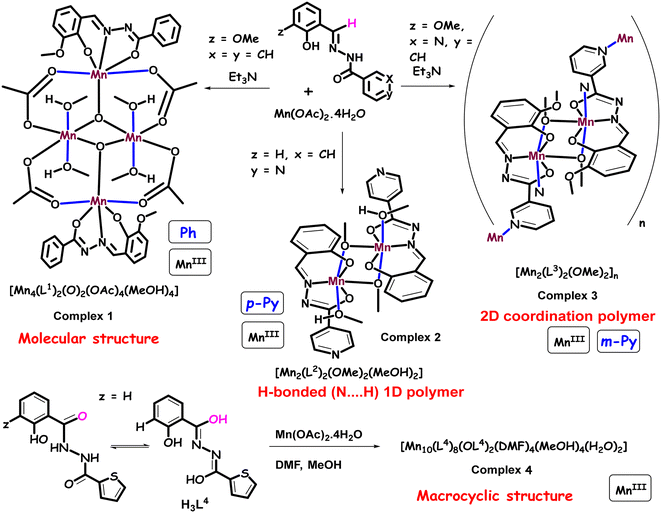 | ||
| Scheme 2 Synthetic routes for the coordination complexes 1 (Ph), 2 (p-py), 4 (with an extra OH-group), and 2D coordination polymer 3 (m-py). The blue lines represent the Jahn–Teller axes. | ||
4.1 Synthesis of [MnIII4(μ3-O)2(L1)2(OAc)4(HOMe)4] (1)
The mixture of Mn(OAc)2·4H2O (0.5 mmol, 125 mg) and H2L1 (0.15 mmol, 40 mg) in 10 mL of methanol was stirred, and then triethylamine (0.54 mmol, 54 mg) was added. Furthermore, the reaction mixture was allowed to stir at room temperature for 1.5 h. During this period, the color of the reaction mixture was changed from yellow to dark brown. Suitable brown crystals of complex 1 were grown by diffusing ether into the reaction solution after a week. The weight of the isolated 1 was 48 mg (yield 29%). Elemental analysis (%) calculated: C 43.92, H 4.21, N 4.88; experimentally obtained: C 43.45, H 4.53, N 4.67; IR (KBr, cm−1): 3417(b), 1580(vs), 1392(vs), 1249(vs), 1108(m), 1021(m), 978(m), 907(m), 854(m), 740(s), 700(vs), 602(vs), 452(w). Earlier, Li et al. have reported similar crystal structures using different synthetic procedures.374.2 Synthesis of [Mn2(L2)2(μ-OMe)2(HOMe)2] (2)
Triethylamine (0.18 mmol, 18 mg) was added to a stirred methanolic solution of Mn(OAc)2·4H2O (0.2 mmol, 50 mg) and H2L2 (0.1 mmol, 24 mg) in 10 mL of methanol. Stirring was continued for 30 min to obtain a dark brown solution. The dark block-shaped single crystals of 2 were isolated after 3 days, on slow evaporation of the methanol solution at room temperature. Yield = 37.8%. Elemental analysis (%) calculated: C 50.29, H 4.78, N 11.73; experimentally obtained: C 50.23, H 4.91, N 11.45; IR stretching frequencies (KBr, cm−1): 3478(b), 2805(w), 2357(w), 1608(s), 1573(vs), 1514(s), 1423(s), 1341(s), 1281(w), 1219(w), 1152(w), 1017(m), 976(w), 902(w), 847(m), 759(m), 712(m), 603(m), 535(w).4.3 Synthesis of [Mn(L3)(OMe)]n (3)
The coordination polymer 3 was obtained by stirring Mn(OAc)2·4H2O (0.2 mmol, 50 mg), H2L3 (0.1 mmol, 27.1 mg), and triethylamine (0.4 mmol, 42 mg) in 10 mL of methanol for 40 min at room temperature. Single crystals of 3 suitable for SC-XRD studies were grown by slow evaporation of the methanol solution at room temperature after 3 days. Yield = 37.6%. Elemental analysis (%) calculated: C 50.72, H 3.97, N 11.83; experimentally obtained: C 50.46, H 4.44, N 11.58; IR stretching frequencies (KBr, cm−1): 3434(b), 2919(w), 2803(w), 2345(w), 1602(vs), 1547(s), 1520(s), 1438(s), 1336(m), 1295(m), 1248(s), 1210(m), 1036(m), 968(w), 866(w), 729(m), 634(w), 521(m).4.4 Synthesis of [Mn10(L4)8(OL4)2(DMF)4(MeOH)4(H2O)2] (4)
H3L4 (0.2 mmol; 52.4 mg) was dissolved in a mixture of 1 mL of DMF and 1.8 mL of distilled MeOH to obtain a colorless clear solution. Then separately, Mn(OAc)2·4H2O (0.2 mmol; 58.1 mg) was dissolved in 2.8 mL of distilled methanol and stirred until it became a clear light pink colored solution. The methanolic solution containing Mn(OAc)2·4H2O was slowly layered into the vial containing a solution of H3L4 ligand, leaving two distinct layers of dark brown and colorless. Two days later, black needle shaped crystals of 4 were formed. Yield = 10.4%. Elemental analysis (%) calculated: C 53.01, H 3.86, N 10.91, S 10.40; experimentally obtained: C 53.11, H 4.44, N 10.85; S 10.45; IR stretching frequencies (KBr, cm−1): 3111(w), 3058(w), 2930(w), 2860(w), 2360(s), 2338(s), 1650(s), 1600(s), 1664(m), 1558(s), 1491(s), 1419(m), 1362(m), 1310(s), 1243(m), 1146(w), 1100(w), 1089(w), 1032(m), 930(w), 871(w), 847(w), 754(s), 718(s), 672(s), 600(m), 554(w), 476(w), 446(w).4.5 Computational methodology
All calculations were performed on the X-ray crystal structure and carried out using ORCA 4.2.1 code.105 First, we optimized the position of the hydrogens using BP86 functional and SV basis sets, and hydrogen-optimized coordinates have been taken further for the calculations of Spin-Hamiltonian (SH) parameters.106 Scalar relativistic density functional theory (SR-DFT) calculations have been employed to compute the magnetic exchange interaction (J) between the Mn(III) ions in complexes 1 and 2. Scalar relativistic effects were incorporated using the Douglas–Kroll–Hess (DKH) approximation, as implemented in ORCA. Here, we have used B3LYP functional along with a DKH-adapted version of the def2-TZVP (DKH-def2-TZVP) basis set for all of the atoms.107–109 Dispersion interaction was accounted for using Grimme's dispersion and the Becke–Johnson damping (D3BJ)110,111 scheme, as implemented in ORCA. “TightSCF” criteria were used throughout the calculations to achieve numerical accuracy (1 × 10⁻⁸ Eh). To speed up the calculations, we have resolution-of-identity-chain-of-sphere (RIJCOSX) formalism as implemented in ORCA.112,113 Noodleman's broken-symmetry (BS) approach has been utilized to compute the magnetic exchange interaction in complexes 1 and 2.85 BS-DFT calculations have been instrumental in computing the J values in a variety of polynuclear transition metal complexes. Here, we have computed the desired BS solutions by flipping the spin on the Mn(III) centers. The correctness of the BS solutions was verified by analyzing the spin density on the Mn(III) centers.In complex 1, we have used the following Hamiltonian for calculations of the magnetic exchange interactions,
| Ĥ = −2Jwb1(Ŝ1Ŝ2 + Ŝ3Ŝ4) − 2Jwb2(Ŝ2Ŝ3 + Ŝ1Ŝ4) − 2JbbŜ2Ŝ4 | (4) |
The J values are calculated using the formulation proposed by Ruiz et al., which has proven robust in computing J values in various transition metal complexes.114
| Ĥ = −2J(ŜMn1ŜMn2) | (5) |
5. Conclusion
In conclusion, we have reported on tetra-, di-nuclear and deca-nuclear MnIII coordination complexes [MnIII4(μ3-O)2(L1)2(OAc)4(HOMe)4] (1; a tetrameric coordination cluster), [MnIII2(L2)2(μ2-OMe)2(HOMe)2] (2; a dimeric complex), [Mn10(L4)10(OL4)2(DMF)4(MeOH)4(H2O)2] (4; a decameric coordination cluster) and a 2D coordination polymer [MnIII(L3)(OMe)]n (3; a coordination polymer) multi-dentate organic ligands (H2L1, H2L2, H3L4 and H2L3). The molecular crystal structure, coordination geometries, and hydrogen bonding interactions of these compounds 1–4 were studied using X-ray single crystal analyses. The MnIII ions in 1–4 possess a distorted octahedral geometry, and their +3 oxidation states were rationalized by the bond valence sum calculations and charge balance considerations. Jahn–Teller elongation along a z-axis was observed in all complexes. For complex 3, the dimerization of asymmetric units in the crystal lattice leads to a basic parallelogram consisting of MnIII2 units, while all other three complexes are molecular in nature (1, 2, 4). Magnetic susceptibility studies reveal that the χT values fall gradually on cooling the powdered samples, indicating the strong intramolecular anti-ferromagnetic coupling within 1. Furthermore, crossing in M vs. H plots was observed in the tetra nuclear molecular cluster of MnIII4 in 1. In complexes 2 and 3, there is a weak anti-ferromagnetic exchange propagating through the double μ2-OMe bridges. BS-DFT calculations correctly predict the sign and magnitude, and provide the mechanism of magnetic exchange interaction in complexes 1 and 2. Calculations of the energy ladder of the magnetic spin states (Heisenberg) resulting from the DFT J values predict an S = 3 ground state with the nested arrangement of other low-lying excited states for 1, leading to the manifestation of spin frustration that agrees with the experiment. It finally appears like a spin flop phenomenon in the molecular MnIII4 (1) cluster that is remarkable, taking the advantage of spin grouped state and weak single ion magnetic anisotropy of each MnIII ion. The observation of spin flop behavior in the Mn-based molecular cluster is unprecedented to the best of our knowledge. The spin–flop like behavior in 1 and 3 has been supported with magnetic field dependent heat capacity measurements.There is no significant intermolecular interaction transmitted/mediated through the hydrogen bonds (N⋯H bonds) between the dimeric complexes of 2, whereas effective intermolecular anti-ferromagnetic interaction (zj′ = −0.28 K) is propagated through the pyridine rings of L3 of 3. Both single-ion magnetic anisotropy and intra/intermolecular interaction play an important role in the overall bulk magnetic properties of 3. The combination of a moderate zero-field splitting in MnIII ions and relevant intra/intermolecular anti-ferromagnetic interaction between the MnIII ions results in a spin–flop like transition with a critical field of 60![[thin space (1/6-em)]](https://www.rsc.org/images/entities/char_2009.gif) 000 Oe in 3. CASSCF calculations were performed on individual Mn(III) centers, predicting small negative D values for complexes 1 and 2. Whereas, there is no sign of spin flop due to the large separation between Mn1–Mn1 in dimer 2. Thus, 2 is a weak anti-ferromagnetic system. Designing such an extended polymeric magnetic network provides captivating candidates for studying different and fascinating magnetic phenomena. The thermal stability of complexes 1–3 were investigated by thermo-gravimetric analysis [see Fig. S10–S13 in ESI†]. Complex 4 represents a strongly antiferromagnetically coupled MnIII10 macrocycle, which has been designed and synthesized by introducing an extra phenolic OH-group in the ligand.
000 Oe in 3. CASSCF calculations were performed on individual Mn(III) centers, predicting small negative D values for complexes 1 and 2. Whereas, there is no sign of spin flop due to the large separation between Mn1–Mn1 in dimer 2. Thus, 2 is a weak anti-ferromagnetic system. Designing such an extended polymeric magnetic network provides captivating candidates for studying different and fascinating magnetic phenomena. The thermal stability of complexes 1–3 were investigated by thermo-gravimetric analysis [see Fig. S10–S13 in ESI†]. Complex 4 represents a strongly antiferromagnetically coupled MnIII10 macrocycle, which has been designed and synthesized by introducing an extra phenolic OH-group in the ligand.
Author contributions
The manuscript was written through the contributions of all authors. All authors have given approval to the final version of the manuscript.Conflicts of interest
The authors have no conflicts to declare.Acknowledgements
This work was supported by SERB, New Delhi ECR grant (ECR/2016/000890) and seed grant, IIT Madras. K. C. M. gratefully acknowledges the ECR financial support. J. S. thanks IITM for the HTRA fellowship. K. C. M. thanks Prof. A. K. P. and Dr. Y. L. for magnetic data, physics department IIT Madras for heat chapacity measurements and Pragyansh for the correction of the manuscript.References
- X. Y. Wang, C. Avendano and K. R. Dunbar, Chem. Soc. Rev., 2011, 40, 3213–3238 RSC.
- E. P. Beaumier, A. J. Pearce, X. Y. See and A. I. Tonks, Nat. Rev. Chem., 2019, 3, 15–34 CrossRef.
- Q. C. Mu, J. Chen, C. G. Xia and L. W. Xu, Coord. Chem. Rev., 2018, 374, 93–113 CrossRef CAS.
- X. Y. Wang, L. Wang, Z. M. Wang, G. Su and S. Gao, Chem. Mater., 2005, 17, 6369–6380 CrossRef CAS.
- C. Dendrinou-Samara, J. P. S. Walsh, C. A. Muryn, D. Collison, R. E. P. Winpenny and F. Tuna, Eur. J. Inorg. Chem., 2018, 3-4, 485–492 CrossRef.
- E. C. Yang, Z. Y. Liu, X. Y. Wu, H. Chang, E. C. Wang and X. J. Zhao, Dalton Trans., 2011, 40, 10082–10089 RSC.
- W. Li, Z. F. Ju, Q. X. Yao and J. A. Zhang, CrystEngComm, 2008, 10, 1325–1327 RSC.
- H. Miyasaka, R. Clérac, W. Wernsdorfer, L. Lecren, C. Bonhomme, K. Sugiura and M. A. Yamashita, Angew. Chem., 2004, 116, 2801–2805 CrossRef PubMed.
- M. Sobocińska, M. Antkowiak, M. Wojciechowski, G. Kamieniarz, J. Utko and T. Lis, Dalton Trans., 2016, 45, 7303–7311 RSC.
- K. C. Mondal, M. Mereacre, G. E. Kostakis, Y. Lan, C. E. Anson, I. Prisecaru, O. Waldmann and A. K. Powell, Chem. – Eur. J., 2015, 21, 10835–10842 CrossRef CAS.
- S. Konar and A. Clearfield, Inorg. Chem., 2008, 47, 3489–3491 CrossRef CAS.
- V. K. Yachandra, V. J. DeRose, M. J. Latimer, I. Mukerji, K. Sauer and M. P. Klein, Science, 1993, 260, 675–679 CrossRef CAS.
- K. Sauer, V. K. Yachandra, R. D. Britt and M. P. Klein, in as a Manganese Redox Enzymes, ed. V. L. Pecoraro, VCH Publishers, New York, 1992, pp. 141–175 Search PubMed.
- V. C. Quee-Smith, L. DelPizzo, S. H. Jureller, J. L. Kerschner and R. Hage, Inorg. Chem., 1996, 35, 6461–6465 CrossRef CAS.
- J. T. Groves and M. K. Stern, J. Am. Chem. Soc., 1987, 109, 3812–3814 CrossRef CAS.
- H. Nagao, M. Nishino, Y. Shigeta, T. Soda, Y. Kitagawa, T. Onishi, Y. Yoshioka and K. Yamaguchi, Coord. Chem. Rev., 2000, 198, 265–295 CrossRef CAS.
- G. Aromi, M. J. Knapp, J. P. Claude, J. C. Huffman, D. N. Hendrickson and G. Christou, J. Am. Chem. Soc., 1999, 121, 5489–5499 CrossRef CAS.
- A. J. Tasiopoulos, A. Vinslava, W. Wernsdorfer, K. A. Abboud and G. Christou, Angew. Chem., Int. Ed., 2004, 43, 2117–2121 CrossRef CAS.
- N. Sarkar, K. Ghosh, R. G. Prieto, S. Herrero and S. Chattopadhyay, Polyhedron, 2019, 164, 138–145 CrossRef CAS.
- S. Saha, D. Mal, S. Koner, A. Bhattacherjee, P. Gütlich, S. Mondal, M. Mukherjee and K. I. Okamoto, Polyhedron, 2004, 23, 1811–1817 CrossRef CAS.
- D. J. Hodgson, B. J. Schwartz and T. N. Sorrell, Inorg. Chem., 1989, 28, 2226–2228 CrossRef CAS.
- P. Seth, S. Giri and A. Ghosh, Dalton Trans., 2015, 44, 12863–12870 RSC.
- S. Mandal, A. K. Rout, M. Fleck, G. Pilet, J. Ribas and D. Bandyopadhyay, Inorg. Chim. Acta, 2010, 363, 2250–2258 CrossRef CAS.
- K. R. Vignesh, S. K. Langle, C. J. Gartshore, I. Borilović, C. M. Forsyth, G. Rajaraman and K. S. Murray, Dalton Trans., 2018, 47, 11820–11833 RSC.
- T. C. Stamatatos, A. Vinslava, K. A. Abboud and G. Christou, Chem. Commun., 2009, 2839–2841 RSC.
- M. Manoli, A. Collins, S. Parsons, A. Candini, M. Evangelisti and E. K. Brechin, J. Am. Chem. Soc., 2008, 130, 11129–11139 CrossRef CAS PubMed.
- H. C. Yao, Y. Z. Li, Y. Song, Y. S. Ma, L. M. Zheng and X. Q. Xin, Inorg. Chem., 2006, 45, 59–65 CrossRef CAS.
- T. C. Stamatatos, K. A. Abboud, W. Wernsdorfer and G. Christou, Angew. Chem., Int. Ed., 2008, 47, 6694–6698 CrossRef CAS.
- H. Li, Z. J. Zhong, C. Duan, X. You, T. C. W. Mac and B. Wu, J. Coord. Chem., 1997, 41, 183–189 CrossRef CAS.
- C. E. Hulme, M. Watkinson, M. Haynes, R. G. Pritchard, C. A. McAuliffe, N. Jaiboon, B. Beagley, A. Sousa, M. R. Bermejo and M. Fondo, J. Chem. Soc., Dalton Trans., 1997, 1805–1814 RSC.
- M. R. Bermejo, A. Castineiras, J. C. G. Monteagudo, M. Rey, A. Sousa, M. Watkinson, C. A. McAuliffe, R. G. Pritchard and R. L. Beddoes, J. Chem. Soc., Dalton Trans., 1996, 2935–2944 RSC.
- N. Matsumoto, H. Okawa, S. Kida, T. Ogawa and A. Ohyoshi, Bull. Chem. Soc. Jpn., 1989, 62, 3812–3816 CrossRef CAS.
- H. Miyasaka, N. Matsumoto, H. Okawa, N. Re, E. Gallo and C. Floriani, J. Am. Chem. Soc., 1996, 118, 981–994 CrossRef CAS.
- L. Lecren, W. Wernsdorfer, Y. Li, O. Roubeau, H. Miyasaka and R. Clérac, J. Am. Chem. Soc., 2005, 127, 11311–11317 CrossRef CAS PubMed.
- Z. Lu, M. Yuan, F. Pan, S. Gao, D. Zhang and D. Zhu, Inorg. Chem., 2006, 45, 3538–3548 CrossRef.
- M. N. Leuenberger and D. Loss, Nature, 2001, 410, 789–793 CrossRef CAS.
- G. M. Yu, L. Zhao, Y. N. Guo, G. F. Xu, L. F. Zou, J. Tang and Y. H. Li, J. Mol. Struct., 2010, 982, 139–144 CrossRef CAS.
- D. Matoga, J. Szklarzewicz, K. Stadnicka and M. S. Shongwe, Inorg. Chem., 2007, 46, 9042–9044 CrossRef CAS PubMed.
- H. H. Monfared, Z. Kalantari, M. A. Kamyabi and C. Janiak, Z. Anorg. Allg. Chem., 2007, 633, 1945–1948 CrossRef CAS.
- M. Albrecht, Y. F. Liu, S. C. S. Zhu, C. A. Schalley and R. Frohlich, Chem. Commun., 2009, 1195–1197 RSC.
- H. H. Monfared, S. Sadighian, M. A. Kamyabi and M. A. Mayer, J. Mol. Catal. A: Chem., 2009, 304, 139–146 CrossRef CAS.
- D. S. Badiger, R. S. Hunoor, B. R. Patil, R. S. Vadavi, C. V. Mangannavar, I. S. Muchchandi and K. B. Gudasi, J. Mol. Struct., 2012, 1019, 159–165 CrossRef CAS.
- C. H. Ge, A. L. Cui, Z. H. Ni, Y. B. Jiang, L. F. Zhang, J. Ribas and H. Z. Kou, Inorg. Chem., 2006, 45, 4883–4885 CrossRef CAS PubMed.
- P. H. Lin, S. Gorelsky, D. Savard, T. J. Burchell, W. Wernsdorfer, R. Clerac and M. Murugesu, Dalton Trans., 2010, 39, 7650–7658 RSC.
- A. K. Bar, C. Pichon and J. P. Sutter, Coord. Chem. Rev., 2016, 308, 346–380 CrossRef CAS.
- J. L. Liu, Y. C. Chen, F. S. Guo and M. L. Tong, Coord. Chem. Rev., 2014, 281, 26–49 CrossRef CAS.
- H. Huang, W. Gao, F. Liu, X. M. Zhang and J. P. Liu, Inorg. Chim. Acta, 2019, 484, 414–423 CrossRef CAS.
- X. H. Zhou, Q. Q. Chen, B. L. Liu, L. Li, T. Yang and W. Huang, Dalton Trans., 2017, 46, 430–444 RSC.
- T. Wang, C. L. Zhang, Z. M. Ju and H. G. Zheng, Dalton Trans., 2015, 44, 6926–6935 RSC.
- Q. Sun, A. L. Cheng, Y. Q. Wang, Y. Ma and E. Q. Gao, Inorg. Chem., 2011, 50, 8144–8152 CrossRef CAS.
- B. Li, Z. Li, R. J. Wei, F. Yu, X. Chen, Y. P. Xie, T. L. Zhang and J. Tao, Inorg. Chem., 2015, 54, 3331–3336 CrossRef CAS.
- M. H. Zeng, Z. Yin, Y. X. Tan, W. X. Zhang, Y. P. He and M. Kurmoo, J. Am. Chem. Soc., 2014, 136, 4680–4688 CrossRef CAS PubMed.
- S. Konar, S. C. Manna, E. Zangrando, T. Mallah, J. Ribas and N. R. Chaudhuri, Eur. J. Inorg. Chem., 2004, 21, 4202–4208 CrossRef.
- M. Sobocińska, M. Antkowiak, M. Wojciechowski, G. Kamieniarz, J. Utko and T. Lis, Dalton Trans., 2016, 45, 7303–7311 RSC.
- O. Kahn, Molecular Magnetism, VCH-Verlag, Weinheim, New York, 1993 Search PubMed.
- C. Benelli and D. Gatteschi, Chem. Rev., 2002, 102, 2369–2387 CrossRef CAS PubMed.
- T. Matsumoto, T. Shiga, M. Noguchi, T. Onuki, G. N. Newton, N. Hoshino, M. Nakano and H. Oshio, Inorg. Chem., 2010, 49, 368–370 CrossRef CAS.
- J. B. Vincent, C. Christmas, H. R. Chang, Q. Li, P. W. D. Boyd, J. C. Huffman, D. N. Hendrickson and G. Christou, J. Am. Chem. Soc., 1989, 111, 2086–2097 CrossRef CAS.
- V. A. Grillo, M. J. Knapp, J. C. Bollinger, D. N. Hendrickson and G. Christou, Angew. Chem., Int. Ed. Engl., 1996, 35, 1818–1820 CrossRef CAS.
- S. Wang, H. L. Tsai, K. Folting, J. D. Martin, D. N. Hendrickson and G. Christou, J. Chem. Soc., Chem. Commun., 1994, 671–673 RSC.
- G. Aromi, M. J. Knapp, J. P. Claude, J. C. Huffman, D. N. Hendrickson and G. Christou, J. Am. Chem. Soc., 1999, 121, 5489–5499 CrossRef CAS.
- T. C. Stamatatos, V. Nastopoulos, A. Tasiopoulos, E. E. Moushi, W. Wernsdorfer, G. Christou and S. Perleps, Inorg. Chem., 2008, 47, 10081–10089 CrossRef CAS PubMed.
- J. J. Borrás-Almenar, J. M. Clemente-Juan, E. Coronado and B. S. Tsukerblat, Inorg. Chem., 1999, 38, 6081–6088 CrossRef PubMed.
- J. J. Borrás-Almenar, J. M. Clemente-Juan, E. Coronado and B. S. Tsukerblat, J. Comput. Chem., 2001, 22, 985–991 CrossRef.
- R. Bagai, K. A. Abboud and G. Christou, Dalton Trans., 2006, 3306–3312 RSC.
- D. Bieńko, M. Malik-Gajewska, P. Walencik, M. Kaj, W. Zierkiewicz, G. Murtaza, T. Ruffer and S. Ahmad, J. Coord. Chem., 2019, 72, 2215–2232 CrossRef.
- S. Mistri, E. Zangrando, A. Figuerola, A. Adhikary, S. Konar, J. Cano and S. C. Manna, Cryst. Growth Des., 2014, 14, 3276–3285 CrossRef CAS.
- B. G. Cirera, S. V. Coca, M. F. Bardia, E. Ruiz and M. Corbella, Inorg. Chem., 2017, 56, 8135–8146 CrossRef PubMed.
- S. Koizumi, M. Nihei, T. Shiga, M. Nakano, H. Nojiri, R. Bircher, O. Waldmann, S. T. Oschenbein, H. U. Gudel, F. F. Alonso and H. Oshio, Chem. – Eur. J., 2007, 13, 8445–8453 CrossRef CAS PubMed.
- P. Comar, T. R. Kumar, G. S. Nichol, M. B. Pitak, S. J. Coles, G. Rajaraman and E. K. Brechin, Dalton Trans., 2015, 44, 19805–19811 RSC.
- L. K. Thompson, Z. Xu, A. E. Goeta, J. A. K. Howard, H. J. Clase and D. O. Miller, Inorg. Chem., 1998, 37, 3217–3229 CrossRef CAS.
- M. Yuan, F. Zhao, W. Zhang, F. Pan, Z. M. Wang and S. Gao, Chem. – Eur. J., 2007, 13, 2937–2952 CrossRef CAS PubMed.
- K. L. Taft, C. D. Delfs, G. C. Papaefthymiou, S. Foner, D. Gatteschi and S. J. Lippard, J. Am. Chem. Soc., 1994, 116, 823–832 CrossRef CAS.
- S. O. H. Gutschke, D. J. Price, A. K. Powell and P. T. Wood, Angew. Chem., Int. Ed., 1999, 38, 1088–1090 CrossRef CAS PubMed.
- J. K. Mc Cusker, J. B. Vincent, E. A. Schmitt, M. L. Mino, K. Shin, D. K. Coggin, P. M. Hagen, J. C. Huffman, G. Christou and D. N. Hendrickson, J. Am. Chem. Soc., 1991, 113, 3012–3021 CrossRef CAS.
- J. K. Mc Cusker, C. A. Christmas, P. M. Hagen, R. K. Chadha, D. F. Harvey and D. N. Hendrickson, J. Am. Chem. Soc., 1991, 113, 6114–6124 CrossRef CAS.
- C. Yang, Q. L. Wang, Y. Ma, G. T. Tang, D. Z. Liao, S. P. Yan, G. M. Yan and P. Cheng, Inorg. Chem., 2010, 49, 2047–2056 CrossRef CAS PubMed.
- J. L. Manson, Q. Z. Huang, J. W. Lynn, H. J. Koo, M.-H. Whangbo, R. Bateman, T. Otsuka, N. Wada, D. N. Argyriou and J. S. Miller, J. Am. Chem. Soc., 2001, 123, 162–172 CrossRef CAS PubMed.
- H. H. Ko, J. H. Lim, H. S. Yoo, J. S. Kang, H. C. Kim, E. K. Koh and C. S. Hong, Dalton Trans., 2007, 2070–2076 RSC.
- W. Zhang, M. Cui, J. Tian, P. Jiang, G. Qian and X. Lu, Materials, 2022, 15, 5773–5782 CrossRef CAS PubMed.
- H. Miyasaka, R. Clérac, T. Ishii, H. C. Chang, S. Kitagawa and M. Yamashita, J. Chem. Soc., Dalton Trans., 2002, 1528–1534 RSC.
- W. Li, P. T. Barton, R. P. Burwood and A. K. Cheetham, Dalton Trans., 2011, 40, 7147–7152 RSC.
- S. Sundaresan, I. A. Kühne, C. Evesson, M. M. Harris, A. J. Fitzpatrick, A. Ahmed, H. Müller-Bunz and G. G. Morgan, Polyhedron, 2021, 208, 115386 CrossRef CAS and the references herein.
- P. Przychodzeń, K. Lewiński, M. Bałanda, R. Pełka, M. Rams, T. Wasiutyński, C. Guyard-Duhayon and B. Sieklucka, Inorg. Chem., 2004, 43, 2967–2974 CrossRef PubMed.
- L. Noodleman, J. Chem. Phys., 1981, 74, 5737–5743 CrossRef CAS.
- S. Sanz, J. M. Frost, T. Rajeshkumar, S. J. Dalgarno, G. Rajaraman, W. Wernsdorfer, J. Schnack, P. J. Lusby and E. K. Brechin, Chem. – Eur. J., 2014, 20, 3010–3013 CrossRef CAS PubMed.
- N. Berg, T. N. Hooper, J. Liu, C. C. Beedle, S. K. Singh, G. Rajaraman, S. Piligkos, S. Hill, E. K. Brechin and L. F. Jones, Dalton Trans., 2012, 42, 207–216 RSC.
- N. Berg, T. Rajeshkumar, S. M. Taylor, E. K. Brechin, G. Rajaraman and L. F. Jones, Chem. – Eur. J., 2012, 18, 5906–5918 CrossRef CAS PubMed.
- J. Cano, T. Cauchy, E. Ruiz, C. J. Milios, C. C. Stoumpos, T. C. Stamatatos, S. P. Perlepes, G. Christou and E. K. Brechin, Dalton Trans., 2008, 234–240 RSC.
- L. Cañadillas-Delgado, O. Fabelo, J. Pasán, F. S. Delgado, F. Lloret, M. Julve and C. Ruiz-Pérez, Inorg. Chem., 2007, 46, 7458–7465 CrossRef PubMed.
- A. K. Sharma, F. Lloret and R. Mukherjee, Inorg. Chem., 2007, 46, 5128–5130 CrossRef CAS PubMed.
- G. Aromí, S. Bhaduri, P. Artús, J. C. Huffman, D. N. Hendrickson and G. Christou, Polyhedron, 2002, 21, 1779–1786 CrossRef.
- J. B. Vincent, C. Christmas, H. R. Chang, Q. Li, P. D. W. Boyd, J. C. Huffman, D. N. Hendrickson and G. Christou, J. Am. Chem. Soc., 1989, 111, 2086–2097 CrossRef CAS.
- C. Cañada-Vilalta, J. C. Huffman and G. Christou, Polyhedron, 2001, 20, 1785–1793 CrossRef.
- E. Libby, J. K. McCusker, E. A. Schmitt, K. Folting, D. N. Hendrickson and G. Christou, Inorg. Chem., 1991, 30, 3486–3495 CrossRef CAS.
- Y. Yahsi and H. Kara, Spectrochim. Acta, Part A, 2014, 127, 25–31 CrossRef CAS PubMed.
- P.-Å. Malmqvist and B. O. Roos, Chem. Phys. Lett., 1989, 155, 189–194 CrossRef CAS.
- F. Neese, J. Chem. Phys., 2005, 122, 034107 CrossRef PubMed.
- M. Mohamadi, S. Y. Ebrahimipour, J. Castroc and M. T. Mahani, J. Photochem. Photobiol., B, 2016, 158, 219–227 CrossRef CAS PubMed.
- S. N. Shukla, P. Gaur, S. Jhariya, B. Chaurasia, P. Vaidya and M. Azam, J. Coord. Chem., 2019, 72, 664–689 CrossRef CAS.
- G. M. Sheldrick, Program for Crystal Structure Solution, SHELXS-97, University of Göttingen: Göttingen, Germany, 1997 Search PubMed.
- G. M. Sheldrick, Acta Crystallogr., Sect. A: Found. Crystallogr., 2008, 64, 112–122 CrossRef CAS PubMed.
- G. M. Sheldrick, Acta Crystallogr., Sect. C: Struct. Chem., 2015, 71, 3–8 Search PubMed.
- A. L. Spek, J. Appl. Crystallogr., 2003, 36, 7–13 CrossRef CAS.
- F. Neese, Wiley Interdiscip. Rev.: Comput. Mol. Sci., 2017, 8, e1327 Search PubMed.
- A. D. Becke, Phys. Rev. A: At., Mol., Opt. Phys., 1988, 38, 3098–3100 CrossRef CAS PubMed.
- J. P. Perdew, Phys. Rev. B: Condens. Matter Mater. Phys., 1986, 33, 8822–8824 CrossRef PubMed.
- A. D. Becke, J. Chem. Phys., 1993, 98, 5648–5652 CrossRef CAS.
- F. Weigend and R. Ahlrichs, Phys. Chem. Chem. Phys., 2005, 7, 3297–3305 RSC.
- S. Grimme, S. Ehrlich and L. Goerigk, J. Comput. Chem., 2011, 32, 1456–1465 CrossRef CAS PubMed.
- S. Grimme, J. Antony, S. Ehrlich and H. Krieg, J. Chem. Phys., 2010, 132, 154104 CrossRef PubMed.
- R. Izsák and F. Neese, J. Chem. Phys., 2011, 135, 144105 CrossRef PubMed.
- R. Izsák and F. Neese, Mol. Phys., 2013, 111, 1190–1195 CrossRef.
- N. Kaltsoyannis and J. E. McGrady, in Principles and Applications of Density Functional Theory in Inorganic Chemistry II, as a Structure and Bonding, ed. E. Ruiz, Springer, Berlin, Heidelberg, 2004, pp. 71–102 Search PubMed.
Footnote |
| † Electronic supplementary information (ESI) available. CCDC 1860848–1860850 and 2180490 contains the supporting crystallographic details for this paper. For ESI and crystallographic data in CIF or other electronic format see DOI: https://doi.org/10.1039/d3ce00967j |
| This journal is © The Royal Society of Chemistry 2024 |

