 Open Access Article
Creative Commons Attribution 3.0 Unported Licence
A novel method for simultaneous triggering and in situ sensing of internal short circuit in lithium-ion cells
Mary K.
Long
 ,
Siyi
Liu
 and
Guangsheng
Zhang
 *
*
Department of Mechanical & Aerospace Engineering, The University of Alabama in Huntsville, Huntsville, AL 35899, USA. E-mail: gz0002@uah.edu
First published on 20th September 2023
Abstract
Here we report a novel and simple method for triggering internal short circuit (ISC) in Li-ion cells on demand and measuring critical ISC parameters in situ. The method works by inserting a pair of metal pads into a Li-ion cell and connecting the pads outside the cell through a switch and a current sensor. Different types of ISC that are common in field failures can be simulated by this method. ISC current and ISC resistance can be measured. The measurement further enables determination of local ISC heat generation rate. By attaching a micro temperature sensor between the metal pads, the ISC temperature can be also measured. The method was applied to both lab-made single-layer cells and commercially available multiple-layer cells in this work. The results generally verified previous modeling predictions about the effects of ISC types and ISC resistance on behaviors of Li-ion cells. It suggested that the proposed method can be used to validate models and enhance understanding of highly localized and transient behaviors of ISC. It was also demonstrated that the method has minimal effects on Li-ion cell performance and has good repeatability in triggering ISC.
1. Introduction
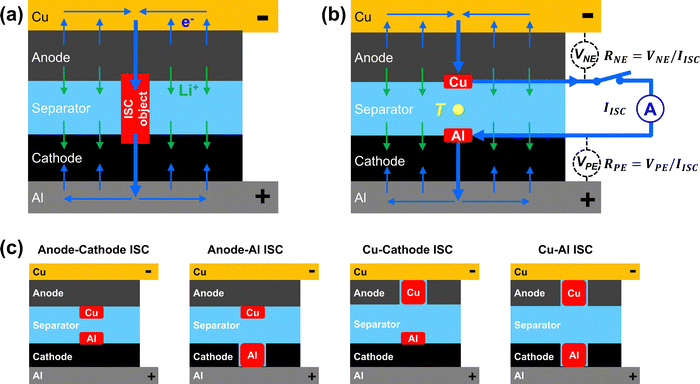
Internal short circuit (ISC) is a critical failure mechanism of lithium-ion (Li-ion) cells that could lead to dangerous thermal runaway. Indeed, ISC has been found to be the likely root cause of Li-ion battery fires that involve a wide range of applications from consumer electronics to electric vehicles, airplanes and grid-scale energy storage.1–4 ISC is more difficult to detect and mitigate than other causes of thermal runaway, including mechanical abuse, electric abuse and thermal abuse. As schematically shown in Fig. 1(a), ISC in a Li-ion cell is a highly localized phenomenon, with internal current and heat generation concentrated at the ISC location. The localized heat generation can cause rapid temperature rise and potentially trigger thermal runaway. Due to the localization of ISC current and heat generation, conventional safety mechanisms like positive temperature coefficient resistance (PTC), thermal shutting-down separators, thermal and current fuses, pressure-release vent and battery management systems (BMS) are not able to protect a Li-ion cell from ISC or consequent thermal runaway.5 During the early stages of ISC in a large and thick Li-ion cell, the cell voltage change would be small and the surface temperature would appear normal, thus making early detection of ISC difficult. Furthermore, there are different types of ISC with different risks of thermal runaway, depending on which cell components are in contact, including anode–cathode ISC, anode-Al ISC, Cu–Al ISC, and Cu-cathode ISC.6Great efforts have been made to understand ISC and evaluate Li-ion cell behaviors during ISC. An important approach is to trigger ISC that is relevant to field failures. Various ISC triggering methods have been developed, such as embedding into a Li-ion cell with a nickel particle,7 a low melting-point metal/alloy particle,8 a wax-covered multi-layer device,9 or a shape memory alloy trigger,10 heating a Li-ion cell with an inserted heater11 or laser,12 nail penetration testing,13 pinch-testing,14,15 indentation testing,16 and equivalent ISC triggering using a switchable heater placed between two cells and powered by the cells.17
Although many ISC triggering methods have been developed, some of which have been adopted by industrial standards,7,18 each method has advantages and disadvantages.19 For example, nail penetration testing, pinch-testing, indentation testing and laser heating can be implemented without modification of Li-ion cells, but these methods cannot control the types of ISC. Embedding a nickel particle can control the types of ISC, but it requires disassembly of fully charged Li-ion cells which is difficult and dangerous. Embedding a low melting-point metal/alloy particle, a wax covered multi-layer device, or a shape memory alloy trigger can control the types of ISC, and implementation of these methods is easier than the nickel particle method, but these methods require external heating of Li-ion cells to phase change temperatures (∼60 °C or higher) of triggering mechanisms, which is significantly higher than the normal operating temperature of Li-ion cells. The method of inserting a heater requires additional heating and cannot control types of ISC. The method of equivalent ISC does not require external heating and the resistance can be easily adjusted, but the switch is placed between two cells and cannot control types of ISC.
Another issue of most existing ISC triggering methods is the lack of in situ sensing capability. Such a capability is important from the perspective of understanding mechanisms and behaviors of ISC because ISC is a highly localized phenomenon. As revealed in previous modeling studies,5,6 heat generation and temperature distribution inside a Li-ion cell during ISC are highly non-uniform. The cell surface temperature, typically measured in ISC tests, responds much slower than the temperature at the ISC location. Furthermore, experimental data from in situ sensing of ISC is valuable in validating electrochemical-thermal coupled numerical models5,6 that are increasingly used in Li-ion cell design. A few reports integrated nail penetration with in situ measurement of ISC temperature20–23 or with high-speed X-ray imaging,21,24,25 but nail penetration cannot control ISC type as noted above. Another report26 combined a wax-covered ISC triggering device, which allows control of ISC type, and in situ monitoring of ISC process based on high-speed X-ray imaging. However, the access to high-speed X-ray imaging is limited and the triggering method requires external heating.
Here we report a novel ISC triggering method that can control types of ISC, allow in situ sensing, and is easy to be adopted by other researchers. Named as simultaneous ISC triggering and sensing method, or ISC-TAS method, it is inspired by the equivalent ISC triggering method,17 the wax-covered device method,9 and our group's small, slow and in situ sensing nail penetration method.22,23 In this study, the method is demonstrated with both lab-made 0.05 Ah single-layer Li-ion cells and commercially available 1.5 Ah and 7 Ah multi-layer Li-ion cells.
2. Experimental
2.1 The method of ISC triggering and in situ sensing
As schematically shown in Fig. 1(a), if a Li-ion cell has an ISC, e.g. triggered by an ISC object, currents will flow inside the cell even when the cell is at rest. While lithium ions (Li+) flow from anode to cathode through separator, electrons (e−) flow from anode to Cu foil current collector, then merge at the ISC location and flow through the ISC object to reach cathode. Merging of the electronic currents through the ISC object can cause a high current and rapid heat generation at the ISC location. The rapid heat generation can then cause rapid temperature rise and potentially lead to thermal runaway. Because all the currents flow inside the cell, they are difficult to measure. In comparison, the proposed ISC triggering and sensing method also creates a high current through a concentrated area internal to the cell, but directs the current outside the cell so that the current can be measured. As schematically shown in Fig. 1(b), a thin Cu pad is inserted between the anode and the separator, and a thin Al pad is inserted between the cathode and the separator. The Cu pad and the Al pad are electrically connected outside the cell through a switch and a current sensor. When the switch is turned on, electronic current will flow from the anode, through the Cu pad, the switch, the current sensor, the Al pad and finally goes to the cathode. Meanwhile, lithium ions flow from the anode to the cathode through the separator, similar to that in Fig. 1(a). By ensuring the resistance of external circuit (including the switch, the current sensor and the extensions of the Cu and Al pads) is much smaller than the ISC resistance, the created ISC current and heat generation in Fig. 1(b) will behave similarly to those in Fig. 1(a). Therefore, this method enables on-demand triggering of ISC in a Li-ion cell.The ISC current (IISC) is measured directly by the current sensor in the external circuit. The resistance between the tab and the pad, RNE and RPE, can be obtained by measuring the voltage between the cell tab and the corresponding pad, VNE and VPE, then dividing the voltages by the ISC current, as indicated in Fig. 1(b). Note that RNE and RPE include contact resistance between the pads and the electrodes as well as material resistance from the tab to the pad. The ISC resistance (RISC) is determined according to eqn (1):
| RISC = RNE + RPE | (1) |
| qgen = IISC2RISC | (2) |
In addition to the anode–cathode ISC shown schematically in Fig. 1(b), the proposed method can create other types of ISC, including anode-Al ISC, Cu-cathode ISC, and Cu–Al ISC, by removing cathode, anode, or both cathode and anode, at the ISC location. Fig. 1(c) shows schematically how the four common types of ISC can be created by placing the ISC pads at different locations and modifying electrodes as needed.
2.2 Fabrication of ISC pad assembly
Fig. 2(a) shows an illustration of the ISC pad assembly. The Cu pad (0.04 mm thick) was cut into a circular shape (5 mm in diameter) with an extended tail. The Cu pad tail was then welded to a Ni tab (4 mm wide and 0.09 mm thick, EQ-PLiB-NTA4, MTI Corporation) for convenience of connection outside the cell. Note that the Ni tab can be replaced by a larger or smaller Ni tab, or by a Cu tab, to match maximum ISC current depending on cell size. The Al pad was made directly from an Al tab (4 mm wide and 0.09 mm thick, EQ-PLiB-ATC4, MTI Corporation). The corners of the Al tab were rounded to match the circular shape of the Cu pad and to avoid piercing the cathode/Al foil. An Al tab was used instead of Al foil to enable high-current passage without melting. An additional layer of 0.5 mm Kapton tape was added to the head region of each of the pads so that the pad area would be 1 mm thicker than the rest of the cell. The purpose of this additional thickness of the pad heads is to ensure reliable contact between the pads and electrodes during ISC tests when the cell is put between two compression plates. The Kapton tape between the pads also prevents direct contact of the pads when the separator between them melts, so that the ISC current can be maintained and measured. The pad tails were insulated and taped together to form a hinge keeping the heads aligned. Lastly, a K-type micro thermocouple (40 AWG, 5TC-TT-K-40-36-ROHS, Omega Engineering) was taped to a small piece of separator and then to the pads to keep the thermocouple tip between the pads.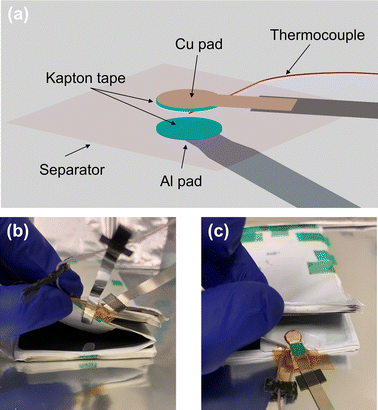 | ||
| Fig. 2 (a) Schematic of ISC triggering pads; (b) and (c) pictures of an experimental cell with inserted ISC triggering pads. | ||
2.3 Insertion of ISC pad assembly into Li-ion cells
Depending on the type of ISC desired, the electrode coating in the pad area of a dry cell was either kept or removed according to Fig. 1(c). The anode coating was removed by scratching it off with a knife and the cathode coating was removed using acetone. Three types of pouch-type Li-ion cells are used in this study: 1.5 Ah commercially available dry cells (Li-FUN Technologies 3051A0, 2.7 mm thick, with 11 layers of double-coated anode and 10 layers of double-coated cathode); 7 Ah dry cells (MTI Corporation, 7.8 mm thick, with 21 layers of double-coated anode and 20 layers of double-coated cathode), and lab-made single-layer 0.05 Ah cells. Fig. 2(b) and (c) show how an ISC pad assembly was inserted into a 1.5 Ah dry cell, positioned on the center layer of the cell at the edge of the electrodes and secured by tape. Note that part of the cathode coating was removed in this cell to create anode-Al ISC.After inserting the pad assembly into a dry cell, the cell was partially sealed in a laminated aluminum pouch (EQ-alf-480-7.5 M, MTI Corporation) and then dried in a vacuum oven for at least 8 hours. Then electrolyte (1 M LiPF6 in EC + EMC, 3![[thin space (1/6-em)]](https://www.rsc.org/images/entities/char_2009.gif) :
:![[thin space (1/6-em)]](https://www.rsc.org/images/entities/char_2009.gif) 7 in volume, MTI Corporation) was added to the cell in an argon-filled glovebox (Labstar Pro, MBRAUN) before the cell was completely sealed. Then, an additional K-type thermocouple (5TC-TT-K-40-36-ROHS, Omega Engineering) was attached to the cell surface above the ISC location with a Kapton tape. Finally, the cell was put between two polycarbonate compression plates with four bolts tightened to 2 Nm torque each and put into formation cycling. The compression is necessary not only to ensure good contact between the ISC pads and electrodes during ISC tests, but also to reduce out-of-plane heat transfer from the cell to the ambient air. Each compression plate is 6.4 mm thick and has low thermal conductivity, ∼0.2 W m−1 K−1, much lower than that of a Li-ion cell (∼1 W m−1 K−1),27 which significantly increases the thermal conduction resistance. The thermal contact resistance between the cell and the compression plate further increases the heat transfer resistance. Therefore, the out-of-plane heat transfer from the cell to the ambient can be significantly reduced by the compression plates. The cells were held at 1.5 V for 12 hours, then charged and discharged at C/20 rate (4.2 V max and 2.8 V min) for one cycle, followed by one more cycle at C/10 rate.
7 in volume, MTI Corporation) was added to the cell in an argon-filled glovebox (Labstar Pro, MBRAUN) before the cell was completely sealed. Then, an additional K-type thermocouple (5TC-TT-K-40-36-ROHS, Omega Engineering) was attached to the cell surface above the ISC location with a Kapton tape. Finally, the cell was put between two polycarbonate compression plates with four bolts tightened to 2 Nm torque each and put into formation cycling. The compression is necessary not only to ensure good contact between the ISC pads and electrodes during ISC tests, but also to reduce out-of-plane heat transfer from the cell to the ambient air. Each compression plate is 6.4 mm thick and has low thermal conductivity, ∼0.2 W m−1 K−1, much lower than that of a Li-ion cell (∼1 W m−1 K−1),27 which significantly increases the thermal conduction resistance. The thermal contact resistance between the cell and the compression plate further increases the heat transfer resistance. Therefore, the out-of-plane heat transfer from the cell to the ambient can be significantly reduced by the compression plates. The cells were held at 1.5 V for 12 hours, then charged and discharged at C/20 rate (4.2 V max and 2.8 V min) for one cycle, followed by one more cycle at C/10 rate.
2.4 Test protocol
For each ISC test, the Cu pad and the Al pad were connected outside the cell through a 0.75 mΩ shunt resistor (SHD1-100C075DE, Ohmite) and a relay switch (LEV200A4ANA, Tyco) which was manually controlled through a power supply. The total resistance of the external circuit is 4 mΩ as measured by a high frequency resistance meter (3561, HIOKI), which is only 10% of the smallest ISC resistance (Cu–Al type ISC), and less than 7% for the other types of ISC. To ensure safety, all the ISC tests were done in a chamber for battery abuse testing (MSK-TE905, MTI Corporation). Voltage was recorded between the cell-voltage tabs, between the positive voltage tab and the Al pad, between the negative voltage tab and the Cu pad, and between the two pads. Internal and surface temperatures were also recorded. All recordings were done by a data acquisition unit (34980A, Keysight Technologies) at the frequency of 5 Hz. Before each ISC test, the Li-ion cells were fully charged by a battery tester (LBT21084, Arbin) at room temperature using a constant current constant voltage (CCCV) protocol (C/2, 4.35 V max for 1.5 Ah cells and 4.2 V max for the 0.05 Ah and 7 Ah cells, C/20 cutoff current).3. Results and discussion
3.1 Performance comparison between baseline cell and ISC cell
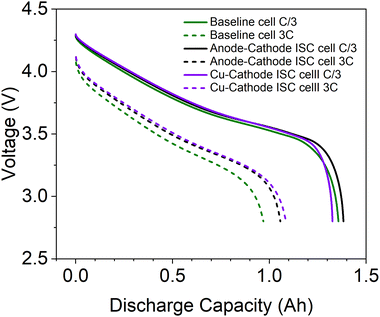
To evaluate the influence of inserted ISC pads on Li-ion cell performance, discharging performance of ISC cells and baseline cells, made from the same batch of dry cells, was compared. As shown in Fig. 3, the performance of ISC pad cells is similar to each other and to that of baseline cell, especially during low current (C/3) discharge. The similarity suggests that the insertion of ISC pads to Li-ion cells has minimal influence on the performance of Li-ion cells.3.2 Results of 1.5 Ah cell during anode-Al ISC
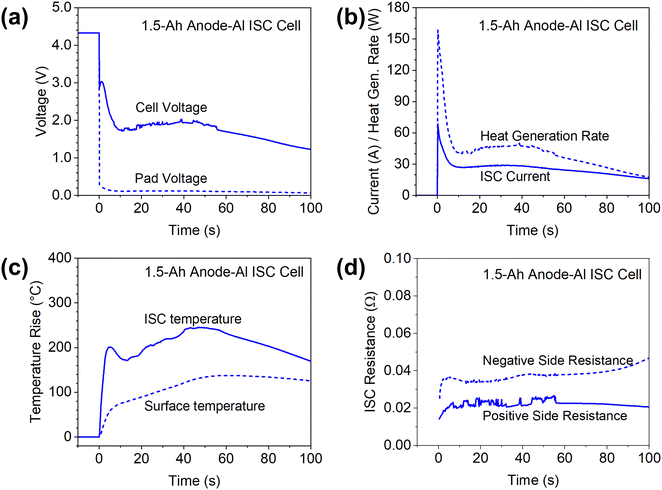
Anode-Al ISC has the highest risk of failures among different types of ISC according to past studies,6 so the results in this case are firstly presented to demonstrate features of the proposed method. Fig. 4 shows the measured cell voltage, pad voltage, ISC current, temperatures, and ISC resistance of a 1.5 Ah cell during anode-Al ISC. Based on the measured ISC current and ISC resistance (the sum of positive side and negative side resistances), the ohmic heat generation rate at the ISC location was calculated and plotted in Fig. 4(b).The cell voltage dropped to below 3 V immediately, corresponding to a high in-rush current of nearly 70 A. The cell voltage dropped further to 1.7 V in ∼10 seconds while the current dropped to ∼27 A, which can be attributed to the rapid increase of cell internal resistance during high current discharge.28 Then both the cell voltage and the ISC current kept increasing slowly until ∼40 seconds before decreasing again, which can be attributed to the increase of temperature and corresponding decrease of cell internal resistance at higher temperatures. The temperature at the ISC location rapidly increased more than 200 °C in a few seconds due to the high ISC current and high heat generation rate. Then the ISC temperature slowly decreased before increasing again, generally following the trend of ISC current and heat generation rate. After reaching a maximum increase of ∼245 °C and staying at that level for ∼10 seconds, the ISC temperature started decreasing. In comparison, the maximum increase of surface temperature was only 137 °C, much lower than that of ISC temperature, although the surface thermocouple was located right above the internal thermocouple. Furthermore, the surface thermocouple failed to capture the temporary drop of temperature at ISC location. Such big differences between the surface temperature and the ISC temperature can be attributed to the low thermal conductivity of Li-ion cell materials in the through-plane/thickness direction,27 only ∼ 1 W m−1 K−1. The differences also suggested the importance of in situ measurement of temperatures inside Li-ion cells for the study of ISC, a highly transient and localized phenomenon.
The measured cathode side resistance was generally stable, while the anode side resistance started increasing slowly after 80 s, which could be attributed to decomposition of the anode at high temperatures. Because the ISC resistance was mostly stable during the testing, the heat generation rate generally follows the trend of ISC current, although the change of heat generation rate is more dramatic because heat generation rate is proportional to the square of ISC current.
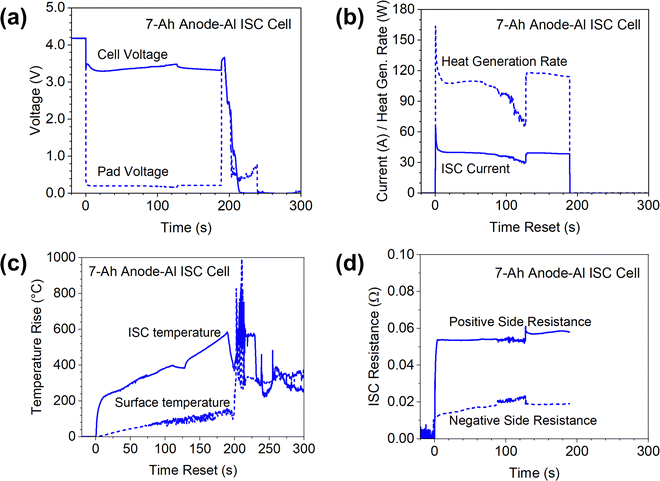
Note that the pad voltage was much smaller than the cell voltage. This not only implies significant non-uniformity of potential distribution along the length of current collectors during ISC, but also implies the difficulty of characterizing ISC based on cell voltage, especially in larger-format Li-ion cells as to be discussed in 7 Ah cell results.
3.3 Effects of ISC type
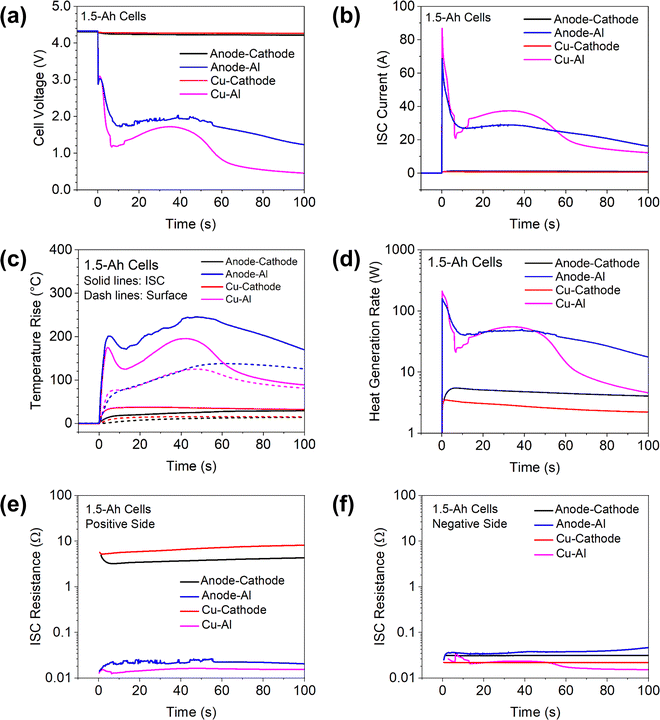
To demonstrate the capability of creating different types of ISC using the proposed ISC pad method, the results of 1.5 Ah cells with three other types of ISC are shown in Fig. 5, including anode–cathode ISC, Cu–Al ISC and Cu-cathode ISC. The results of anode-Al ISC are also shown for convenient comparison. It can be clearly seen that the voltage drop, the ISC current and the temperature rise are very small during anode–cathode ISC and Cu-cathode ISC, which are consistent with past modeling results6 and experimental results6,9 that cathode-involved ISCs have very low risk of thermal failure. However, this phenomenon can be attributed not only to the high resistivity of cathode materials29 as previously reported,6 but also to the high contact resistance between Al pad and cathode.30,31 As shown in Fig. 5(e) and (f) the measured resistance between positive tab and Al pad, which mainly involves contact resistance between Al pad and cathode, is two orders of magnitude higher than the resistance between negative tab and Cu pad. Some ex situ measurements29,30 also reported very high contact resistance between cathode and ISC objects.It is worth noting that these experimental results are consistent with previous modeling studies on the dramatic variation of ISC current and heat generation behaviors. A modeling study by Fang et al.32 suggested that during anode-Al ISC, the high initial current would incur the lithium transport limitations in the solid and electrolyte phases quickly, and thus the discharge current would be greatly reduced, resulting in the rapid decrease of ISC heat generation rate and a sudden drop of ISC temperature. By contrast, the transport limitations would not be observed in the anode–cathode ISC due to the much lower ISC current. These behaviors can be clearly seen in the experimental results in Fig. 5.
It is also worth comparing the difference between Cu–Al ISC and anode-Al ISC in details. The cell voltage drop was greater and the ISC current was higher during Cu–Al ISC than those during Al-anode ISC. However, the temperature rise in the former case was less than that in the latter case. This interesting phenomenon was reported earlier6 and attributed to lower resistivity and higher thermal conductivity of Cu than that of anode. Lower resistivity means lower heat generation rate when the current is similar and higher thermal conductivity means better heat transfer from the ISC location to the rest of the cell. Fig. 5(d) shows that the heat generation rate was actually similar in the two cases for the first 50 seconds, suggesting that higher thermal conductivity of Cu than anode plays an important role in the lower temperature rise of Cu–Al ISC. After ∼50 seconds, the heat generation during Cu–Al ISC became further lower than that during anode-Al ISC, which also contributed to the lower temperature. Comparison of these experimental results with the earlier modeling studies demonstrate that in situ measurement of critical ISC parameters can provide detailed data for validation of numerical models.
3.4 Effects of cell capacity
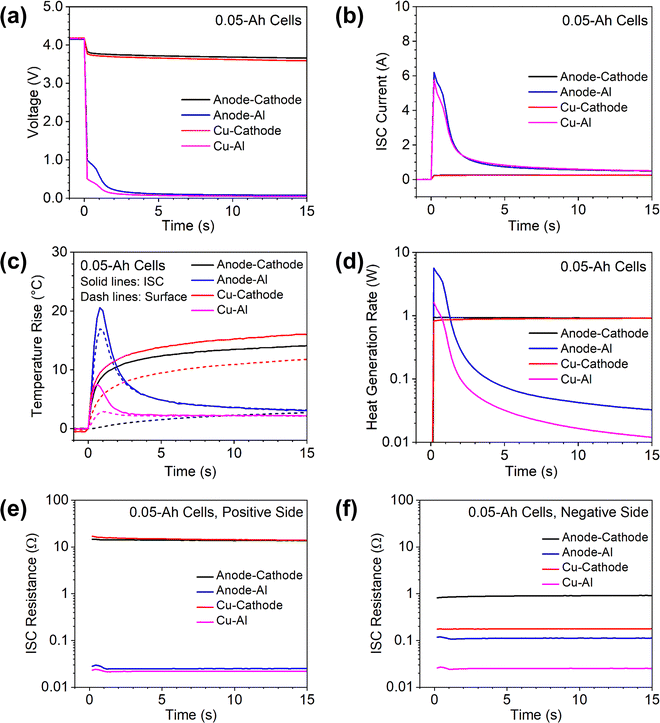
Cell capacity is known to influence the thermal and electrochemical behaviors of Li-ion cells. To demonstrate the use of the proposed ISC pad method in understanding the effects of cell capacity, the method was also applied to ∼0.05 Ah single-layer cells and a 7 Ah multiple-layer cell. The results are shown in Fig. 6 and 7, respectively.The behaviors of 0.05 Ah cells were generally similar to those of 1.5 Ah cells. The anode-Al ISC had much higher temperature rise than other types of ISC, although the ISC current during anode-Al ISC was comparable to that of Cu–Al ISC. The voltage drop and ISC current were very small for anode–cathode ISC and Cu-cathode ISC due to high resistance at the cathode side.
There were also obvious differences between the 0.05 Ah cells and the 1.5 Ah cells. First, the voltages of the 0.05 Ah cells dropped more than those of the 1.5 Ah cells during each type of ISC, but the ISC current and temperature rise were significantly less in the former than those in the latter. In particular, for the 0.05 Ah cells the ISC current during anode-Al ISC and Cu–Al ISC dropped quickly to the level of anode–cathode ISC. Such differences can be attributed to the much smaller capacity of the 0.05 Ah cells. Second, the cell voltage and ISC temperature of the 0.05 Ah cell during anode-Al ISC did not show a temporary increase after an initial drop as the 1.5 Ah cell did. This difference can be attributed to that the temperature rises in the 0.05 Ah cell was not high enough to counter the effects of cell internal resistance change. Third, the temperature rise of 0.05 Ah cells during Cu–Al ISC was less than that during anode–cathode ISC, while the trend is opposite for 1.5 Ah cells. This difference can be attributed to the quick drop of ISC current during Cu–Al ISC in the 0.05 Ah cell. The differences between 0.05 Ah cells and 1.5 Ah cells suggest that ISC parameters are not directly scalable by cell capacity due to their interconnected nature.
The results of the 7 Ah cell are more complicated and interesting, as shown in Fig. 7. The most obvious observation is that the 7 Ah cell went to thermal runaway, as indicated by the voltage drop to zero and the temperatures rise of more than 800 °C. Comparison of the 7 Ah cell results with the 0.05 Ah cells and the 1.5 Ah cells clearly suggested that Li-ion cells with higher capacity have higher risk of thermal runaway for similar ISC due to more energy storage. Note that the initial voltage drop of the 7 Ah cell was less than that of the 1.5 Ah cell although the inrush ISC currents are similar. This confirms earlier reports that ISC is more difficult to detect in a larger-capacity cell than in a smaller-capacity cell. Also note that the ISC current of the 7 Ah cell generally maintained a stable value (∼40 A) after the inrush current. In comparison, the ISC current quickly decreased to nearly zero in the 0.05 Ah cell and the 1.5 Ah cell. Such differences between ISC currents can be attributed to the larger capacity of the 7 Ah cell for which the high current can be maintained for a longer time. There was a sudden increase of ISC current at ∼130 s, corresponding to a sudden decrease of ISC resistance on the negative side. This sudden change occurred after the ISC temperature rise reaching 400 °C and slightly decreasing for a few seconds, which could be due to glass transition of Kapton tape.
The difference between surface temperature and ISC temperature is much larger for the 7 Ah cell test than that of the 0.05 Ah cell and the 1.5 Ah cell. When the ISC temperature increased ∼600 °C, the surface temperature increased only ∼120 °C. This clearly shows that in situ measurement of ISC temperature is important for more accurate characterization of the ISC behaviors for large-format Li-ion cells.
ISC test of the 7 Ah cell was terminated at ∼190 s, as indicated by the stop of the ISC current and recovery of cell voltage and pad voltage. The ISC temperature immediately started decreasing as expected, but in a few seconds it started increasing again, quickly reaching more than 850 °C. The surface temperature also rapidly increased after a slight decrease. Meanwhile, the cell voltage quickly dropped to zero. These rapid changes of temperatures and cell voltage indicated start of thermal runaway. This interesting phenomenon of delayed thermal runaway after the termination of simulated ISC implied that true ISC was induced at some other locations during the test. The simulated ISC through Cu/Al pads diverted current flow from the true ISC locations. When the simulated ISC stopped, the current at the induced true ISC location would increase and trigger thermal runaway. The observation that pad voltage remaining higher than cell voltage for nearly 30 seconds supports this hypothesis, but further investigation on this interesting phenomenon is needed, such as measuring temperature distributions along the length of the electrode sheets to determine locations of induced true ISC and capture propagation of thermal runaway.23
3.5 Repeatability of the method
Repeatability is a challenge for many ISC triggering methods.19 To check repeatability of the proposed ISC triggering and sensing method, two more 1.5 Ah cells with Al-An ISC were made and tested using the same dry cells and the same procedure except that T type thermocouples of the same size (40 AWG, 600-T-40-PE-72.0-ST, TE Connectivity) were used. The results are shown in Fig. 8. It can be seen that the behaviors of the three cells are overall well consistent, suggesting good repeatability of the proposed method.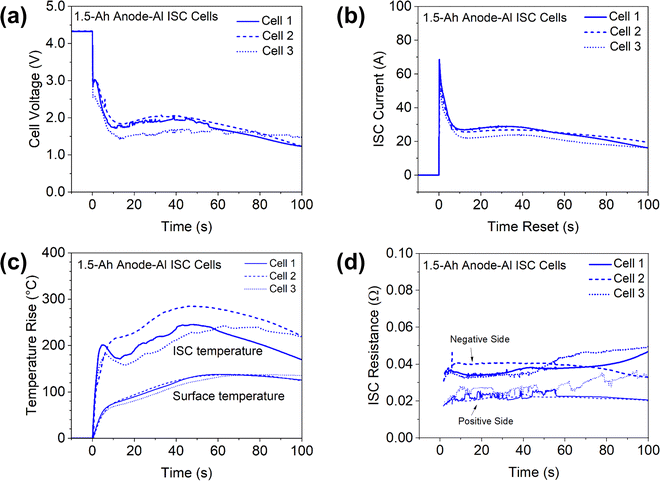 | ||
| Fig. 8 Comparison of three 1.5 Ah cells during anode-Al ISC. (a) Cell voltage; (b) ISC current; (c) ISC temperature and cell surface temperature; (d) ISC resistance. | ||
3.6 Effects of ISC resistance to cell resistance ratio
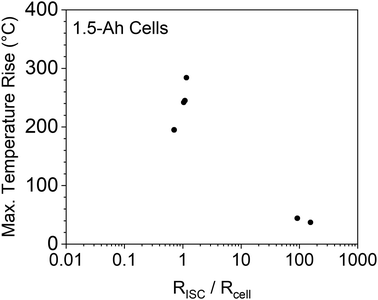
A previous modeling study on nail penetration triggered ISC of 5 Ah cells by Zhao et al.33 suggested that the ratio of ISC resistance to cell internal resistance was a critical parameter that influences the thermal damage of ISC. More specifically, it was suggested that ISC resistance being close to the cell internal resistance would cause the maximum temperature rise. If the ISC resistance is much larger or much smaller than the cell resistance, the temperature rise would be less. With the capability of adjusting ISC resistance and measuring ISC temperature, the proposed ISC triggering & sensing method in this work is suitable for verification of the modeling predication. Results of the 1.5 Ah cells are shown in Fig. 9. It can be seen that the experimental results generally verified the modeling prediction. The maximum temperature rises in this experimental study were lower than those in the modeling study, which can be attributed to the difference of cell capacities (1.5 Ah vs. 5 Ah). Further variation of this modeling prediction will be performed after more experimental data are obtained.3.7 Future work
While the values of the proposed ISC triggering & sensing method have been demonstrated in this work, further investigations are needed for more comprehensive understanding of ISC and thermal runaway behaviors. A few examples are as follows. First, the method needs to be applied to Li-ion cells with various capacities, especially to those with large capacities for which ISC is more difficult to detect and more dangerous. Second, the Al and Cu pads with various diameters and thicknesses need to be tested at various compression pressure. This will not only create various scenarios of ISC to comprehensively study the effects of ISC resistance and determine critical conditions of thermal runaway, but also help optimize the pad designs. Third, the method can be combined with other experimental methods, e.g. infrared imaging34 or multiple embedded temperature sensors,23 and theoretical models35,36 to understand the propagation of thermal runaway from ISC location to the rest of the cell. Fourth, it can be combined with modeling studies37 to identify the safety regime of thermal runaway triggered by ISC. Last, the method can be combined with ISC mitigation strategies38–41 to evaluate effectiveness of those strategies.4. Conclusions
A new method is reported for triggering various types of ISC in Li-ion cells on demand while measuring critical ISC parameters in situ. The method was demonstrated with multilayer cells and single-layer cells. Based on the experimental results and discussion the following conclusions can be drawn. First, the method can simulate various types of ISC relevant to field failures. Second, the method enables in situ sensing of critical ISC parameters, including ISC current, ISC resistance and ISC temperature, in addition to conventionally measured cell voltage and surface temperature. Local heat generation at the ISC location can also be determined from the measured ISC current and ISC resistance. Third, the experimental results can be used to verify electrochemical-thermal coupled models on ISC and provide insights that could not be obtained by conventional ISC triggering methods. Last, the method can be relatively easily implemented with minimal effects on cell performance and good repeatability.Author contributions
M. Long: conceptualization, experimental design, experiments, data analysis, manuscript writing; S. Liu: experimental design, experiments, data analysis; G. Zhang: conceptualization, experimental design, data analysis, manuscript writing and revising, supervision.Conflicts of interest
There are no conflicts of interest to declare.Acknowledgements
MKL and GZ acknowledge the financial support from The University of Alabama in Huntsville (UAH) through the Research or Creative Experience for Undergraduates (RCEU) program, the Honors Capstone Research Summer Program, and the College of Engineering (COE) Undergraduate Research Program. GZ also acknowledges the partial support of UAH Faculty Startup Fund and the NSF CAREER Program (Award # 2240029).References
- N. Williard, W. He, C. Hendricks and M. Pecht, Energies, 2013, 6, 4682–4695, DOI:10.3390/en6094682.
- M. Loveridge, G. Remy, N. Kourra, R. Genieser, A. Barai, M. Lain, Y. Guo, M. Amor-Segan, M. Williams, T. Amietszajew, M. Ellis, R. Bhagat and D. Greenwood, Batteries, 2018, 4, 1–11, DOI:10.3390/batteries4010003.
- R. Aalund, W. Diao, L. Kong and M. Pecht, IEEE Access, 2021, 9, 89527–89532, DOI:10.1109/access.2021.3090304.
- J. A. Jeevarajan, T. Joshi, M. Parhizi, T. Rauhala and D. Juarez-Robles, ACS Energy Lett., 2022, 7, 2725–2733, DOI:10.1021/acsenergylett.2c01400.
- W. Zhao, G. Luo and C.-Y. Wang, J. Electrochem. Soc., 2015, 162, A1352–A1364, DOI:10.1149/2.1031507jes.
- S. Santhanagopalan, P. Ramadass and J. Zhang, J. Power Sources, 2009, 194, 550–557, DOI:10.1016/j.jpowsour.2009.05.002.
- IEEE, IEEE Std 1625-2008 (Revision of IEEE Std 1625-2004), 2008, pp. 1–79 DOI:10.1109/IEEESTD.2008.4657368.
- C. J. Orendorff, E. P. Roth and G. Nagasubramanian, J. Power Sources, 2011, 196, 6554–6558, DOI:10.1016/j.jpowsour.2011.03.035.
- M. Keyser, D. Long, A. Pesaran, E. Darcy, M. Shoesmith and B. McCarthy, The 228th Electrochemical Society (ECS) Meeting, Phoenix, Arizona, USA, October 11–15, 2015.
- M. Zhang, J. Du, L. Liu, A. Stefanopoulou, J. Siegel, L. Lu, X. He, X. Xie and M. Ouyang, J. Electrochem. Soc., 2017, 164, A3038–A3044, DOI:10.1149/2.0731713jes.
- C. McCoy, S. Sriramulu, R. Stringfellow, D. Ofer and B. Barnett, 46th Power Sources Conference, Orlando, Florida, USA, June 9–12, 2014.
- S. Shironita, H. Tsuruga, K. Honda, K. Koshika and M. Umeda, J. Energy Storage, 2021, 40, 102715, DOI:10.1016/j.est.2021.102715.
- B. Mao, H. Chen, Z. Cui, T. Wu and Q. Wang, Int. J. Heat Mass Transfer, 2018, 122, 1103–1115, DOI:10.1016/j.ijheatmasstransfer.2018.02.036.
- H. Maleki and J. N. Howard, J. Power Sources, 2009, 191, 568–574, DOI:10.1016/j.jpowsour.2009.02.070.
- F. Ren, T. Cox and H. Wang, J. Power Sources, 2014, 249, 156–162, DOI:10.1016/j.jpowsour.2013.10.058.
- B. Liu, X. Duan, C. Yuan, L. Wang, J. Li, D. P. Finegan, B. Feng and J. Xu, J. Mater. Chem. A, 2021, 9, 7102–7113, 10.1039/d0ta12082k.
- X. Feng, X. He, L. Lu and M. Ouyang, J. Electrochem. Soc., 2018, 165, A155–A167, DOI:10.1149/2.0501802jes.
- V. Ruiz, A. Pfrang, A. Kriston, N. Omar, P. Van den Bossche and L. Boon-Brett, Renewable Sustainable Energy Rev., 2018, 81, 1427–1452, DOI:10.1016/j.rser.2017.05.195.
- J. Grabow, J. Klink, R. Benger, I. Hauer and H.-P. Beck, Batteries, 2022, 9(1), 9, DOI:10.3390/batteries9010009.
- T. D. Hatchard, S. Trussler and J. R. Dahn, J. Power Sources, 2014, 247, 821–823, DOI:10.1016/j.jpowsour.2013.09.022.
- D. P. Finegan, B. Tjaden, T. M. M. Heenan, R. Jervis, M. D. Michiel, A. Rack, G. Hinds, D. J. L. Brett and P. R. Shearing, J. Electrochem. Soc., 2017, 164, A3285–A3291, DOI:10.1149/2.1501713jes.
- S. Huang, X. Du, M. Richter, J. Ford, G. M. Cavalheiro, Z. Du, R. T. White and G. Zhang, J. Electrochem. Soc., 2020, 167, 090526, DOI:10.1149/1945-7111/ab8878.
- S. Huang, Z. Du, Q. Zhou, K. Snyder, S. Liu and G. Zhang, J. Electrochem. Soc., 2021, 168, 0905, DOI:10.1149/1945-7111/ac1d7b.
- T. Yokoshima, D. Mukoyama, F. Maeda, T. Osaka, K. Takazawa, S. Egusa, S. Naoi, S. Ishikura and K. Yamamoto, J. Power Sources, 2018, 393, 67–74, DOI:10.1016/j.jpowsour.2018.04.092.
- T. Yokoshima, D. Mukoyama, F. Maeda, T. Osaka, K. Takazawa and S. Egusa, J. Electrochem. Soc., 2019, 166, A1243–A1250, DOI:10.1149/2.0701906jes.
- D. P. Finegan, E. Darcy, M. Keyser, B. Tjaden, T. M. M. Heenan, R. Jervis, J. J. Bailey, R. Malik, N. T. Vo, O. V. Magdysyuk, R. Atwood, M. Drakopoulos, M. DiMichiel, A. Rack, G. Hinds, D. J. L. Brett and P. R. Shearing, Energy Environ. Sci., 2017, 10, 1377–1388, 10.1039/C7EE00385D.
- M. Steinhardt, J. V. Barreras, H. Ruan, B. Wu, G. J. Offer and A. Jossen, J. Power Sources, 2022, 522, 230829, DOI:10.1016/j.jpowsour.2021.230829.
- D. J. Noelle, M. Wang, A. V. Le, Y. Shi and Y. Qiao, Appl. Energy, 2018, 212, 796–808, DOI:10.1016/j.apenergy.2017.12.086.
- S. J. An, J. Li, C. Daniel, S. Kalnaus and D. L. Wood, J. Electrochem. Soc., 2017, 164, A1755, DOI:10.1149/2.0031709jes.
- M. Chen, Q. Ye, C. Shi, Q. Cheng, B. Qie, X. Liao, H. Zhai, Y. He and Y. Yang, Batteries Supercaps, 2019, 2, 874–881, DOI:10.1002/batt.201900081.
- J. Li, W. Li, J. Song, Y. Chen, L. Wang and J. Xu, J. Electrochem. Soc., 2022, 169, 020505, DOI:10.1149/1945-7111/ac4c79.
- W. Fang, P. Ramadass and Z. Zhang, J. Power Sources, 2014, 248, 1090–1098, DOI:10.1016/j.jpowsour.2013.10.004.
- W. Zhao, G. Luo and C.-Y. Wang, J. Electrochem. Soc., 2015, 162, A207–A217, DOI:10.1149/2.1071501jes.
- Q. Wu, L. Yang, N. Li, Y. Chen, Q. Wang, W.-L. Song, X. Feng, Y. Wei and H.-S. Chen, J. Power Sources, 2022, 540, 231602, DOI:10.1016/j.jpowsour.2022.231602.
- P. Zhao, L. Liu, Y. Chen and H. Ge, Int. J. Heat Mass Transfer, 2021, 181, 121901, DOI:10.1016/j.ijheatmasstransfer.2021.121901.
- P. Zhao, A. García and T. Burton, Combust. Flame, 2022, 238, 111951, DOI:10.1016/j.combustflame.2021.111951.
- L. Zhang, P. Zhao, M. Xu and X. Wang, Appl. Energy, 2020, 261, 114440, DOI:10.1016/j.apenergy.2019.114440.
- L. Huang, L. Liu, L. Lu, X. Feng, X. Han, W. Li, M. Zhang, D. Li, X. Liu, D. U. Sauer and M. Ouyang, Int. J. Energy Res., 2021, 45, 15797–15831, DOI:10.1002/er.6920.
- B. Xu, J. Lee, D. Kwon, L. Kong and M. Pecht, Renewable Sustainable Energy Rev., 2021, 150, 111437, DOI:10.1016/j.rser.2021.111437.
- X. Lai, C. Jin, W. Yi, X. Han, X. Feng, Y. Zheng and M. Ouyang, Energy Storage Mater., 2021, 35, 470–499, DOI:10.1016/j.ensm.2020.11.026.
- X. Feng, D. Ren, X. He and M. Ouyang, Joule, 2020, 4, 743–770, DOI:10.1016/j.joule.2020.02.010.
| This journal is © The Royal Society of Chemistry 2023 |

