
 Open Access Article
 This Open Access Article is licensed under a Creative Commons Attribution-Non Commercial 3.0 Unported Licence
Lithium dynamics at grain boundaries of β-Li3PS4 solid electrolyte†
Randy
Jalem
 ab,
Manas Likhit Holekevi
Chandrappa
a,
Ji
Qi
a,
Yoshitaka
Tateyama
b and
Shyue Ping
Ong
*a
ab,
Manas Likhit Holekevi
Chandrappa
a,
Ji
Qi
a,
Yoshitaka
Tateyama
b and
Shyue Ping
Ong
*a
aDepartment of NanoEngineering, University of California San Diego, 9500 Gilman Dr, Mail Code 0448, La Jolla, CA 92093-0448, USA. E-mail: ongsp@ucsd.edu
bCenter for Green Research on Energy and Environmental Materials, National Institute for Materials Science (NIMS), Tsukuba, Japan
First published on 16th October 2023
Abstract
Lithium diffusivity at the grain boundaries of solid electrolytes (SEs) can strongly impact the final performance of all-solid-state Li ion batteries (SSLBs). β-Li3PS4 (β-LPS) is a promising SE due to its good formability and low processing cost, but its total Li ionic conductivity can vary by orders of magnitude depending on the synthesis and processing conditions. One of the possible sources for this variability, the GB contribution, is still poorly understood to date. In this study, we systematically investigate the Li ion transport in tilt and twist GBs as well as amorphous/crystal interfaces of β-LPS by performing large-scale molecular dynamics (MD) simulations with a highly accurate moment tensor interatomic potential (MTP). We find that the Li ion conductivities at the GBs and amorphous/crystal interfaces (10−4–10−3 S cm−1) are 1–2 orders of magnitude higher than that in the bulk crystal (10−5 S cm−1). The Li ion diffusivity at twist GBs and amorphous/crystal interfaces shows no correlation with the degree of diffusion isotropy, while tilt GBs exhibit a negative correlation. Using topological data analysis, the Li pathway network in twist GBs and amorphous/crystal interfaces comprises persisting large Li ring sub-networks (nLi ≥ 5) that closely resemble those found in the bulk amorphous structure, whereas more smaller and short-lived Li ring sub-networks (nLi ≤ 5) are detected in tilt GBs and the bulk crystal. The concentration of persisting large Li ring sub-networks in the GB and amorphous/crystal interfaces is directly proportional to the degree of Li site disordering which in turn correlates with GB conductivity. Our findings provide useful insights that can guide the optimization of conductivity not only in β-LPS but also in other sulfide-type solid electrolytes through possible GB engineering.
Introduction
The strong interest in all-solid-state lithium-ion batteries (SSLBs) stems from their expected advantages, such as high safety, good durability, high energy density, and a simplified battery design for easy fabrication/manufacturing.1 The high safety feature is mainly due to the use of an incombustible solid electrolyte (SE), a change from that of the combustible organic liquid electrolyte that is deployed in conventional Li ion batteries.1,2 The use of a SE also enables achieving high energy density by using Li-metal or Li-alloy anodes and high capacity by using high-voltage cathodes.2 Areas of application for SSLBs include electric vehicles and smart grids.1–3One active area of research in SSLBs is the development of high-performance and practical SE materials that demonstrate high room-temperature (RT) Li ionic conductivity (σ300K ≥ 10−3 S cm−1), crucial for high-rate battery charging/discharging.4 Amongst the various inorganic SE classes, sulfide SEs have high σ300K along with other desired SE characteristics such as easy processability and high mechanical malleability.5–8 The thiophosphate Li3PS4 (LPS) is a promising SE which exist in three known polymorphs: a low-temperature γ phase (Pmn21), a high-temperature β phase (Pnma) and a high-temperature α phase (Cmcm).8,9 In particular, β-LPS is known for its high σ300K (up to 10−4 S cm−1) and facile synthesis.10–13 It has 2D zigzag Li diffusion pathways in the [010] crystallographic direction that consist of partially occupied 4b–4c Wyckoff site linkages (Fig. 1).13 Bulk Li ion diffusion is aided by cooperative PS43− unit rotations.9
 | ||
| Fig. 1 Schematic picture for the ab-plane of β-Li3PS4 (spacegroup: Pnma). The isolated PS4 unit, fully occupied tetrahedral Li 8d Wyckoff site, partially occupied octahedral Li 4b Wyckoff site, and partially occupied tetrahedral Li 4c Wyckoff site are shown in violet and yellow, green, orange with white and magenta with white, respectively. The zigzag 2D Li diffusion channels consist of alternating face-sharing LiS6 and LiS4 polyhedral units. | ||
Apart from the bulk structural features, grain boundaries (GBs) and grain amorphization are other fundamentally important microstructure-related features that affect overall σ300K. The role that GBs play in affecting the electrochemical performance of SSLBs has been investigated in recent experimental works, particularly on issues related to leakage current, GB electronic conductivity, and Li dendrite formation.14,15 The measured σ300K of β-LPS spans a large range between 10−7 and 10−4 S cm−1. This may be directly related to GB resistance, aside from other factors related to synthesis conditions (e.g., phase purity, crystallinity, porosity, etc.).10–13 However, experimental studies of the relationship between GB structure and conductivity in β-LPS are challenging,16,17 especially since the Nyquist plot semi-arcs for bulk and GB contributions from impedance spectroscopy are often indistinguishable.10,12 Meanwhile, most computational studies so far have focused on bulk properties,18–25 and only a very limited number of studies have investigated the effects of LPS microstructure towards Li ion transport. For example, MD simulations are performed by Ates et al. to study the particle size effect towards conductivity and by Kim et al. to probe the conductivity at the interface region formed between γ-LPS and its amorphous phase.26,27
Machine learning interatomic potentials (MLIPs) that are trained using bulk and interface structures from AIMD simulations have been used to investigate various bulk and interface-related properties of SEs. For example, Wu et al. reported a combined experimental and computational study on Na3−xY1−xZrxCl6 SE, where MD simulations using a moment tensor potential (MTP) were employed to evaluate Na ionic conductivity, Na ion diffusion topology, and polyhedral rotation dynamics in the crystal structure.28 Ko et al. also used MD with an MTP to investigate the improvement to the total Li ionic conductivity of a new class of high-entropy perovskite oxides through bulk compositional complexity and GB effects.29 Finally, Wang et al. investigated by MTP-MD the atomistic origin of Li ion transport resistance at the hetero-interface formed between SEs (LPS, Li6PS5Cl, and Na3PS4) and the pure (Li, Na) metal electrode.30
In this work, the Li ion transport behavior at GBs and amorphous/crystal interfaces (to study amorphization effects) of β-LPS is systematically investigated by large-scale molecular dynamics (MD) simulations with a highly accurate MTP. Diffusivities, activation energies, and RT conductivities are estimated and compared for different GB (tilt and twist) and amorphous/crystal interface structures. The Li pathway network for GBs and amorphous/crystal interfaces is also analyzed by the persistent homology technique, specifically on the topological 1D Li ring features that are extracted from nanosecond-scale MD trajectories. Our findings provide new insights into the GB-region diffusion and conductivity not only in β-LPS but also in other sulfide-type SEs.
Methods
Moment tensor potential development
In recent years, MLIPs31–35 have emerged as a means to accurately parameterize the potential energy surface (PES) of a collection of atoms using DFT calculations. For this work, we have selected the efficient MTP formalism, which has been extensively covered in prior works.36–40 Interested readers are referred to those for details. Here, we will focus on the workflow used for the development of the MTP, as shown in Fig. 2. For the investigations in this work, it is essential that the fitted MTP is able to capture the PES of both the bulk and GBs of the target β-LPS system accurately. The workflow is adapted from those developed previously by the current authors for the study of lithium superionic conductors and their interfaces,41,42 using the Python Materials Genomics (pymatgen) and Fireworks packages.43,44 | ||
| Fig. 2 Schematic workflow for passive and active learning related to MTP development for β-LPS GBs. | ||
The MTP training is carried out in two stages. In the passive learning (PL) stage, two MTP hyperparameters – cutoff radius (rc) and number of basis (nbasis) – are tuned using a grid search method with rc = [4.0 Å, 5.0 Å, 6.0 Å, 7.0 Å]) and nbasis = [8, 12, 14, 16, 18, 20]. A total of 300 structures are randomly sampled from ab initio molecular dynamics (AIMD) simulations (300–2000 K) of the relaxed bulk β-LPS structure (Inorganic Crystal Structure Database ID: 35018).45 The energy and force datasets are then each split in a 90![[thin space (1/6-em)]](https://www.rsc.org/images/entities/char_2009.gif) :10 ratio into 270 training and 30 validation structures. Validation is performed based on mean absolute error (MAE) of total energies, forces, and stresses. Single-point density functional theory (DFT) calculations are then carried out on the structures to obtain accurate total energies and forces. All DFT calculations are performed using the Vienna Ab initio Simulation Package (VASP)46,47 within the projector augmented wave (PAW) method.48–50 The initial structure relaxations and AIMD simulations are carried out using the Perdew–Burke–Ernzerhof (PBE) generalized gradient approximation (GGA) functional,51,52 while the single point energy calculations are performed using the optB88 vdW functional.53 As demonstrated in our previous work,41 such a PBE-optB88 protocol captures the relevant energetics of sulfide SEs (especially the effect of non-local dispersion) at a minimal computational cost. The single point energy calculations are set with a kinetic energy cutoff and Gamma-centered k point grid of 520 eV and 1 × 1 × 1, respectively. The convergence criteria for the electronic self-consistency loop, ionic relaxation loop, and forces are set to 1 × 10⁻⁵ eV, 2 × 10⁻² eV, and 0.01 eV Å−1, respectively.
:10 ratio into 270 training and 30 validation structures. Validation is performed based on mean absolute error (MAE) of total energies, forces, and stresses. Single-point density functional theory (DFT) calculations are then carried out on the structures to obtain accurate total energies and forces. All DFT calculations are performed using the Vienna Ab initio Simulation Package (VASP)46,47 within the projector augmented wave (PAW) method.48–50 The initial structure relaxations and AIMD simulations are carried out using the Perdew–Burke–Ernzerhof (PBE) generalized gradient approximation (GGA) functional,51,52 while the single point energy calculations are performed using the optB88 vdW functional.53 As demonstrated in our previous work,41 such a PBE-optB88 protocol captures the relevant energetics of sulfide SEs (especially the effect of non-local dispersion) at a minimal computational cost. The single point energy calculations are set with a kinetic energy cutoff and Gamma-centered k point grid of 520 eV and 1 × 1 × 1, respectively. The convergence criteria for the electronic self-consistency loop, ionic relaxation loop, and forces are set to 1 × 10⁻⁵ eV, 2 × 10⁻² eV, and 0.01 eV Å−1, respectively.
In the second active learning (AL) stage, the remainder of the MTP hyperparameters are optimized using additional isotropically-strained (−5%, +5%) and GB structures. The GB structures are generated using the coincident site lattice (CSL) approach (see ESI†). We have adopted an extrapolation grade proposed previously to identify structures to be added to the training set.54 The extrapolation grade threshold for structure selection (γselect) is set to 2.0. Additionally, the threshold for termination (γbreak) is initially fixed to a looser setting (γbreak = 10.0) to promote structure diversity in the early AL iteration steps, and then gradually reduced (γbreak = [5.0, 2.0]) over the course of AL iteration steps. The purpose for this is two-fold: (i) to impose an increasingly stricter setting in the selection of extrapolative structures and (ii) to minimize the chance of unphysical structures from being picked during the later part of the AL stage. A separate test dataset outside of the AL loop is also generated, sampled from MD trajectories of 6 representative GB structures (Σ5[001]/(120) tilt, Σ5[010]/(010) twist, Σ3[110]/(111) tilt, Σ5[001]/(001) twist, Σ5[001]/(2−10) tilt, and Σ5[010]/(201) twist GB). The structures are chosen at regular intervals at different stages of MD calculations at a given temperature (300, 800, 2000 K): (i) 5 structures from the heating stage, (ii) 5 structures from the equilibration stage, and (iii) 13 structures from the production stage. The DFT calculations and validation are carried out in the same way as the PL stage. The AL stage is terminated when no new structures emerge anymore based on the γbreak condition. Other GB structures are also considered during the actual deployment of the final MTP in MD production runs, these are Σ13[001]/(3–20) tilt, Σ13[001]/(150) tilt and Σ25[001]/(170) tilt GB. The atomic-scale configurations of different GB structures are provided in Fig. S1 (ESI†). The MLIP software package is used for MTP development.54
Molecular dynamics simulations
The MD simulations are performed under the isothermal–isobaric (NPT) ensemble condition using the Large-scale Atomic/Molecular Massively Parallel Simulator (LAMMPS) package.55,56 Ion positions and variation in ion velocities are calculated by the velocity-Verlet algorithm.57 The relaxation times of the Nosé–Hoover thermostat and the barostat are set to 0.1 and 1 ps, respectively.58,59 A 2 fs MD step size is used. The MD simulations on bulk, amorphous, GB, and amorphous/crystal interface structures are performed on supercells containing at least 10000 atoms. Using the Einstein–Smoluchowski equation,60 the diffusion coefficient (D) for Li ions is calculated from the slope of the mean square displacement (MSD) versus time (t) in the diffusive (linear) regime as follows: | (1) |
![[r with combining right harpoon above (vector)]](https://www.rsc.org/images/entities/i_char_0072_20d1.gif) (t) is the atom position at time t, τ is the time lag between atom positions (t + τ) and , and 〈[(t + τ) − (t)]2〉 is the MSD. The ionic conductivity is then given by the Nernst–Einstein equation:61
(t) is the atom position at time t, τ is the time lag between atom positions (t + τ) and , and 〈[(t + τ) − (t)]2〉 is the MSD. The ionic conductivity is then given by the Nernst–Einstein equation:61 | (2) |
Amorphization of β-LPS
The β-LPS unit cell (12 Li, 4 P, and 16 S atoms; optB88-optimized lattice constants: a = 13.07 Å, b = 8.13 Å, c = 6.26 Å) is expanded into a 4 × 8 × 12 supercell (12288 atoms). This supercell is then used as input structure in the amorphization procedure by MTP-MD which comprises 5 stages: (i) heating up to 2000 K for 200 ps, (ii) equilibration at 2000 K for 400 ps, (iii) cooling down to 300 K with a rate of 5 mK fs−1, (iv) equilibration at 300 K for 2 ns, and (v) production run at 300 K for 8 ns. The MD runs are performed under the NPT ensemble condition with a 2 fs MD step size. The relaxation times of the Nosé–Hoover thermostat and the barostat are set to 0.1 and 1 ps, respectively. The PRDF plots are derived from the MD trajectory of the production run stage.
Topological data analysis of the Li pathway network
The Li pathway topology at GB and amorphous/crystal interfaces is analyzed by persistent homology.64 The procedure is schematically shown in Fig. S3 (ESI†). Starting from a set of Li ion coordinates, each point is replaced with a sphere with an initial radius (r) of zero. The radii of the spheres are then simultaneously increased. Ring “birth” occurs when the spheres touch each other forming closed ring structures. The sphere radius at which ring birth occurs is denoted as b. As the sphere radius is further increased, the ring eventually becomes completely filled, leading to ring “death”. The sphere radius at which ring death occurs is denoted as d. The record of sphere radii pairs related to each ring (b, d) is then compactly expressed into a topological object called the 2D persistence diagram (PD). A total of 200 MD snapshots of Li ion coordinates at the GB or amorphous/crystal interface regions are considered in this analysis. All the generated (b, d) pairs are then plotted, resulting to a 2D PD plot. PD analysis is performed using the scikit-TDA package.65Calculation of atom disorder parameter, visualization
The disorder parameter around each atom is calculated using the pyscal package.66 Visualization of crystal structures is made with VESTA software.67 Plots are generated using the Matplotlib package.68Results
Accuracy of trained moment tensor potential
In the PL stage of MTP development, rc = 5.0 Å and nbasis = 14 are determined as the optimal hyperparameter combination based on test-set MAE and MTP model complexity (Fig. S4 and S5, ESI†). These hyperparameter values are then employed in the subsequent AL stage. Fig. 3 shows the test-set MAE for a total of 1350 GB structures sampled from 6 test GB types and with MD runs at 300 K, 800 K, and 2000 K that are outside the AL loop. It can be observed that MAE in energies (e.g., Fig. 3a) converges to around 2.66 meV per atom (Fig. 3c) after 8 AL steps, while the MAE in forces (e.g., Fig. 3b) remains reasonably low from the start of the AL stage (i.e., <200 meV Å−1) and converges to a value of 147 meV Å−1 for a total of 1339200 force components (Fig. 3d).
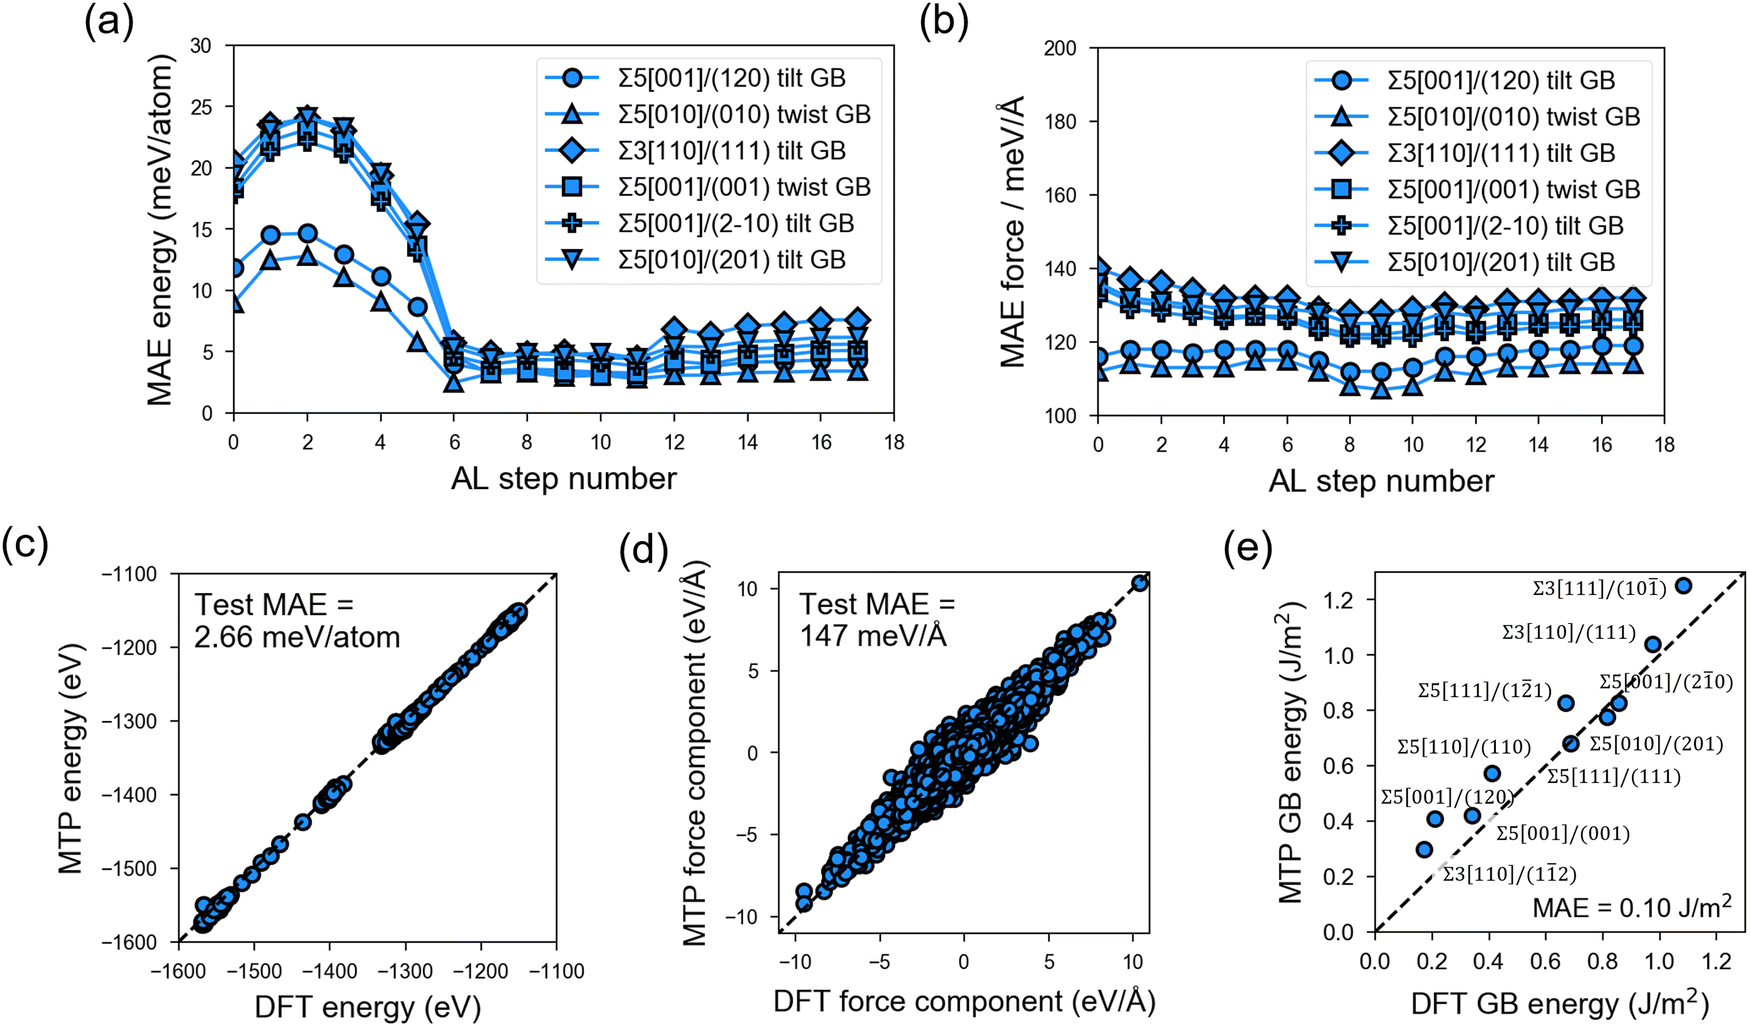 | ||
| Fig. 3 Test-set accuracy of the trained moment tensor potential (MTP). Mean absolute errors (MAEs) in (a) energies and (b) forces for test β-LPS GB structures outside of the active-learning (AL) loop and sampled from 800 K on-the-fly MD runs (6 selected test GB types). Parity plots for MTP vs. DFT (optB88) (c) energies and (d) force components for test GB structures in (a) and (b) that are sampled from 300, 800, and 2000 K MTP-MD runs. (e) Parity plot for MTP vs. DFT GB energy. Dashed line indicates ideal y = x relationship. | ||
The final MTP is then further validated in terms of its ability to reproduce bulk and GB properties. As shown in Table 1, the MTP yields very low errors of 0.08–2.62% errors in lattice parameters, (ii) 0.43% error in crystal density, and (iii) the same order of magnitude for elastic moduli values. For the bulk amorphous phase, test errors also fall within the set cutoff values (Fig. S6, ESI†). The MAEs in the calculated GB energies are also extremely low at 0.10 J m−2 (Fig. 3e).
Partial radial distribution function analysis
Fig. 4 shows the partial radial distribution function (PRDF) plots of crystalline and amorphous β-LPS from MD simulations using the fitted MTP. For the crystalline β-LPS (Fig. 4a, left subplot),69 Li ions are located in tetrahedral and octahedral sites. In the tetrahedral site, the Li–S distances are unequal due to the Li sitting closer to one of the tetrahedral faces. In the octahedral site, the 2 axial Li–S distances are longer than 4 basal Li–S distances. The Li–Li PRDF peaks can be assigned to the distances between Li in different Wyckoff sites (8d–8d ∼ 3.48 Å, 8d–4b ∼ 3.23 Å and ∼4.09 Å, 8d–4c ∼ 3.33 Å, 4b–4b ∼ 4.01 Å). For the Li–P PRDF, the first peak at ∼3.05 Å mainly originates from Li 8d–P distance. For the Li–S PRDF, the first peak at ∼2.43 Å can be assigned to the tetrahedral LiS4 coordination, the two shorter Li–S distances in octahedral LiS6, and the shortest Li–S distance in Li 4c–S4 coordination. The first peak of the P–P PRDF at ∼5.01 Å is given by the separation between isolated PS43− units. The average fraction of P5+ cation in a tetrahedral coordination with S2− anions within a radius cutoff of 2.5 Å is calculated to be 1 (or 100%). The S–S edge distance in the PS43− unit is represented by the first S–S PRDF peak at ∼3.35 Å.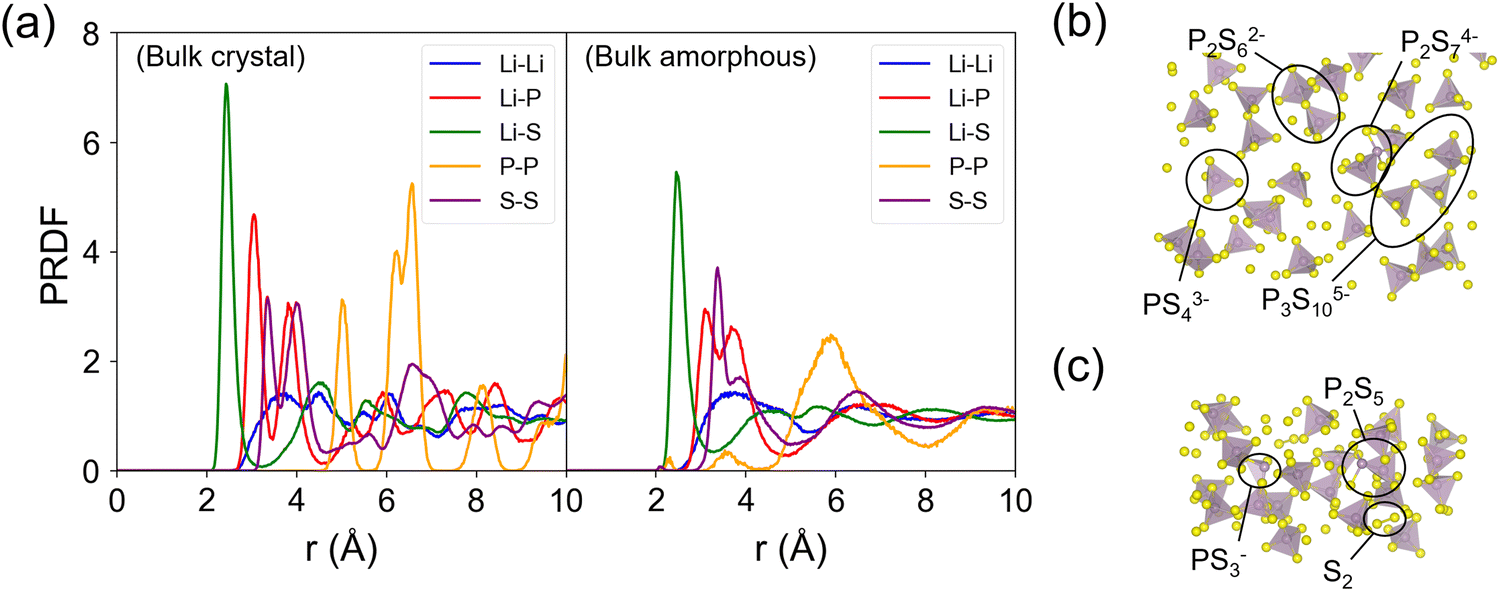 | ||
| Fig. 4 (a) Partial radial distribution function (PRDF) plots of crystalline and amorphous β-LPS from MD simulations. The two PRDF subplots share the same vertical axis. (b) and (c) Representative local P–S structures in the amorphous β-LPS. Distinct host framework polyanion units are labeled; polyanion units are searched by incremental sweep of atom–atom distance and finding the minimum distance that results in polyhedral unit formation for all P atoms. | ||
The evidence for the structural change in the amorphized β-LPS can be seen in the decrease in the PRDF peak height and peak broadening for r > 4 Å (Fig. 4a, right subplot). The presence of distinct PRDF peaks for r < 4 Å indicates that short-range ordering is kept after the amorphization process. The appearance of new peaks for r < 4 Å in the P–P PRDF can be assigned to P–S–P bridges, i.e., formation of condensed thiophosphate groups such as P2S74−, P2S62−, P3S105−, PS43−, and P2S5, as shown in Fig. 4b and c; the formation of these groups have concomitant S2 species forming as well (see Fig. 4c). In contrast to crystalline β-LPS, only 87% of P5+ cations are in tetrahedral coordination while 13% form non-PS43− units. The latter local structures are prevalent in amorphous Li2S–P2S5 SEs.17,71
Li+ diffusion barriers and conductivities
Fig. 5 shows the Arrhenius plots obtained from MD simulations of bulk, GB, and amorphous/crystal interfaces using the fitted MTP. Table 2 provides the extracted activation barriers (Ea) and σ300K, including those from other computational and experimental studies for comparison. For GB/interface regions, a thickness of ∼10 Å for each of the 2 GBs/interfaces in the non-periodic direction of the structure models is considered for statistical sampling. The bulk β-LPS crystal (Fig. 5, top subplot) has a predicted σbulk,300K of 7.4 × 10⁻⁵ S cm−1 and an Ea of 0.29 eV. The predicted bulk crystal conductivity is about one order of magnitude smaller than that obtained from previous AIMD simulations using the PBE functional24 and about 25% smaller than that experimentally measured via Li NMR.13 It should be noted that the PBE functional overestimates the lattice parameters of β-LPS, which would account for the overestimated diffusivities in the PBE-AIMD simulations. Furthermore, AIMD simulations are carried out at higher temperatures and for shorter time scales, which can result in further errors.41 The AC impedance measurements are for polycrystalline samples.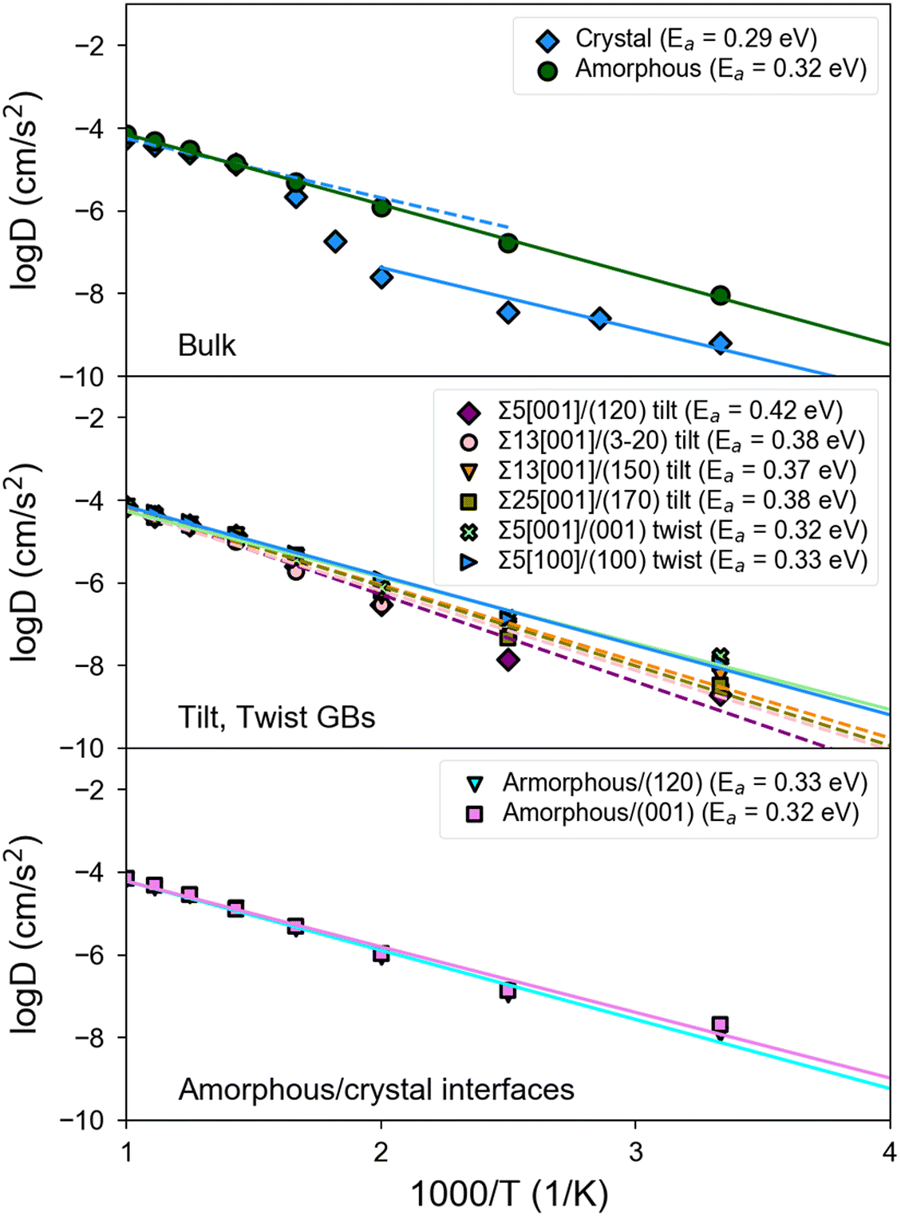 | ||
| Fig. 5 Arrhenius plot of the log of the Li+ diffusivity (logD) versus inverse temperature (1000/T) in (top) bulk crystal and amorphous β-LPS; (middle) GBs and (bottom) amorphous/bulk interfaces of β-LPS. The Ea,bulk value is fitted using the Arrhenius slope at the low temperature regime. | ||
| Structure | Ref. | Method | E a (eV) | σ 300K (S cm−1) |
|---|---|---|---|---|
| Crystalline β-LPS | This work | MTP-MD | 0.29 | 7.4 × 10⁻⁵ |
| 19 | Morse-MD | 0.41 | — | |
| 24 | PBE-AIMD | 0.35 | 8.8 × 10⁻⁴ | |
| 13 | Li NMR | 0.24 | 1.0 × 10⁻⁴ | |
| 27 | AC impedance | 0.29 | 4.9 × 10⁻⁵ | |
| 10 | AC impedance | 0.47 | 3.0 × 10⁻⁷ | |
| Amorphous LPS | This work | MTP-MD | 0.32 | 1.1 × 10⁻³ |
| 26 | Morse-MD | 0.28 | 4.1 × 10⁻⁴ | |
| 20 | PBEsol-AIMD | — | 8.8 × 10⁻⁵ | |
| 72 | AC impedance | 0.26 | 1.3 × 10⁻³ | |
| 17 | AC impedance | 0.40 | 2.8 × 10⁻⁴ | |
| 73 | AC impedance | 0.35 | 2.0 × 10⁻⁴ | |
| 74 | AC impedance | 0.41 | 1.2 × 10⁻⁴ | |
| Nanoporous β-LPS | 12 | Li NMR | 0.36 | 1.6 × 10⁻⁴ |
| Σ5[001]/(120) tilt GB | This work | MTP-MD | 0.41 | 3.1 × 10⁻⁴ |
| Σ5[001]/(130) tilt GB | This work | MTP-MD | 0.42 | 1.1 × 10⁻⁴ |
| Σ13[001]/(150) tilt GB | This work | MTP-MD | 0.37 | 6.5 × 10⁻⁴ |
| Σ13[001]/(3−20) tilt GB | This work | MTP-MD | 0.38 | 3.6 × 10⁻⁴ |
| Σ25[001]/(170) tilt GB | This work | MTP-MD | 0.38 | 3.9 × 10⁻⁴ |
| Σ29 [001]/(−250) tilt GB | This work | MTP-MD | 0.36 | 7.6 × 10⁻⁴ |
| Σ5[001]/(001) twist GB | This work | MTP-MD | 0.32 | 2.0 × 10⁻³ |
| Σ5[100]/(100) twist GB | This work | MTP-MD | 0.33 | 1.4 × 10⁻³ |
| Amorphous/(120) | This work | MTP-MD | 0.33 | 1.4 × 10⁻³ |
| Amorphous/(001) | This work | MTP-MD | 0.32 | 2.4 × 10⁻³ |
There are two slope regimes in the present MTP-MD Arrhenius plot for the bulk crystal case, and this is consistent with observations based on temperature-dependent experimental conductivity measurements.10,12
For the amorphous case (Fig. 5, top subplot), the predicted σ300K of 1.1 × 10⁻³ S cm−1 is two orders of magnitude higher than in the crystalline bulk. The predicted σ300K is close to the most recent measurement of σ300Kvia AC impedance spectroscopy by Lu et al.72 though the experimentally reported σ300K spans a wide range.17,73,74 Unlike crystalline β-LPS, no transition in Arrhenius regimes is observed, and the predicted Ea of 0.32 eV is also close to the experimental value by Lu et al.72
Interestingly, tilt GBs are predicted to have σ300K between that of crystalline and amorphous β-LPS, while twist GBs are predicted to have σ300K comparable or slightly higher than that of amorphous β-LPS.
In the case of twist GBs and amorphous/crystal interfaces (Fig. 5, middle and bottom subplots), they have relatively lower Ea,GB values which are in the range of 0.32–0.33 eV and comparable to the bulk amorphous structure (Ea,bulk = 0.32 eV). Their σ300K values are also in the same order of magnitude (10−3 S cm−1). For the amorphous/crystal interfaces, Ea,GB does not significantly change with respect to the contacting crystal plane (e.g., (001), (100), and (120)), and the values are in good agreement with a previous classical MD result on amorphous/γ-LPS interface (0.29 eV).24
Li ion pathway and non-Li ion distribution at grain boundaries
The atomic distribution per element in the GB and amorphous/crystal interface structures are analyzed using their 300 K MTP-MD trajectories. Fig. 6a–c plot the heatmaps for Li atoms in different tilt GBs. The diffuse Li atomic density at the GB region is clearly visible and extends up to several angstroms away from the GB center. The contiguous Li-density pattern hints at ion diffusion, which is also confirmed by the MSD plots (Fig. S7a–c, ESI†). For P and S atoms (Fig. S8, ESI†), their GB-region densities have point-like patterns just like the bulk region, indicating limited diffusion of these species. This was also confirmed by their MSD plots (Fig. S7a–c, ESI†). In the case of twist GBs (Fig. 6d), a more extended and diffuse Li atomic density is observed (Fig. S7d, ESI†). In amorphous/crystal interfaces (Fig. 6e and f), highly diffuse Li density patterns are also observed.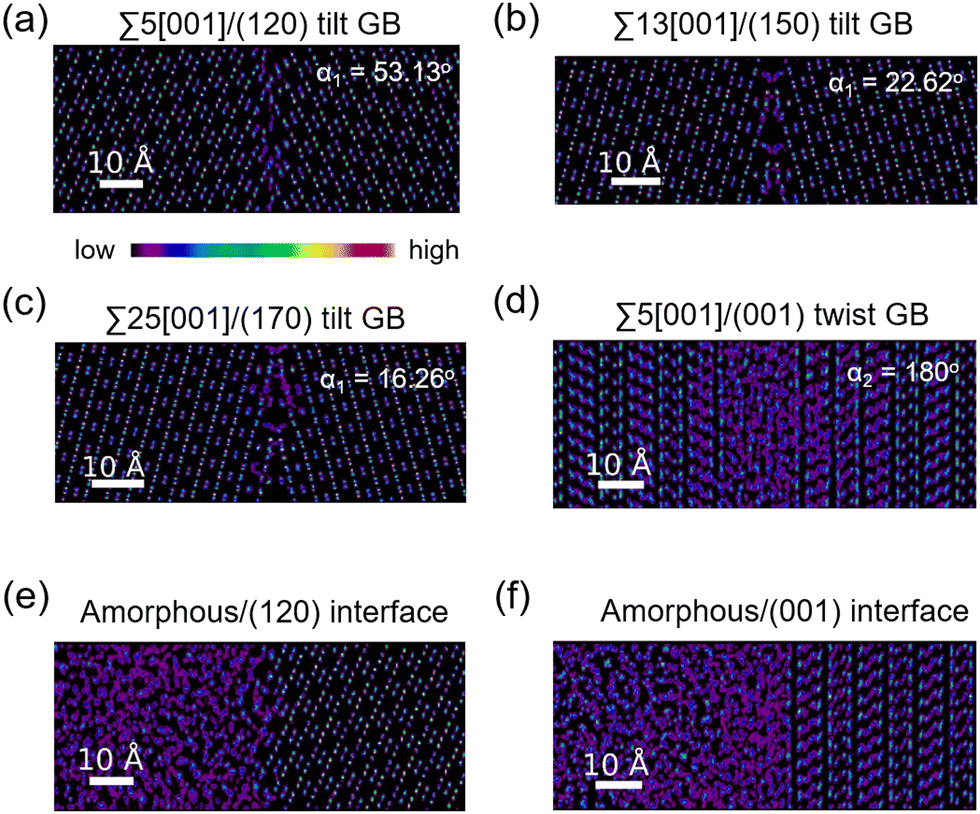 | ||
| Fig. 6 2D-projected atom-count heatmaps for Li atoms from different GB structures as derived from NPT-MD calculations at 300 K: (a) Σ5[001]/(120) tilt GB, (b) Σ13[001]/(150) tilt GB, (c) Σ25[001]/(170) tilt GB, (d) Σ5[001]/(001) twist GB, (e) amorphous/(120) interface, and (f) amorphous/(001) interface. The length scale in the images is shown by the horizontal white line (10 Å). Tilt and twist angles are indicated as α1 and α2, respectively. | ||
Previous works have investigated the variation in Li ion concentration across GB regions in SEs, with the goal of trying to understand how GB structures affect the overall ionic conductivity.75,76 We performed a similar analysis and the results are shown in Fig. 7. The vertical axis represents the normalized Li count while the horizontal axis shows the distance in the GB- or interface-normal direction. In Fig. 7(a)–(c), tilt GBs have similarly shaped troughs and valleys as with the bulk region. In comparison, twist GBs (Fig. 7d) have Li ion concentration profiles that are flattened out, suggesting a significant change in the spatial distribution of Li sites and the number of accessible Li sites relative to the bulk region. This points to a change of the GB Li pathway network, which is likely caused by GB-region structure disordering and atomic rearrangement to lower the GB energy. A similar behavior is also noted in amorphous/crystal interfaces (see Fig. 7e and f). Meanwhile, investigated GBs and amorphous/crystal interfaces do not show Li depletion, which means that there is a low likelihood of GB- and interface-region Li trapping that can reduce Li ion diffusion. The GB- and interface-region disordering will be further analyzed in the later section.
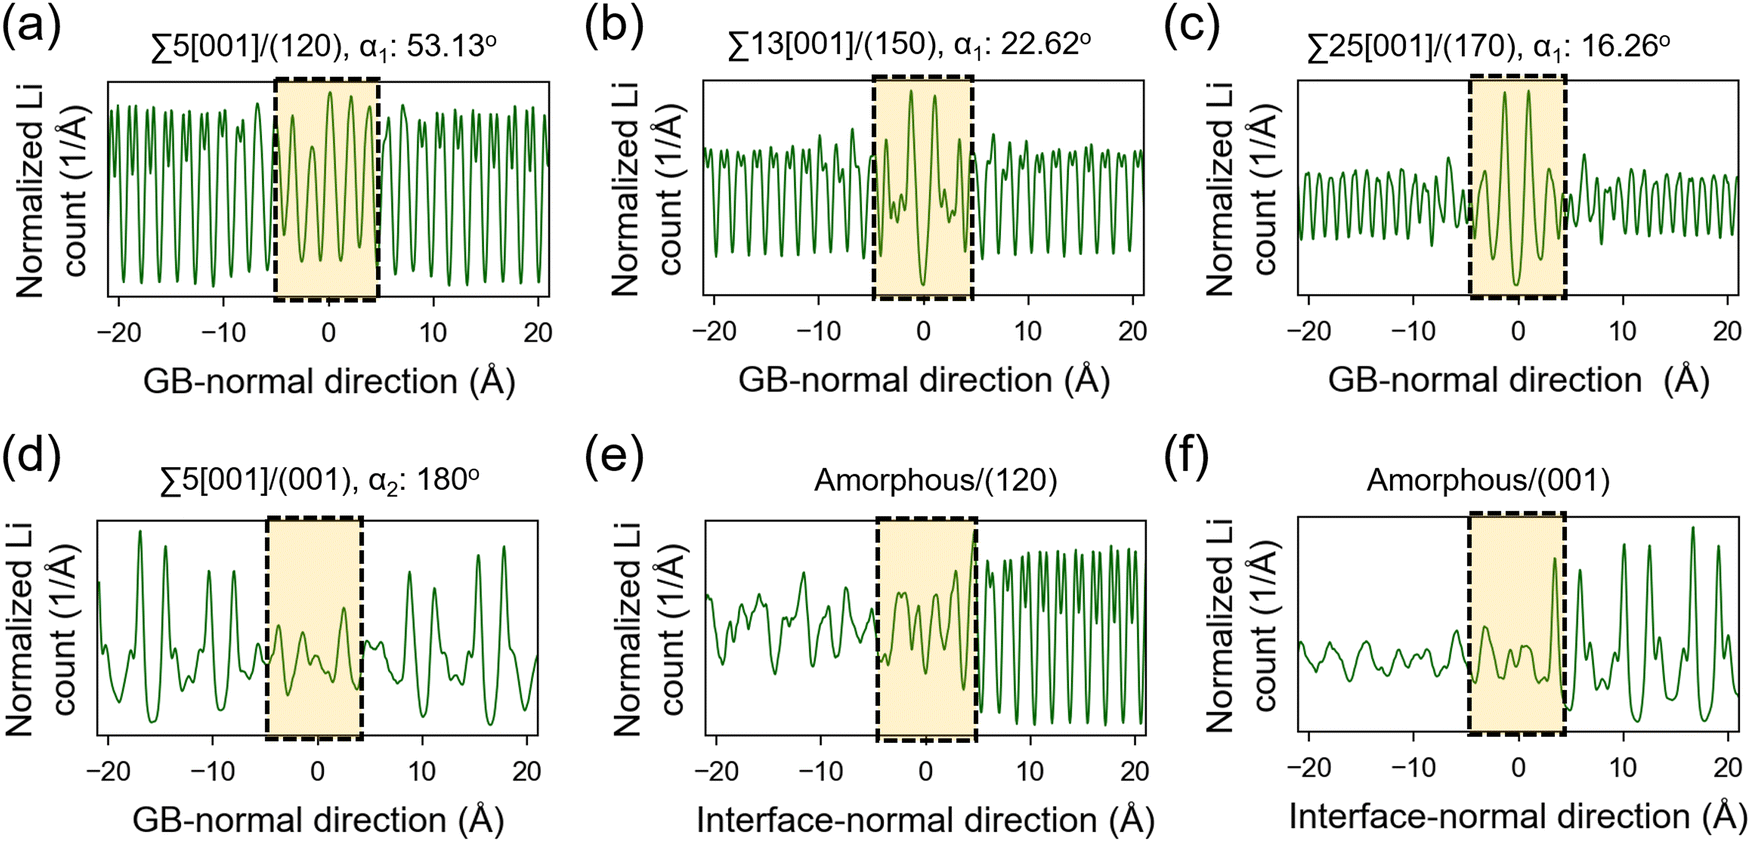 | ||
| Fig. 7 Projected Li concentration profiles around the grain boundary (GB) and amorphous/crystal interface regions: (a) Σ5[001]/(120) tilt GB, (b) Σ13[001]/(150) tilt GB, (c) Σ25[001]/(170) tilt GB, (d) Σ5[001]/(001) twist GB, (e) amorphous/(120) interface, and (f) amorphous/(001) interface. Enclosed regions highlight the GB region. A Gaussian kernel smoothing procedure is performed with a covariance factor of 1.0 × 10⁻⁴. | ||
We analysed the Li diffusion behavior near the misfit dislocation core of GB structures using trajectories from 300 K MD simulations. Two tilt GB structures (Σ55[001]/(120) tilt GB (α1 = 53.13°), Σ5[001]/(170) tilt GB (α1 = 16.26°) and one twist GB structure (Σ55[001]/(001) twist GB (α2 = 180°)) were investigated. A 3D-box boundary region within the GB regions is specified as the dislocation core region (Fig. S9a–c, ESI†). It is found that the MSD of Li within the dislocation cores is generally comparable to that in the respective GB regions (Fig. S9d–f, ESI†). Hence, the dislocation core can be considered as a spatial region with an active Li ion pathway and an important feature that describes the overall GB-region Li diffusivity of GB structures.
Direction-dependent diffusivity at grain boundaries
Fig. 8 displays the direction-dependent Li-ion MSD plots (x and y for GB- or interface-lateral and z for GB- or interface-normal direction) for selected GBs from MTP-MD runs at 300 K. In Σ5[001]/(120) (α1 = 53.13°) and Σ5[001]/(170) (α1 = 16.26°) tilt GBs (Fig. 8a, left and right subplot, respectively), the MSD slopes along the x, y, and z directions are found to be comparable. Meanwhile, in Σ5[001]/(150) (α1 = 22.62°), the MSD slope in the z-direction is shown to be smaller than in the x- and y-directions, suggesting that GB-normal diffusion is relatively slower than GB-lateral diffusion (i.e., anisotropic diffusivity). Anisotropy is also noted in Σ5[001]/(001) twist GB (α2 = 180°) but not in the amorphous/(120) interface structure, see Fig. 8b. The direction-dependent GB-region diffusivity has been suggested as well in Li3N SE GBs.77 Here, a simple parameter for the degree of diffusion isotropy (ξ) is derived using the ratio of the MSD slope components:| ξ = mz/max(mx,my), | (3) |
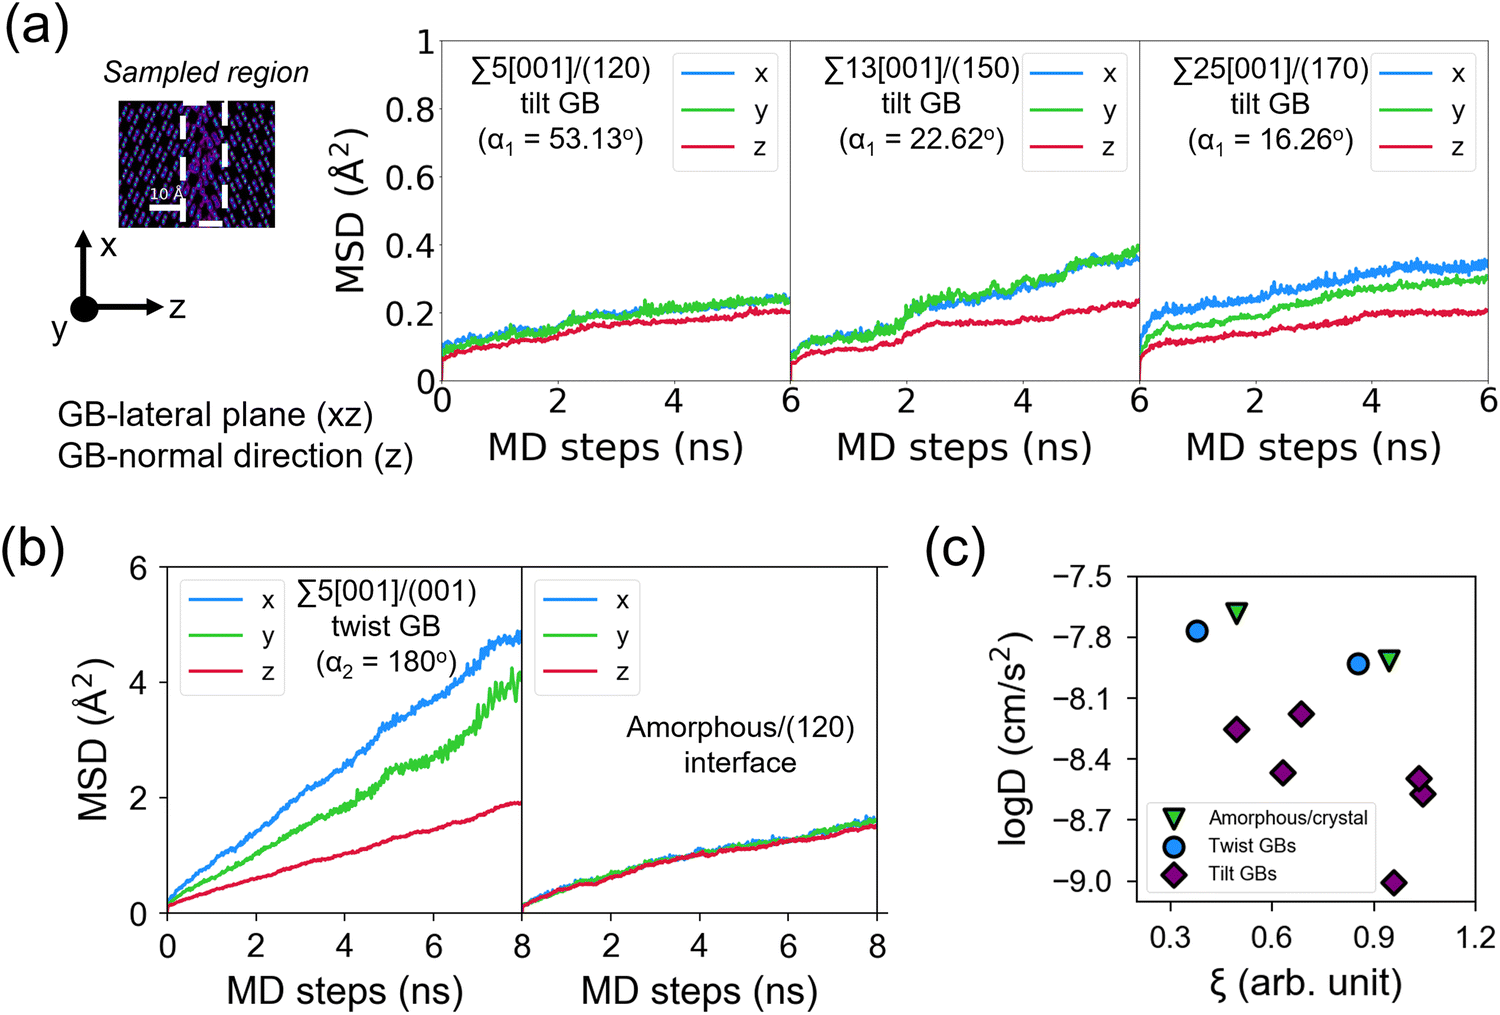 | ||
| Fig. 8 Direction-dependent Li-ion mean squared displacement (MSD) component plots for selected β-PS GB and amorphous/crystal interface structures from 300 K MD runs: (a) tilt GBs: Σ5[001]/(120) tilt GB (left subplot), Σ13[001]/(150) tilt GB (middle subplot), and Σ25[001]/(170) tilt GB (right subplot); (b) twist GBs: Σ5[001]/(120) twist GB (left subplot), amorphous/(120) interface (right subplot). MSD components are determined from 300 K MTP-MD trajectories, with x and y representing GB- or interface-lateral directions and z representing GB- or interface-normal direction. Inset in (a) shows the corresponding 2D-projected Li-ion heatmap, with highlighted GB regions (enclosed in dashed lines) from where the sampling for MSD components is performed. A GB or interface region thickness of ∼10 Å with respect to the z-direction is used. (c) Plot of total-log(D300K) as a function of Li diffusion isotropy parameter ξ (eqn (3)). | ||
The observed trends for direction-dependent diffusivities of the different GB structures can be analyzed together with the 2D-projected MTP-MD atom trajectory densities. In the case of Σ5[001]/(120) tilt GB, which has a relatively large ξ but low D amongst the investigated tilt GBs, it exhibits a limited extent of spatial P disordering which means that the framework structure has less disordering as well (i.e., only spanning for 2 P atomic layers in the GB-normal direction, see Fig. S8, ESI†). This narrow region of P disordering has a highly localized Li atomic density and oriented pathway connectivity across the GB interface (see Fig. 6a), indicating that the GB Li pathway has largely retained the character of the β-LPS bulk Li pathway. Previous calculation work has shown that there is a specific crystal direction in the β-LPS bulk (i.e., [010]) that has a low Li ion migration barrier, while the other orthogonal directions ([100] and [001]) are predicted to have relatively higher barriers.78 Given this, the favorable Li pathway relative to the bulk may be blocked depending on the GB crystal orientation. In Σ5[001]/(120) tilt GB, the GB crystal orientation (i.e., (120)) and the less disordered framework suggest that the relatively low D is mainly due to the significant contribution of the diffusivity component characterized by the less energetically favorable bulk-like Li pathway (i.e., [100] direction of bulk). On the other hand, the Σ5[001]/(001) twist GB, which has a relatively low ξ value but high D, has a relatively large P disordering region (i.e., 5–6 P atomic layers) around the GB interface (see Fig. S8, ESI†). This larger GB-region P disordering and the diffused GB-region Li atomic density (see Fig. 6d) are evidence of new and energetically accessible local pathways for Li ions, thus explaining the high D value. The favorable direction for Li ion migration relative to the bulk (i.e., [010] direction) is found along the GB-lateral direction. A similar observation is found in amorphous-crystal interfaces which are determined to have both high ξ and high D. The large GB-region P disordering from the amorphous slab side induces the formation of more accessible local Li pathways across the GB interface and towards the crystalline side (see Fig. 6e and f). Overall, the disordering of the crystal structure framework is one of the key factors for unlocking high diffusivity and high pathway connectivity in β-LPS GBs. This is rather intuitive because disordering is often associated with defect formation (e.g., Li vacancies, Li interstitials, and Li/P/S Frenkel-like defects) and chemical bond reorganization, both can change the inherent bulk anisotropic diffusivity behavior of β-LPS to a more isotropic one by increasing the number of accessible local diffusion routes at the GB region. Moreover, the present MTP-MD results suggest that the modulation of GB crystal orientation in (highly) crystalline tilt GBs can only change the magnitude of D by one order at most. To provide more insight and description into the diffusivity behavior and local structure of different β-LPS GBs, further analyses are performed in succeeding sections.
Topology of the Li pathway at the grain boundaries
The GB Li pathway network is studied using the Li-ring persistence diagram (PD) which is constructed by applying the persistence homology technique64 on the GB-region 300 K MD trajectories of Li ions. The Li ring sub-networks at the GB region can be visualized as edge connections forming as the Li–Li cutoff distance (dc,Li–Li) is increased. Examples are shown in Fig. S10 and S11 (ESI†) for Σ5[001]/(120) tilt GB and Σ5[001]/(001) twist GB, respectively. In the PD approach, the one-half value of dc,Li–Li can be related to the filtration level for ring birth (b) when the Li sphere radius is increased until neighboring Li spheres touch each other and form a closed loop or a ring feature (i.e., b = 0.5dc,Li–Li). When the radius of the Li spheres is further increased until the ring hole is filled, ring death (d) occurs. The lifetime (L) of a Li ring feature can be calculated as L = d − b. Physically, L measures the closeness of neighboring Li ions in a ring. As a simplified case, a ring that is formed by Li ions in proximity will have a small L (i.e., short-lived feature), while a ring that is formed by Li ions in proximity except for one that is located relatively far from the rest will have a large L (i.e., long-lived or persisting feature). Therefore, L positively correlates with the distance of the farthest Li ion(s) in the ring. PD analysis has been successfully used in the local structure analysis of amorphous solids, which are intrinsically disordered,79,80 similar to GB structures.
Fig. 9a–c shows the PD heatmaps of bulk, GB, and amorphous/crystal interface structures. For the bulk crystal (Fig. 9a), the highest concentration (darkest area) is located near the b axis at b ∼ 4 Å. These features are generated from short-lived Li rings, such as by 3-Li rings, which are formed from two Li 4b and one Li 4c sites (Fig. 1). Larger and more persistent rings, such as 4-Li and 5-Li rings, are found at b < 4 Å and L > 1.0 Å. In the case of the bulk amorphous phase (Fig. 9b), the high-density region is shifted away from the b axis. Even larger rings are also detected, which include the more persistent 6-Li and 8-Li rings in the region defined by L > 1.0 Å and the short-lived ones in the region bounded by b > 4.5 Å and 0 < L < 1.0 Å. To quantitatively evaluate the topological difference in the Li pathway network in bulk, GB, and amorphous/crystal interface structures, we calculate the fraction of PD points (fPD) in the PD region with L > 1.0 Å. The fPD value of the bulk amorphous structure is calculated to be 4.6× larger than the bulk crystal. This comparison hints at the topological difference in the Li pathway network between the two bulk phases and may also partly explain the difference in their calculated D, Ea, and σ300K values. For tilt GBs, a qualitative similarity of the PD shape as with the bulk crystal phase is noticeable (e.g., Σ5[001]/(120) in Fig. 9c), especially on the location of the PD high-density center near the b axis. Their main difference is the 2.7× larger fPD value of the former than the latter. The fPD values for the rest of the GB and amorphous/crystal interface structures are plotted in Fig. 9d, the order for the average fPD (![[f with combining macron]](https://www.rsc.org/images/entities/i_char_0066_0304.gif) PD) values is given as follows: PD,crystal(0.04) < PD,tilt(0.12) < PD,twist(0.22) ≈ PD,amorphous/crystal(0.19) ≈ PD,amorphous(0.24). This suggests that the fPD parameter is related to the degree of structure disordering.
PD) values is given as follows: PD,crystal(0.04) < PD,tilt(0.12) < PD,twist(0.22) ≈ PD,amorphous/crystal(0.19) ≈ PD,amorphous(0.24). This suggests that the fPD parameter is related to the degree of structure disordering.
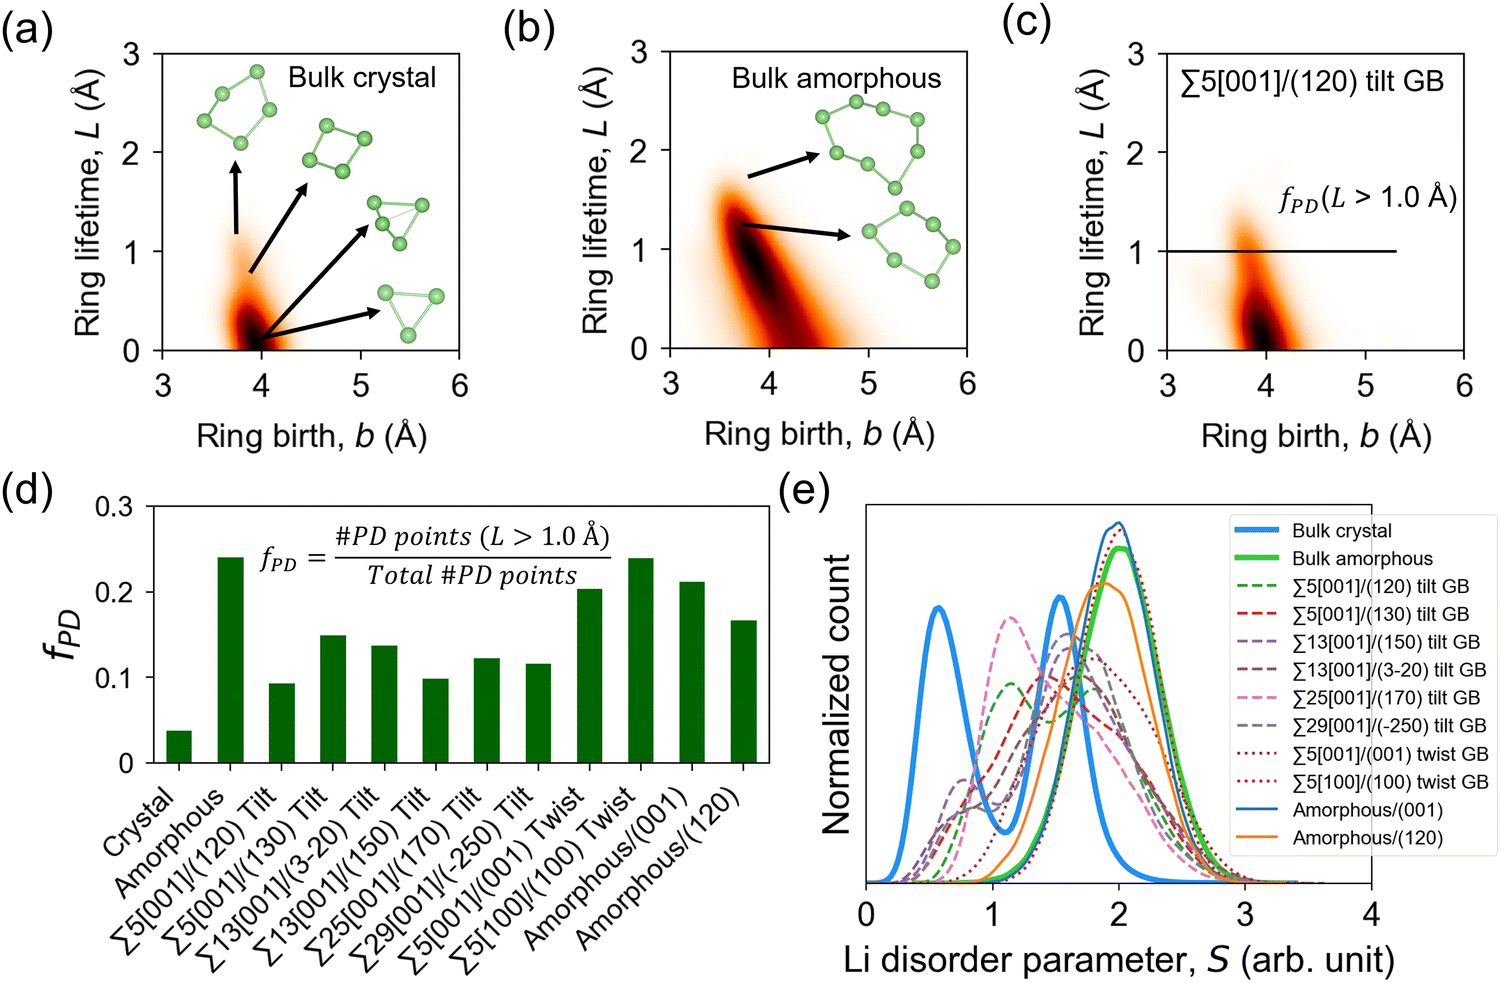 | ||
| Fig. 9 Persistence diagrams (PD) of 1D topological ring features from MD-snapshot Li ion coordinates at 300 K: (a) bulk β-LPS crystal, (b) bulk amorphous phase, (c) Σ5[001]/(120) tilt GB. Heatmaps are smoothened by a Gaussian filter with a parameter σsmooth = 6 Å; a higher PD density region is shown in a relatively darker color. Representative Li ring features of different sizes from the PD plots are shown in (a) and (b). (d) Calculated fraction of PD ring features (fPD) with lifetime L > 1.0 Å (L = d − b, where d and b are ring death and ring birth times, respectively) and (e) distribution of Li site disorder parameter values (eqn (4)) for different bulk, GB, and amorphous/crystal interface structures. | ||
We compute the average disorder parameter around each Li ion (Sj, where j is the central Li ion) as follows:81
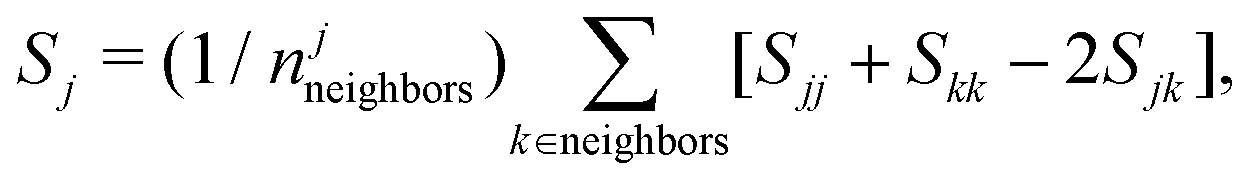 | (4) |
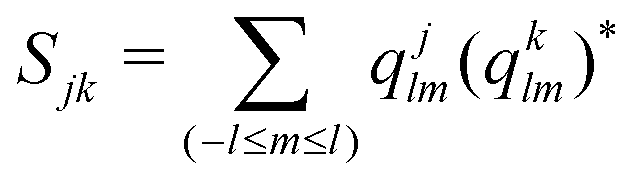 ; l is set to 6. Fig. 9e plots the Sj distributions for bulk, GB, and amorphous/crystal interface structures. A bimodal distribution for the bulk crystal is revealed which can be assigned to the tetrahedral Li 8d/4c sites and the octahedral Li 4b sites. The distribution becomes unimodal for GB and amorphous/crystal interface structures, with the peak shifting towards larger Sj. The same general order is found for average Sj (
![[S with combining macron]](https://www.rsc.org/images/entities/i_char_0053_0304.gif) j) as with PD: j,crystal(1.25) < j,tilt(1.67) < j,twist(1.94) ≈ j,amorphous/crystal(2.01) ≈ j,amorphous(2.00). The order for j (and PD) also corresponds well with MD-predicted σ300K: bulk crystal (10−5 S cm−1) < tilt GBs (10−4 S cm−1) < twist GBs (10−3 S cm−1) ≈ amorphous/crystal interfaces (10−3 S cm−1) ≈ bulk amorphous phase (10−3 S cm−1). The enhanced local disorder has been proposed to be beneficial as well in the Li10GeP2S12 SE.82
j) as with PD: j,crystal(1.25) < j,tilt(1.67) < j,twist(1.94) ≈ j,amorphous/crystal(2.01) ≈ j,amorphous(2.00). The order for j (and PD) also corresponds well with MD-predicted σ300K: bulk crystal (10−5 S cm−1) < tilt GBs (10−4 S cm−1) < twist GBs (10−3 S cm−1) ≈ amorphous/crystal interfaces (10−3 S cm−1) ≈ bulk amorphous phase (10−3 S cm−1). The enhanced local disorder has been proposed to be beneficial as well in the Li10GeP2S12 SE.82
Conclusion
To conclude, we have performed a comprehensive study of the different GBs and amorphous/crystal interfaces in β-LPS using MD simulations with a newly developed MTP. An active learning protocol systematically samples the poorly represented regions of the potential energy surface, resulting in an MTP that can reliably reproduce key structural features and properties of bulk and amorphized β-LPS. We find that the lithium ionic conductivities in the GBs and amorphous/crystal interface in β-LPS are generally higher than the bulk crystal by 1–2 orders of magnitude. Thus, we surmise that the lower total conductivity observed in some previous experimental works may thus be related to other factors, such as final stoichiometry/composition, stabilized crystalline phase, and porosity. The predicted high σ300K of 2.0 × 10⁻³ S cm−1 for the Σ5[001]/(001) twist GB structure, which is also determined to have a highly isotropic diffusivity, provides a potential target for GB engineering in β-LPS. We also find that the lithium ionic conductivity is correlated with structure disorder. Experimentally, disordering is often introduced by amorphizing the SE crystalline phase and it is closely linked to achieving an open structure and a large free volume that facilitates fast ionic conduction (e.g., in glass-ceramic SEs).83 The tilt GBs, twist GBs, and amorphous/crystal interfaces in β-LPS possess varying degrees of amorphous-like character which, in this work, has been quantified in terms of the concentration of large and persisting local Li ring features in the Li GB pathway network and the GB-region Li site disordering. Therefore, control of such GB features can be a key towards an effective optimization of SE conductivity in β-LPS.Conflicts of interest
There are no conflicts to declare.Acknowledgements
Computational resources are provided by National Energy Research Scientific Computing Center (NERSC), Expanse at San Diego Supercomputer Center (SDSC) from the Advanced Cyberinfrastructure Coordination Ecosystem: Services Support (ACCESS) program supported by National Science Foundation grants #2138259, #2138286, #2138307, #2137603, and #2138296, and the Triton Shared Computing Cluster (TSCC) at the University of California, San Diego. RJ and YT are thankful for the support in part by JST through ALCA-SPRING grant number JPMJAL1301, and COI-NEXT grant number JPMJPF2016; by JSPS KAKENHI grant numbers JP19H05815 and JP21K14729; and by MEXT as Materials Processing Science project (“Materealize”) grant number JPMXP0219207397, and “Program for Promoting Research on the Supercomputer Fugaku” grant number JPMXP1020200301. MLHC, JQ and SPO acknowledge funding from the Frontier Research Laboratory (FRL) program of LG Energy Solution.References
- J. Janek and W. G. Zeier, A solid future for battery development, Nat. Energy, 2016, 1, 1–4 CrossRef.
- K. Takada, Progress and prospective of solid-state lithium batteries, Acta Mater., 2013, 61, 759–770 CrossRef CAS.
- R. Chen, Q. Li, X. Yu, L. Chen and H. Li, Approaching Practically Accessible Solid-State Batteries: Stability Issues Related to Solid Electrolytes and Interfaces, Chem. Rev., 2020, 120, 6820–6877 CrossRef CAS PubMed.
- S. Randau, D. A. Weber, O. Kötz, R. Koerver, P. Braun, A. Weber, E. Ivers-Tiffée, T. Adermann, J. Kulisch, W. G. Zeier, F. H. Richter and J. Janek, Benchmarking the performance of all-solid-state lithium batteries, Nat. Energy, 2020, 5, 259–270 CrossRef CAS.
- N. Kamaya, K. Homma, Y. Yamakawa, M. Hirayama, R. Kanno, M. Yonemura, T. Kamiyama, Y. Kato, S. Hama, K. Kawamoto and A. Mitsui, A lithium superionic conductor, Nat. Mater., 2011, 10, 682–686 CrossRef CAS PubMed.
- H.-J. Deiseroth, S.-T. Kong, H. Eckert, J. Vannahme, C. Reiner, T. Zaiß and M. Schlosser, Li6PS5X: A Class of Crystalline Li-Rich Solids With an Unusually High Li+ Mobility, Angew. Chem., Int. Ed., 2008, 47, 755–758, DOI:10.1002/anie.200703900.
- Y. Seino, T. Ota, K. Takada, A. Hayashi and M. Tatsumisago, A sulphide lithium super ion conductor is superior to liquid ion conductors for use in rechargeable batteries, Energy Environ. Sci., 2014, 7, 627–631 RSC.
- K. Homma, M. Yonemura, T. Kobayashi, M. Nagao, M. Hirayama and R. Kanno, Crystal structure and phase transitions of the lithium ionic conductor Li3PS4, Solid State Ionics, 2011, 182, 53–58 CrossRef CAS.
- K. Kaup, L. Zhou, A. Huq and L. F. Nazar, Impact of the Li substructure on the diffusion pathways in alpha and beta Li3PS4: an in situ high temperature neutron diffraction study, J. Mater. Chem. A, 2020, 8, 12446–12456 RSC.
- M. Tachez, J.-P. Malugani, R. Mercier and G. Robert, Ionic conductivity of and phase transition in lithium thiophosphate Li3PS4, Solid State Ionics, 1984, 14, 181–185 CrossRef CAS.
- Y. Chen, L. Cai, Z. Liu, C. R. dela Cruz, C. Liang and K. An, Correlation of anisotropy and directional conduction in β-Li3PS4 fast Li+ conductor, Appl. Phys. Lett., 2015, 107, 013904 CrossRef.
- Z. Liu, W. Fu, E. A. Payzant, X. Yu, Z. Wu, N. J. Dudney, J. Kiggans, K. Hong, A. J. Rondinone and C. Liang, Anomalous High Ionic Conductivity of Nanoporous β-Li3PS4, J. Am. Chem. Soc., 2013, 135, 975–978 CrossRef CAS PubMed.
- H. Stöffler, T. Zinkevich, M. Yavuz, A. Senyshyn, J. Kulisch, P. Hartmann, T. Adermann, S. Randau, F. H. Richter, J. Janek, S. Indris and H. Ehrenberg, Li+-Ion Dynamics in β-Li3PS4 Observed by NMR: Local Hopping and Long-Range Transport, J. Phys. Chem. C, 2018, 122, 15954–15965 CrossRef.
- X. Liu, R. Garcia-Mendez, A. R. Lupini, Y. Cheng, Z. D. Hood, F. Han, A. Sharafi, J. C. Idrobo, N. J. Dudney, C. Wang, C. Ma, J. Sakamoto and M. Chi, Local electronic structure variation resulting in Li ‘filament’ formation within solid electrolytes, Nat. Mater., 2021, 20, 1485–1490 CrossRef CAS PubMed.
- X. Yang, X. Gao, M. Jiang, J. Luo, J. Yan, J. Fu, H. Duan, S. Zhao, Y. Tang, R. Yang, R. Li, J. Wang, H. Huang, C. Veer Singh and X. Sun, Grain Boundary Electronic Insulation for High-Performance All-Solid-State Lithium Batteries, Angew. Chem., Int. Ed., 2023, 62, e202215680, DOI:10.1002/anie.202215680.
- A. Hayashi, K. Noi, A. Sakuda and M. Tatsumisago, Superionic glass-ceramic electrolytes for room-temperature rechargeable sodium batteries, Nat. Commun., 2012, 3, 856 CrossRef PubMed.
- C. Dietrich, D. A. Weber, S. J. Sedlmaier, S. Indris, S. P. Culver, D. Walter, J. Janek and W. G. Zeier, Lithium ion conductivity in Li2S-P2S5 glasses - building units and local structure evolution during the crystallization of superionic conductors Li3PS4, Li7P3S11 and Li4P2S7, J. Mater. Chem. A, 2017, 5, 18111–18119 RSC.
- H. Guo, Q. Wang, A. Urban and N. Artrith, Artificial Intelligence-Aided Mapping of the Structure-Composition-Conductivity Relationships of Glass-Ceramic Lithium Thiophosphate Electrolytes, Chem. Mater., 2022, 34, 6702–6712 CrossRef CAS PubMed.
- F. N. Forrester, J. A. Quirk, T. Famprikis and J. A. Dawson, Disentangling Cation and Anion Dynamics in Li3PS4 Solid Electrolytes, Chem. Mater., 2022, 34, 10561–10571 CrossRef CAS PubMed.
- T. Baba and Y. Kawamura, Structure and Ionic Conductivity of Li2S-P2S5 Glass Electrolytes Simulated with First-Principles Molecular Dynamics, Front. Energy Res., 2016, 4(22), 1–10 Search PubMed.
- Z. Zhang, H. Li, K. Kaup, L. Zhou, P.-N. Roy and L. F. Nazar, Targeting Superionic Conductivity by Turning on Anion Rotation at Room Temperature in Fast Ion Conductors, Matter, 2020, 2, 1667–1684 CrossRef.
- N. J. de Klerk, E. van der Maas and M. Wagemaker, Analysis of Diffusion in Solid-State Electrolytes through MD Simulations, Improvement of the Li-Ion Conductivity in β-Li3PS4 as an Example, ACS Appl. Energy Mater., 2018, 1, 3230–3242 CrossRef CAS PubMed.
- J. Yang and J. S. Tse, First-principles molecular simulations of Li diffusion in solid electrolytes Li3PS4, Comput. Mater. Sci., 2015, 107, 134–138 CrossRef CAS.
- G. K. P. Dathar, J. Balachandran, P. R. C. Kent, A. J. Rondinone and P. Ganesh, Li-ion site disorder driven superionic conductivity in solid electrolytes: a first-principles investigation of β-Li3PS4, J. Mater. Chem. A, 2017, 5, 1153–1159 RSC.
- P. Žguns and B. Yildiz, Strain Sensitivity of Li-ion Conductivity in β-Li3PS4 Solid Electrolyte, PRX Energy, 2022, 1, 023003 CrossRef.
- J.-S. Kim, W. D. Jung, J.-W. Son, J.-H. Lee, B.-K. Kim, K.-Y. Chung, H.-G. Jung and H. Kim, Atomistic Assessments of Lithium-Ion Conduction Behavior in Glass-Ceramic Lithium Thiophosphates, ACS Appl. Mater. Interfaces, 2019, 11, 13–18 CrossRef CAS PubMed.
- T. Ates, A. Neumann, T. Danner, A. Latz, M. Zarrabeitia, D. Stepien, A. Varzi and S. Passerini, Elucidating the Role of Microstructure in Thiophosphate Electrolytes - a Combined Experimental and Theoretical Study of β-Li3PS4, Adv. Sci., 2022, 9, 2105234, DOI:10.1002/advs.202105234.
- E. A. Wu, et al., A stable cathode-solid electrolyte composite for high-voltage, long-cycle-life solid-state sodium-ion batteries, Nat. Commun., 2021, 12, 1256 CrossRef CAS PubMed.
- S.-T. Ko, T. Lee, J. Qi, D. Zhang, W.-T. Peng, X. Wang, W.-C. Tsai, S. Sun, Z. Wang, W. J. Bowman, S. P. Ong, X. Pan and J. Luo, Compositionally complex perovskite oxides: Discovering a new class of solid electrolytes with interface-enabled conductivity improvements, Matter, 2023, 6, 2395–2418 CrossRef CAS.
- J. Wang, A. A. Panchal, G. S. Gautam and P. Canepa, The resistive nature of decomposing interfaces of solid electrolytes with alkali metal electrodes, J. Mater. Chem. A, 2022, 10, 19732–19742 RSC.
- C. Chen and S. P. Ong, A universal graph deep learning interatomic potential for the periodic table, Nat. Comput. Sci., 2022, 2, 718–728 CrossRef.
- T. W. Ko, J. A. Finkler, S. Goedecker and J. Behler, A fourth-generation high-dimensional neural network potential with accurate electrostatics including non-local charge transfer, Nat. Commun., 2021, 12, 398 CrossRef CAS PubMed.
- S. Batzner, A. Musaelian, L. Sun, M. Geiger, J. P. Mailoa, M. Kornbluth, N. Molinari, T. E. Smidt and B. Kozinsky, E(3)-equivariant graph neural networks for data-efficient and accurate interatomic potentials, Nat. Commun., 2022, 13, 2453 CrossRef CAS PubMed.
- A. P. Bartók and G. Csányi, Gaussian approximation potentials: A brief tutorial introduction, Int. J. Quantum Chem., 2015, 115, 1051–1057, DOI:10.1002/qua.24927.
- A. P. Thompson, L. P. Swiler, C. R. Trott, S. M. Foiles and G. J. Tucker, Spectral neighbor analysis method for automated generation of quantum-accurate interatomic potentials, J. Comput. Phys., 2015, 285, 316–330 CrossRef CAS.
- A. V. Shapeev, Moment Tensor Potentials: A Class of Systematically Improvable Interatomic Potentials, Multiscale Model. Simul., 2016, 14, 1153–1173 CrossRef.
- K. Gubaev, E. V. Podryabinkin, G. L. W. Hart and A. V. Shapeev, Accelerating high-throughput searches for new alloys with active learning of interatomic potentials, Comput. Mater. Sci., 2019, 156, 148–156 CrossRef CAS.
- I. I. Novoselov, A. V. Yanilkin, A. V. Shapeev and E. V. Podryabinkin, Moment tensor potentials as a promising tool to study diffusion processes, Comput. Mater. Sci., 2019, 164, 46–56 CrossRef CAS.
- A. Lomaka and T. Tamm, Linearization of moment tensor potentials for multicomponent systems with a preliminary assessment for short-range interaction energy in water dimer and trimer, J. Chem. Phys., 2020, 152, 164115 CrossRef CAS PubMed.
- Y. Zuo, C. Chen, X. Li, Z. Deng, Y. Chen, J. Behler, G. Csányi, A. V. Shapeev, A. P. Thompson, M. A. Wood and S. P. Ong, Performance and Cost Assessment of Machine Learning Interatomic Potentials, J. Phys. Chem. A, 2020, 124, 731–745 CrossRef CAS PubMed.
- J. Qi, S. Banerjee, Y. Zuo, C. Chen and Z. Zhu, Holekevi Chandrappa, M. L.; Li, X.; Ong, S. P. Bridging the gap between simulated and experimental ionic conductivities in lithium superionic conductors, Mater. Today Phys., 2021, 21, 100463 CrossRef CAS.
- M. L. Holekevi Chandrappa, J. Qi, C. Chen, S. Banerjee and S. P. Ong, Thermodynamics and Kinetics of the Cathode-Electrolyte Interface in All-Solid-State Li–S Batteries, J. Am. Chem. Soc., 2022, 144, 18009–18022 CrossRef CAS PubMed.
- S. P. Ong, W. D. Richards, A. Jain, G. Hautier, M. Kocher, S. Cholia, D. Gunter, V. L. Chevrier, K. A. Persson and G. Ceder, Python Materials Genomics (pymatgen): A robust, open-source python library for materials analysis, Comput. Mater. Sci., 2013, 68, 314–319 CrossRef CAS.
- A. Jain, S. P. Ong, W. Chen, B. Medasani, X. Qu, M. Kocher, M. Brafman, G. Petretto, G.-M. Rignanese, G. Hautier, D. Gunter and K. A. Persson, FireWorks: a dynamic workflow system designed for high-throughput applications, Concurrency Comput.: Pract. Exp., 2015, 27, 5037–5059, DOI:10.1002/cpe.3505.
- G. Bergerhoff, R. Hundt, R. Sievers and I. D. Brown, The inorganic crystal structure data base, J. Chem. Inf. Comput. Sci., 1983, 23, 66–69 CrossRef CAS.
- G. Kresse and J. Hafner, Ab initio molecular dynamics for liquid metals, Phys. Rev. B: Condens. Matter Mater. Phys., 1993, 47, 558–561 CrossRef CAS PubMed.
- G. Kresse and J. Furthmüller, Efficient iterative schemes for ab initio total-energy calculations using a plane-wave basis set, Phys. Rev. B: Condens. Matter Mater. Phys., 1996, 54, 11169–11186 CrossRef CAS PubMed.
- J. P. Perdew and Y. Wang, Accurate and simple analytic representation of the electron-gas correlation energy, Phys. Rev. B: Condens. Matter Mater. Phys., 1992, 45, 13244–13249 CrossRef PubMed.
- G. Kresse and D. Joubert, From ultrasoft pseudopotentials to the projector augmented-wave method, Phys. Rev. B: Condens. Matter Mater. Phys., 1999, 59, 1758–1775 CrossRef CAS.
- P. E. Blöchl, Projector augmented-wave method, Phys. Rev. B: Condens. Matter Mater. Phys., 1994, 50, 17953–17979 CrossRef PubMed.
- J. P. Perdew, A. Ruzsinszky, G. I. Csonka, O. A. Vydrov, G. E. Scuseria, L. A. Constantin, X. Zhou and K. Burke, Restoring the Density-Gradient Expansion for Exchange in Solids and Surfaces, Phys. Rev. Lett., 2008, 100, 136406 CrossRef PubMed.
- J. P. Perdew, K. Burke and M. Ernzerhof, Generalized Gradient Approximation Made Simple, Phys. Rev. Lett., 1996, 77, 3865–3868 CrossRef CAS PubMed.
- J. Klimeš, D. R. Bowler and A. Michaelides, Chemical accuracy for the van der Waals density functional, J. Phys.: Condens. Matter, 2009, 22, 022201 CrossRef PubMed.
- I. S. Novikov, K. Gubaev, E. V. Podryabinkin and A. V. Shapeev, The MLIP package: moment tensor potentials with MPI and active learning, Mach. Learn.: Sci. Technol., 2020, 2, 025002 Search PubMed.
- S. Plimpton, Fast Parallel Algorithms for Short-Range Molecular Dynamics, J. Comput. Phys., 1995, 117, 1–19 CrossRef CAS.
- G. J. Martyna, D. J. Tobias and M. L. Klein, Constant pressure molecular dynamics algorithms, J. Chem. Phys., 1994, 101, 4177–4189 CrossRef CAS.
- L. Verlet, Computer “Experiments” on Classical Fluids. I. Thermodynamical Properties of Lennard-Jones Molecules, Phys. Rev., 1967, 159, 98–103 CrossRef CAS.
- M. Parrinello and A. Rahman, Polymorphic transitions in single crystals: A new molecular dynamics method, J. Appl. Phys., 1981, 52, 7182–7190 CrossRef CAS.
- M. E. Tuckerman, J. Alejandre, R. López-Rendón, A. L. Jochim and G. J. Martyna, A Liouville-operator derived measure-preserving integrator for molecular dynamics simulations in the isothermal-isobaric ensemble, J. Phys. A: Math. Gen., 2006, 39, 5629 CrossRef CAS.
- J. A. P. D. Paula, Physical Chemistry by Peter; De Paula, Julio Atkins (2006) Paperback, Oxford University Press, Oxford, New York, 8th edn, 2006 Search PubMed.
- A. Van der Ven, Z. Deng, S. Banerjee and S. P. Ong, Rechargeable Alkali-Ion Battery Materials: Theory and Computation, Chem. Rev., 2020, 120, 6977–7019 CrossRef CAS PubMed.
- T. Lee, J. Qi, C. A. Gadre, H. Huyan, S.-T. Ko, Y. Zuo, C. Du, J. Li, T. Aoki, R. Wu, J. Luo, S. P. Ong and X. Pan, Atomic-scale origin of the low grain-boundary resistance in perovskite solid electrolyte Li0.375Sr0.4375Ta0.75Zr0.25O3, Nat. Commun., 2023, 14, 1940 CrossRef CAS PubMed.
- Z. Deng, Z. Zhu, I.-H. Chu and S. P. Ong, Data-Driven First-Principles Methods for the Study and Design of Alkali Superionic Conductors, Chem. Mater., 2017, 29, 281–288 CrossRef CAS.
- A. Zomorodian and G. Carlsson, Computing Persistent Homology, Discrete. Comput Geom., 2005, 33, 249–274 CrossRef.
- GitHub – scikit-tda/scikit-tda at v1.0.0. https://github.com/scikit-tda/scikit-tda.
- S. Menon, G. D. Leines and J. Rogal, Pyscal: A python module for structural analysis of atomic environments, J. Open Source Softw., 2019, 4, 1824 CrossRef.
- K. Momma and F. Izumi, VESTA 3 for three-dimensional visualization of crystal, volumetric and morphology data, J. Appl. Crystallogr., 2011, 44, 1272–1276 CrossRef CAS.
- J. D. Hunter, Matplotlib: A 2D Graphics Environment, Comput. Sci. Eng., 2007, 9, 90–95 Search PubMed.
- R. Mercier, J.-P. Malugani, B. Fahys, G. Robert and J. Douglade, Structure du tetrathiophosphate de lithium, Acta Crystallogr., Sect. B: Struct. Crystallogr. Cryst. Chem., 1982, 38, 1887–1890 CrossRef.
- L. L. Baranowski, C. M. Heveran, V. L. Ferguson and C. R. Stoldt, Multi-Scale Mechanical Behavior of the Li3PS4 Solid-Phase Electrolyte, ACS Appl. Mater. Interfaces, 2016, 8, 29573–29579 CrossRef CAS PubMed.
- H. Stöffler, T. Zinkevich, M. Yavuz, A.-L. Hansen, M. Knapp, J. Bednar
![[c with combining breve]](https://www.rsc.org/images/entities/char_0063_0306.gif) ík, S. Randau, F. H. Richter, J. Janek, H. Ehrenberg and S. Indris, Amorphous versus Crystalline Li3PS4: Local Structural Changes during Synthesis and Li Ion Mobility, J. Phys. Chem. C, 2019, 123, 10280–10290 CrossRef.
ík, S. Randau, F. H. Richter, J. Janek, H. Ehrenberg and S. Indris, Amorphous versus Crystalline Li3PS4: Local Structural Changes during Synthesis and Li Ion Mobility, J. Phys. Chem. C, 2019, 123, 10280–10290 CrossRef. - S. Lu, F. Kosaka, S. Shiotani, H. Tsukasaki, S. Mori and J. Otomo, Optimization of lithium ion conductivity of Li2S-P2S5 glass ceramics by microstructural control of crystallization kinetics, Solid State Ionics, 2021, 362, 115583 CrossRef CAS.
- A. Hayashi, S. Hama, H. Morimoto, M. Tatsumisago and T. Minami, Preparation of Li2S-P2S5 Amorphous Solid Electrolytes by Mechanical Milling, J. Am. Ceram. Soc., 2001, 84, 477–479, DOI:10.1111/j.1151-2916.2001.tb00685.x.
- K. Hayamizu, Y. Aihara, T. Watanabe, T. Yamada, S. Ito and N. Machida, NMR studies on lithium ion migration in sulfide-based conductors, amorphous and crystalline Li3PS4, Solid State Ionics, 2016, 285, 51–58 CrossRef CAS.
- S. Yu and D. J. Siegel, Grain Boundary Contributions to Li-Ion Transport in the Solid Electrolyte Li7La3Zr2O12 (LLZO), Chem. Mater., 2017, 29, 9639–9647 CrossRef CAS.
- K. Shen, R. He, Y. Wang, C. Zhao and H. Chen, Atomistic Insights into the Role of Grain Boundary in Ionic Conductivity of Polycrystalline Solid-State Electrolytes, J. Phys. Chem. C, 2020, 124, 26241–26248 CrossRef CAS.
- Z. Deng, C. Chen, X.-G. Li and S. P. Ong, An electrostatic spectral neighbor analysis potential for lithium nitride, npj Comput. Mater., 2019, 5, 1–8 CrossRef CAS.
- Y. Yang, Q. Wu, Y. Cui, Y. Chen, S. Shi, R.-Z. Wang and H. Yan, Elastic Properties, Defect Thermodynamics, Electrochemical Window, Phase Stability, and Li+ Mobility of Li3PS4: Insights from First-Principles Calculations, ACS Appl. Mater. Interfaces, 2016, 8, 25229–25242 CrossRef CAS PubMed.
- Y. Hiraoka, T. Nakamura, A. Hirata, E. G. Escolar, K. Matsue and Y. Nishiura, Hierarchical structures of amorphous solids characterized by persistent homology, Proc. Natl. Acad. Sci. U. S. A., 2016, 113, 7035–7040 CrossRef CAS PubMed.
- S. S. Sørensen, C. A. N. Biscio, M. Bauchy, L. Fajstrup and M. M. Smedskjaer, Revealing hidden medium-range order in amorphous materials using topological data analysis, Sci. Adv., 2020, 6, eabc2320 CrossRef PubMed.
- T. Kawasaki and A. Onuki, Construction of a disorder variable from Steinhardt order parameters in binary mixtures at high densities in three dimensions, J. Chem. Phys., 2011, 135, 174109 CrossRef PubMed.
- J. A. Dawson and M. S. Islam, A Nanoscale Design Approach for Enhancing the Li-Ion Conductivity of the Li10GeP2S12 Solid Electrolyte, ACS Mater. Lett., 2022, 4, 424–431 CrossRef CAS PubMed.
- M. Tatsumisago and A. Hayashi, Superionic glasses and glass-ceramics in the Li2S-P2S5 system for all-solid-state lithium secondary batteries, Solid State Ionics, 2012, 225, 342–345 CrossRef CAS.
Footnote |
| † Electronic supplementary information (ESI) available: (i) GB structure generation, (ii) construction of GB seed structures of β-LPS for MTP training, (iii) construction of amorphous-crystal GB structures of β-LPS for use in MD runs with trained MTP, (iv) formation of topological ring structures by persistent homology, (v) MTP hyperparameter tuning details, (vi) MTP active learning results, (vii) MAE in energies and ion forces for bulk crystal and amorphous LPS by trained MTP, (viii) element-based MSD plots of GB models, (ix) MD-derived P and S heatmap at 300 K in GB and interface models, (x) diffusion behaviors at dislocation cores of GB structures, and (xi) visualization of Li ring sub-networks in GB structures. See DOI: https://doi.org/10.1039/d3ya00234a |
| This journal is © The Royal Society of Chemistry 2023 |