DOI:
10.1039/D3YA00365E
(Paper)
Energy Adv., 2023,
2, 2006-2017
In-plane gradient design of flow fields enables enhanced convections for redox flow batteries
Received
31st July 2023
, Accepted 9th October 2023
First published on 13th October 2023
Abstract
In the realm of redox flow batteries, the flow field plays a vital role in influencing the overall performances of the redox flow batteries. Inspired by human behavior, an in-plane gradient flow field design featuring a gradient decrease in channel width from the inlet to the outlet is proposed in this work. A three-dimensional multi-physical simulation model was utilized to investigate the transport behaviors and overall battery performance associated with novel flow field configurations. It was indicated that the novel in-plane gradient design can enhance the under-rib convections of the electrolyte in the downstream regions near the outlet, leading to improved uniformity of the active species’ distribution over porous electrodes. Consequently, this enhancement substantially reduces concentration polarization losses of redox flow batteries. The maximum power density and rated current density of the proposed design are 553.2 mW cm−2 and 270.1 mA cm−2, which are 74.5 mW cm−2 and 8.3 mA cm−2 higher than conventional design. These results substantiate the benefits of employing the proposed flow field for achieving high-performance battery designs. Meanwhile, due to its straightforward, efficient, and easily scalable design mechanism, this novel flow field shows great promise for engineering applications of redox flow batteries.
1. Introduction
Future sustainability and carbon neutrality hinge on the advancement of renewable energy technologies.1,2 Solar and wind power are among the most popular choices. Yet, their intermittent and unpredictable nature necessitates the urgent development of large-scale energy storage systems to assimilate renewable energy sources.3,4 Electrochemical energy storage systems, such as vanadium redox flow batteries (VRFBs), are among the most promising technologies to address this issue due to their inherent safety, recoverable crossover, and scalability. The VRFB consists of the power unit and electrolyte reservoirs,5,6 with the former dictating system power and the latter determining capacity. Consequently, the power and capacity of the system are decoupled, and like the pumped storage and compressed air systems, making it well-suited for long-term energy storage in the era of carbon neutrality.
The power unit of VRFBs comprises essential components, namely the flow fields, electrodes and a membrane. The electrolytes are recirculated from external reservoirs and into the power unit by a circulation pump. The active species dissolved in the aqueous electrolytes are delivered to the porous electrodes through the flow fields, initiating electrochemical redox reactions. Conventionally, VRFBs adopt a flow-through structure, wherein the electrolyte is directly pumped through the electrodes, leading to significant pressure drop and pumping losses.7,8 Typically, more than 3 mm thick electrodes were used to minimize pumping losses, but this also causes higher internal ohmic resistance, thereby leading to suboptimal overall performances (lower than 150 mA cm−2 at an energy efficiency of 80%).
Since then, researchers have devised flow-by designs in which flow fields are incorporated alongside the porous electrodes. Conventional designs include parallel flow fields (PFFs),9 serpentine flow fields (SFFs)10,11 and interdigitated flow fields (IFFs).12 In these flow-by setups, the electrolyte flows through the channels and is transported into the electrodes. Adopting thinner electrodes in channel-based cells reduces internal resistance and enhances cell functionality.13 Different mass transfer properties are associated with various flow pattern designs. PFF is the design with the lowest pressure drop of inlet and outlet since the electrolyte flows parallel between various flow channels,14 but it also results in poor mass transfer. Therefore, SFFs and IFFs have gained greater attention in recent research. While the inlet and outlet of the IFF are not connected, the electrolyte must be pumped through the porous electrodes. IFFs, however, experience high-pressure drops when used with densely compressed electrodes. Conversely, SFFs have interconnected flow channels from the inlet to outlet, enabling the electrolyte to flow through both the channel and porous electrode, which minimizes the pressure drop but may lead to uneven distribution. Researchers have focused on modifying porous electrodes for balancing mass transfer and active sites.15–18 Li et al.19 proposed a gradient-pore-oriented graphite felt electrode that improves electrochemical activity and enhances mass transport from the nano- to the micro-scale. This gradient-pore-oriented electrode exhibits an energy efficiency as high as 79.74% at 200 mA cm−2 on VRFBs, suggesting great potential applications in high-performance flow batteries. Although improved VRFB performance by electrode surface modification and microstructures is intuitive, mass transfer still also relies mainly on flow field optimization.
All three flow patterns and the modified ones are directly derived from fuel cell technology and introduced onto VRFBs. For example, Xu et al.20 first proposed a convection-enhanced serpentine flow field, which brings about larger pressure differences between adjacent flow channels and thereby enhances in-plane forced flow through the electrode porous layer. Their pioneering design concept has been utilized in VRFBs and presents significantly excellent effects.21–23 Typically, optimization of the flow-field parameters, such as channel width, depth, and opening ratio, has not adequately considered the distinct structure of VRFBs and the properties of the active species. Unlike fuel cells, the component adjacent to the flow field is the gas diffusion layer responsible for transporting reactants and products. In VRFBs, on the other hand, the porous electrodes adjacent to the flow field not only facilitate the transport of active species but also serve as active sites for the redox reaction. More importantly, the reactants in fuel cells, such as hydrogen and oxygen, have high diffusion rates, an order of magnitude higher than the reactive ions in flow batteries using liquid electrolytes. While electrochemical reactions in fuel cells mainly occur in the catalytic layer adjacent to the membrane, VRFB reactions primarily take place in the porous electrode beneath the flow channels’ ribs of flow channels. Additionally, the reaction in fuel cells involves a gas–liquid phase transition, whereas the VRFBs only involve a single liquid-phase reaction.
In light of these differences in working mode and system characteristics between fuel cells and flow batteries, direct utilization of fuel-cell flow-field designs in flow batteries may give rise to various issues. Hence, it is necessary to optimize the flow field according to the working modes of the flow battery and the requirements of active species.24–28 For instance, Xu et al.29 explored the design of blocked serpentine flow channels for VRFBs to achieve a more homogeneous distribution of electrolyte flow and enhance active mass transport within the electrodes, thus improving the overall battery performance. Considering the effects of different block heights on reactant distribution and battery voltage, they suggested that the optimized height of 0.14 mm led to the highest net discharge power at 16.73 W. Zheng et al.30 proposed a separate serpentine flow field with two flow channels—one located on the porous electrode next to the membrane and the other on a carbon plate. This design features a combined advantage of serpentine and interdigital patterns, guiding the electrolyte along a U-shaped path within a single channel, passing through porous electrodes rather than channels between them. This design improves the uniformity of the active species’ distribution, even with relatively thick electrodes at 5 mm. While these designs demonstrate promising performances, their sophisticated performance improvement mechanisms pose challenges for promotion and scaling-up.
Herein, inspired by the towel-twisting phenomenon, an in-plane gradient flow field (IGFF) is proposed for redox flow batteries. The channel width is designed to decrease gradually from the upstream region at the inlet to the downstream zone at the outlet, deviating from the conventional approaches. This unique gradient change in channel width corresponds to the decrease in reactant concentration. Therefore, the adoption of IGFF enhances the under-rib convection in the near-outlet region, thereby promoting the mass transfer capability of active species throughout the entire porous electrode. Utilizing a 3D multi-physical simulated model, the introduction of IGFF can improve the average reactant concentration, distribution uniformity and current density on the porous electrodes. The maximum power density and rated current density of the proposed design are 553.2 mW cm−2 and 270.1 mA cm−2, which are 74.5 mW cm−2 and 8.3 mA cm−2 higher than the conventional design. These results clearly demonstrate the advantages of the proposed IGFF in constructing high-performance VRFB. Meanwhile, the straightforward, efficient, and easily scalable design mechanism, opens up possibilities for its application in engineering applications of VRFB stacks.
2. Results and discussions
2.1. The in-plane gradient design mechanism
Convection and mass transport phenomena are common in nature and human life and play crucial roles in various processes. An example is the water retention phenomenon of a rolled towel of uniform diameter. The presence of numerous pores between the fibers of the towel enables the water to remain in a stable state. This stability is achieved when a towel is rolled into a uniform-diameter tube. It is worth noting that altering objects’ parameters (diameter, width, etc.) is a practical and effective means of modifying hydraulic pressure and fluid velocity. When it is necessary to extract the held water, humans tend to tighten one end of the towel tube to reduce its diameter, thereby squeezing out water (Fig. 1a). This is a simple example of human behavior to effectively utilize diameter changes for enhancing convections. It can also be observed in other natural objects, such as changes in river width, changes in pipeline diameter, and so on. The human behavior is considered applicable to flow field optimization to enhance the mass transport of active species for VRFB.
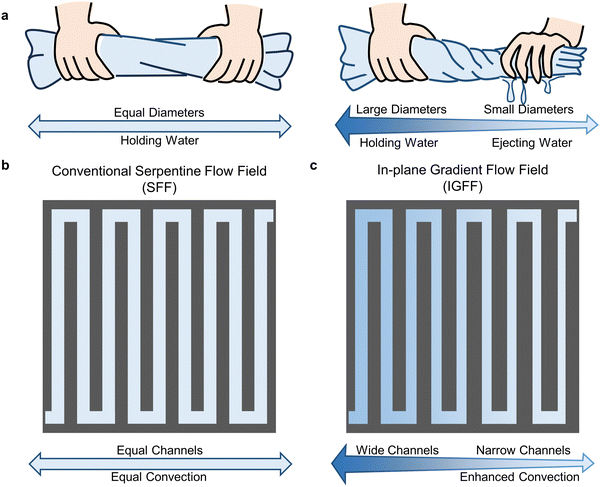 |
| | Fig. 1 The (a) in-plane gradient design principles and geometric patterns of (b) SFF and (c) IGFF. | |
The flow channels of conventional SFF designs in VRFB maintain the same width throughout the entire region. It contains multiple long flow channels and U-shaped interconnections to form a connection from the inlet to the outlet, as shown in Fig. 1b. The SFF's repeating structure results in an average hydraulic pressure distribution. Therefore, the concentration of active species decreases sequentially from inlet to outlet, accompanied by electrochemical reactions. This non-uniformity may become more significant as the flow rate decreases and the current density increases.31,32 To address this issue, it is necessary to increase the hydraulic pressure drop and under-rib convection in the downstream region near the outlet. The human behavior mentioned above inspires us to enhance the electrolyte convection into the porous electrode by adjusting the channel width. As shown in Fig. 1c, the channel width gradually decreases in IGFF, while the flow channels’ number, direction, and arrangement remain unchanged compared to SFF. In such cases, the decrease in reactant concentration in the electrolyte can be kept consistent. The difference between IGFF and SFF can be analyzed and elucidated by comparing hydraulic pressure, fluid velocity, and the electrochemical performance of VRFB.
2.2. The distributions of pressure, velocity and concentration
In this work, a 3D multi-physical simulation model is established to evaluate the battery performance with different flow fields, which involves the coupling mechanisms of fluid mechanics, electricity and mass transfer. Under the premise of achieving grid independence and model validation, as shown in Fig. 2, the 3D model, which may be used to compare SFF with IGFF, is considered reasonably accurate for VRFBs. Specifically, the computed inaccuracy of cell voltages (Ecell) is less than 0.8% when the grid number of the 3D models is set to at least 1 × 10⁴ (Fig. 2a). Additionally, the average discrepancies between the actual Ecell and the simulated ones for a VRFB applied under a current density of 50 mA cm−2 and a specific flow rate of 5 mL min−1 cm−2 are less than 0.9% and 1.4%, respectively (Fig. 2b). The average validated error for discharging is greater than that for charging, mainly due to significant polarization at a low state of charge regions (SOC < 0.3). This might be due to inaccurate estimation of physical parameters, such as diffusion coefficients or reaction rate coefficients, as reported.33 Otherwise, the conducted 3D models compare well with experiments for most operating conditions (medium SOC), which are reliable for comparing SFF and IGFF.
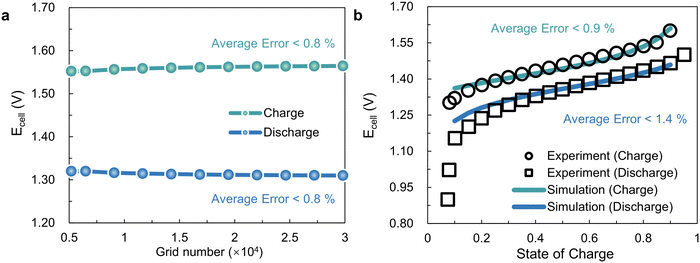 |
| | Fig. 2 The (a) grid independence and (b) validation of the 3D multi-physical simulated models. | |
Utilizing the aforementioned 3D model as a foundational framework, the intricate interplay of multiple physical domains within VRFB is comprehensively addressed. The fluid dynamics of the electrolyte, spanning both the flow field and porous medium, is rigorously formulated and resolved by invoking the venerable Navier–Stokes equation and Darcy's law, respectively (Fig. 3).34 The innovative in-plane gradient configuration profoundly influences the hydraulic pressure distribution within the flow channel, thereby amplifying the pressure gradient near-outlet region. Specifically, in the case of SFF, the hydraulic pressure differential between adjacent flow channels is maintained at a uniform 55 Pa level (Fig. 3a1). Contrasting this, the IGFF exhibits a remarkable alteration, with the pressure differential escalating to 140 Pa between the final adjacent channels while maintaining the 55 Pa disparity between the initial adjacent channels (Fig 3a2). The hydraulic pressure distribution across the flow field inherently governs the fluid velocity profile within the porous electrode (Fig. 3b). The fluid velocity profile demonstrates periodicity and uniformity beneath the ribs of SFF (Fig. 3b1), mirroring the hydraulic pressure distribution. In the context of IGFF, however, a noteworthy evolution becomes evident, as the intensity of under-rib convections gradually increases from the proximal inlet to the adjacent outlet regions (Fig. 3b2). Cross-sectional views (Fig. 3c) offer a lucid visualization of the discernible correlation between hydraulic pressure gradients within the flow channels and the resultant under-rib convection patterns within the porous electrode. The innovative in-plane gradient design, inspired by principles like those observed in natural systems, manifests a tangible enhancement in convective processes, thereby achieving the coveted goal of convective augmentation.
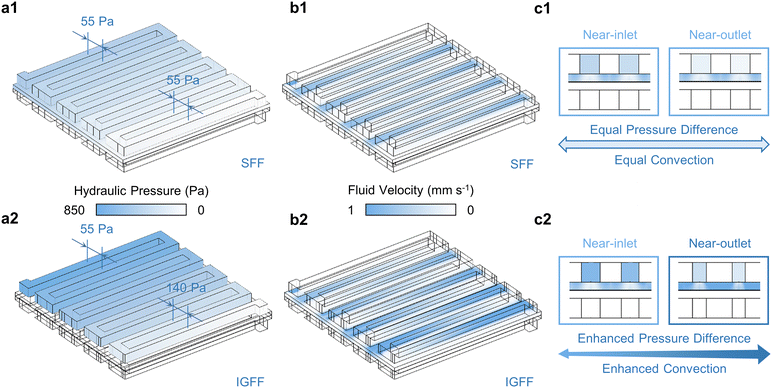 |
| | Fig. 3 The (a) hydraulic pressure within flow channels, (b) fluid velocities within porous electrodes and (c) in the cross-view for SFF and IGFF-based batteries. | |
Fluid velocity exerts a profound influence on the spatial distribution of active species, particularly the under-rib convections (Fig. 4). The operational dynamics of vanadium electrolytes within the battery are characterized by a cyclic inflow and outflow, dynamically responding to alterations in the SOC. These dynamic responses manifest as observable fluctuations in the concentrations of reactants at the inlet and outlet of the flow field (Fig. 4a). As an illustrative example, consider the concentrations of VO2+ (cVO2+, as the reactants at the positive side for the discharge process) at the inlet and outlet are 0.85 M and 0.72 M, respectively. Remarkably, whether adopting SFF (Fig. 4a1) or IGFF (Fig. 4a2), these inflow and outflow concentrations are equivalent. However, the spatial distribution of cVO2+ within the porous electrode presents a striking contrast (Fig. 4b). In SFF-based batteries, cVO2+ exhibits a progressive decline from the inlet to the outlet (Fig. 4b1). This decline corresponds to the gradual consumption of active species driven by electrochemical reactions. In a noteworthy departure, IGFF-based batteries maintain the cVO2+ concentration near-outlet region at the same level as near-inlet (Fig. 4b2). This intriguing phenomenon, substantiated by cross-sectional perspectives (Fig. 4c), underscores the pivotal role played by the innovative in-plane gradient design, inspired by human behavior, in fostering enhanced under-rib convections. The ramifications of these findings on the electrochemical performance of batteries are profound. The achievement of more uniform and elevated concentrations of active ingredients has the potential to significantly enhance battery performance. Notably, the concentration elevation near the outlet region can be attributed to the augmented under-rib convection patterns stemming from the innovative in-plane gradient design—a concept informed by the principles observed in human life.
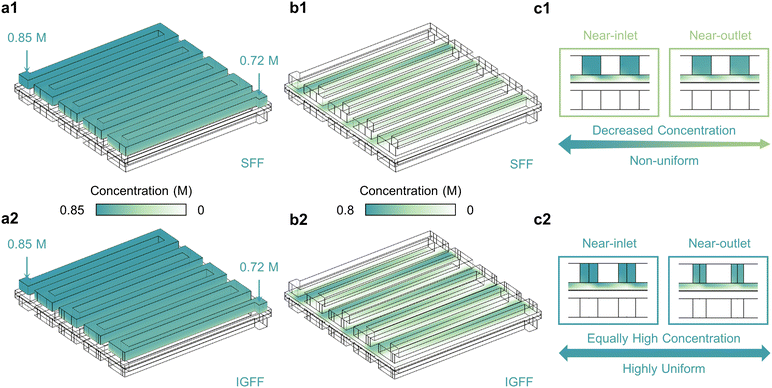 |
| | Fig. 4 The reactant concentrations (a) within flow channels, (b) within porous electrodes and (c) in the cross-view for SFF and IGFF-based batteries. | |
The active species’ concentration within the porous electrode exhibits intricate interplay with cross-surface distance, current density, and electrolyte flow rate (Fig. 5a–c). During the discharge process, V2+ (Fig. 5a1) and VO2+ (Fig 5a2) function as active species for the negative and positive electrodes, respectively. In the context of the through-plane direction, it becomes evident that the average concentration within the porous electrode diminishes as the relative distance from the membrane increases. This behavior can be attributed to the underlying convection patterns beneath the ribs, where fluid velocity tends to be comparatively subdued. In addition, applying higher current densities accelerates the consumption of reactants, resulting in a commensurate reduction in the concentrations of V2+ (cV2+, as the reactants are at the negative side for the discharge process), as demonstrated in Fig. 5b. Augmenting the flow rate of the electrolyte offers a direct avenue to bolster the supply of reactants, consequently elevating cV2+ levels within the porous electrode (Fig. 5c). A comprehensive assessment necessitates the concurrent consideration of both current density and electrolyte flow rate (Fig. 5d and e). For instance, focusing on the negative electrode during discharge, two key metrics, namely the average concentration of V2+ (cV2+average) and the uniformity factor of cV2+ distribution (UFcV2+), serve as quantitative benchmarks for discerning between SFF and IGFF. With increasing current density, both cV2+average and UFcV2+ exhibit a diminishing trend, but the performance differential between SFF and IGFF steadily amplifies. Notably, the cV2+average consistently registers at lower levels for SFF compared to IGFF; however, this discrepancy dwindles as the electrolyte flow rate is heightened (Fig. 5d). Analogously, UFcV2+ follows a parallel trajectory of variation (Fig. 5e). These findings collectively signify that at elevated current densities and reduced flow rates, IGFF exerts a more pronounced positive influence on performance when compared to SFF, underscoring the intricate dynamics of these multi-factorial interactions.
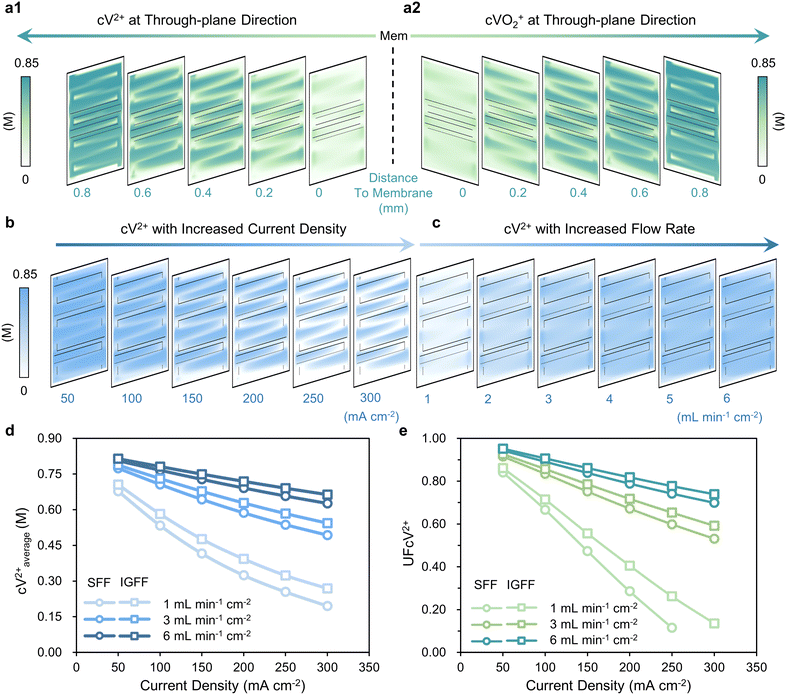 |
| | Fig. 5 The distributions of (a1) cV2+ for the negative side and (a2) cVO2+ for the positive side at different distances to the membrane, with (b) increased current densities and (c) flow rates. The (d) cV2+average and (e) corresponding UFcV2+ for SFF and IGFF with different operating conditions. | |
2.3. The performance comparison between SFF and IGFF
The in-plane gradient design, in addition to fostering under-rib convections and uniform distributions, bestows a remarkable enhancement in the electrochemical performance of VRFB. Evident within the polarization curves presented in Fig. 6, these curves faithfully depict the correlation between Ecell and the current densities, effectively encapsulating the polarization characteristics intrinsic to the battery. In VRFB, subjecting the system to current densities equal to or surpassing 150 mA cm−2 precipitates a discernible upswing in concentration overpotential, thereby inducing a steep decline in Ecell. To illustrate, when scrutinizing a scenario wherein the electrolyte flow rate stands at 1 mL min−1 cm−2 and the current density is maintained at 300 mA cm−2 (Fig. 6a), the Ecell for SFF-based VRFB hovers at approximately 1.00 V. This outcome concurs with the previously expounded disparities in mass transfer associated with SFF. By stark contrast, under analogous conditions, the Ecell of IGFF-based VRFB escalates to 1.13 V (Fig. 6b), constituting a noteworthy increment of approximately 13% relative to SFF-based VRFB. This higher discharge voltage coupled with diminished polarization collectively translates into an augmented power density. The maximum power densities (Wmax) of IGFF-based batteries are 341.0, 429.8 and 553.2 mW cm−2, respectively, across a spectrum of electrolyte flow rates comprising 1, 3 and 6 mL min−1 cm−2. Notably, these values substantially outstrip their SFF-based counterparts, which record power densities of 300.7, 374.4 and 478.7 mW cm−2, conclusively underscoring the discernible advantages conferred by IGFF in terms of electrochemical performance and power output across various operational conditions.
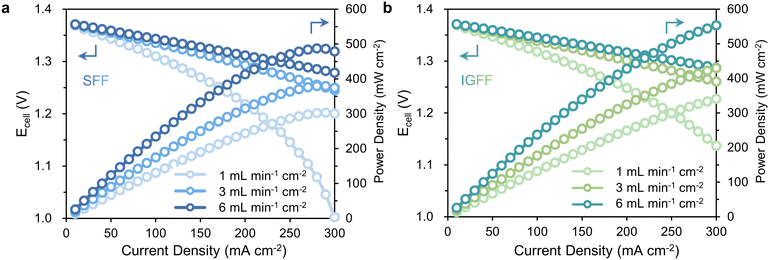 |
| | Fig. 6 The polarization curves of (a) SFF-based VRFBs and (b) IGFF-based VRFBs. | |
The observed enhancements in Wmax exhibit a discernible correlation with distinct operational conditions. Notably, under relatively low flow rates, IGFF exhibits a significantly more substantial performance improvement compared to SFF (Fig. 7a). This trend also manifests in the relationship between alterations in voltage efficiency (VE) and flow rate (Fig. 7b), an aspect we have previously elucidated in our previous report.21 Herein, the concept of the critical flow rate assumes paramount importance. This critical flow rate is rigorously defined as the specific operational condition at which the incremental gain in VE fails to exceed 1% per mL min−1 cm−2. It is imperative to recognize that VE exhibits a noteworthy improvement below the critical flow rate, marking these domains as “sensitive regions”. In stark contrast, higher flow rate regimes are designated as “insensitive regions”, where the amelioration in VE becomes constrained. Astonishingly, the critical flow rate for IGFF-based VRFBs registers at 3.0 mL min−1 cm−2, a value notably lower than the corresponding 3.5 mL min−1 cm−2 observed for SFF. It is essential to highlight that the applied electrolyte flow rate must exceed this critical threshold to unlock a high VE. Nonetheless, it is imperative to acknowledge that the electrolyte flow rate is not boundless, its upper limits tethered to the pressure drop between the flow field's inlet and outlet (ΔP). This intricate relationship is vividly illustrated in Fig. 7c, wherein ΔP demonstrates an almost linear ascent in tandem with escalating electrolyte flow rates. Significantly, IGFF exhibits a more pronounced amplitude in ΔP compared to SFF. Furthermore, it is imperative to note that in large-size cells exceeding 100 cm2,27,35–38 the range of ΔP typically spans from 90–380 Pa cm−2 (equating to 1.15–4.92 kPa in this work). This range is primarily delimited by considerations encompassing pipeline design, sealing methodologies, and the intricate art of system integration. Therefore, the prospect of a lower critical flow rate is undeniably gratifying, as it imparts a heightened degree of operational flexibility, ensuring that VRFBs can be judiciously maintained within reasonable and manageable parameters.
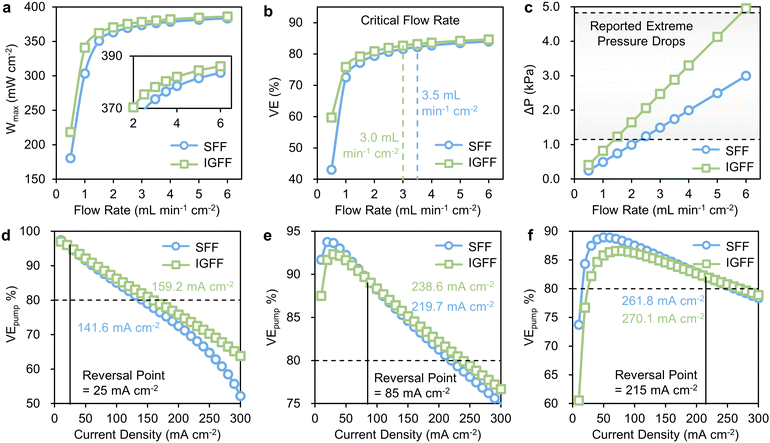 |
| | Fig. 7 The relationships of (a) Wmax, (b) VE and (c) ΔP with flow rates for SFF and IGFF-based VRFBs. The relationships of VEpump with current densities for SFF and IGFF-based VRFBs under flow rates at (d) 1, (e) 3 and (f) 6 mL min−1 cm−2. | |
The holistic evaluation of pump-based voltage efficiency (VEpump), thoughtfully amalgamating VE and ΔP into a singular metric, furnishes a lucid basis for direct comparisons (Fig. 7d–f). Given the intricate interplay between VEpump and current density, we introduce two pivotal parameters that merit in-depth discussion: the “reversal point” and the “rated current density”. The concept of the “reversal point” serves to delineate a threshold of current density. Conventional designs hold sway below this inflection point, while novel designs predominate above it. Concomitantly, the “rated current density” denotes the maximum permissible current density at which VEpump steadfastly maintains a lofty threshold of 80% or greater. For illustrative purposes, it is considered the scenario of a modest flow rate of 1 mL min−1 cm−2. Here, the “reversal point” stands at 25 mA cm−2, signifying that IGFF-based VRFBs exhibit superior VEpump values relative to their SFF counterparts when subjected to current densities surpassing this threshold (Fig. 7d). Notably, the rated current densities for SFF-based and IGFF-based VRFBs stand at 141.6 mA cm−2 and 159.2 mA cm−2, respectively. As the transition to a moderate electrolyte flow rate of 3 mL min−1 cm−2 (Fig. 7e), both the reversal point and rated current density exhibit upward mobility. Specifically, the VEpump of IGFF-based VRBF eclipses that of SFF-based VRFBs under the current densities exceeding 85 mA cm−2. Most notably, the rated current density for IGFF-based VRFBs soars to an impressive 238.6 mA cm−2, constituting an 8.6% augmentation relative to the SFF configuration's 219.7 mA cm−2. With the ascent to a higher electrolyte flow rate of 6 mL min−1 cm−2, the expanse between the reversal point (215 mA cm−2) and the rated current density (270.1 mA cm−2) for IGFF diminishes. This conveys that permissible current densities converge within a narrow window of approximately 55 mA cm−2 to ensure the sustenance of high VEpump values, as shown in Fig. 7f. While an increased electrolyte flow rate intuitively augments mass transfer, it simultaneously introduces multifaceted challenges encompassing sealing, pressure differentials, and intricate operational considerations. Nonetheless, the rate current density is still 8.3 mA cm−2 higher than that of SFF. These findings cogently underscore both the efficacy and indispensability of the innovative in-plane gradient design.
2.4. Basic approaches for flow field optimization evaluation
The in-plane gradient flow field design presented herein stands as a testament to remarkable advancements in enhancing the electrochemical performance of VRFBs. Moreover, this study introduces a novel lexicon of concepts, including “critical flow rate”, “reversal point”, and “rated current density” which collectively furnish a comprehensive framework for the multifaceted evaluation of various contributing factors. Notably, the augmentation of under-rib convections, as realized through IGFF, represents a universal panacea applicable not only to the present study but also to previous investigations in flow field optimization.38–40 The intricate mechanism underpinning performance enhancement via flow field design warrants concise elucidation and synthesis. Consequently, we proffer a generalized evaluation criterion distilled from the tenets of enhanced convection-based optimization, thereby encapsulating the quintessence of flow field refinement (Fig. 8a). This holistic framework encompasses several sequential steps, promulgating a structured approach to propel advancements in flow field optimization:
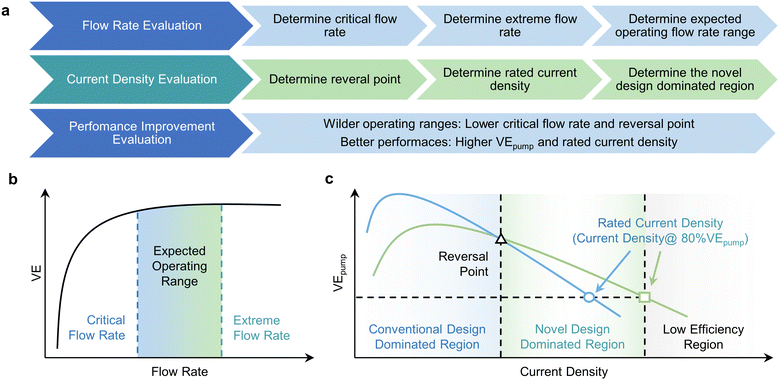 |
| | Fig. 8 (a) The basic approaches for evaluation. (b) The overall trend of VE and the determination of operating flow rates. (c) The overall trend of VEpump and the determination of operating current densities. | |
(1) Flow rate evaluation.
Elucidates the intricate interplay between VE and flow rate, thereby establishing the lower threshold of the insensitivity region, denoted as the “critical flow rate”. Subsequently, gauge “extreme flow rate”, contingent on the upper limit of pressure drops, a factor crucial for delineating pipeline design, the integrity of sealing mechanisms, and seamless system integration. The imperative lies in minimizing this “critical flow rate” to ensure a sufficiently expansive operational range for VRFBs (Fig. 8b).
(2) Current density evaluation.
Thoroughly elucidate the intricate relationship between VEpump and current density, leading to the identification of critical parameters such as the “reversal point” and the “rated current density” (defined as the maximum current density where VEpump exceeds 80%) for both conventional and novel designs. Notably, the reversal point should invariably fall below the rated current density. These analyses delineate three distinct regions based on the parameters as mentioned above (Fig. 8c). The first region, characterized by current densities below the reversal point, represents the realm of conventional designs where power output remains relatively modest. The intermediate region, spanning between the reversal point and the rated current density, is governed by novel design principles, featuring superior VEpump values. It's crucial to note that higher current density regions within regions of lower efficiency are inherently unsuitable for practical applications.
(3) Performance improvement evaluation.
The quantitative assessment of electrochemical performance enhancement within the defined parameter range is pivotal. This evaluation hinges on a comprehensive understanding of flow rates and current densities. Notably, pursuing higher VEpump values and elevated rated current densities is both a desirable and anticipated outcome.
3. Conclusions
In this work, a novel design, the so-called in-plane gradient flow field, is proposed for VRFBs. The enhanced under-rib convection in the low-concentration region results in a more uniform distribution of the active species within the porous electrode. Compared with the conventional SFF, the adoption of the newly designed flow field can significantly improve the battery performance. Based on a 3D multi-physical simulated model, introducing an IGFF can improve the average reactant's concentration and distribution uniformity, as well as the VEpump of the battery. The adoption of the proposed IGFF reaches an insensitive area of VE under a flow rate of over 3 mL min−1 cm−2, and the VEpump surpasses conventional SFF at a current density of over 85 mA cm−2. The Wmax and maximum rated current density of IGFF-based VRFB are 553.2 mW cm−2 and 270.1 mA cm−2, respectively, which are 74.5 mW cm−2 and 8.3 mA cm−2 higher than SFF-based VRFB. In addition, the basic criteria for evaluating flow field optimization have been clarified. The performance improvement of the flow field by strengthening the convection under the ribs is related to the specific flow rate and current density, and it is necessary to achieve lower critical flow rate and turning points to broaden the application range of the novel design. The obtained results provide compelling evidence that the proposed IGFF is advantageous for the development of high-performance VRFBs. Furthermore, owing to its straightforward, efficient, and easily scalable design inspired by human behavior, the IGFF design holds great potential for application in engineering VRFBs and large-scale energy storage systems.
4. Experimental section
Geometry details
The 3D model consists of two flow fields, two porous electrodes and a membrane with an actual area of 3.6 × 3.6 cm2. The geometric structure of the SFF and IGFF is similar. Both are composed of 1 inlet, 1 outlet, 9 long flow channels and 8 short flow channels. Besides, the depth of the channel is 2 mm. The only difference between the SFF and IGFF is that from the beginning of the first long flow channel near the inlet, the width of each subsequent long flow channel will be decreased by 0.1 mm, the width of the first long flow channel is 2 mm, and the width of the last long channel which is near the outlet is 1.2 mm. The width of every long flow channel of SFF is 2 mm. The two flow fields are analyzed and compared by numerical simulation, described in detail in the methods section.
Physical assumptions
The physical assumptions for the model are as follows:
(1) The electrolyte is regarded as an incompressible fluid, and its flow is considered as laminar flow.
(2) The electrodes are isotropic and uniform.
(3) The whole model is regarded as an isothermal model.
(4) Ignore all side reactions, including hydrogen evolution reactions.
(5) The influence of gravity is not taken into account.
(6) The electrolyte shall be regarded as a dilute solution.
Governing equations
The mass conservation of both the flow channels and porous media is expressed as:| | ρ∇·![[u with combining right harpoon above (vector)]](https://www.rsc.org/images/entities/i_char_0075_20d1.gif) = 0 = 0 | (1) |
where ρ is the density of the electrolyte and ![[u with combining right harpoon above (vector)]](https://www.rsc.org/images/entities/i_char_0075_20d1.gif) is the velocity of the electrolyte.
is the velocity of the electrolyte.
The momentum conservation of electrolytes in flow channels and porous media can be expressed by the Navier–Stokes equation and Brinkman equation, respectively:41
| | ρ(![[u with combining right harpoon above (vector)]](https://www.rsc.org/images/entities/i_char_0075_20d1.gif) ·∇) ·∇)![[u with combining right harpoon above (vector)]](https://www.rsc.org/images/entities/i_char_0075_20d1.gif) = −∇p + ∇·[μ∇ = −∇p + ∇·[μ∇![[u with combining right harpoon above (vector)]](https://www.rsc.org/images/entities/i_char_0075_20d1.gif) + (∇ + (∇![[u with combining right harpoon above (vector)]](https://www.rsc.org/images/entities/i_char_0075_20d1.gif) )T] + )T] + ![[f with combining right harpoon above (vector)]](https://www.rsc.org/images/entities/i_char_0066_20d1.gif) | (2) |
| |  | (3) |
where
ε is the porosity of the porous media,
p is the pressure,
μ is the dynamic viscosity of the electrolyte, and
k is the permeability of the porous media.
βF is the Forchheimer drag coefficient, which is ignored in the simulation. Since gravity is also not taken into account in the model, the volume force acting on the fluid is zero.
The permeability of the porous media is calculated by the Carman–Kozeny equation:42
| |  | (4) |
where
df is the diameter of the fiber and
kck is the Carman–Kozeny constant, which is a dimensionless number that depends on the shape and orientation of the fiber material.
The Nernst–Plank equation describes the transfer process of dilute species in porous media. The equation includes diffusion item, migration item and convection item:43
| |  | (5) |
The conservation of each species can be expressed as:43
| | ∇·![[N with combining right harpoon above (vector)]](https://www.rsc.org/images/entities/i_char_004e_20d1.gif) I = Si I = Si | (6) |
where the subscript
i represents a certain species, and
![[N with combining right harpoon above (vector)]](https://www.rsc.org/images/entities/i_char_004e_20d1.gif) I
I represents the flux of the species,
Si is the source term of the species, and is used to represent the generation rate due to the electrochemical reactions.
ci and
zi represent the concentration and charge of a species
i, respectively.
R is the ideal gas constant,
T is the temperature, and
F is the Faraday's constant.
φi is the potential of a species in the liquid phase.
The effective diffusion coefficient Dieff can be obtained by Bruggeman's modification:44
| |  | (7) |
The charge conservation on the positive and negative sides is solved as the following two equations, respectively:
| | ∇·![[i with combining right harpoon above (vector)]](https://www.rsc.org/images/entities/char_0069_20d1.gif) s = −∇· s = −∇·![[i with combining right harpoon above (vector)]](https://www.rsc.org/images/entities/char_0069_20d1.gif) l = ipos l = ipos | (8) |
| | ∇·![[i with combining right harpoon above (vector)]](https://www.rsc.org/images/entities/char_0069_20d1.gif) s = −∇· s = −∇·![[i with combining right harpoon above (vector)]](https://www.rsc.org/images/entities/char_0069_20d1.gif) l = ineg l = ineg | (9) |
where
![[i with combining right harpoon above (vector)]](https://www.rsc.org/images/entities/char_0069_20d1.gif) s
s and
![[i with combining right harpoon above (vector)]](https://www.rsc.org/images/entities/char_0069_20d1.gif) l
l are the current densities of the solid phase and the liquid phase, respectively, and they can be calculated as:
| | ![[i with combining right harpoon above (vector)]](https://www.rsc.org/images/entities/char_0069_20d1.gif) s = −σseff∇φs s = −σseff∇φs | (10) |
| |  | (11) |
where
σseff is the effective conductivity of the porous electrodes, which can be calculated as:
| |  | (12) |
where
σs is the electronic conductivity of the porous electrodes. The source term
Si is related to the generation rate of the electrochemical reaction, and each source term can be calculated as:
| |  | (13) |
| |  | (14) |
| |  | (15) |
| |  | (16) |
The results can also be obtained using the Butler–Volmer equations:43
| | 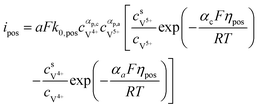 | (17) |
| | 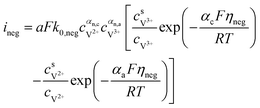 | (18) |
where
k0,pos and
k0,neg are the reaction rate coefficients on the positive and the negative sides, respectively.
αa and
αc is the charge transfer coefficient on the anode and cathode sides, respectively.
The concentrations of vanadium ions at the liquid–solid interfaces can be calculated via bulk concentration and the corresponding parameters. On the positive side, the surface concentrations of V4+ and V5+are derived as:45
| |  | (19) |
| |  | (20) |
where
| |  | (21) |
| |  | (22) |
For the negative side, the surface concentrations of V2+ and V3+are derived as:
| |  | (23) |
| |  | (24) |
where
| |  | (25) |
| |  | (26) |
The mass transfer coefficient in the above equation can be roughly calculated as:46
| | km = 1.6 × 10⁻⁴![[u with combining right harpoon above (vector)]](https://www.rsc.org/images/entities/i_char_0075_20d1.gif) 0.4 0.4 | (27) |
The overpotential on the positive and negative sides can be defined as the following two equations, respectively:47
| | | ηpos = φpos,s − φpos,l − Eeq,pos | (28) |
| | | ηneg = φneg,s − φneg,l − Eeq,neg | (29) |
The equilibrium potential on the positive and negative sides can be calculated by the Nernst equation, respectively:45
| |  | (30) |
| |  | (31) |
where
E0pos and
E0neg are the equilibrium potentials under the standard conditions, then the expressions of the battery's discharging voltage and charging voltage can be calculated as the following two equations, respectively:
| | | Ecell,discharge = Eeq,pos − Eeq,neg − ηneg + ηpos − IRcell | (32) |
| | | Ecell,charge = Eeq,pos − Eeq,neg − ηpos + ηneg + IRcell | (33) |
where
I is the current density and
Rcell is the cell electrical resistance.
Post processes
Average reactant concentrations, uniformity factor, pressure drop, VE and VEpump are key indexes commonly used to evaluate the quality of a flow field design.
The VE of the battery can be calculated as follows:48,49
| |  | (34) |
where
Ecell,charge and
Ecell,discharge are the cell voltages during the charge and discharge processes, respectively.
In addition, the pressure drop refers to the difference between the inlet and outlet pressure. The pumping loss per active area is usually expressed by:
| |  | (35) |
where
η represents the pump's efficiency, which equals 0.6, and
q represents the flow rate per active area.
Considering the influence of pumping loss, the VEpump of the battery can be calculated as the following:48,49
| |  | (36) |
The cell voltages are calculated under an SOC of 50% and initial vanadium concentration of 1.7 M.
The average reactant concentration is calculated at the negative electrodes with the concentration of V2+ ions, which can be defined as:
| |  | (37) |
The uniformity factor is used to evaluate the distribution of current density and reactant concentration under a flow field design. For example, the uniformity factor of the V2+ ion concentration is defined as:23,50
| |  | (38) |
where
V is the volume of the electrode, cV
2+ is the concentration of the V
2+ ions, and cV
2+average is the average concentration of the V
2+ ions.
Author contributions
Lyuming Pan: conceptualization, methodology, simulations, writing – original draft. Jianyu Xie: methodology, simulations, data processes. Jincong Guo: conceptualization, methodology, writing – original draft. Dongbo Wei: simulations, data processes. Honghao Qi: methodology, writing – original draft. Haoyao Rao: methodology, data processes. Puiki Leung: writing – original draft, writing – review & editing. Lin Zeng: writing – original draft, writing – review & editing. Tianshou Zhao: resources, project administration, funding acquisition, supervision. Lei Wei: conceptualization, funding acquisition, project administration, writing – review & editing.
Conflicts of interest
The authors declare no conflict of interest.
Acknowledgements
This work was supported by the National Key R&D Program of China (No. 2022YFB2404902), the National Natural Science Foundation of China (No. 52206089) and Shenzhen Key Laboratory of Advanced Energy Storage (No. ZDSYS20220401141000001). The computation in this work is supported by the Center for Computational Science and Engineering at Southern University of Science and Technology.
References
- L. Zhang and G. Yu, Angew. Chem., Int. Ed., 2021, 60, 15028–15035 CrossRef CAS PubMed.
- J. Che, F. Wang, C. Song, R. Wang and Y. Li, Chem. Eng. J., 2023, 463, 142435 CrossRef CAS.
- E. Sánchez-Díez, E. Ventosa, M. Guarnieri, A. Trovò, C. Flox, R. Marcilla, F. Soavi, P. Mazur, E. Aranzabe and R. Ferret, J. Power Sources, 2021, 481, 228804 CrossRef.
- P. Leung, X. Li, C. Ponce de León, L. Berlouis, C. T. J. Low and F. C. Walsh, RSC Adv., 2012, 2, 10125 RSC.
- G. L. Soloveichik, Chem. Rev., 2015, 115, 11533–11558 CrossRef CAS PubMed.
- X. Ke, J. M. Prahl, J. I. D. Alexander, J. S. Wainright, T. A. Zawodzinski and R. F. Savinell, Chem. Soc. Rev., 2018, 47, 8721–8743 RSC.
- K. Zhang, J. Xiong, C. Yan and A. Tang, Appl. Energy, 2020, 272, 115093 CrossRef CAS.
- K. Zhang, C. Yan and A. Tang, J. Power Sources, 2020, 479, 228816 CrossRef CAS.
- K. M. Lisboa, J. Marschewski, N. Ebejer, P. Ruch, R. M. Cotta, B. Michel and D. Poulikakos, J. Power Sources, 2017, 359, 322–331 CrossRef CAS.
- D. S. Aaron, Q. Liu, Z. Tang, G. M. Grim, A. B. Papandrew, A. Turhan, T. A. Zawodzinski and M. M. Mench, J. Power Sources, 2012, 206, 450–453 CrossRef CAS.
- Q. H. Liu, G. M. Grim, A. B. Papandrew, A. Turhan, T. A. Zawodzinski and M. M. Mench, J. Electrochem. Soc., 2012, 159, A1246–A1252 CrossRef CAS.
- J. Sun, M. Zheng, Z. Yang and Z. Yu, Energy, 2019, 173, 637–646 CrossRef CAS.
- R. M. Darling and M. L. Perry, J. Electrochem. Soc., 2014, 161, A1381–A1387 CrossRef CAS.
- Z. Huang, A. Mu, L. Wu, H. Wang and Y. Zhang, Int. J. Hydrogen Energy, 2021, 46, 31952–31962 CrossRef CAS.
- R. Wang, M. Hao, C. He, Z. Tu, F. Chong and Y. Li, Appl. Catal., B, 2023, 332, 122773 CrossRef CAS.
- R. Wang, C. He, M. Hao, F. Chong, Z. Zhao, X. Wu, Z. Tu, T. Fan and Y. Li, ACS Sustainable Chem. Eng., 2023, 11, 5953–5962 CrossRef CAS.
- X. Zhou, X. Zhang, L. Mo, X. Zhou and Q. Wu, Small, 2020, 16, e1907333 CrossRef PubMed.
- Y. Lv, Z. Pan, X. Zhou, N. Xiong, F. Wang, Y. Li and Q. Wu, Chem. – Asian J., 2022, 17, e202200825 CrossRef CAS PubMed.
- R. Wang, Y. Li and Y.-L. He, J. Mater. Chem. A, 2019, 7, 10962–10970 RSC.
- C. Xu and T. S. Zhao, Electrochem. Commun., 2007, 9, 497–503 CrossRef CAS.
- L. Wei, Z. X. Guo, J. Sun, X. Z. Fan, M. C. Wu, J. B. Xu and T. S. Zhao, Int. J. Heat Mass Transfer, 2021, 179, 121747 CrossRef CAS.
- Z. Guo, J. Sun, X. Fan and T. Zhao, J. Power Sources, 2023, 583, 233540 CrossRef CAS.
- S. B. Wan, H. R. Jiang, Z. X. Guo, C. X. He, X. W. Liang, N. Djilali and T. Zhao, Energy Environ. Sci., 2022, 15, 2874–2888 RSC.
- J. Lee, J. Kim and H. Park, Int. J. Hydrogen Energy, 2019, 44, 29483–29492 CrossRef CAS.
- J. Marschewski, L. Brenner, N. Ebejer, P. Ruch, B. Michel and D. Poulikakos, Energy Environ. Sci., 2017, 10, 780–787 RSC.
- X. Ke, J. I. D. Alexander, J. M. Prahl and R. F. Savinell, J. Power Sources, 2014, 270, 646–657 CrossRef CAS.
- E. Knudsen, P. Albertus, K. T. Cho, A. Z. Weber and A. Kojic, J. Power Sources, 2015, 299, 617–628 CrossRef CAS.
- S. Kumar and S. Jayanti, J. Power Sources, 2017, 360, 548–558 CrossRef CAS.
- M.-Y. Lu, Y.-H. Jiao, X.-Y. Tang, W.-W. Yang, M. Ye and Q. Xu, J. Energy Storage, 2021, 35, 102284 CrossRef.
- J. Sun, M. Zheng, Y. Luo and Z. Yu, J. Power Sources, 2019, 428, 136–145 CrossRef CAS.
- Q. Xu and T. S. Zhao, Prog. Energy Combust. Sci., 2015, 49, 40–58 CrossRef.
- J. Sun, H. R. Jiang, B. W. Zhang, C. Y. H. Chao and T. S. Zhao, Appl. Energy, 2020, 259, 114198 CrossRef CAS.
- X. Wu, R. Wang and Y. Li, Electrochim. Acta, 2022, 433, 141267 CrossRef CAS.
- O. C. Esan, X. Shi, Z. Pan, X. Huo, L. An and T. S. Zhao, Adv. Energy Mater., 2020, 10, 2000758 CrossRef CAS.
- Y. Zeng, F. Li, F. Lu, X. Zhou, Y. Yuan, X. Cao and B. Xiang, Appl. Energy, 2019, 238, 435–441 CrossRef CAS.
- D. Reed, E. Thomsen, B. Li, W. Wang, Z. Nie, B. Koeppel and V. Sprenkle, J. Power Sources, 2016, 306, 24–31 CrossRef CAS.
- S. Kim, E. Thomsen, G. Xia, Z. Nie, J. Bao, K. Recknagle, W. Wang, V. Viswanathan, Q. Luo, X. Wei, A. Crawford, G. Coffey, G. Maupin and V. Sprenkle, J. Power Sources, 2013, 237, 300–309 CrossRef CAS.
- Z. Guo, J. Ren, J. Sun, B. Liu, X. Fan and T. Zhao, J. Power Sources, 2023, 564, 232757 CrossRef CAS.
- L. Pan, J. Sun, H. Qi, M. Han, Q. Dai, J. Xu, S. Yao, Q. Li, L. Wei and T. Zhao, Proc. Natl. Acad. Sci. U. S. A., 2023, 120, e2305572120 CrossRef CAS PubMed.
- L. Pan, J. Sun, H. Qi, M. Han, L. Chen, J. Xu, L. Wei and T. Zhao, J. Power Sources, 2023, 570, 233012 CrossRef CAS.
- J. Sun, H. R. Jiang, B. W. Zhang, C. Y. H. Chao and T. S. Zhao, Appl. Energy, 2020, 259, 11 Search PubMed.
- S. Zhu, R. H. Pelton and K. Collver, Chem. Eng. Sci., 1995, 50, 3557–3572 CrossRef CAS.
-
J. Newman and N. P. Balsara, Electrochemical systems, John Wiley & Sons, 2021 Search PubMed.
- A. A. Shah, M. J. Watt-Smith and F. C. Walsh, Electrochim. Acta, 2008, 53, 8087–8100 CrossRef CAS.
- A. Shah, R. Tangirala, R. Singh, R. G. A. Wills and F. C. Walsh, J. Electrochem. Soc., 2011, 158, A671–A677 CrossRef CAS.
- D. Schmal, J. Vanerkel and P. J. Vanduin, J. Appl. Electrochem., 1986, 16, 422–430 CrossRef CAS.
- D. J. You, H. M. Zhang and J. Chen, Electrochim. Acta, 2009, 54, 6827–6836 CrossRef CAS.
- Y. K. Zeng, F. H. Li, F. Lu, X. L. Zhou, Y. P. Yuan, X. L. Cao and B. Xiang, Appl. Energy, 2019, 238, 435–441 CrossRef CAS.
- Y. K. Zeng, T. S. Zhao, X. L. Zhou, L. Zeng and L. Wei, Appl. Energy, 2016, 182, 204–209 CrossRef CAS.
- Q. Ye, T. S. Zhao and C. Xu, Electrochim. Acta, 2006, 51, 5420–5429 CrossRef CAS.
Footnote |
| † These authors contributed equally. |
|
| This journal is © The Royal Society of Chemistry 2023 |
Click here to see how this site uses Cookies. View our privacy policy here.  Open Access Article
 a,
Jianyu
Xie†
a,
Jincong
Guo†
a,
Dongbo
Wei
a,
Honghao
Qi
a,
Haoyao
Rao
a,
Jianyu
Xie†
a,
Jincong
Guo†
a,
Dongbo
Wei
a,
Honghao
Qi
a,
Haoyao
Rao
 a,
Puiki
Leung
*b,
Lin
Zeng
 *a,
Tianshou
Zhao
*a and
Lei
Wei
 *a
*a


![[u with combining right harpoon above (vector)]](https://www.rsc.org/images/entities/i_char_0075_20d1.gif) = 0
= 0![[u with combining right harpoon above (vector)]](https://www.rsc.org/images/entities/i_char_0075_20d1.gif) is the velocity of the electrolyte.
is the velocity of the electrolyte.
![[u with combining right harpoon above (vector)]](https://www.rsc.org/images/entities/i_char_0075_20d1.gif) ·∇)
·∇)![[u with combining right harpoon above (vector)]](https://www.rsc.org/images/entities/i_char_0075_20d1.gif) = −∇p + ∇·[μ∇
= −∇p + ∇·[μ∇![[u with combining right harpoon above (vector)]](https://www.rsc.org/images/entities/i_char_0075_20d1.gif) + (∇
+ (∇![[u with combining right harpoon above (vector)]](https://www.rsc.org/images/entities/i_char_0075_20d1.gif) )T] +
)T] + ![[f with combining right harpoon above (vector)]](https://www.rsc.org/images/entities/i_char_0066_20d1.gif)


![[N with combining right harpoon above (vector)]](https://www.rsc.org/images/entities/i_char_004e_20d1.gif) I = Si
I = Si![[N with combining right harpoon above (vector)]](https://www.rsc.org/images/entities/i_char_004e_20d1.gif) I represents the flux of the species, Si is the source term of the species, and is used to represent the generation rate due to the electrochemical reactions. ci and zi represent the concentration and charge of a species i, respectively. R is the ideal gas constant, T is the temperature, and F is the Faraday's constant. φi is the potential of a species in the liquid phase.
I represents the flux of the species, Si is the source term of the species, and is used to represent the generation rate due to the electrochemical reactions. ci and zi represent the concentration and charge of a species i, respectively. R is the ideal gas constant, T is the temperature, and F is the Faraday's constant. φi is the potential of a species in the liquid phase.

![[i with combining right harpoon above (vector)]](https://www.rsc.org/images/entities/char_0069_20d1.gif) s = −∇·
s = −∇·![[i with combining right harpoon above (vector)]](https://www.rsc.org/images/entities/char_0069_20d1.gif) l = ipos
l = ipos![[i with combining right harpoon above (vector)]](https://www.rsc.org/images/entities/char_0069_20d1.gif) s = −∇·
s = −∇·![[i with combining right harpoon above (vector)]](https://www.rsc.org/images/entities/char_0069_20d1.gif) l = ineg
l = ineg![[i with combining right harpoon above (vector)]](https://www.rsc.org/images/entities/char_0069_20d1.gif) s and
s and ![[i with combining right harpoon above (vector)]](https://www.rsc.org/images/entities/char_0069_20d1.gif) l are the current densities of the solid phase and the liquid phase, respectively, and they can be calculated as:
l are the current densities of the solid phase and the liquid phase, respectively, and they can be calculated as:![[i with combining right harpoon above (vector)]](https://www.rsc.org/images/entities/char_0069_20d1.gif) s = −σseff∇φs
s = −σseff∇φs


![[u with combining right harpoon above (vector)]](https://www.rsc.org/images/entities/i_char_0075_20d1.gif) 0.4
0.4


