 Open Access Article
Creative Commons Attribution 3.0 Unported Licence
A starch based sustainable bio-hybrid composite for surface assimilation of methylene blue: preparation, characterization, and adsorption study†
Anargha P.
Nambiar
a,
Rahul
Pillai
b,
Mallika
Sanyal
c,
Yugesh
Vadikkeettil
d and
Pranav S.
Shrivastav
 *a
*a
aDepartment of Chemistry, School of Sciences, Gujarat University, Ahmedabad, 380009, Gujarat, India. E-mail: pranav_shrivastav@yahoo.com; pranavs@gujaratuniversity.ac.in; Fax: +91-079-26308545; Tel: +91-079-26300969 Tel: +91-9925471963
bDepartment of Chemistry, CMR Institute of Technology, Bengaluru, 560037, India
cDepartment of Chemistry, St. Xavier's College, Navrangpura, Ahmedabad, 380009, Gujarat, India
dLaser and Plasma Technology Division, Bhabha Atomic Research Centre, Mumbai, 400094, India
First published on 13th April 2023
Abstract
Water pollution is a serious problem as it destroys food sources and contaminates drinking water and thus poses a significant challenge to the development of eco-friendly wastewater treatment methodologies. In the present work, biodegradable and naturally available polymer (starch) and halloysite nanotube (HNT) composite flakes were prepared using a facile route of solution casting to treat polluted water containing methylene blue. X-ray diffraction, scanning electron microscopy, Fourier transform-infrared spectroscopy, thermogravimetry, surface analysis, pore size measurements, and point of zero charge determination were used to study the composite flakes. The optimum conditions for the adsorption of methylene blue onto the composite flakes were achieved using 0.15 g of adsorbent after 30 min of contact time with 99.5% efficiency. No pH modifications were required to complete the adsorption process. The correlation coefficient (R2) values showed that the Langmuir isotherm model and pseudo second order kinetics provided a superior fit for adsorption relative to other tested models. The maximum monolayer adsorption capacity found was 604 mg g−1 for the physisorption uptake of methylene blue dye. Additionally, the impact of temperature was investigated, which showed improved adsorption with increasing temperature. The free energy of adsorption was favorable with a positive enthalpy (58.35 kJ mol−1) and entropy change (0.192 kJ mol−1 K−1). Further, the regeneration studies confirmed the starch–HNT adsorbent to be an excellent system for treating methylene blue containing wastewater with negligible loss of efficiency after six successive sorption–desorption cycles. The starch–HNT duo proposed in this work can serve as a vital and efficient strategy to remove dyes from wastewater compared to reported methodologies.
Environmental significanceDyes present in industrial wastewater are one of the main sources of water pollution which is not only harmful for aquatic life but also mutagenic to humans. In this regard, use of biomaterials that are biodegradable, biocompatible, abundantly available in nature, and inexpensive can substitute petroleum-based plastics, serving as a safe, efficient, and greener alternative to remove dyes from aqueous samples. This article reports on preparation of starch–halloysite nanotube composite flakes for adsorption of methylene blue from aqueous samples. Optimization of experimental parameters, isotherms, kinetics, and thermodynamic parameters was carried out for the adsorption system to understand the mechanism, rate, and nature of the adsorption process. The regeneration studies confirmed negligible loss of efficiency after six successive sorption–desorption cycles. |
1 Introduction
Researchers worldwide have shown tremendous interest in developing bio-based materials in an effort to save endangered ecosystems.1 Due to rapid industrialization, the natural water resources on the planet have started to lose their standard identity. Reports suggest approximately 33% of industrial wastewater is released directly into the hydrosphere without any preliminary treatment.2 More importantly, the presence of organic dyes that are non-biodegradable and carcinogenic in nature poses a grave threat to mankind.3,4 Thus, it becomes imperative to monitor the dyes discharged from the textile industry which contribute up to 15% of dye effluents.2 It is worth mentioning that various prominent techniques such as ion exchange,5 flocculation,6 reverse osmosis,7 co-precipitation,8 ultrafiltration,9 solvent extraction10 and oxidation11–13 have been used to address the problem of waste water treatment. However, the adsorption technique stands out compared to other methodologies mainly due to its simplicity and low operational costs with negligible sludge production.14,15 Several studies conducted on the adsorption of dyes confirm the effectiveness and efficacy of activated charcoal as an adsorbent for wastewater treatment. Nevertheless, their cost and regeneration issues limit their use as adsorbents. Thus, there has been an ongoing quest to develop more efficient materials that are environmentally benign and relatively cost effective. In this regard, biomaterials that are biodegradable, biocompatible, and abundantly available in nature can substitute petroleum-based plastics for development of greener technologies.3,16,17Methylene blue (MB), an extensively used organic dye when released as an industrial effluent, causes vomiting, cyanosis, jaundice, tissue necrosis, nausea and neurological illness in humans.3 To reduce the concentration of MB in aquatic ecosystems or eliminate it, conscious efforts have been made to replace fossil based non-degradable plastics with renewable polymers such as starch, extracted from biomass.17 Being of plant origin, starch is a biodegradable homopolysaccharide polymer that is widely available at low cost and is used as a competent adsorbent in environmental protection.2 It consists of semi-crystalline granules with linear repeating units of amylose and a branched chain of amylopectin. Despite having an adequate number of hydroxy groups in its backbone, its limited porosity and surface area limits its adsorption efficiency. However, the presence of excess hydroxy groups in its structure enables suitable modification either by physical or chemical crosslinking to overcome its shortcomings. This can be achieved through various interactions such as hydrogen bonding, chelate formation and electrostatic interaction to name a few.19–21 A new class of bio-composites is explored extensively with nanoclay reinforcement for processing starch-based hybrid materials.22 In this approach, the individual properties of the starch biomass can be preserved and also improve the physicochemical characteristics of the adsorbent substantially.18 The literature suggests chemical crosslinking is the best way to incorporate a highly versatile nanoclay, such as with halloysite nanotubes (HNTs), which have good dispersion and appropriate interfacial adhesion in the polymer matrix.20,23,24
This clay material has gained increasing attention due to its exceptional physical and chemical properties, adjustable surface chemistry, high thermal stability, cost effectiveness and eco-friendly nature. Hence, HNTs can be viewed as a good reinforcement in polymer matrices.25,26 It is noteworthy that the number of hydroxyl groups present on the HNT surface is less compared to that on minerals such as kaolinite and montmorillonite.24 More importantly, HNTs have started to replace the toxic and expensive carbon nanotubes (CNTs) that have similar physical morphology.27
The literature presents the use of starch and HNT either alone, in combination, or with other materials for various applications. Several types of starch based composite materials have been developed for the removal of MB from aqueous solutions. One such blend of porous starch and HNT was prepared, however, the adsorption capacities for MB were considerably low.21 Despite higher efficiency, the use of toxic organic solvents to prepare a starch and polyacrylamide composite is a limiting factor as it eventually becomes an environmental pollutant.3,28 In contrast, organically modified starch via esterification reaction2 and solution casting protocol has been used to fabricate starch–cetyltrimethylammonium(CTA)-bentonite and starch–CTA-magadiite composites using glycerol as plasticizer,23 however, both the materials exhibited limited adsorption capacity. A nanofiber prepared from the amalgamation of poly(vinyl alcohol) (PVA) and starch using the electrospinning technique showed promising adsorption characteristics for MB.29 Bare HNTs have also been reported for the rapid removal of MB from aqueous solution, however, the efficiency was relatively very low.30 Combining HNT and MnFe2O4 also led to similar results.31 Similarly, other materials such as carboxymethyl sago waste pulp32 and carbon rich HNT17 have been used for the same application. It is also important to mention that starch/HNT mixtures have been used as catalyst,33 to remove anionic and cationic dyes,16 in biomedical application,34–37 as nanocarrier,38 in water retention39 and in removing brilliant blue dye from aqueous samples.40 Besides, a cationic starch/montmorillonite (MMT) nanocomposite has been used as an adsorbent,41 bean starch/MMT has been used for removal of metal ions,42 silica-sand anionized starch for Cu(II) removal19 and magnetic clay starch nanocomposites for adsorbing phosphate ions.43 Recently, we reported a glutaraldehyde-crosslinked PVA/halloysite composite film for adsorption of MB from aqueous medium.44 Various chitosan based adsorbent materials and biosorption technologies have been employed in treating wastewater containing dyes and metals.45–47
Herein, we report the preparation of starch–HNT composite flakes using solution casting methodology for the first time. The prepared material was used to study the adsorption of MB under optimum working conditions. The composite flakes were characterized by X-ray diffraction (XRD), scanning electron microscopy (SEM), Fourier transform infrared spectroscopy (FT-IR), thermogravimetry, and surface analysis. For the adsorption process, the method was extensively optimized to understand the mechanism, rate, and nature of the adsorption process. The study showed high adsorption capacity for MB, essentially due to the presence of HNTs in starch, which had large hollow openings. This composite can efficiently trap MB onto its active sites due to the large surface area of the composite. Moreover, the methodology provides a biodegradable, non-toxic and economically viable path to adsorb MB on the prepared composite flakes.
2 Experimental
2.1 Materials and chemicals
Corn starch used in the composite preparation was procured from Sisco Research Laboratories Pvt. Ltd (Mumbai, India). Nanoclay, halloysite nanotubes (HNTs) and methylene blue (MB, λ = 661 nm) dye were obtained from Sigma Aldrich Pvt. Ltd (St. Louis, MO, USA). Analytical grade acetic acid (99%) purchased from High Purity Laboratory Chemicals Pvt. Ltd (Mumbai, India) was used in the preparation of starch slurry. Hydrochloric acid (HCl) and sodium hydroxide pellets were procured from S. D. Fine Chemicals (Mumbai, India). The Milli-Q water used for experiments was obtained from a Milli-Q water purifier (Millipore, Bangalore, India).2.2 Methodology
For the preparation of the starch/HNT composite, the method employed by Garcia-Padilla and coworkers was followed with some modifications.42 A 4% (w/v) starch sol was prepared by adding a suitable amount of starch in 35 mL, 5% acetic acid under continuous constant stirring for 3 h at 65 °C. Further, different concentrations of HNTs (0.4, 0.8, and 1.0%, w/v) were uniformly dispersed in 15 mL water under mild heating and by stirring for 1 h. This dispersed clay solution was then sonicated for 30 min at room temperature. The HNT suspensions were then gently added into starch sol and the solution was stirred vigorously for 24 h under steady heating for maximum interaction. Post agitation, the dispersion was cast on a Teflon plate and allowed to dry at room temperature to obtain starch/HNT composite flakes. The dried flakes were then collected, stored under ambient conditions, and used for adsorption studies. It is important to mention that trials with 2% (w/v) starch sol yielded brittle flakes and hence were not considered in the present work.2.3 Characterization techniques
The XRD patterns of starch, HNT and starch–HNT composite were recorded on a Benchtop D2 phaser powder diffractometer from Bruker using CuKα radiation and a Ni filter with a scanning rate (2θ/s) of 0.005 deg s−1 and diffraction angle of 2θ between 5 and 70°. Fourier transform infrared (FT-IR, Bruker, Germany) measurements for the samples were carried out in the frequency range of 4000 cm−1 to 500 cm−1 under transmittance mode. Thermogravimetric analysis for polymer, clay and composites was performed on a WATERS thermogravimetric analyzer (USA) under a nitrogen atmosphere in the temperature range of 30–600 °C and a heating rate of 10 °C. A Scanning electron microscope (SEM), MIRA3TESCAN, Australia, operated at 10 kV, was used to analyze the morphology of the samples. These samples were gold coated via sputtering to induce electrical conductivity under an argon environment before analysis. To determine the pore size and specific surface area, the samples were degassed at 90 °C for 12 h under an inert (nitrogen) environment, and then subjected to Brunauer–Emmett–Teller (BET) (Micromeritics, Georgia) testing. The point of zero charge for the samples was evaluated by the pH drift method. All the absorbance values were measured on a Jasco V-630 UV-visible double beam spectrophotometer (Kyoto, Japan).2.4 Adsorption experiment
The surface assimilation of MB on starch–HNT flakes was assessed to authenticate the suitability of the prepared composite as an adsorbent. A 50 mL, 40 ppm aqueous solution of dye was used to establish the optimum operating conditions. The effect of the dosage of the composite in the range 0.05–1.0 g, pH in the range 2.5–10.5 and contact time between the adsorbate and adsorbent (via stirring) was carefully investigated for maximum adsorption efficiency. In this batch process, the sample aliquots were withdrawn at regular time intervals, centrifuged (1000 rpm, 5 min) and the supernatant was used for spectrophotometric analysis at 661 nm.The removal efficiency (%) and adsorption capacities (mg g−1) at equilibrium (Qe) and time t (Qt) were evaluated using the following equations:
 | (1) |
 | (2) |
 | (3) |
2.5 Desorption study
To assess the regeneration capability of the starch–HNT flakes for adsorption–desorption cycles, the MB-loaded adsorbent was soaked in a solution of HCl and ethanol for 10 min, filtered and then rinsed with water to attain a neutral pH. The absorbance of the desorbed solvent containing the adsorbate was measured to assess the desorption efficiency (%). The desorbed samples were dried at 60 °C after each test for further use.3 Results and discussion
3.1 Structural and morphological analysis
The XRD study provided information about the extent of involvement of each component and their crystal degrees pertaining to the hybrid.1Fig. 1 shows the diffraction patterns for starch, starch/HNT flakes and HNT. The diffractogram of corn starch depicts its peaks at 2θ values of 15.03°, 17.52° and 23.05°, respectively.1,48 On the other hand, HNT has strong crystalline peaks at 2θ angles of 11.73°, 20.01°, 24.93°, 26.40°, 35.49°, 38.10° and 62.55°.21,25,34,49,50 Additionally, the peak at 11.73° is typical for the tubular architecture of HNT and corresponds to the (001) plane.48 However, the diffraction pattern for the binary mixture reflects the dominance of HNT, with few weak peaks for starch. This is due to the flakes losing their crystalline structure and experiencing strong crosslinking, possibly by intercalation.1,42,50 The lower intensity of the peaks obtained could be the result of the acidic environment employed while preparing the starch–HNT flakes.1,42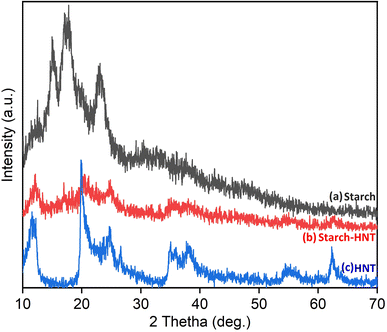 | ||
| Fig. 1 X-ray diffraction patterns of (a) starch, (b) starch–halloysite nanotube flakes and (c) halloysite nanotubes. | ||
Scanning electron microscopy (SEM) helps to understand the morphological changes that take place within the samples as they segue themselves into a hybrid material. Here, the micrograph of native starch exhibits a significant number of round shaped deep openings and grooves on the top surface, as shown in Fig. 2a. These homogeneous, smooth spaces can be classified as pores, which support the porous character of the polymer.21,38 Meanwhile, HNTs have a narrow rod like tubular morphology (Fig. 2b) and when combined with starch to form a composite, the framework redesigns to a less sleeky, dense, and erratic surface.38 This in turn increases the number of pores which is evident from Fig. 2c. The image displays this interaction, where HNTs are seen resting on the starch surface and hence can work exceptionally well as an adsorbent. The MB loaded starch–HNT flakes in Fig. 2d appear to be compact, rough, and flattened, validating successful occupation of dye molecules on the composite surface. In this case, the presence of needle shaped HNTs has almost faded which confirms the involvement of HNT in the dye uptake process.
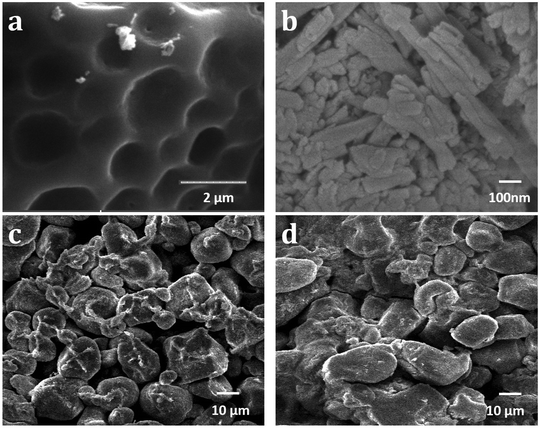 | ||
| Fig. 2 SEM images of (a) starch, (b) halloysite nanotubes, (c) starch–halloysite nanotube composite flakes and (d) methylene blue adsorbed starch–halloysite nanotube flakes. | ||
3.2 Functional group analysis
FT-IR analysis is a tool that can help to identify changes in the functional groups of the individual components during their composite formation. Moreover, it also manifests the characteristic interactions in the adsorption process.16,38,51 The FT-IR spectra for starch, HNT, starch–HNT flakes, and MB loaded composites are displayed in Fig. 3. A typical absorption band for starch is observed at 3329 cm−1 which corresponds to hydroxyl groups; that at 2934 cm−1 is attributed to the stretching vibration of the C–H and CH2 moieties of the anhydroglucose ring; that at 1649 cm−1 represents the O–H bending vibration of water molecules; that at 1464 cm−1 is assigned to the CH2 bending vibration; the peaks at 1148 cm−1 and 1082 cm−1 relate to the C–O stretching vibrations of the C–OH group. Besides, the peaks found at 993 cm−1, 918 cm−1, and 867 cm−1 are exclusively for the C–O bond of the anhydroglucose ring.44,48,50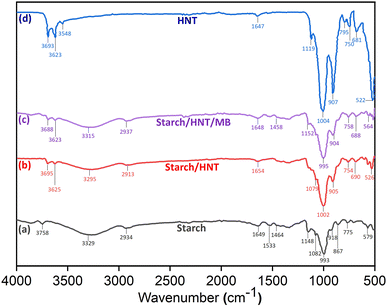 | ||
| Fig. 3 FT-IR spectra of (a) starch, (b) starch–halloysite nanotube composite flakes, (c) methylene blue adsorbed starch–halloysite nanotube flakes and (d) halloysite nanotubes. | ||
For HNT, the frequencies at 3693 and 3623 cm−1 denote the stretching vibrations of the inner hydroxy group connected to Al atoms. The OH stretching and deformation vibrations of water molecules found in the inner layer exhibit peaks at 3548 and 1647 cm−1, respectively. Moreover, the bands at 1119 and 1004 cm−1 indicate the in-plane stretching vibrations of Si–O and apical Si–O–Si groups. In addition, the sharp and intense peak at 907 cm−1 indicates the OH deformation vibration whereas those at 795, 750 and 681 cm−1 are related to Si–O stretching. The Al–OH deformation band is observed at 522 cm−1.38,39,48
The spectrum for composite flakes reveals the presence of distinctive peaks for both starch and HNT along with a modest shift in the frequencies. Here, the absorption peak for starch observed at 3329 cm−1 is slightly shifted to 3295 cm−1, displaying a less broadened peak. Also, the band obtained for the OH group near 3650 cm−1 in the hybrid has lower intensity than the one recorded in raw HNT. Similarly, less intense peaks were observed for the Si–O bond and Al–OH deformation vibrations of HNT where a minor frequency shift was also recorded for flakes. Additionally, reduced intensity was also detected for the C–O vibration. All these observations confirm the possibility of hydrogen bonding between the external OH groups of clay and C–O–C bonds of starch.1,38,39,46 The peaks associated with the MB loaded composite flakes appear to be comparable with their unabsorbed counterpart. But moderate changes such as band broadening are distinguishable in the region between 1000 and 500 cm−1. This indicates the probability of physical interactions such as weak electrostatic contact or van der Waals forces related to the adsorption process.16
3.3 Thermal and textural analysis
Fig. 4 displays the mass loss curves for starch–HNT flakes and their individual components. For corn starch, three step degradation zones were observed, where the first zone near 70 °C with approximately 8% mass loss reflects elimination of water molecules. This stage also influences the starch's gelatinization temperature; therefore, it is considered as a controlling parameter in the preparation of the composite. Hence, clay particles are introduced into the starch matrix during composite preparation to circumvent the formation of starch paste.42,50 The second stage of weight loss observed above 260 °C is ascribed to the decomposition and rupture of molecular chains along with cleavage of the glycosidic bond. The third and final stagnant zone beginning from 330 °C indicates complete decomposition of starch molecules into its residues.50,52 In contrast, HNTs show a very different degradation fashion with only one major decomposition curve near 424 °C mainly due to dehydroxylation that also results in high residual mass.37,38 For composite flakes, there was no significant change in the degradation temperature with the introduction of HNTs in the starch matrix, however, the residual mass increased to 28.6% compared to the native starch (7.9%).38 It is interesting to note that the thermogram of MB adsorbed composite flakes showed a slight delay in the decomposition temperature. These observations are in accordance with some previous findings.37,38 No major change in the degradation temperature after adsorption can be attributed to weak electrostatic or van der Waals forces as evident from the FT-IR data. Table S1† summarizes the degradation temperatures and residual masses for the starch, HNT and composite flakes.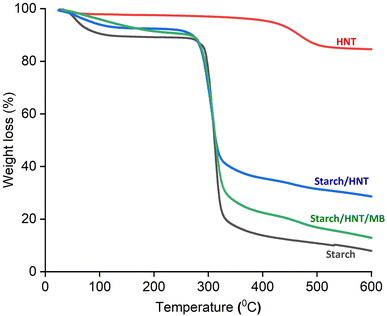 | ||
| Fig. 4 Thermograms of starch, starch–halloysite nanotube composite flakes, methylene blue adsorbed starch–halloysite nanotube flakes and halloysite nanotubes. | ||
The adsorption–desorption isotherm depicted in Fig. 5 was used to determine the textural features like specific surface area, pore diameter and pore volume of the composite flakes.33 The curve initially emerged as a type II isotherm, but eventually, in the end the pattern evolved as type IV. In addition to the curve, the loop formed resembles an H3 hysteresis ring suggesting slit shaped pores for the adsorbent.16,20,53 The surface area, pore volume and pore diameter obtained for the composite flakes were 6.60 m2 g−1, 0.027 cm3 g−1 and 1.65 nm, respectively. It is important to note that the surface area improved for composites compared to neat starch (0.65 m2 g−1) but was low with respect to HNT (54.26 m2 g−1). This is supported by SEM micrographs (Fig. 2a and c) which showed enhanced surface area for the composite from its parent polymer. Also, Fig. 2d validates that the dye molecules were trapped on the surface of the adsorbent, suggesting the flakes are a potential candidate for adsorption. Additionally, the determined pore width of the starch–HNT flakes is classified by the International Union of Pure and Applied Chemistry (IUPAC) as microporous.53
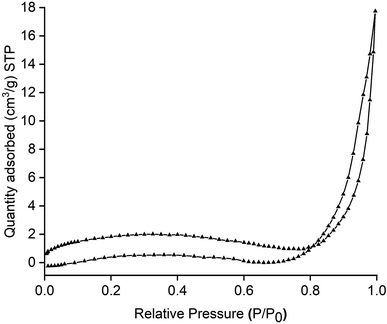 | ||
| Fig. 5 Nitrogen adsorption–desorption isotherm curve of starch–halloysite nanotube composite flakes. | ||
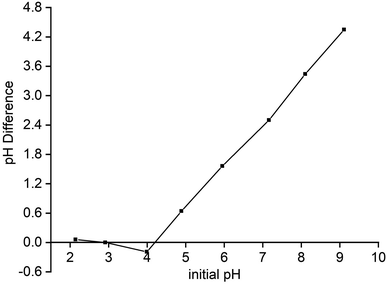
The point of zero charge (PZC) is considered as a qualitative indicator to determine the equilibrium point on the adsorbent surface.16 For this, the pH drift method was employed where 0.1 g composite samples were added to 25 mL, 0.01 M NaCl solution. The pH of the sample solution was adjusted in the range of 2–9; thereafter the solutions were allowed to stir mechanically for 24 h. After the stipulated time, final pH was measured on the digital pH meter to plot a graph of initial pH versus ΔpH, where the intersecting point is the PZC (pHPZC) value of the composite.16 The pHPZC for starch–HNT flakes from Fig. 6 was found to be 4.1. This suggests that at pH below 4.1 (pH < pHPZC), the composite flakes have positive charge whereas above 4.1 (pH > pHPZC) the flakes behave as negatively charged species, while at pH 4.1, the adsorbent has a neutral surface. Hence, based on the ionic charge of foreign species, the adsorbent can alter the charge on its surface and trap the adsorbates. In the present study, cationic MB molecules can effectively bind with the adsorbent's surface above pHPZ. This is further in line with the SEM results in Fig. 2d, which reveal successful adsorption of MB on composite flakes suggesting negative charge on the adsorbent surface.
3.4 Effect of adsorption parameters
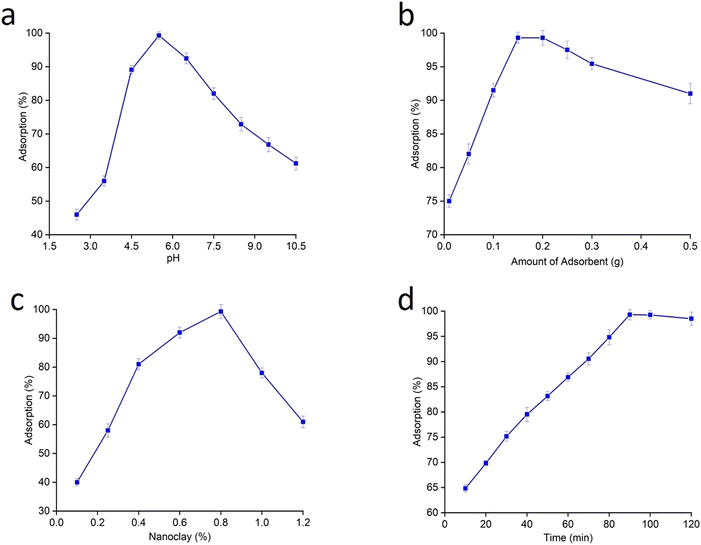
Fig. 7a–d show various adsorption parameters evaluated to achieve an efficient adsorption system. Amongst them, pH is the most vital variable directly associated with the functional groups present on the surface of adsorbent, which influences the dye removal process.17 In this experiment, the pH of the sample solution was altered from 2.5 to 10.5 to determine the maximum uptake of 40 ppm MB on the adsorbent surface. The adsorption efficiency was found to increase as the pH of the solution increased from acidic to alkaline medium (Fig. 7a). This implies electrostatic interaction of dye molecules with starch–HNT flakes. At lower pH there is electrostatic repulsion between the protonated adsorbent and cationic MB molecules, hence limiting the adsorption of dye on the active sites. However, the PZC value of 4.1 suggests negative charge on the adsorbent surface above this point, which favors the adsorption process. This is also understood from the graph of adsorption (%) versus pH, where the maximum uptake was recorded at pH 5.5. Here, the deprotonated hydroxyl groups on the composite flakes electrostatically attract the protonated dimethyl amine moiety of MB. Although, the negative charge on the adsorbent favors adsorption, beyond pH 5.5 there was a gradual decrease in the adsorption. This can be attributed to the unfavorable environment created with the increase in hydroxyl groups on the adsorbent surface, thus repelling the electron cloud of MB.29 Hence, pH 5.5 was set as optimum pH for the adsorption process. Interestingly, the adsorbent flakes have a pH close to 5.5 without any prior adjustment and thus can be used directly for experimental studies. A similar trend in pH has been observed previously for similar composites.4,16,17,19,29,42,54Another important factor that affects adsorption is the adsorbent dosage. This was studied by varying the composite amounts from 0.05 to 0.5 g in the solution containing MB (Fig. 7b). The maximum removal efficiency of 99.5% was attained with 0.15 g of composite flakes. However, when the amount was increased the process was reversed which shows aggregation of adsorbent molecules. This caused repulsion amongst the adsorbent molecules and may have clogged the active pores. As a result, the dye molecules were unable to engage with all the accessible sites.16,43,55 Such a behavior has been reported by Atnafu et al.43 wherein plasticized magnetic starch based Fe3O4 clay nanocomposites were used to remove phosphate ions. Esvandi and co-workers studied the adsorption behavior of clay/starch/MnFe2O4 magnetic composites for removal of sunset yellow and Nile blue dye from aqueous media.16 They observed a decrease in efficiency with increasing amounts of adsorbent. Apart from dosage, the concentration of HNT in the polymer matrix plays a dominant role in adsorption efficiency. This was tested by employing 0.4, 0.8 and 1% HNT loaded starch flakes in the above-mentioned adsorption system. From the plot of % adsorption versus HNT concentration (Fig. 7c) it was evident that the maximum uptake of MB was possible with 0.8% HNT in the composite flakes.
The impact of contact time on removal efficiency is shown in Fig. 7d. Interestingly, the adsorption rate for the adsorbate witnessed a steep rise at their initial point of contact with the adsorbent. This is obvious from the plot wherein approximately 60% of MB was adsorbed in the first 10 min and this response can be credited entirely to the empty sites on the adsorbent surface. However, the rate of uptake gradually decreased due to limited active sites and possible repulsion between the unadsorbed dye molecules, which may have led to the slow adsorption rate. Furthermore, the highest adsorption was accomplished with 30 min of contact time, which was adequate to attain the equilibrium state and yielded an efficiency of 99.5% for MB. For contact period higher than the optimum time, there was desorption of attached molecules from the surface. This observation is due to the contribution of electrostatic repulsion between the dye molecules and adsorbent surface as well as saturated adsorbent sites.4,16,55 The obtained results are in accordance with the work of Esvandi et al.16 for adsorption of dye molecules on clay/magnetic starch adsorbent.
3.5 Adsorption isotherm
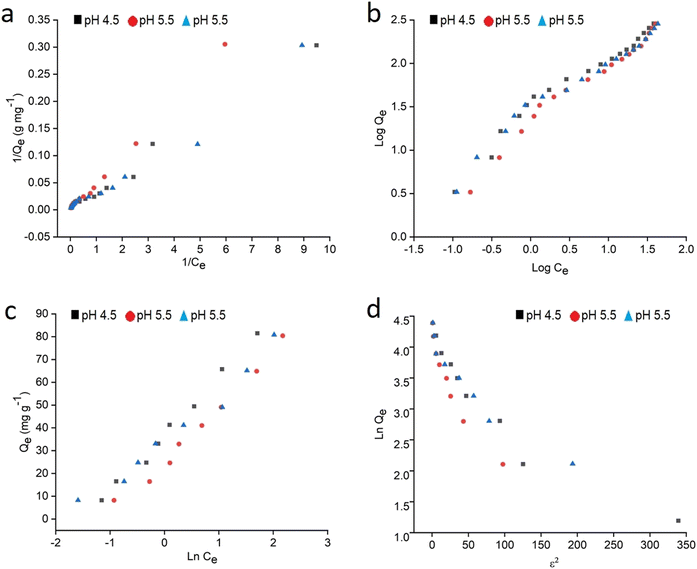
It is imperative to predict the adsorption isotherm which reflects the probable interaction in the sorption process.16,19,55 Apart from the qualitative information on mechanism, it also estimates the adsorption capacities of the adsorbent using empirical mathematical correlations as shown in Table 1. This study involves the use of equilibrium data to evaluate four different isotherm models, namely Langmuir, Freundlich, Tempkin and Dubinin–Radushkevich (D–R). The table includes the linear empirical correlations and their respective graphical plots to calculate the variables pertaining to isotherm models. Also, these data reveal the best fitting for the adsorption system based on the correlation coefficient values. Herein, the measurements were carried out at three different pH: 4.5, 5.5 and 6.5, for all four isotherm models at room temperature. Besides, their results are graphically presented in Fig. 8a–d and the fitting results are summarized in Table 2. Based on the results obtained, the Langmuir hypothesis suits best under all pH conditions to describe the adsorption of MB on starch–HNT composite flakes amongst other models. The Langmuir isotherm assumes a homogeneous monolayer surface for the adsorbent and also proves to be effective in the present system.16 Additionally, the active sites for adsorption possess uniform energy which suggests involvement of electrostatic interactions between the cationic dye and negatively charged adsorbent.19 The term b (L mg−1, Langmuir adsorption constant) is low suggesting weak complexation between adsorbate and adsorbent.29,43 The Langmuir isotherm curve is displayed in Fig. 8a. The maximum adsorption capacity Qm (mg g−1) at pH 5.5 was 604 mg g−1, while at pH 4.5 and 6.5 it was 470 mg g−1 and 534 mg g−1, respectively. This agrees with the data obtained for pH optimization, where successful adsorption was found at pH 5.5. The separation factor RL was between 0 and 1 indicating favorable adsorption.55 Moreover, the high correlation coefficient value (R2 = 0.9962) favors this hypothesis.| pH | Langmuir | Freundlich | Tempkin | Dubinin–Radushkevich | ||||||||||
|---|---|---|---|---|---|---|---|---|---|---|---|---|---|---|
| b (L mg−1) | Q m (mg g−1) | R L | R 2 | 1/n | K F | R 2 | b T (J mol−1) | K T (L mg−1) | R 2 | b DR × 10−7 | Q s (mg g−1) | E (kJ mol−1) | R 2 | |
| 4.5 | 0.085 ± 0.0014 | 370 ± 5.9 | 0.54–0.01 | 0.9895 ± 0.015 | 0.659 ± 0.010 | 25.6 ± 0.4 | 0.9599 ± 0.015 | 96 ± 1.5 | 4.19 ± 0.06 | 0.9821 ± 0.015 | 0.81 ± 0.01 | 40.5 ± 0.65 | 2.50 ± 0.04 | 0.8987 ± 0.014 |
| 5.5 | 0.044 ± 0.0009 | 455 ± 9.5 | 0.70–0.01 | 0.9962 ± 0.020 | 0.708 ± 0.013 | 18.6 ± 0.3 | 0.9729 ± 0.020 | 104 ± 2.2 | 2.93 ± 0.06 | 0.9870 ± 0.020 | 2.05 ± 0.04 | 51.2 ± 0.11 | 1.56 ± 0.03 | 0.9283 ± 0.019 |
| 6.5 | 0.080 ± 0.0015 | 400 ± 7.6 | 0.55–0.02 | 0.9769 ± 0.018 | 0.630 ± 0.012 | 24.3 ± 0.5 | 0.9670 ± 0.018 | 125 ± 2.4 | 5.87 ± 0.11 | 0.9706 ± 0.018 | 1.10 ± 0.02 | 55.3 ± 1.05 | 2.13 ± 0.04 | 0.8951 ± 0.017 |
| MB conc. (mg L−1) | Pseudo first order | Pseudo second order | Elovich | ||||||||
|---|---|---|---|---|---|---|---|---|---|---|---|
| K 1 (min−1) | Q e (cal) (mg g−1) | Q e (exp) (mg g−1) | R 2 | K 2 (g mg−1 min−1) | Q e (cal) (mg g−1) | Q e (exp) (mg g−1) | R 2 | α (mg g−1 min −1) | β (g mg−1) | R 2 | |
| 25 | 0.1020 ± 0.0014 | 47.1 ± 0.66 | 8.2 ± 0.11 | 0.8689 ± 0.0122 | 0.006 ± 0.00008 | 9.4 ± 0.13 | 8.2 ± 0.11 | 0.9920 ± 0.0139 | 1.8 ± 0.03 | 0.568 ± 0.007 | 0.9340 ± 0.0130 |
| 50 | 0.0714 ± 0.0015 | 15.1 ± 0.31 | 16.4 ± 0.34 | 0.8135 ± 0.0170 | 0.004 ± 0.00008 | 18.4 ± 0.38 | 16.4 ± 0.34 | 0.9922 ± 0.0138 | 4.1 ± 0.08 | 0.283 ± 0.006 | 0.8893 ± 0.0186 |
| 75 | 0.0953 ± 0.0024 | 9.9 ± 0.26 | 24.6 ± 0.64 | 0.9116 ± 0.0237 | 0.01 ± 0.00026 | 25.1 ± 0.65 | 24.6 ± 0.64 | 0.9995 ± 0.0259 | 2619 ± 68.1 | 0.466 ± 0.012 | 0.7491 ± 0.0195 |
Further, the heterogeneity factor of the Freundlich isotherm suggests that the surface of the adsorbent is homogeneous, supporting the Langmuir hypothesis.40,43 However, the R2 values computed for all three pH conditions were considerably low, which rules out its suitability for the adsorption process. The Tempkin isotherm disregards high- and low-end concentration poles and shows a linear decline in the heat of adsorption for all adsorbate molecules instead of a logarithmical profile. The equilibrium binding constant KT (L mg−1) was found to be low compared to binding energy bT predicting strong interaction of MB with starch–HNT flakes.16 The D–R isotherm model on the other hand contributes with energy values involved. However, the typical energy values obtained from the D–R equation cannot be employed to show the type of adsorption mode as the enthalpy and free energy are very small.56,57Table 2 shows the energy values at all three pH, which suggests the phenomena of physisorption.17 However, both Tempkin and D–R models had low correlation coefficient values and are inadequate to describe the sorption phenomena, as evident from Fig. 8c and d.
3.6 Adsorption kinetics
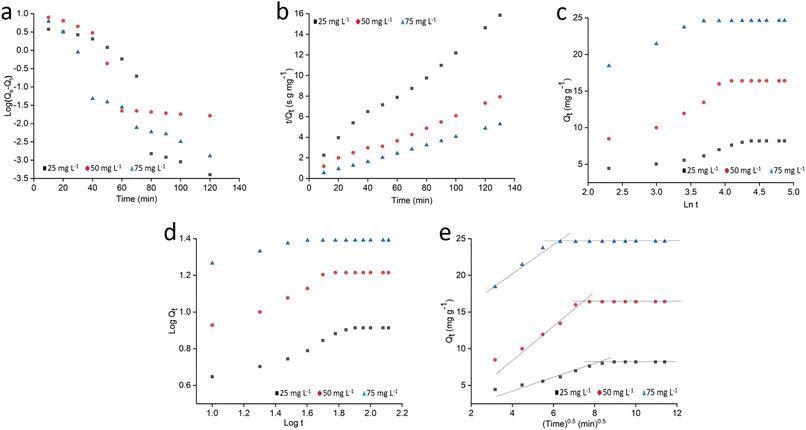
The entire sorption process is governed by kinetics, which not only influences the rate of removal but is also capable of directing the pathway followed in the adsorption process.16 Five fitting generalizations: pseudo 1st order (PFO), pseudo 2nd order (PSO), Elovich, Bangham and intraparticle diffusion models were studied. The results for these kinetic models performed at 25 ppm, 50 ppm and 75 ppm concentration of MB were computed from the linear mathematical equations and their respective graphical representations are shown in Table 1 and Fig. 9a–e, respectively. The results for relevant parameters listed in Table 3 revealed that the PSO model appropriately expresses the kinetic behavior of the system. In this regard, the correlation coefficient values were close to unity for this model compared to other models for all three concentrations. Besides, the calculated adsorption capacity values were close to the experimental capacities, which further confirms the suitability of the PSO model. Apparently, the suggested hypothesis refers to the mass transfer mechanism for adsorbates into the interior and exterior layers of the adsorbent whereas in PFO, the concentration gradient brings about the adsorption.58,59 Also, low R2 values and differences in experimental and calculated capacities further nullify the probability of PFO theory. The Elovich model suggests a low initial adsorption rate and reversible adsorption as evident from α (mg g−1 min−1) and β (g min−1) values shown in Table 3. This confirms the occurrence of physical interaction between MB and starch–HNT flakes.58,59 In addition, the pore diffusion mechanism of the Bangham model excludes its participation in this application.58 The rate controlling steps and the mechanism of adsorption were further probed with the kinetic intraparticle diffusion model. Fig. 9e clearly demonstrates three transition steps that do not pass through the origin. The initial steep linear region presumes bulk transportation of dye molecules that rapidly diffuse onto the adsorbent surface. The second stage indicates slow diffusion of the molecules which is also referred to as intraparticle diffusion. Lastly, the phase transpires to a constant adsorptive equilibrium point, where the capacities for all three concentrations of dyes were low, signifying absence of active sites.3,16,17 All the above conjectures are validated from the Ki (mg g−1 min−0.5) values summarized in Table 3. These results confirm that the entire adsorption is not controlled by the intraparticle diffusion mechanism alone, instead, this modeling is one individual step amongst many others.3,16,17| MB conc. (mg L−1) | Bangham | Intraparticle diffusion | |||||||
|---|---|---|---|---|---|---|---|---|---|
| K b × 104 | s | R 2 | k id (1) (mg g−1 min−0.5) | C i (1) (mg g−1) | R 2 | k id (2) (mg g−1 min−0.5) | C i (2) (mg g−1) | R 2 | |
| a MB: methylene blue. | |||||||||
| 25 | 0.0002 ± 0.00003 | 0.27 ± 0.004 | 0.9435 ± 0.0252 | 0.630 ± 0.0132 | 2.2 ± 0.031 | 0.9638 ± 0.013 | 0.0006 ± 0.0001 | 8.2 ± 0.11 | 0.9935 ± 0.0139 |
| 50 | 0.0239 ± 0.0005 | 0.28 ± 0.006 | 0.8897 ± 0.0186 | 1.869 ± 0.0392 | 2.1 ± 0.044 | 0.9634 ± 0.020 | 0.0022 ± 0.00005 | 16.4 ± 0.34 | 0.9908 ± 0.0208 |
| 75 | 18.527 ± 0.030 | 0.12 ± 0.003 | 0.7369 ± 0.0191 | 1.647 ± 0.0493 | 13.9 ± 0.361 | 0.9239 ± 0.024 | 0.0025 ± 0.00006 | 24.6 ± 0.63 | 0.9915 ± 0.0257 |
3.7 Thermodynamic studies
Thermodynamic investigations were carried out between 35 and 75 °C (Fig. S1†) and the parameters were computed using the following equations, | (4) |
 | (5) |
![[thin space (1/6-em)]](https://www.rsc.org/images/entities/char_2009.gif) Keversus T−1 plot shows a linear relationship between the temperature and adsorption capacities. Variables such as free energy (ΔG0, kJ mol−1), entropy (ΔS0 (kJ mol−1 K−1)) and enthalpy (ΔH0 (kJ mol−1)) were determined from the slope and intercept values. From Table S2†, it can be known that ΔG0 values varied from −0.816 to −8.495 kJ mol−1, giving more negatives values with increasing temperature. This observation led to the fact that temperature effectively favors adsorption, and the process is spontaneous in nature. Moreover, the free energy values are below 20 kJ mol−1, which validates the physisorption mechanism for adsorption. Likewise, the positive ΔH0 (58.35 kJ mol−1) is an indication of the endothermic process. As the value is less than 84 kJ mol−1 it further supports physisorption between the dye molecules and composite flakes.44 The ΔS0 values demonstrate the uneven increase in disorder on the solid–liquid junction during adsorption. These observations agreed with the outcomes of the adsorption isotherm and kinetics study. Similar findings have been reported for adsorption of foreign materials on different adsorbents.3,4,19
Keversus T−1 plot shows a linear relationship between the temperature and adsorption capacities. Variables such as free energy (ΔG0, kJ mol−1), entropy (ΔS0 (kJ mol−1 K−1)) and enthalpy (ΔH0 (kJ mol−1)) were determined from the slope and intercept values. From Table S2†, it can be known that ΔG0 values varied from −0.816 to −8.495 kJ mol−1, giving more negatives values with increasing temperature. This observation led to the fact that temperature effectively favors adsorption, and the process is spontaneous in nature. Moreover, the free energy values are below 20 kJ mol−1, which validates the physisorption mechanism for adsorption. Likewise, the positive ΔH0 (58.35 kJ mol−1) is an indication of the endothermic process. As the value is less than 84 kJ mol−1 it further supports physisorption between the dye molecules and composite flakes.44 The ΔS0 values demonstrate the uneven increase in disorder on the solid–liquid junction during adsorption. These observations agreed with the outcomes of the adsorption isotherm and kinetics study. Similar findings have been reported for adsorption of foreign materials on different adsorbents.3,4,19
3.8 Regeneration and competitive screening of the adsorbent
The relevance of any adsorption system lies in the reusability of the adsorbent for successive sorption–desorption cycles. This is significant not only for the application with real samples but also from the economic perspective.3,17 In the present work, desorption was achieved with a combination of HCl and ethanol for six successive adsorption–desorption cycles with a minimal change in the efficiency (1.9%). Here, it is worth mentioning that the probable mechanism involved in the desorption of MB can be related to the greater solubility of dye molecules in ethanol which allows them to become detached from the adsorbent surface effectively. On the other hand, the large number of H+ ions generated due to the acidic environment binds with the active sites of the adsorbent, by replacing the adsorbate molecules. This investigation is in agreement with the Elovich kinetic model which showed a high desorption rate for MB molecules. Fig. 10 illustrates the efficiency of the material by comparing the standard dye solution with the adsorbed and desorbed samples.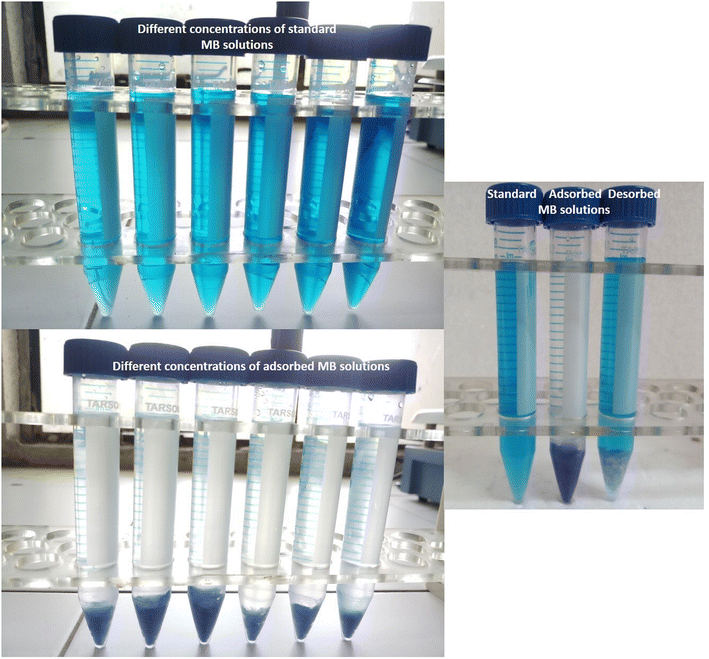 | ||
| Fig. 10 Pictorial representation of adsorbed and desorbed methylene blue samples along with standard solutions of the dye. | ||
Table 4 provides the details about adsorption capacities and other associated variables pertaining to the starch-based hybrid adsorbents that are reported for MB, and some food dyes.2,16,17,19,23,29,30,32,38,40,41,44,61,62 Thus, it is evident that the prepared composite which is natural, biodegradable, and non-toxic yielded good adsorption capacity for MB (604 mg g−1). Moreover, it offers an economical option due to its regeneration capability.
| Sr. no. | Adsorbent | Adsorbate | Isotherm model | Kinetic model | Adsorption capacity Qm (mmol g−1) | Adsorption time | No. of desorption cycles | References |
|---|---|---|---|---|---|---|---|---|
| 1 | Cationic starch/layered clay | Brilliant blue X-BR | Langmuir | Pseudo second order | 0.159 | 40 min | — | 40 |
| 2 | Starch/halloysite nanotubes | Fucoxanthin | 38 | |||||
| 3 | Anionized starch/silica sand | Methylene blue | Langmuir | Pseudo second order | 2.041 | 20 min | — | 19 |
| Crystal violet | 3.054 | |||||||
| 4 | Clay/modified starch | Sunset yellow | Langmuir & Freundlich | Pseudo second order | 0.150 | 60 min | — | 16 |
| Nile blue | 0.203 | |||||||
| 5 | Cationic starch/montmorillonite | Basic blue | Langmuir | — | 0.721 | 120 min | — | 41 |
| Basic yellow | 1.044 | |||||||
| 6 | Halloysite nanotubes | Methylene blue | — | Pseudo second order | 0.264 | 30 min | — | 30 |
| 7 | Modified starch | Methylene blue | — | Pseudo second order | 0.254 | — | — | 2 |
| 8 | Starch | Methylene blue | Langmuir | Pseudo second order | — | — | — | 23 |
| Starch/cetyltrimethyl ammonium-bentonite | 0.783 | |||||||
| Starch/cetyltrimethyl ammonium-magadiite | 0.337 | |||||||
| 9 | Powdered sago | Methylene blue | — | — | 0.444 | — | — | 32 |
| Carboxymethyl sago pulp | — | — | 0.025 | — | — | |||
| Carboxymethyl sago pulp immobilized sago waste | Langmuir | Pseudo second order | 0.494 | 22 h | 2 | |||
| 10 | Poly(vinyl alcohol)/starch nanofiber | Methylene blue | Langmuir | Pseudo second order | 1.25 | 150 min | 5 | 29 |
| 11 | Halloysite nanotubes@carbon rich carboxyl group | Methylene blue | Langmuir | Pseudo second order | 2.158 | — | 5 | 17 |
| 12 | Poly(vinyl alcohol)/5% halloysite nanotubes | Methylene blue | Langmuir | Pseudo second order | 1.735 | 40 min | 6 | 44 |
| 13 | Bivalve shells | Methylene blue | Langmuir | Pseudo second order | 1.0 | 10 min | — | 61 |
| 14 | 2-Mercapto benzimidazole/chitosan | Methylene blue | Langmuir | Pseudo first order | 1.28 | 90 min | 5 | 62 |
| 15 | Starch/0.8% halloysite nanotubes | Methylene blue | Langmuir | Pseudo second order | 1.88 | 30 min | 6 | Present work |
3.9 Plausible adsorption mechanism
The results from the SEM study (Fig. 2d) showed successful adsorption of MB on starch/HNT flakes. The presence of adsorption sites for uptake of MB on composite flakes can be derived from FT-IR spectra. The pertinent bands of starch/HNT flakes and MB (1606, 1497, 1399 and 1249 cm−1) were present in the spectra obtained after MB adsorption with small shifts from their original positions (Fig. 3c).3 The fingerprint band for MB corresponding to the skeletal vibration of the aromatic ring at 1497 cm−1 was evident with the shift to 1458 cm−1 in the dye adsorbed flakes. The broad peak near 3295 cm−1 suggests the probability of H-bonding, dipole–dipole interactions, and n–π interactions during the uptake of the dye.3 Moreover, the point of zero charge (pHpzc) and pH optimization studies together confirmed the occurrence of negative charge on the surface of the flakes above pH 4.1, where the positively charged dye molecules can be successfully trapped in the surface. This shows the existence of electrostatic attraction and van der Waals forces between the oppositely charged adsorbate and adsorbent surfaces. Moreover, the fact that starch/HNT flakes expand its surface area as evident from the BET studies ensures effective binding with the adsorbate.4 Conclusions
In summary, starch–HNT composite flakes were prepared by solution casting methodology and used for adsorption of MB from aqueous solutions. The sample flakes were analyzed using XRD, SEM, FT-IR and TGA, whereas their surface area and point of zero charge were obtained from BET and PZC testing, respectively. The composites showed superior adsorption for MB compared to existing starch-based composites with a maximum adsorption capacity of 604 mg g−1 under optimum conditions. The isotherm and kinetics models established the physisorption phenomena, besides, an increase in temperature favored adsorption. The desorbing solvent system successfully demonstrated the capacity to regenerate the adsorbent for six successive sorption–desorption cycles with no significant loss of efficiency. The present approach is not only cost effective and rapid but can serve as an environmentally benign approach for adsorption of dyes from wastewater.Data availability
There is no experimental data to share.Author contributions
Anargha P. Nambiar wrote the study protocol, contributed to data collection and analyses, and wrote the original draft. Rahul Pillai contributed to interpretation of instrumental data and analysis. Yugesh Vadikkeettil contributed to interpretation of instrumental data and analysis. Mallika Sanyal contributed substantially to writing the draft manuscript. Pranav S Shrivastav: conceptualization, supervision, writing – critical reviewing and editing. Further, all authors read and approved the final manuscript for submission.Conflicts of interest
The authors declare that they have no known competing financial interests or personal relationships that could have appeared to influence the work reported in this paper.Acknowledgements
This work did not receive any specific grant from funding agencies in the public, commercial, or not-for-profit sectors. The authors would like to acknowledge the Department of Chemistry, Gujarat University, Ahmedabad, Gujarat, India for supporting this work.References
- C. Yu, X. Tang, S. Liu, Y. Yang, X. Shen and C. Gao, Laponite crosslinked starch/polyvinyl alcohol hydrogels by freezing/thawing process and studying their cadmium ion absorption, Int. J. Biol. Macromol., 2018, 117, 1–6, DOI:10.1016/j.ijbiomac.2018.05.159.
- N. Alvarado, R. L. Abarca, J. Urdaneta, J. Romero, M. J. Galotto and A. Guarda, Cassava Starch: structural modification for development of a bio-adsorber for aqueous pollutants. Characterization and adsorption studies on methylene blue, Polym. Bull., 2020, 78, 1087–1107, DOI:10.1007/s00289-020-03149-9.
- L. Chen, Y. Zhu, Y. Cui, R. Dai, Z. Shan and H. Chen, Fabrication of starch-based high-performance adsorptive hydrogels using a novel effective pre-treatment and adsorption for cationic methylene blue dye: Behaviour and mechanism, Chem. Eng. J., 2021, 405, 126953–126966, DOI:10.1016/j.cej.2020.126953.
- P. Rajapaksha, R. Orrell-Trigg, Y. B. Truong, D. Cozzolino, V. K. Truong and J. Chapman, Wastewater depollution of textile dyes and antibiotics using unmodified and copper oxide/zinc oxide nanofunctionalised graphene oxide materials, Environ. Sci.: Adv., 2022, 1–14, 10.1039/d2va00059h.
- M. Wawrzkiewicz, Removal of C.I. Basic Blue 3 dye by sorption onto cation exchange resin, functionalized and non-functionalized polymeric sorbents from aqueous solutions and wastewaters, Chem. Eng. J., 2013, 217, 414–425, DOI:10.1016/j.cej.2012.11.119.
- S. S. Moghaddam, M. R. A. Moghaddam and M. Arami, Coagulation/flocculation process for dye removal using sludge from water treatment plant: Optimization through response surface methodology, J. Hazard. Mater., 2010, 175, 651–657, DOI:10.1016/j.jhazmat.2009.10.058.
- S. K. Nataraj, K. M. Hosamani and T. M. Aminabhavi, Nanofiltration and reverse osmosis thin film composite module for the removal of dye and salts from the simulated mixtures, Desalination, 2009, 249, 12–17, DOI:10.1016/j.desal.2009.06.008.
- E. M. Elsayed, A. E. Shalan and M. M. Rashad, Preparation of ZnO nanoparticles using electrodeposition and co-precipitation techniques for dye-sensitized solar cells applications, J. Mater. Sci.: Mater. Electron., 2014, 25, 3412–3419, DOI:10.1007/s10854-014-2033-9.
- C. Liu, H. Mao, J. Zheng and S. Zhand, Tight ultrafiltration membrane: Preparation and characterization of thermally resistant carboxylated cardo poly (arylene ether ketone)s (PAEK-COOH) tight ultrafiltration membrane for dye removal, J. Membr. Sci., 2017, 530, 1–10, DOI:10.1016/j.memsci.2017.02.005.
- H. Hu, M. Yang and J. Dang, Treatment of strong acid dye wastewater by solvent extraction, Sep. Purif. Technol., 2005, 42, 129–136, DOI:10.1016/j.seppur.2004.07.002.
- F. Li, Y. Dong, W. Kang, B. Cheng and G. Cui, Enhanced removal of azo dye using modified PAN nanofibrous membrane Fe complexes with adsorption/visible-driven photocatalysis bifunctional roles, Appl. Surf. Sci., 2017, 404, 206–215, DOI:10.1016/j.apsusc.2017.01.268.
- P. V. Nidheesh, M. Zhou and M. A. Oturan, An overview on the removal of synthetic dyes from water by electrochemical advanced oxidation process, Chemosphere, 2018, 197, 210–227, DOI:10.1016/j.chemosphere.2017.12.195.
- P. Navarro, J. A. Pellicer and V. M. Gomez-Lopez, Degradation of azo dye by an UV/H2O2 advanced oxidation process using an amalgam lamp, Water Environ. J., 2019, 33, 476–483, DOI:10.1111/wej.12418.
- K. Z. Elwakeel, Removal of reactive black 5 from aqueous solutions using magnetic chitosan resins, J. Hazard. Mater., 2009, 167, 383–393, DOI:10.1016/j.jhazmat.2009.01.051.
- G. H. Al-Hazmi, A. Akhdhar, A. Shahat and K. Z. Elwakeel, Adsorption of Gentian violet dye onto mesoporous aluminosilica monoliths: nanoarchitectonics and application to industrial wastewater, Int. J. Environ. Anal. Chem., 2022, 1–22, DOI:10.1080/03067319.2022.2104641.
- Z. Esvandi, R. Foroutan, S. J. Peighambardoust, A. Akbari and B. Ramavandi, Uptake of anionic and cationic dyes from water using natural clay and clay/starch/MnFe2O4 magnetic nanocomposite, Surf. Interfaces, 2020, 21, 100754, DOI:10.1016/j.surfin.2020.100754.
- P. Wang, Y. Tang, Y. Liu, T. Wang, P. Wu and X. Lu, Halloysite nanotube@carbon with rich carboxyl group as a multifunctional adsorbent for the efficient removal of cationic Pb(II), anionic Cr(VI) and methylene blue (MB), Environ. Sci.: Nano, 2018, 5, 2257–2268, 10.1039/C8EN00561C.
- N. Follain, J. Ren, E. Pollet and L. Averous, Study of the water sorption and barrier performances of potato starch nano-biocomposites based on halloysite nanotubes, Carbohydr. Polym., 2022, 277, 118805, DOI:10.1016/j.carbpol.2021.118805.
- P. Li, B. Gao, A. Li and H. Yang, Evaluation of the selective adsorption of silica-sand/anionized-starch composite for removal of dyes and Cupper (II) from their aqueous mixture, Int. J. Biol. Macromol., 2020, 149, 1285–1293, DOI:10.1016/j.ijbiomac.2020.02.047.
- A. M. Peres and R. L. Orefice, Effect of incorporation of Halloysite nanotubes on the structure and properties of low-density polyethylene/thermoplastic starch blend, J. Polym. Res., 2020, 27, 211, DOI:10.1007/s10965-020-02185-3.
- N. Oliyaei, M. Moosavi-Nasab, A. M. Tamaddon and M. Fazaeli, Preparation and characterization of porous starch reinforced with halloysite nanotube by solvent exchange method, Int. J. Biol. Macromol., 2019, 123, 682–690, DOI:10.1016/j.ijbiomac.2018.11.095.
- P. Zhou, Y. Luo, Z. Lv, X. Sun, Y. Tian and X. Zhang, Melt-processed poly (vinyl alcohol)/corn starch/nanocellulose composites with improved mechanical properties, Int. J. Biol. Macromol., 2021, 183, 1903–1910, DOI:10.1016/j.ijbiomac.2021.06.011.
- A. Mokhtar, S. Abdelkrim, F. Zaoui, M. Sassi and B. Boukoussa, Improved stability of starch@Layered-materials composite films for methylene blue dye adsorption in aqueous solution, J. Inorg. Organomet. Polym. Mater., 2020, 30, 3826–3831, DOI:10.1007/s10904-020-01536-3.
- K. M. Dang, R. Yoksan, E. Pollet and L. Averous, Morphology and properties of thermoplastic starch blended with biodegradable polyester and filled with halloysite nanoclay, Carbohydr. Polym., 2020, 242, 116392, DOI:10.1016/j.carbpol.2020.116392.
- Y. He, W. Kong, W. Wang, T. Liu, Y. Liu, Q. Gong and J. Gao, Modified natural halloysite/potato starch composite films, Carbohydr. Polym., 2012, 87, 2706–2711, DOI:10.1016/j.carbpol.2011.11.057.
- V. Bertolino, G. Cavallaro, S. Milioto and G. Lazzara, Polysaccharides/Halloysite nanotubes for smart bionanocomposite materials, Carbohydr. Polym., 2020, 245, 116502, DOI:10.1016/j.carbpol.2020.116502.
- Z. W. Abdullah and Y. Dong, Biodegradable and water resistant poly(vinyl) alcohol (PVA)/starch (ST)/glycerol (GL)/Halloysite nanotube (HNT) nanocomposite films for sustainable food packaging, Front. Mater. Sci., 2019, 6, 1–17, DOI:10.3389/fmats.2019.00058.
- K. Junlapong, P. Maijan, C. Chaibundit and S. Chantarak, Effective adsorption of methylene blue by biodegradable superadsorbent cassava starch-based hydrogel, Int. J. Biol. Macromol., 2020, 158, 258–264, DOI:10.1016/j.ijbiomac.2020.04.247.
- E. Moradi, H. Ebrahimzadeh, Z. Mehrani and A. A. Asgharinezhad, The efficient removal of methylene blue from water samples using three-dimensional poly (vinyl alcohol)/starch nanofiber membrane as a green nanosorbent, Environ. Sci. Pollut. Res., 2019, 26, 35071–35081, DOI:10.1007/s11356-019-06400-7.
- M. Zhao and P. Liu, Adsorption behaviour of methylene blue on halloysite nanotubes, Microporous Mesoporous Mater., 2008, 112, 419–424, DOI:10.1016/j.micromeso.2007.10.018.
- Y. Chen, R. Li, Y. Zhang, X. Chen and Y. Ye, Adsorption of methylene blue by halloysite/MnFe2O4 nanocomposites, J. Nanosci. Nanotechnol., 2017, 17, 6489–6496, DOI:10.1166/jnn.2017.14411.
- N. A. Dahlan, L. W. Lee, J. Pushpamalar and S. L. Ng, Adsorption of methylene blue onto carboxymethyl sago pulp-immobilized sago waste hydrogel beads, Int. J. Environ. Sci. Technol., 2019, 16, 2047–2058, DOI:10.1007/s13762-018-1789-5.
- S. Sadjadi, M. Malmir, M. M. Heravi and F. G. Kahangi, Biocompatible starch-halloysite hybrid: An efficient support for immobilizing Pd species and developing a heterogeneous catalyst for ligand and copper free coupling reactions, Int. J. Biol. Macromol., 2018, 118, 1903–1911, DOI:10.1016/j.ijbiomac.2018.07.053.
- F. Sadegh-Hassani and A. M. Nafchi, Preparation and characterization of bionanocomposite films based on potato starch/halloysite nanoclay, Int. J. Biol. Macromol., 2014, 67, 458–462, DOI:10.1016/j.ijbiomac.2014.04.009.
- H. Schmitt, K. Prashantha, J. Soulestin, M. F. Lacrampe and P. Krawczak, Preparation and properties of novel melt-blended halloysite nanotubes/wheat starch nanocomposites, Carbohydr. Polym., 2012, 89, 920–927, DOI:10.1016/j.carbpol.2012.04.037.
- H. Schmitt, N. Creton, K. Prashantha, J. Soulestin, M. F. Lacrampe and P. Krawczak, Preparation and Characterization of Plasticized starch/halloysite porous nanocomposites possibly suitable for biomedical applications, J. Appl. Polym. Sci., 2014, 132, 41341–41350, DOI:10.1002/app.41341.
- H. Schmitt, N. Creton, K. Prashantha, J. Soulestin, M. F. Lacrampe and P. Krawczak, Melt-blended halloysite nanotubes/wheat starch nanocomposites as drug delivery system, Polym. Eng. Sci., 2014, 55, 573–580, DOI:10.1002/pen.23919.
- N. Oliyaei, M. Moosavi-Nasab and A. M. Tamaddon, Encapsulation of fucoxanthin in binary matrices of porous starch and halloysite, Food Hydrocolloids, 2020, 100, 105458, DOI:10.1016/j.foodhyd.2019.105458.
- H. Wei, H. Wang, H. Chu and J. Li, Preparation and characterization of slow-release and water-retention fertilizer based on starch and halloysite, Int. J. Biol. Macromol., 2019, 133, 1210–1218, DOI:10.1016/j.ijbiomac.2019.04.183.
- G. Xing, S. Liu, Q. Xu and Q. Liu, Preparation and adsorption behavior for brilliant blue X-BR of the cost-effective cationic starch intercalated clay composite matrix, Carbohydr. Polym., 2012, 87, 1447–1452, DOI:10.1016/j.carbpol.2011.09.038.
- S. Lawchoochaisakul, P. Monvisade and P. Siriphannon, Cationic starch intercalated montmorillonite nanocomposites as natural based adsorbent for dye removal, Carbohydr. Polym., 2021, 253, 117230, DOI:10.1016/j.carbpol.2020.117230.
- A. Garcia-Padilla, K. A. Moreno-Sader, A. Realpe, M. Acevedo-Morantes and J. B. P. Soares, Evaluation of adsorption capacities of nanocomposites prepared from bean starch and montmorillonite, Sustainable Chem. Pharm., 2020, 17, 100292, DOI:10.1016/j.scp.2020.100292.
- T. Atnafu and S. Leta, Plasticized magnetic starch-based Fe3O4 clay polymer nanocomposites for phosphate adsorption from aqueous solution, Heliyon, 2021, 7, e07973, DOI:10.1016/j.heliyon.2021.e07973.
- A. P. Nambiar, R. Pillai, Y. Vadikkeettil, M. Sanyal and P. S. Shrivastav, Glutaraldehyde-crosslinked poly (vinyl alcohol)/halloysite composite films as adsorbent for methylene blue in water, Mater. Chem. Phys., 2022, 291, 126752, DOI:10.1016/j.matchemphys.2022.126752.
- A. M. Elgarahy, K. Z. Elwakeel, S. H. Mohammad and G. A. Elshoubaky, A critical review of biosorption of dyes, heavy metals and metalloids from waste water as an efficient and green process, Cleaner Eng. Technol., 2021, 4, 100209, DOI:10.1016/j.clet.2021.100209.
- R. A. Mashabi, Z. A. Khan and K. Z. Elwakeel, Chitosan- or glycidyl methacrylate-based adsorbents for the removal of dyes from aqueous solutions: a review, Mater. Adv., 2022, 3, 5645–5671, 10.1039/d2ma00320a.
- K. Z. Elwakeel, Environmental application of chitosan resins for the treatment of water and waste water: A review, J. Dispersion Sci. Technol., 2010, 31, 273–288, DOI:10.1080/01932690903167178.
- N. Devi and J. Dutta, Development and in vitro characterization of chitosan/starch/halloysite nanotubes ternary nanocomposite films, Int. J. Biol. Macromol., 2019, 127, 222–231, DOI:10.1016/j.ijbiomac.2019.01.047.
- S. M. M. Meira, G. Zehetmeyer, J. M. Scheibel, J. O. Werner and A. Brandelli, Starch-halloysite nanocomposites containing nisin: characterization and inhibition of Listeria monocytogenes in soft cheese, LWT–Food Sci. Technol., 2016, 68, 226–234, DOI:10.1016/j.lwt.2015.12.006.
- X. Dang, Z. Yu, M. Yang, M. W. Woo, Y. Song, X. Wang and H. Zhang, Sustainable electrochemical synthesis of natural starch-based biomass adsorbent with ultrahigh adsorption capacity for Cr(VI) and dyes removal, Sep. Purif. Technol., 2022, 288, 120668, DOI:10.1016/j.seppur.2022.120668.
- S. M. M. Meira, G. Zehetmeyer, J. O. Werner and A. Brandelli, A novel active packaging material based on starch–halloysite nanocomposites incorporating antimicrobial peptides, Food Hydrocolloids, 2017, 63, 561–570, DOI:10.1016/j.foodhyd.2016.10.013.
- E. Raee and B. Kaffashi, Biodegradable polypropylene/thermoplastic starch nanocomposites incorporating halloysite nanotubes, J. Appl. Polym. Sci., 2017, 135, 45740, DOI:10.1002/app.45740.
- W. S. W. Ngah, N. F. M. Ariff and M. A. K. M. Hanafiah, Preparation, Characterization, and Environmental Application of Crosslinked Chitosan-Coated Bentonite for Tartrazine Adsorption from Aqueous Solutions, Water, Air, Soil Pollut., 2010, 206, 225–236, DOI:10.1007/s11270-009-0098-5.
- S. Liu, H. Ge, C. Wang, Y. Zou and J. Liu, Agricultural waste/graphene oxide 3D bio-adsorbent for highly efficient removal of methylene blue from water pollution, Sci. Total Environ., 2018, 628, 959–968, DOI:10.1016/j.scitotenv.2018.02.134.
- A. Magdy, Y. O. Fouad, M. H. Abdel-Aziz and A. H. Konsowa, Synthesis and characterization of Fe3O4/kaolin magnetic nanocomposite and its application in wastewater treatment, J. Ind. Eng. Chem., 2017, 56, 299–311, DOI:10.1016/j.jiec.2017.07.023.
- V. Puccia and M. J. Avena, On the use of the Dubinin–Radushkevich equation to distinguish between physical and chemical adsorption at the solid-water interface, Colloid Interface Sci. Commun., 2021, 41, 100376, DOI:10.1016/j.colcom.2021.100376.
- X. Zhou, Correction to the calculation of Polanyi potential from Dubinnin–Rudushkevich equation, J. Hazard. Mater., 2020, 384, 121101, DOI:10.1016/j.jhazmat.2019.121101.
- G. L. Dotto, M. L. G. Vieira and L. A. A. Pinto, Kinetics and mechanism of tartrazine adsorption onto chitin and chitosan, Ind. Eng. Chem. Res., 2012, 51, 6862–6868, DOI:10.1021/ie2030757.
- N. A. Rashidi, S. Yusup and B. H. Hameed, Kinetic studies on carbon dioxide capture using lignocellulosic based activated carbon, Energy, 2013, 61, 440–446, DOI:10.1016/j.energy.2013.08.050.
- E. C. Lima, A. Hosseini-Bandegharaei, J. C. Moreno-Piraján and I. Anastopoulos, A critical review of the estimation of the thermodynamic parameters on adsorption equilibria. Wrong use of equilibrium constant in the Van't Hoff equation for calculation of thermodynamic parameters of adsorption, J. Mol. Liq., 2019, 273, 425–434, DOI:10.1016/j.molliq.2018.10.048.
- K. Z. Elwakeel, A. M. Elgarahy and S. H. Mohammad, Use of beach bivalve shells located at Port Said coast (Egypt) as a green approach for methylene blue removal, J. Environ. Chem. Eng., 2017, 5, 578–587, DOI:10.1016/j.jece.2016.12.032.
- K. Z. Elwakeel, A. M. Elgarahy, A. S. Al-Bogami, M. F. Hamza and E. Guibal, 2-Mercaptobenzimidazole-funtionalized chitosan for enhanced removal of methylene blue: Batch and column studies, J. Environ. Chem. Eng., 2021, 9, 105609, DOI:10.1016/j.jece.2021.105609.
Footnote |
| † Electronic supplementary information (ESI) available. See DOI: https://doi.org/10.1039/d2va00274d |
| This journal is © The Royal Society of Chemistry 2023 |

