Understanding the active formation of a cathode–electrolyte interphase (CEI) layer with energy level band bending for lithium-ion batteries†
Received
27th September 2022
, Accepted 21st November 2022
First published on 22nd November 2022
Abstract
Cathode–electrolyte interphase (CEI) formation between the cathode and the electrolyte is a critical factor that determines the stability of lithium-ion batteries (LiBs). The CEI layer consists of various by-products (e.g., LiF, Li2CO3, ROLi, and ROCO2Li (R: alkyl group)) decomposed from redox reactions between the cathode and the electrolyte, which can lead to dramatic capacity fading and stability issues. Herein, we empirically identify the energy level band bending of a Ni-rich NMC cathode (i.e., Li(Ni0.5Mn0.3Co0.2)O2) with the visual evidence of Li+ transfer from the electrode to the CEI layer (adsorbate). Negatively charged elements tend to be present at the close surface of the cathode, while the positively charged Li+ migrates from the cathode to the CEI layer. Hence, a downward band bending could be depicted based on the work function and the energy level difference between the Fermi level (EF) and the valence band maximum (EVBM). Energy level alignment itself is likely to be the key process that leads to the active formation of unstable CEI layers on charge–discharge.
1. Introduction
Lithium-ion batteries (LiBs) have attracted great interest as an energy storage system for various applications ranging from mobile devices to electric vehicles and energy storage stations for solar cells.1–3 Since the last decade, attention has been paid to layered transition metal oxide batteries, which can be represented by the formula of LiNixCoyMn1−x−yO2 (NMC, x > 0 and y > 0), owing to their high discharge capacity (<200 mA h g−1), high energy density, and lower cost compared to conventional LiBs (e.g., LiCoO2).4–6 In addition, cathodes containing mixed transition metals of Ni, Mn, and Co can provide synergic advantages over a single transition metal oxide cathode. Ni is the key element that enables high capacity of the battery by a two-stage redox reaction between Ni2+/Ni3+ and Ni3+/Ni4+.7,8 Co can partially contribute to capacity achievement, but mostly it improves the rate capability of the battery.9,10 Also, the presence of Co3+ may suppress structural distortion resulting from the Jahn–Teller effect of Ni3+.11,12 Mn is involved in the structural and thermal stability of the NMC cathode material.13–15 The structural stability is likely to be improved by Mn4+, which is electrochemically inactive.4,16,17 Despite those advantages, there are major drawbacks of this series of materials. For example, the NMC battery often suffers from irreversible capacity loss during the initial cycle, and capacity fading/voltage decay on further cycles.18–20 The phase transition from the layered structure (space group: R![[3 with combining macron]](https://www.rsc.org/images/entities/char_0033_0304.gif) m) to spinel and NiO rock-salt structures (space group: Fmm) is considered as the dominant factor that leads to the degradation of NMC batteries.19,21–23 A number of studies have shown that the degradation process occurs both at the surface and in the bulk of the cathode material.21,22,24 Whereas structural transformation to spinel occurs in the whole region of the NMC particle, the formation of NiO is often discussed as a surface reconstruction process.22,25,26 Increasing the Ni concentration to achieve high capacities can facilitate surface reconstruction of the active material by NiO, resulting in a high interfacial resistance.22,25,27 It is generally accepted that the charge transfer kinetics between the cathode and the Li+ at the electrode–electrolyte interphase plays an important role in the battery stability and performance.25,28–30 One main factor that limits the charge transfer kinetics of Li+ is the formation of an unstable cathode–electrolyte interphase (CEI) layer during charge and discharge.29,31,32 Generally, a CEI layer consists of various organic and inorganic products decomposed from the electrolyte and electrode such as LiF, Li2CO3, MnOx, MnFx, CoOx, NiO, ROLi, and ROCO2Li (R: alkyl group).27,29,33 These chemical compounds can impede Li+ migration at the electrode–electrolyte interphase.27,33 Also, previous studies have reported that the NMC cathode with high Ni concentration (i.e., Ni-rich cathode) would accelerate the CEI formation because of active electrolyte oxidation by the Ni element, which in turn leads to a thicker CEI layer.25,33 Thus, the CEI environment is strongly associated with the Li+ transfer kinetics on charge–discharge. A number of studies elucidated the interfacial phenomena on the basis of band bending and energy level alignment at the CEI.28,29,34,35 A previous study by Becker et al. highlights the need of a surface science approach to study interphase properties based on energy level alignment.34 In that study, formation of an electrochemical interface was examined for a LiCoO2 (LCO) cathode in contact with diethyl carbonate (DEC), which is a solvent often employed in battery electrolytes. A downward band bending from the cathode bulk to the surface has been identified, implying the migration of positive charges from the cathode bulk to the surface. A similar study by Hausbrand et al. also demonstrates band bending between the LiCoO2 (LCO) electrode and the diethyl carbonate (DEC) electrolyte.28,35 The transfer of Li+ from LCO to the DEC adsorbate layer is considered as the main reason for the band bending, but there has been no empirical evidence so far.29,34,35 The loss of Li+ from the cathode results in a negatively charged condition close to the cathode surface. On the other hand, positive charges can migrate to the adsorbate layer crossing the interphase. It is the charge carrier concentration that determines the interface stability between the electrode and electrolyte.
m) to spinel and NiO rock-salt structures (space group: Fmm) is considered as the dominant factor that leads to the degradation of NMC batteries.19,21–23 A number of studies have shown that the degradation process occurs both at the surface and in the bulk of the cathode material.21,22,24 Whereas structural transformation to spinel occurs in the whole region of the NMC particle, the formation of NiO is often discussed as a surface reconstruction process.22,25,26 Increasing the Ni concentration to achieve high capacities can facilitate surface reconstruction of the active material by NiO, resulting in a high interfacial resistance.22,25,27 It is generally accepted that the charge transfer kinetics between the cathode and the Li+ at the electrode–electrolyte interphase plays an important role in the battery stability and performance.25,28–30 One main factor that limits the charge transfer kinetics of Li+ is the formation of an unstable cathode–electrolyte interphase (CEI) layer during charge and discharge.29,31,32 Generally, a CEI layer consists of various organic and inorganic products decomposed from the electrolyte and electrode such as LiF, Li2CO3, MnOx, MnFx, CoOx, NiO, ROLi, and ROCO2Li (R: alkyl group).27,29,33 These chemical compounds can impede Li+ migration at the electrode–electrolyte interphase.27,33 Also, previous studies have reported that the NMC cathode with high Ni concentration (i.e., Ni-rich cathode) would accelerate the CEI formation because of active electrolyte oxidation by the Ni element, which in turn leads to a thicker CEI layer.25,33 Thus, the CEI environment is strongly associated with the Li+ transfer kinetics on charge–discharge. A number of studies elucidated the interfacial phenomena on the basis of band bending and energy level alignment at the CEI.28,29,34,35 A previous study by Becker et al. highlights the need of a surface science approach to study interphase properties based on energy level alignment.34 In that study, formation of an electrochemical interface was examined for a LiCoO2 (LCO) cathode in contact with diethyl carbonate (DEC), which is a solvent often employed in battery electrolytes. A downward band bending from the cathode bulk to the surface has been identified, implying the migration of positive charges from the cathode bulk to the surface. A similar study by Hausbrand et al. also demonstrates band bending between the LiCoO2 (LCO) electrode and the diethyl carbonate (DEC) electrolyte.28,35 The transfer of Li+ from LCO to the DEC adsorbate layer is considered as the main reason for the band bending, but there has been no empirical evidence so far.29,34,35 The loss of Li+ from the cathode results in a negatively charged condition close to the cathode surface. On the other hand, positive charges can migrate to the adsorbate layer crossing the interphase. It is the charge carrier concentration that determines the interface stability between the electrode and electrolyte.
The present study explores, for the first time, the energy band bending of a Ni-rich NMC electrode, i.e., Li(Ni0.5Mn0.3Co0.2)O2 (NMC532) upon cycling with the evidence of positive charge transfer (Li+). Whereas energy diagrams have been often examined experimentally for solar cell applications,36,37 few studies have investigated energy level diagrams for lithium-ion batteries. Herein, NMC532 electrodes were cycled under different electrochemical conditions (4.3 V, 4.5 V, and 4.7 V cut-off voltages) to induce different environments of the adsorbate layer. We could successfully depict energy level band bending at the CEI layer based on the work function and the energy level difference between the Fermi level (EF) and the valence band maximum (EVBM). Also, the evidence of band bending by positive charge (Li+) transfer, which has remained as a conceptual knowledge, has been empirically identified using a positive ion detection mode (PID) method with secondary-ion mass spectrometry (SIMS). This paper provides key insights into the formation of the unstable CEI layer with lithium compounds during charge and discharge.
2. Experimental
2.1 Electrode preparation
The Li(Ni0.5Mn0.3Co0.2)O2 electrode was synthesized by mixing the Li(Ni0.5Mn0.3Co0.2)O2 active material (MTI) with conductive carbon (Super C65) and polyvinylidene fluoride (PVDF) binder in a N-methyl-2-pyrrolidone (NMP, Sigma Aldrich) solvent with a weight ratio of 80![[thin space (1/6-em)]](https://www.rsc.org/images/entities/char_2009.gif) :10:10 (=active material:carbon black:PVDF). This sample was labelled as NMC5. The slurry of NMC5 was added on the aluminium current collector with a doctor blade to make the electrode. An integrated dryer inside the coater (MTI) was utilized to dry the coated film at 60 °C overnight. This film was put into a vacuum oven and dried at 120 °C for 12 h. The cast cathode on the Al-current collector was roll-pressed with 10–15 μm thickness three times.
:10:10 (=active material:carbon black:PVDF). This sample was labelled as NMC5. The slurry of NMC5 was added on the aluminium current collector with a doctor blade to make the electrode. An integrated dryer inside the coater (MTI) was utilized to dry the coated film at 60 °C overnight. This film was put into a vacuum oven and dried at 120 °C for 12 h. The cast cathode on the Al-current collector was roll-pressed with 10–15 μm thickness three times.
2.2 Cell assembling and electrochemical measurements
Cell assembling was carried out in an Ar-glove box (H2O < 1 ppm and O2 < 1 ppm). The NMC5 cathodes were cut into pieces of discs 16 mm in diameter. Li metal was used as a counter electrode, and a polypropylene membrane was employed as a separator (CELGARD Inc.). A stainless-steel spacer and a steel spring were inserted to make coin cells (CR2032). 1 M lithium hexafluorophosphate (LiPF6) in ethylcarbonate (EC), diethylcarbonate (DC), and dimethylcarbonate (DMC) was introduced as the electrolyte (EC:DC:DMC = 1:1:1 in volume). The cell components were sealed together using a hydraulic crimping machine (MTI, MSK-110). The assembled coin cells were electrochemically cycled at a current rate of 0.4C in the voltage range between 2.8–4.3 V and 2.8–4.7 V. As for the rate capability test, the coin cells were cycled from 0.125C to 0.25C and to 0.4C in the voltage range between 2.0 and 4.5 V using an 8-channel battery analyser (MTI) at room temperature. Electrochemical impedance spectroscopy (EIS, Autolab PGSTAT204 with an FRA32 module) measurements were conducted in the frequency range of 0.1 Hz to 100 kHz with an AC amplitude of 5 mV.
2.3 Electrode material characterization
The cycled coin cells were disassembled inside an Ar-glove box. The NMC5 cathodes were cleaned using a DMC solution and dried overnight prior to material characterization. Ultraviolet photoemission spectroscopy (UPS) was carried out to evaluate the work function changes of the electrodes and for the interphase examination. The background chamber pressure was 10−9 Torr and the binding energy calibration was conducted by measuring the Fermi edge (EF = 0 eV) on an Ar+ sputtered clean Au surface. The bias voltage applied to the sample was −9 V and the energy resolution was evaluated to be 0.14 eV. The photons were emitted by a helium gas (He Iα: 21.22 eV) non-monochromated source during the UPS measurements. A scanning electron microscope (SEM, FEI Quanta 250 FEG) was employed to compare the morphologies of the NMC5 cathodes. The investigation into the cathode–electrolyte interphase was carried out by X-ray photoelectron spectroscopy (XPS, Kratos Axis ULTRA) using monochromated Al Kα (1486.6 eV) as the X-ray source. The XPS was operated with 15 kV and 150 W power under ultra-high vacuum (10−9 Torr). The background of the measured spectra was defined by a Shirley-type function. All spectra were calibrated by C 1s (284.6 eV) as the reference. Then, the spectra were fitted with a Gaussian–Lorentzian function using CasaXPS. A positive ion detection mode (PID) was used to visualize the CEI layer of the NMC5 cathode under different cycle conditions using a SIMS (Kratos Axis ULTRA) equipped with a quadrupole mass spectrometer (HAL 7, Hiden Analytical) and an ion sputter gun (IG20, Hiden Analytical). SIMS sputtering was performed using a 1 keV Ar+ primary beam. The beam diameter was 100 μm, and the applied current was 50 nA. The angle of the beam was 45° with respect to the sample surface.
3. Results and discussion
Fig. 1 reveals the schematic illustration of energy band bending with the CEI layer, and its Li+ distribution visualized in the SIMS positive ion detection mode. The positive charges accumulated on the cathode surface by Li+ lead to band bending. The electrochemical behaviour of the NMC5 cells cycled at different cut-off voltages is presented in Fig. 2. To induce different CEI properties, the electrochemical cells were cycled in the voltage range of 2.8–4.3 V for 100 cycles, and 2.8–4.7 V for 100 cycles and 200 cycles (Fig. 2a–c). The corresponding dQ/dV plot is presented in Fig. 2d–f. It is apparent that the larger voltage window and higher cycle numbers have led to significant degradation of the NMC5 cells. Also, the cell was cycled with dynamic C-rates (from 0.125C to 0.25C to 0.4C, and back to 0.125C) in the voltage range between 2.0 and 4.5 V to form an unstable CEI layer with a large amount of trapped Li+ (Fig. 2g). This cell has been labelled as NMC5 RT (rate capability test). RT cycling could produce more complex and non-uniform CEI structures due to the dynamic change in the diffusion kinetics of the lithium-ions with the large voltage gap. As a common electrochemical window for NMC and Ni-rich NMC based batteries, a voltage range of 2.8–4.3 V has been chosen as a basis for the comparison purpose. To enable the full potential of the Ni-rich electrode, a high cut-off voltage is necessary. Therefore, the CEI environment is also discussed in the electrochemical window of 2.8–4.7 V. Furthermore, RT cycling with a large voltage gap between 2.0 V and 4.5 V is adopted to actively induce Li+ trapping in the interphase.
 |
| | Fig. 1 Schematics of energy band bending with cathode–electrolyte interphase (CEI) layer formation and the visualization of the Li+ by SIMS positive ion detection mode. | |
 |
| | Fig. 2 Galvanostatic profiles of Li(Ni0.5Mn0.3Co0.2)O2 (NMC5) cells at different cut-off voltages of (a) 2.8–4.3 V for 100 cycles, (b) 2.8–4.7 V for 100 cycles, and (c) 2.8–4.7 V for 200 cycles with 0.4C-rate current applied. The corresponded dQ/dV plots of (d) 4.3 V (100 cycles), (e) 4.7 V (100 cycles), and (f) 4.7 V (200 cycles) cut-off voltages for the 2nd and half of the total cycles (50th cycle or 100th cycle). (g) The rate capability cycling with 0.125C, 0.25C, and 0.4C in the voltage range between 2.0 and 4.5 V. | |
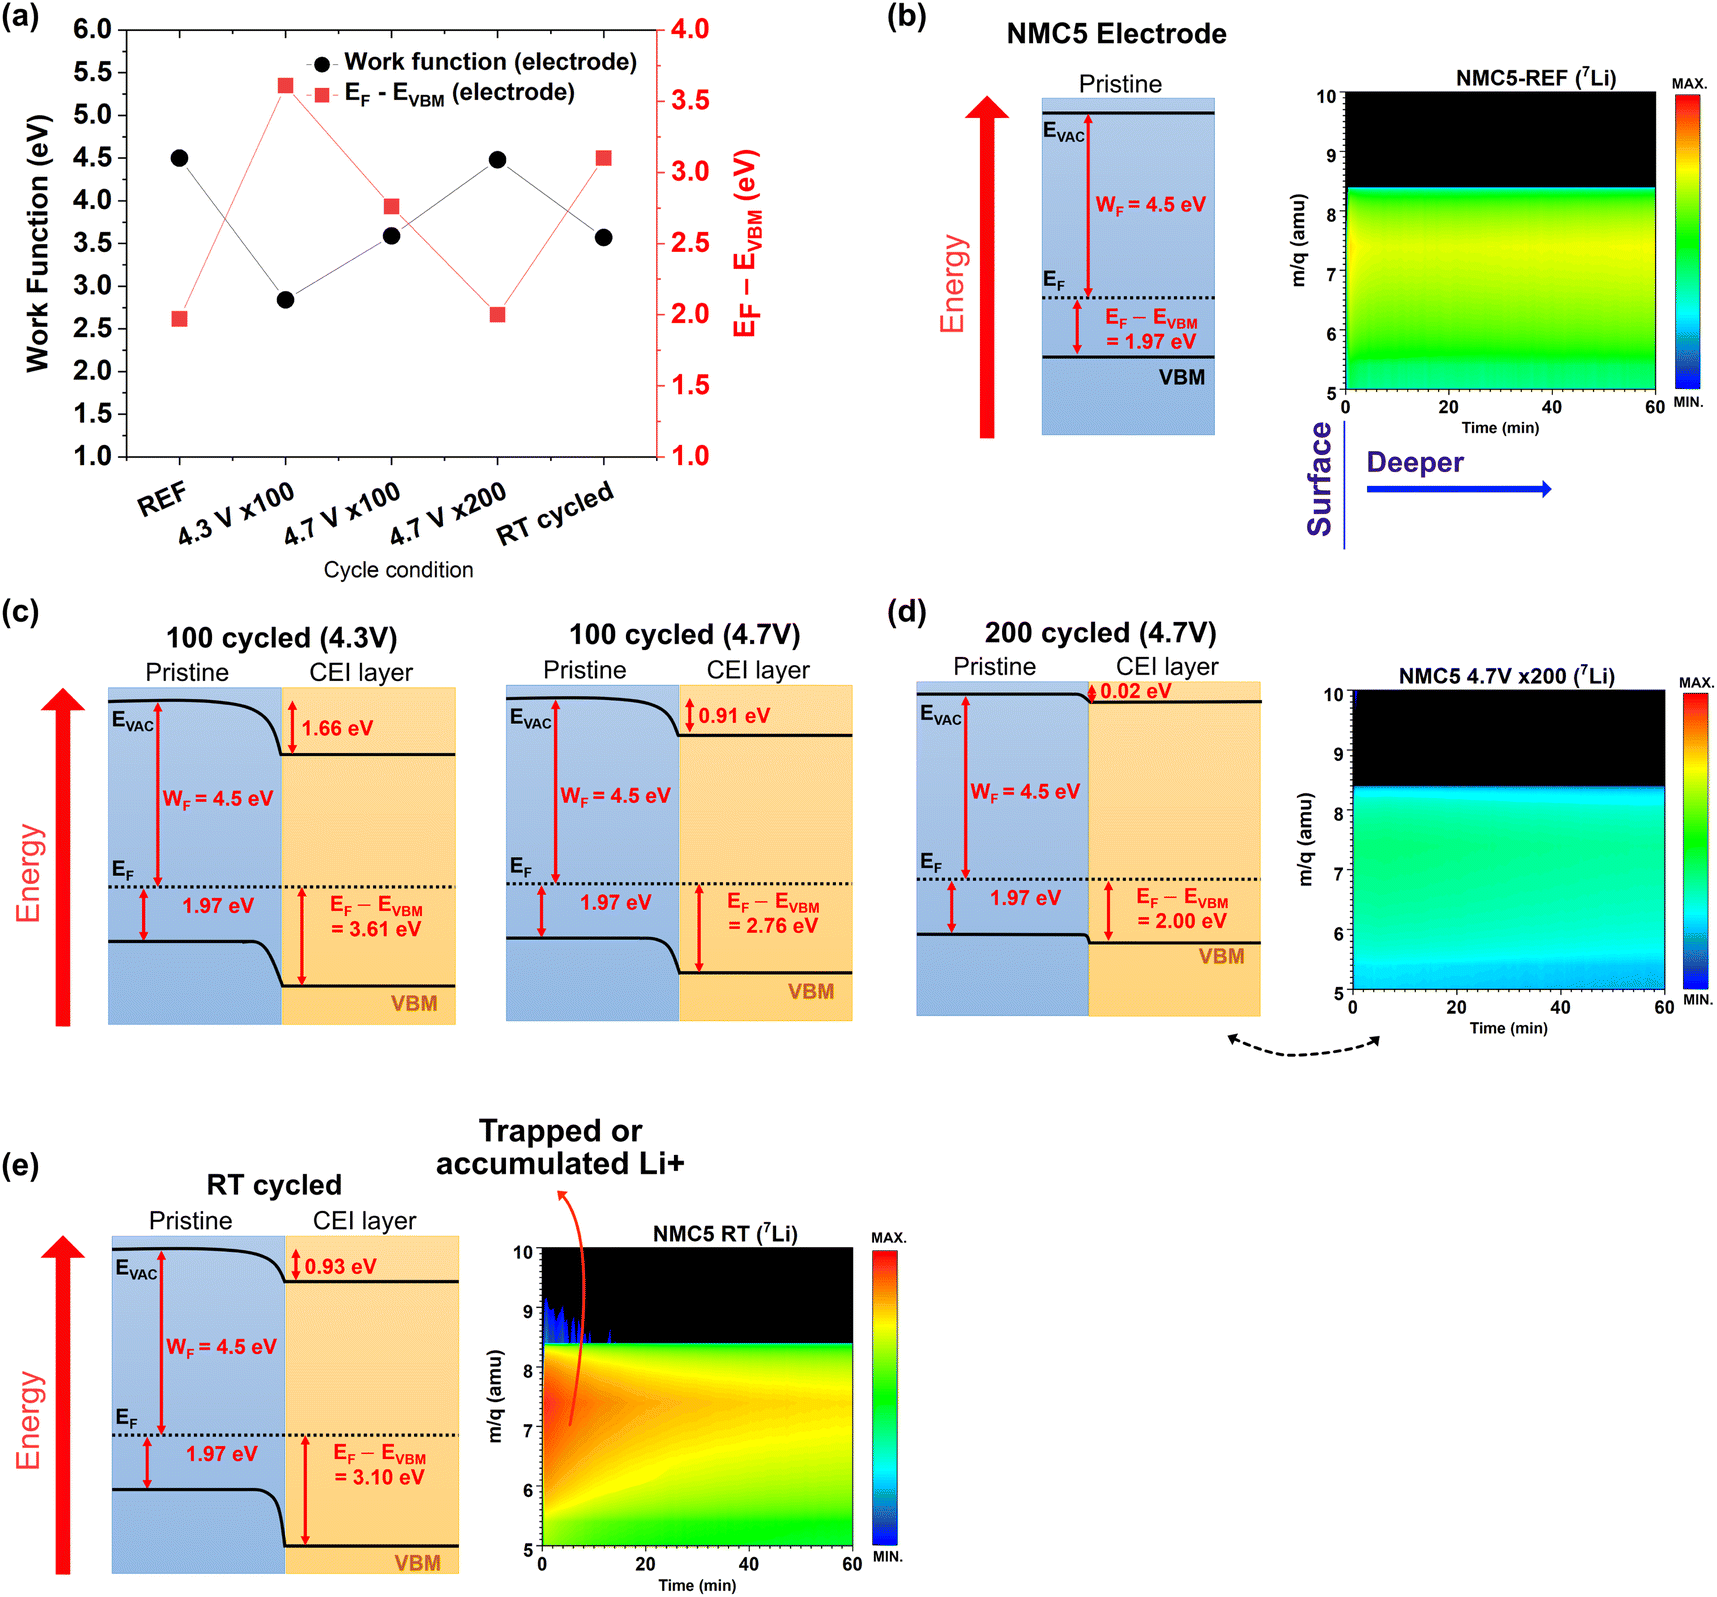
Fig. 3a and b reveal the work function change at different cycled states of NMC5. The results have been obtained from UPS measurements, and the full UPS spectra can be found in Fig. S1–S5 (ESI†). The work function (WF) of the NMC5 cathode at the reference state (REF) was measured to be 4.50 eV. There has been a dramatic drop in the work function to 2.84 eV after 100 cycles in the voltage range of 2.8–4.3 V. The work function of NMC5 4.7 V × 100 and NMC5 RT was 3.59 eV and 3.57 eV, respectively, as shown in Fig. 3a and b. The decrease in the work function could be explained by the CEI formation during charge and discharge. On the other hand, the WF of NMC5 4.7 V × 200 was evaluated to be 4.48 eV, which is similar to that of the NMC5 cathode at the reference state. After long-term cycling, the CEI layer is likely to be decomposed and dissolved in the electrolyte, thus exposing the inner pristine layer of the NMC5 cathode. The resistance in the electrolyte will therefore increase after 200 cycles. The EIS measurements of the NMC5 cycled for 100 and 200 cycles are compared in Fig. S6 (ESI†). The energy level difference between EF and EVBM has been also evaluated (Fig. 3c and d). At the reference state, the EF − EVBM increased to 3.61 eV after 100 cycles in the voltage window of 2.8–4.3 V. The EF − EVBM was 2.76 eV and 2.00 eV for the NMC5 4.7 V × 100 and NMC5 4.7 V × 200 samples, respectively. On the other hand, this value reached 3.10 eV for the NMC5 RT cathode, which had been cycled with dynamic current rates (0.125C → 0.25C → 0.4C → 0.125C). This observation will be discussed in detail in the last part of this section.
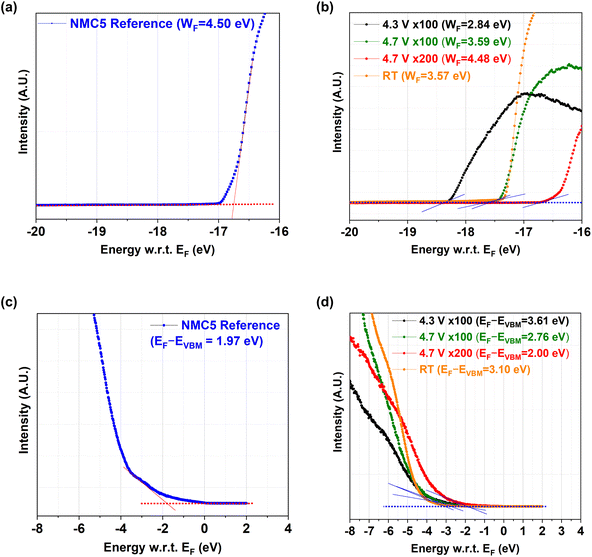 |
| | Fig. 3 (a and b) Determination of work function (WF) and (c and d) VBM (=EF − EVBM) based on the ultraviolet photoemission spectroscopy (UPS) results on (a and c) NMC5 at the reference state (REF), and (b and d) NMC5 after 100 cycles in the voltage range of 2.8–4.3 V and 2.8–4.7 V with 0.4C current applied, after 200 cycles in the voltage range of 2.8–4.7 V, and after 40 cycles with dynamic current rates from 0.125C to 0.25C to 0.4C and back to 0.125C in the voltage range of 2.0–4.5 V. | |
The surface morphology of the cathodes are compared in Fig. 4a and b. To investigate the properties of the CEI layer, XPS measurements were conducted. Energy calibration was carried out based on the C 1s XPS peak at 284.6 eV. Fig. 4 compares the XPS spectra of Mn 2p, Ni 2p, and Co 2p between the cathode at the reference state (REF) and the NMC5 cathode cycled for 200 cycles. The XPS binding energies of Mn (2p3/2) and Mn (2p1/2) were 642.6 eV and 654.1 eV, respectively, at the reference state (Fig. 4c). According to the fitting of Mn 2p, Mn4+ appears to be the dominant oxidation. This implies the existence of some Mn3+ in the NMC5 reference. The results of the Mn oxidation states corroborate previous studies.38,39After the electrochemical cycles, the signal of Mn 2p became weaker, suggesting the dissolution of Mn in the electrolyte. One pair of spin–orbit doublet Ni (2p3/2) and Ni (2p1/2) peaks were observed at 854.9 eV and 872.7 eV, respectively, followed by shake-up peaks at 860.7 eV and 879.2 eV at the reference state as can be seen in Fig. 4d. This result signifies that Ni would exist as Ni2+.33,40 There have been also minor peaks at 856.2 eV (2p3/2) and 874.7 eV (2p1/2), suggesting the presence of Ni3+, and corresponding shake-up peaks at 863.0 eV and 872.9 eV. Hence, Ni would be present as a mixed oxidation state between Ni2+ and Ni3+ at REF. The mixed states are often explained by the electron transfer between Mn4+ and Ni.2,20,40 After cycling, there has been a distinct change in the Ni 2p region. A sharp peak could be observed between 858 eV and 859 eV. This spectral change is likely to be attributed to the surface reconstruction by NiO.22,25 The sharp peak could also be connected to the F(KLL) transition, which can be assigned to a CEI species such as NiF2 (857.8 eV).25,41 The XPS spectra of Co 2p are presented in Fig. 4e. The Co (2p3/2) and Co (2p1/2) peaks were found at 780.2 eV and 795.9 eV, respectively, suggesting the major presence of Co3+ at the reference state. A broad satellite peak could be also observed at approximately 785.0 eV, signifying the existence of a small amount of Co2+.17,42 However, after 200 cycles, the Co 2p peak nearly disappeared. Similar to Mn 2p, this implies the dissolution of Co in the electrolyte.
 |
| | Fig. 4 SEM observations on (a) NMC5 at the reference state (REF) and (b) NMC5 after 200 cycles (cycled) in the voltage range of 2.8–4.7 V with 0.4C current applied. The corresponding surface analyses by XPS between NMC5 (REF) and NMC5 (cycled) of (c) Mn 2p, (d) Ni 2p, and (e) Co 2p core levels. The label SAT. indicates a satellite peak. | |
The XPS spectra of C 1s, O 1s, F 1s and Li 1s are shown in Fig. 5. Three C 1s peaks can be found at 284.6 eV, 285.9 eV, and 290.0 eV for the reference sample (REF), as seen in Fig. 5a. The peak at 284.6 eV is attributed to the conductive carbon, while the peaks at 285.9 eV, and 290.0 eV are associated with the PVDF binder. After the electrochemical cycles, the PVDF binder underwent some changes. The C 1s spectrum at the reference state differs from that of the cycled state. The conductive carbon possibly reacted with the electrolyte forming a CEI layer. Such a layer can further evolve during charge and discharge, resulting in a passive layer that impedes Li+ migration. The O 1s spectrum is shown in Fig. 5b. There have been two major peaks at 529.9 eV and 531.9 eV, which can be assigned to the lattice oxygen and the metal carbonate/Li2CO3 peaks, respectively, for the reference sample (Fig. 5b). After cycling, a spectral shift towards a higher binding energy could be observed. This change is likely to be ascribed to the formation of NiO on the active material surface and/or the dissolution of the transition metal oxides in the electrolyte.18,22,29 The XPS F 1s spectrum is presented in Fig. 5c. Contrary to expectations, the change in the F 1s spectrum was insignificant after cycling. LiF, LixPFy, and LixPOyFz are the main components that are supposed to be identified in the F 1s spectra as the decomposed electrolyte species.43,44 In addition, NiF2, CoF2, and MnF2 have also been expected as CEI species, which can contribute to the F 1s spectra.29,45,46 The absence of those contributions could be explained by the dissolution of the thick CEI layer after long-term and aggressive cycling for 200 cycles (∼4.7 V). The CEI seems to be decomposed and dissolved in the electrolyte, exposing the pristine layer located underneath the CEI layer. This result is in line with that of the UPS analyses and the XPS spectra obtained from the transition metals. Fig. 5d exhibits the XPS spectra of Li 1s. At the reference state, a major peak can be found at 55.9 eV. This peak can be ascribed to metallic lithium, but this peak nearly disappeared after 200 cycles.
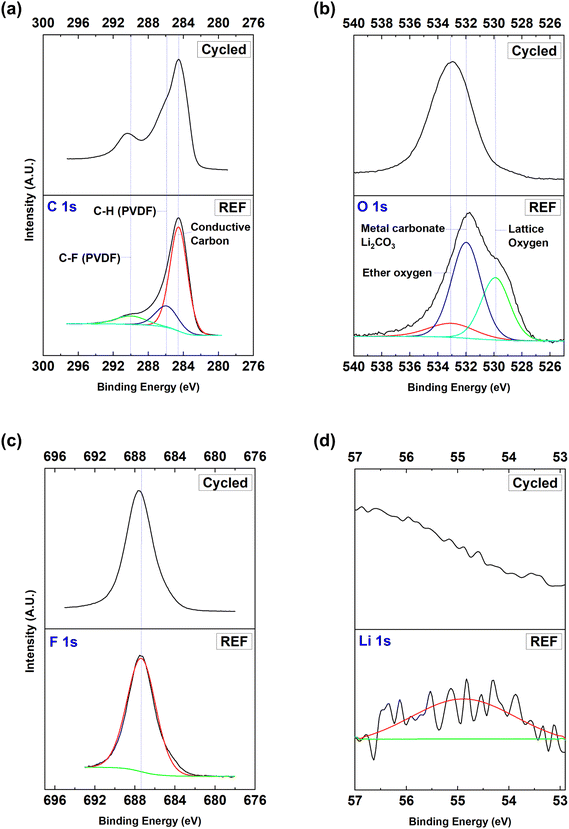 |
| | Fig. 5 Comparison of XPS analyses between NMC5 (REF) at the reference state and NMC5 (cycled) after 200 cycles in the voltage range of 2.8–4.7 V with 0.4C current applied. The collected XPS spectra of (a) C 1s, (b) O 1s, (c) F 1s, and (d) Li 1s core levels. | |
A positive-ion detection mode has been adopted based on SIMS depth profiling. This method enables the visualization of the major species that constitute the CEI layer as can be seen in Fig. 6. The visualization approach offers the key information on the stability of the CEI layer. At the reference state, 60Ni, 59Co, 58Ni, and 55Mn have been identified on the cathode surface (Fig. 6a). The initial loss of Li+ upon the first cycle is presented in Fig. S7 (ESI†), and the visualization of the accumulated CEI layer on top of the pristine cathode is exhibited in Fig. S8 (ESI†). After 200 cycles, various elemental bands occurred, implying an increase in the number of CEI species as presented in Fig. 6b. In general, the chemical reaction between the electrolyte and the Li+ can produce the Li2CO3, Li2O, and LiF components.27,33 The atomic mass units (amu) of ∼26.0 and ∼30.0 possibly correspond to the LiF and Li2O, respectively. 12C and 7Li were also notable, but the colour and the brightness have been somewhat weakened as compared to the elemental bands at the reference state (NMC5-REF). This indicates some dissolution of the CEI species in the electrolyte, and is in agreement with the UPS result of the NMC5 4.7 V × 200 sample. Also, the XPS results (cycled) support the decomposition of the CEI layer. There have been also some bands between 50.0 and 60.0 amu. This observation signifies the CEI components stemming from the transition metals such as NiO, MnOn, CoOn, NiF2, NiF3, MnF2, LiF2, and CoF3.29,41,47,48 As an alternative cycle condition (RT cycled), the cathode was cycled with dynamic current rates between 0.125C, 0.25C, and 0.4C for 40 cycles to induce CEI formation with minimum dissolution in the electrolyte. In addition, this approach appears to be helpful in trapping Li+ in the interphase (Fig. 6c), which can be explained by the electron reduction process as follows:49
| | | 2(CH2O)2CO(EC) + 2e− + 2Li+ → (CH2OCO2Li)2 + C2H4 | (1) |
| | | (CH3CH2)2OCO2(DEC) + e− + Li+ → CH3CH2OCO2Li + CH3CH2 | (2) |
| | | (CH2O)2CO + 2e− + 2Li+ → Li2CO3 + C2H4 | (3) |
 |
| | Fig. 6 Visualization of cathode–electrolyte interphase (CEI) formation in SIMS positive-ion detection (PID) mode with an estimated depth on (a) NMC5 (REF) at the reference state, (b) NMC5 after 200 cycles in the voltage range of 2.8–4.7 V with 0.4C current applied, and (c) NMC5 after 40 cycles with dynamic current rates from 0.125C to 0.25C to 0.4C and back to 0.125C in the voltage range of 2.0–4.5 V. | |
The Li+ trapping mechanism can also involve an electro-catalytic process with the transition metals.50 We could successfully depict the energy level diagram of the Li(Ni0.5Mn0.3Co0.2)O2 cathode at different cycled states on the basis of the work function and the EF − EVBM evaluation (Fig. 7). The work function and EF − EVBM under different cycle conditions have been compared in Fig. 7a. The energy band structure was described based on the corresponding visualization of the amount of lithium-ions trapped in the interphase. The band structure may slightly vary under precise (electro)chemical environments during cycling. As mentioned earlier, the work function (WF) of NMC5 at the reference state was measured to be 4.5 eV, and it dramatically dropped to 2.84 eV when the battery was cycled for 100 cycles up to 4.3 V. As a consequence, a distinct band bending could be observed as exhibited in Fig. 7c. It is known that the energy level position and band bending can determine the charge transfer barrier at the interphase.35 Band bending shows a downward trend from the cathode bulk to the surface. This finding suggests positive charge transfer from the cathode bulk to the surface layer. The loss of Li+ from the battery cathode leads to negatively charged cathode vacancies close to the surface, whereas positive charges, i.e., Li+ can be present across the junction between the pristine NMC5 and the CEI layer.34,35 The irreversible Li+ loss with the formation of vacancies is a common phenomenon leading to capacity fading and voltage decay during cycling, which has been reported by several previous studies.51,52 The migration of such Li+ could be attributed to the chemical potential difference between the pristine NMC5 cathode and the newly formed CEI layer.28,35 Normally, the CEI layer includes lithium compounds formed during the redox reactions between the electrode and the electrolyte. However, the concentration of Li+ from such lithium components in the CEI layer is likely to be very low as compared to that of the cathode bulk, thus causing the chemical potential difference. On the other hand, WF increased after 100 cycles up to 4.7 V and it became 3.59 eV. As mentioned before, the CEI layer continued to undergo decomposition in the electrolyte, which in turn can expose the inner layer of the NMC5 cathode. This reaction could be considered as a redox reaction that involves electron transfer. Consequently, downward band bending by positive charges has disappeared. However, the exposed inner layer is not identical to the pristine material (NMC5-REF). A detailed look into the 7Li band confirms a slight decrease in the concentration of Li+ in the pristine material after 200 cycles (Fig. 7d). The EF − EVBM value was approximately 2.0 eV for the NMC5 4.7 V × 200 cathode, while it was evaluated to be 1.97 eV for the pristine cathode. Also, WF slightly increased to 4.48 eV, and thereby the major downward band bending disappeared. Instead, there has been a slight downward band bending. Hence, the difference in the amount of Li+ between the bulk layer and the CEI layer seems to be very small. With the RT cycled condition, we could induce a Li+ trapped or accumulated CEI layer as displayed in Fig. 7e. The process of Li+ trapping can be described by eqn (1)–(3). The dynamic interactions between the electrode and the electrolyte have produced sets of Li+ compounds such as Li2O, Li2CO3, LiF, R (OCO2Li)2 where R is an organic group, LixPFy, and LixPOyFz. These compounds can act as a physical barrier for Li+ diffusion during charge and discharge. In addition, the formation of Li+ compounds signifies irreversible loss of a certain amount of Li+ from the pristine cathode (bulk), which can result in a notable capacity fading. Taken together, the concentration of negatively charged elements (e.g., Li+ vacancies) tends to rise at the close surface of NMC5, whereas the positively charged Li+ migrates from the cathode to the adsorbate (i.e., CEI layer) possibly due to the difference in the chemical potential of lithium. Therefore, at the junction of the cathode/CEI layer, a depletion region occurs similar to a semiconductor application. As a result, a downward band bending could be observed in the energy band diagram of the RT cycled sample (Fig. 7e). By the energy level alignment with the band bending, electrons from the conduction band of the cathode diffuse to the conduction band of the CEI layer. This process may promote the redox reactions between the CEI and the electrolyte because of the charge concentration change, causing performance decay of the lithium-ion battery.
 |
| | Fig. 7 (a) Work function and EF − EVBM at different cycled states of the NMC5 cathode. Energy level diagram of the (b) NMC5 at the reference state (REF) with the visualization of 7Li distribution, (c) NMC5/CEI after 100 cycles in the voltage range of 2.8–4.3 V and 2.8–4.7 V, and (d) after 200 cycles in the voltage range between 2.8 V and 4.7 V (at 0.4 C-rate) with the visualization of 7Li distribution, and (e) NMC5 after 40 cycles with dynamic current rates from 0.125C to 0.25C to 0.4C and back to 0.125C (voltage range: 2.0–4.5 V) with the visualization of the trapped 7Li. | |
4. Conclusions
The present study has experimentally identified band bending in the energy level diagram of a Ni-rich NMC electrode upon cycling with the visual evidence of Li+ migration from the pristine material to the adsorbate, i.e., the CEI layer. The irreversible loss of Li+ from the cathode at the early stage of cycling may cause Li+ migration at the junction of the cathode/CEI layer. When lithium ions migrate, vacancies can be equally formed. These vacancies can serve as negative charges, which continuously form close to the cathode surface. During further electrochemical cycles, the deintercalated Li+ ions are likely to be accumulated in the CEI layer, thus leading to notable band bending, facilitating the charge concentration change. This process will accelerate the formation of the unstable CEI layer which will be eventually dissolved in the electrolyte, causing severe capacity decay of the lithium-ion battery. Downward band bending by the migration of positive charges (Li+) to the CEI layer has been empirically proved. This study will shed some light on the development of Ni-rich cathodes with enhanced stability for high-capacity lithium-ion batteries.
Author contributions
Y. B. Q. conceived the idea and supervised the research. T. K. conceived the idea, and conducted experiments and analyses. L. K. O. contributed to part of the experiments. All authors contributed to writing the paper.
Conflicts of interest
There are no conflicts to declare.
Acknowledgements
This work was supported by funding from the Energy Materials and Surface Sciences Unit of the Okinawa Institute of Science and Technology Graduate University, the OIST Proof of Concept (POC) Program, and the OIST R&D Cluster Research Program. This work was also supported by the National Research Foundation of Korea (NRF) grant funded by the Korea Government (MSIT) (no. NRF-2021R1F1A1051969).
Notes and references
- M. Armand and J. M. Tarascon, Nature, 2008, 451, 652–657 CrossRef CAS.
- D. Larcher and J.-M. Tarascon, Nat. Chem., 2015, 7, 19–29 CrossRef CAS.
- T. Kim, W. Song, D. Y. Son, L. K. Ono and Y. Qi, J. Mater. Chem. A, 2019, 7, 2942–2964 RSC.
- A. Manthiram, J. C. Knight, S. T. Myung, S. M. Oh and Y. K. Sun, Adv. Energy Mater., 2016, 6, 1501010 CrossRef.
- N. Nitta, F. Wu, J. T. Lee and G. Yushin, Mater. Today, 2014, 18, 252–264 CrossRef.
- W. Lee, S. Muhammad, T. Kim, H. Kim, E. Lee, M. Jeong, S. Son, J. H. Ryou and W. S. Yoon, Adv. Energy Mater., 2018, 8(4), 1701788 CrossRef.
- M. Dixit, M. Kosa, O. S. Lavi, B. Markovsky, D. Aurbach and D. T. Major, Phys. Chem. Chem. Phys., 2016, 18, 6799–6812 RSC.
- K. Luo, M. R. Roberts, R. Hao, N. Guerrini, D. M. Pickup, Y.-S. Liu, K. Edström, J. Guo, A. V. Chadwick, L. C. Duda and P. G. Bruce, Nat. Chem., 2016, 8, 1–17 CrossRef.
- Z. Li, N. a. Chernova, M. Roppolo, S. Upreti, C. Petersburg, F. M. Alamgir and M. S. Whittingham, J. Electrochem. Soc., 2011, 158, A516 CrossRef CAS.
- S.-H. Kang, P. Kempgens, S. Greenbaum, a. J. Kropf, K. Amine and M. M. Thackeray, J. Mater. Chem., 2007, 17, 2069 RSC.
- A. N. Mansour, L. Croguennec and C. Delmas, Electrochem. Solid-State Lett., 2005, 8, A544 CrossRef CAS.
- J. R. Croy, M. Balasubramanian, D. Kim, S.-H. Kang and M. M. Thackeray, Chem. Mater., 2011, 23, 5415–5424 CrossRef CAS.
- S. M. Bak, E. Hu, Y. Zhou, X. Yu, S. D. Senanayake, S. J. Cho, K. B. Kim, K. Y. Chung, X. Q. Yang and K. W. Nam, ACS Appl. Mater. Interfaces, 2014, 6, 22594–22601 CrossRef CAS PubMed.
- D. Y. W. Yu and K. Yanagida, J. Electrochem. Soc., 2011, 158, A1015 CrossRef CAS.
- S.-T. Myung, F. Maglia, K.-J. Park, C. S. Yoon, P. Lamp, S.-J. Kim and Y.-K. Sun, ACS Energy Lett., 2017, 2, 196–223 CrossRef CAS.
- S.-T. Myung, K.-S. Lee, Y.-K. Sun and H. Yashiro, J. Power Sources, 2011, 196, 7039–7043 CrossRef CAS.
- L. Li, L. Wang, X. Zhang, M. Xie, F. Wu and R. Chen, ACS Appl. Mater. Interfaces, 2015, 7, 21939–21947 CrossRef CAS PubMed.
- J. P. Pender, G. Jha, D. H. Youn, J. M. Ziegler, I. Andoni, E. J. Choi, A. Heller, B. S. Dunn, P. S. Weiss, R. M. Penner and C. B. Mullins, ACS Nano, 2020, 14, 1243–1295 CrossRef CAS PubMed.
- T. Li, X. Z. Yuan, L. Zhang, D. Song, K. Shi and C. Bock, Electrochem. Energy Rev., 2020, 3, 43–80 CrossRef.
- M. D. Radin, S. Hy, M. Sina, C. Fang, H. Liu, J. Vinckeviciute, M. Zhang, M. S. Whittingham, Y. S. Meng and A. Van der Ven, Adv. Energy Mater., 2017, 7, 1602888 CrossRef.
- W. Liu, P. Oh, X. Liu, M.-J. Lee, W. Cho, S. Chae, Y. Kim and J. Cho, Angew. Chem., Int. Ed., 2015, 54, 4440–4457 CrossRef CAS.
- S.-K. Jung, H. Gwon, J. Hong, K.-Y. Park, D.-H. Seo, H. Kim, J. Hyun, W. Yang and K. Kang, Adv. Energy Mater., 2014, 4, 1300787 CrossRef.
- A. Manthiram, Nat. Commun., 2020, 11, 1–9 CrossRef PubMed.
- S. Hwang, W. Chang, S. M. Kim, D. Su, D. H. Kim, J. Y. Lee, K. Y. Chung and E. a Stach, Chem. Mater., 2014, 26, 1084–1092 CrossRef CAS.
- W. Li, A. Dolocan, P. Oh, H. Celio, S. Park, J. Cho and A. Manthiram, Nat. Commun., 2017, 8, 14589 CrossRef.
- W. Zhao, J. Zheng, L. Zou, H. Jia, B. Liu, H. Wang, M. H. Engelhard, C. Wang, W. Xu, Y. Yang and J. G. Zhang, Adv. Energy Mater., 2018, 8, 1–9 Search PubMed.
- M. Gauthier, T. J. Carney, A. Grimaud, L. Giordano, N. Pour, H.-H. Chang, D. P. Fenning, S. F. Lux, O. Paschos, C. Bauer, F. Maglia, S. Lupart, P. Lamp and Y. Shao-Horn, J. Phys. Chem. Lett., 2015, 6, 4653–4672 CrossRef CAS.
- R. Hausbrand, G. Cherkashinin, H. Ehrenberg, M. Gröting, K. Albe, C. Hess and W. Jaegermann, Mater. Sci. Eng., B, 2015, 192, 3–25 CrossRef CAS.
- G. Cherkashinin, M. Motzko, N. Schulz, T. Späth and W. Jaegermann, Chem. Mater., 2015, 27, 2875–2887 CrossRef CAS.
- M. Weiss, F. J. Simon, M. R. Busche, T. Nakamura, D. Schröder, F. H. Richter and J. Janek, Electrochem. Energy Rev., 2020, 3, 221–238 CrossRef.
- T. R. Jow, S. A. Delp, J. L. Allen, J.-P. Jones and M. C. Smart, J. Electrochem. Soc., 2018, 165, A361–A367 CrossRef CAS.
- P. M. Chekushkin, I. S. Merenkov, V. S. Smirnov, S. A. Kislenko and V. A. Nikitina, Electrochim. Acta, 2021, 372, 137843 CrossRef CAS.
- I. Takahashi, H. Kiuchi, A. Ohma, T. Fukunaga and E. Matsubara, J. Phys. Chem. C, 2020, 124, 9243–9248 CrossRef CAS.
- D. Becker, G. Cherkashinin, R. Hausbrand and W. Jaegermann, J. Phys. Chem. C, 2014, 118, 962–967 CrossRef CAS.
- R. Hausbrand, D. Becker and W. Jaegermann, Prog. Solid State Chem., 2014, 42, 175–183 CrossRef CAS.
- L. Qiu, S. He, L. K. Ono and Y. Qi, Adv. Energy Mater., 2020, 10, 1902726 CrossRef CAS.
- S. Wang, T. Sakurai, W. Wen and Y. Qi, Adv. Mater. Interfaces, 2018, 1800260 CrossRef.
- J. Zhi, S. Li, M. Han, Y. Lou and P. Chen, Adv. Energy Mater., 2018, 8, 1–11 Search PubMed.
- Y. Li, L. Cui, C. Tan, X. Fan, Q. Pan, Y. Chu, S. Hu, F. Zheng, H. Wang and Q. Li, Chem. Eng. J., 2022, 430, 132985 CrossRef CAS.
- D. Kim, J. M. Lim, Y. G. Lim, J. S. Yu, M. S. Park, M. Cho and K. Cho, Chem. Mater., 2015, 27, 6450–6456 CrossRef CAS.
- Y. M. Lee, K. M. Nam, E. H. Hwang, Y. G. Kwon, D. H. Kang, S. S. Kim and S. W. Song, J. Phys. Chem. C, 2014, 118, 10631–10639 CrossRef CAS.
- J. Yuan, J. Wen, J. Zhang, D. Chen and D. Zhang, Electrochim. Acta, 2017, 230, 116–122 CrossRef CAS.
- T. Eriksson, A. M. Andersson, C. Gejke, T. Gustafsson and J. O. Thomas, Langmuir, 2002, 18, 3609–3619 CrossRef CAS.
- K. Edstr, T. Gustafsson and J. O. Thomas, Electrochim. Acta, 2004, 50, 397–403 CrossRef.
- D. T. Nguyen, J. Kang, K. M. Nam, Y. Paik and S. W. Song, J. Power Sources, 2016, 303, 150–158 CrossRef CAS.
- N. Tran, L. Croguennec, M. Ménétrier, F. Weill, P. Biensan, C. Jordy and C. Delmas, Chem. Mater., 2008, 20, 4815–4825 CrossRef CAS.
- M. Noh and J. Cho, J. Electrochem. Soc., 2013, 160, A105–A111 CrossRef CAS.
- T. Eriksson, A. M. Andersson, A. G. Bishop, C. Gejke, T. Gustafsson and J. O. Thomas, J. Electrochem. Soc., 2002, 149, A69 CrossRef CAS.
- A. M. Andersson, D. P. Abraham, R. Haasch, S. MacLaren, J. Liu and K. Amine, J. Electrochem. Soc., 2002, 149, A1358 CrossRef CAS.
- J. A. Gilbert, I. A. Shkrob and D. P. Abraham, J. Electrochem. Soc., 2017, 164, A389–A399 CrossRef CAS.
- W. Hua, B. Schwarz, R. Azmi, M. Müller, M. S. Dewi Darma, M. Knapp, A. Senyshyn, M. Heere, A. Missyul, L. Simonelli, J. R. Binder, S. Indris and H. Ehrenberg, Nano Energy, 2020, 78, 105231 CrossRef CAS.
- D. Mohanty and H. Gabrisch, J. Power Sources, 2012, 220, 405–412 CrossRef CAS.
|
| This journal is © The Royal Society of Chemistry 2023 |
Click here to see how this site uses Cookies. View our privacy policy here. 
 Open Access Article
 This Open Access Article is licensed under a Creative Commons Attribution-Non Commercial 3.0 Unported Licence
 *ab,
Luis K.
Ono
*ab,
Luis K.
Ono