Metastable properties of a garnet type Li5La3Bi2O12 solid electrolyte towards low temperature pressure driven densification†
Daniele
Campanella
 ae,
Sergey
Krachkovskiy
 a,
Giovanni
Bertoni
 b,
Gian Carlo
Gazzadi
b,
Maryam
Golozar
c,
Shirin
Kaboli
a,
Sylvio
Savoie
a,
Gabriel
Girard
a,
Alina Cristina
Gheorghe Nita
a,
Kirill
Okhotnikov
b,
Gian Carlo
Gazzadi
b,
Maryam
Golozar
c,
Shirin
Kaboli
a,
Sylvio
Savoie
a,
Gabriel
Girard
a,
Alina Cristina
Gheorghe Nita
a,
Kirill
Okhotnikov
 d,
Zimin
Feng
a,
Abdelbast
Guerfi
a,
Ashok
Vijh
a,
Raynald
Gauvin
c,
Daniel
Bélanger
 e and
Andrea
Paolella
 *af
*af
aCentre d'Excellence en Électrification des Transports et Stockage d'Énergie, Hydro-Québec, 1806 Boulevard Lionel-Boulet, Varennes, Québec J3X 1S1, Canada
bIstituto Nanoscienze, Consiglio Nazionale delle Ricerche, Via Campi 213/A, 41125 Modena, Italy
cMcGill University, Mining & Materials Engineering Department, 3610 University Street, Montréal, Québec H3A 0C5, Canada
dIndependent Researcher, 31-421 Reduta 38/9, Kraków, Poland
eUniversité du Québec à Montréal (UQAM), Département de Chimie, 2101 Rue Jeanne-Mance, Montréal, Québec H3C 3P8, Canada
fAustrian Institute of Technology, Battery Technologies, Giefinggasse 2, 1210, Wien, Austria. E-mail: andrea.paolella@ait.ac.at
First published on 28th November 2022
Abstract
Solid state electrolytes represent an attractive alternative to liquid electrolytes for rechargeable batteries. However, the fabrication of batteries with ceramic materials requires high temperature that could be detrimental to their electrochemical performance. In this work, we show that it's possible to densify a garnet-type Li5La3Bi2O12 solid electrolyte at low temperature (600 °C) with respect to standard high sintering temperature (T > 1000 °C) used for zirconium-based Li7La3Zr2O12 doped garnet. Li5La3Bi2O12 showed a high conductivity (1.2 × 10⁻⁴ S cm−1) after hot pressing at 600 °C. The synthesis conditions have been optimized: at 700 °C we observed the presence of the LiLa2O3.5 phase as a consequence of LLBO metastability, and the formation mechanism has been described by density functional theory (DFT) and density functional perturbation theory (DFPT) calculations. Moreover, we have reported the application of small amounts of LLBO as a sintering aid (5–10%) in the densification of LLZTO. Our investigation successfully demonstrated that LLBO introduction positively affects the densification process and global performances of LLZTO garnet, allowing us to obtain an ionic conductivity higher than 10−4 S cm−1 after annealing at 600 °C.
Introduction
In modern days, one of the most crucial elements in taking full advantage of new renewable energy sources is the evolution and production of reliable and efficient energy storage systems. Among the explored technologies, lithium-ion batteries1,2 are still considered the most impactful high-performance electrochemical storage system.3 Despite their worldwide diffusion and their noteworthy properties, a series of major challenges still require to be addressed. The use of organic flammable liquid electrolytes, in particular, represents an important safety concern that hinders the widespread deployment of this technology.4,5 Furthermore, flammable electrolytes6 limit the practical application of metallic lithium as an anode because of the possible formation of lithium dendrites7 that can lead to short circuits with disastrous consequences. Solid electrolytes can offer a viable alternative 8–11 to conventional organic liquids, acting as a physical barrier against short circuits and, at the same time, increasing the energy density of the battery. In recent years, numerous solid electrolytes based on polymeric materials,12–14 oxide or sulfide-based ceramics15–18 and polymer-ceramic hybrid composites 19–22 were investigated and reported in the literature. Li-rich garnets15,23 such as Li7La3Zr2O12 (LLZO) are promising candidates for practical battery applications, because of their interesting mechanical properties and high ionic conductivity, up to 10−4 S cm−1.24 However, full-ceramic solid electrolytes typically require strict synthesis conditions, such as high densification temperatures (well above 800 °C) over a long annealing time: LLZO with gallium25 or aluminium23 doping can require a synthesis temperature of 1000 °C for 10–12 h. Moreover, high synthesis temperatures are not desirable due to the evolution of side reactions with high-voltage working cathodes: for example, LiNi0.6Mn0.2Co0.2O2 (NMC622) and LLZO may lead to the formation of Li2CO3, La2Zr2O7 and La(Ni,Co)O3 at 700 °C.26 Despite these shortcomings, garnet materials exhibit the widest electrochemical stability window when compared with other classes of solid electrolytes, like NASICONs or sulfides.27 Within this wide family of materials, bismuth-based garnets, such as Li5La3Bi2O12 (LLBO), have been investigated due to their lower synthesis temperature (∼800 °C), as reported by Murugan et al.,23 who observed for this material a total conductivity of 1.9 × 10⁻⁵ S cm−1 at room temperature. A comparable value of conductivity was observed by Gao et al.:28 a ceramic pellet compacted at 300 MPa and subsequently annealed at 750 °C for 6 h presented a final conductivity of 2.4 × 10⁻⁵ S cm−1 at room temperature. Tin-replaced Li6La3BiSnO12 synthesized at 785 °C displays similar values of conductivity, about 0.85 × 10⁻⁴ S cm−1 at room temperature.29 The production of LLBO by the quenching method,30 which involves a rapid cooling of the material to room temperature, has been shown to increase the ionic conductivity up to 2 × 10⁻⁴ S cm−1,31 about ten times the value observed for the conventional synthesis. In the present work, we explored the densification mechanism of LLBO and thoroughly investigated its metastability properties, which allow a lower temperature densification, by using density functional theory (DFT) and density functional perturbation theory (DFPT) calculations. We found that hot pressing LLBO at 600° C led to a remarkable ionic conductivity (>10−4 S cm−1). In the present study, limited amounts of LLBO were also explored as a sintering aid for Li6.4La3Zr1.4Ta0.6O12 (LLZTO) and we were able to perform the densification of Ta-doped LLZO at 600 °C, achieving an ionic conductivity of 1.5 × 10⁻⁴ S cm−1.Materials and methods
M.1 Materials and preparation
Li5La3Bi2O12 (LLBO) was synthesized via a conventional solid-state route. Anhydrous LiOH, La2O3 and Bi2O3 synthesis precursors were purchased from Sigma Aldrich. Commercial Ta-doped LLZO (LLZTO) was purchased from Ampcera. LiOH, La2O3 and Bi2O3 were mixed in a 5.5![[thin space (1/6-em)]](https://www.rsc.org/images/entities/char_2009.gif) :
:![[thin space (1/6-em)]](https://www.rsc.org/images/entities/char_2009.gif) 1.5
1.5![[thin space (1/6-em)]](https://www.rsc.org/images/entities/char_2009.gif) :
:![[thin space (1/6-em)]](https://www.rsc.org/images/entities/char_2009.gif) 1 molar ratio and subsequently milled for 12 h in a Retsch PM-100 planetary ball mill. The final mixture was annealed at 775 °C in a muffle furnace for 6 h and subsequently quenched to room temperature. The LLZTO–LLBO composites were prepared by mixing LLZTO and LLBO in a SPEX mixer in appropriate mass ratios.
1 molar ratio and subsequently milled for 12 h in a Retsch PM-100 planetary ball mill. The final mixture was annealed at 775 °C in a muffle furnace for 6 h and subsequently quenched to room temperature. The LLZTO–LLBO composites were prepared by mixing LLZTO and LLBO in a SPEX mixer in appropriate mass ratios.
M.2 Hot pressing
The resulting powders were densified by hot pressing under a flowing Ar atmosphere. The pellets were prepared using about 1 g of powder. The annealing has been performed in a 16 mm Si3N4 die with WC mobile parts, to allow the correct densification and avoid pellet gluing, and thin carbon paper films were set up on both sides of the powder to act as a conductive coating for the material. The final densification of LLBO was carried out at 550 °C, 600 °C, 650 °C and 700 °C for 1 h with the application of a pressure of 56 MPa and a temperature ramp of 20 °C min−1 during the heating step. LLZTO/LLBO mixtures were densified at 600 °C under the same working conditions.M.3 Scanning electron microscopy
Chemical mapping of the materials was performed via an energy dispersive X-ray spectrometer (EDS) in the scanning mode. Pellet cross sections were obtained using an IM4000 Plus (Hitachi, Japan) Ar ion mill with a beam sputtering energy of 6 kV, applying a fast 30° rotation for 4 h. The cross-section surfaces were investigated using a Lyra 3 (TESCAN) scanning electron microscope (SEM) and the elemental composition was obtained with an Extreme (Oxford Instruments) windowless energy dispersive spectrometer (EDS). EDS maps were also acquired at higher spatial resolution from thin cross-sectional samples using a scanning transmission microscope (Thermo-Fisher Scientific Talos 200S) at an incident energy of 200 kV, along with annular dark field (ADF) images, which are sensitive to the elemental composition (Z-contrast). Thin cross sections (ca. 100 nm in thickness with an area of a few microns) were successfully obtained via focused-ion beam milling (FIB) after the deposition of a thin layer of metallorganic Pt at the surface to avoid damage and Ga implantation during milling. To enhance the signal from the EDS quantification, compression/denoising using principal component analysis (PCA) was performed, by keeping the first 10 components in the spectral images.M.4 Electrochemical analysis
After the densification, the resulting ceramic pellets were sandwiched between two stainless steel disks in a coin cell. Electrochemical impedance spectroscopy measurements were performed with a BioLogic VMP-300 potentiostat in a temperature range from 20 to 80 °C (with a 5 °C step). The electrical conductivity of the samples was calculated considering the sample dimensions, the distance between the electrodes and the values of resistance (Ω) obtained. Cyclic voltammetry was performed in a Li//LLBO//graphite cell at a 0.5 mV s−1 scan rate.M.5 Nuclear magnetic resonance (NMR)
7Li NMR diffusion measurement experiments were performed on a 500 MHz WB Bruker AVANCE NEO NMR spectrometer using a Diff50 probe and 8 mm double resonance 7Li/19F RF insert at 50 °C. A stimulated echo with a longitudinal eddy current delay pulse sequence was used for the measurement. The gradient pulse was in the range of 1.0–1.5 ms and the diffusion time was in the range of 400–800 ms depending on the sample. The gradient strength was varied in 16 equidistant steps from 100 G cm−1 to 2500 G cm−1.M.6 Modelling
The DFT and DFPT calculations were conducted using VASP32 in a project-augmented wave scheme. The Perdew–Burke–Ernzerhof exchange–correlation functional33 was adopted. The energy cutoff was set to 500 eV and structures were relaxed until the maximum force on every atom was below 0.01 eV Å−1. The vibrational free energies were obtained using Phonopy.34 The representing configurations of LLBO were chosen using the program supercell35 for the partial occupancy of Li in LLBO.Results and discussion
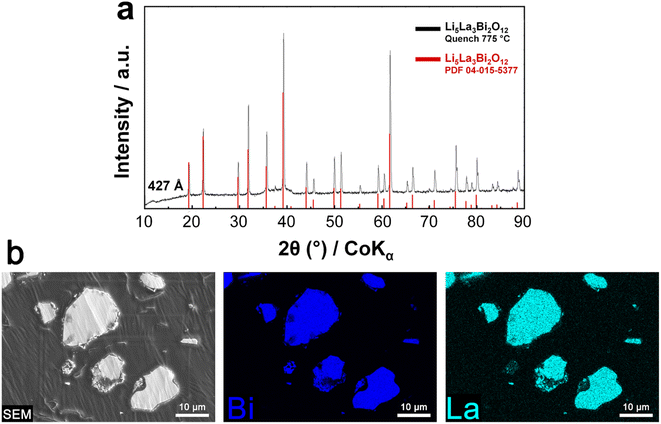
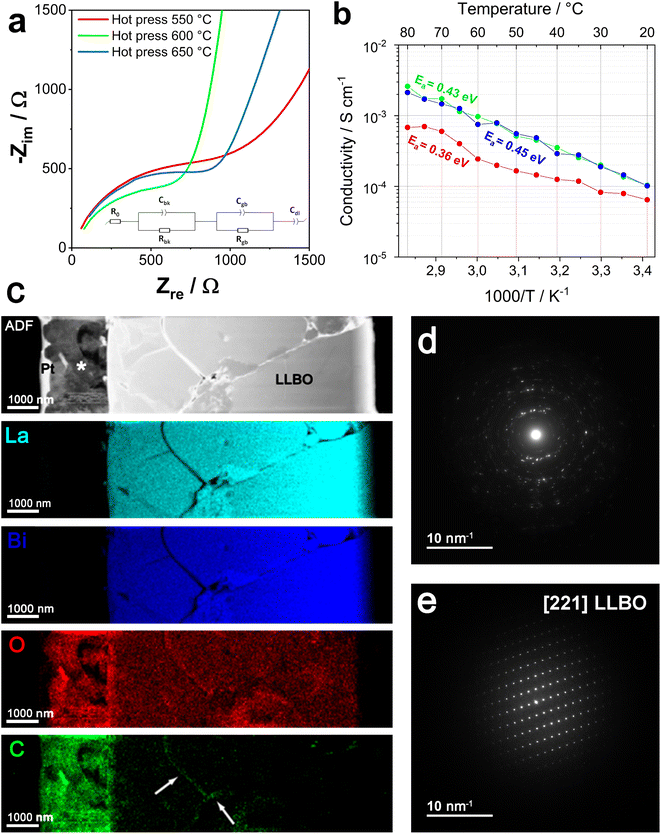
LLBO was synthesized by a solid state route (see the Materials and methods section for more details) by quenching the powder at 775 °C after 6 h of annealing, obtaining micron size particles having a pure phase as shown in Fig. 1a, while the scanning electron image (SEM) and the electron dispersion spectroscopy (EDS) mapping showing the La and Bi distribution of the final product are depicted in Fig. 1b.To unveil the effects of different densification temperatures on the ionic conductivity of LLBO, electrochemical impedance spectroscopy measurements were performed on hot-pressed pellets in a densification temperature range from 550 to 650 °C. Fig. 2a shows the Nyquist plots collected at room temperature for the samples annealed at 550, 600 and 650 °C and the Arrhenius plot for LLBO densified at different temperatures is reported in Fig. 2b. Fig. 2a also presents the equivalent circuit used for the fitting of the impedance data, in which the two separate RC elements are related to the bulk and grain boundary contributions, respectively. The conductivity curves show a non-dissimilar impedance behavior for the materials. In particular, the samples hot-pressed at 600 °C and 650 °C exhibit values of total ionic conductivity of about 1.2 × 10⁻⁴ S cm−1 at room temperature. Both values are sensibly higher than that for the LLBO sample densified at 550 °C (8 × 10⁻⁵ S cm−1). At higher densification temperature (700 °C), the pellet is easily broken. Fig. S1† reports the values of the apparent density of the LLBO samples densified at different temperatures and it shows that the density has an increasing trend with the densification temperature, reaching a value of 5.92 g cm−3 for the sample densified at 700 °C, about 94% of the theoretical density value of pure LLBO (6.234 g cm−3).36
In Fig. 2c, the ADF cross-section image and the EDS elemental mappings of the LLBO sample hot-pressed at 600 °C are reported. In the image, the metallorganic Pt protecting layer deposited on the sample before FIB milling is indicated (Pt), together with a ca. 2 μm carbonate layer (*) formed at the surface. In the EDS mapping, the uniform elemental distribution of La, Bi and O throughout the densified pellet can be visibly observed. The strong relative signals for O and C denote the formation of a thin carbonate layer near the surface of the sample. Moreover, the C map displays a clear presence of signals along the cracks (indicated by the arrows in the map), which point out the evolution of carbonate also at the boundaries between distinct LLBO crystals. The polycrystalline nature of lithium carbonate is confirmed by TEM observations, by which it can be observed that the respective electron diffraction pattern (reported in Fig. 2d) shows no preferential orientation in contrast with the pattern for LLBO (Fig. 2e).
Fig. S2† shows the CV response of hot-pressed LLBO in a C//LLBO//Li cell in a potential interval between 0 and 6 V at a scan rate of 0.5 mV s−1. The presence of an irreversible peak at high potential (>5 V vs. Li+/Li) can be clearly seen during the first cycle, which indicates an irreversible redox Bi3+/Bi5+ reaction.
The cycling stability of hot-pressed LLBO towards Li is furtherly confirmed in Fig. S3,† which reports the performance of a Li//LLBO//Li symmetric cell. The measurement was carried out at a current of 0.3 mA cm−2 (5 h charge and 5 h discharge) and a temperature of 50 °C and, as observed from the stability curve, the cell exhibits a low polarization over a period of 300 h, indicating a high affinity of the material towards lithium.
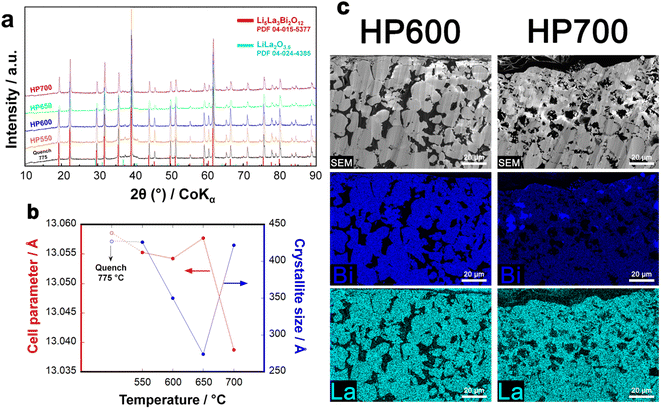
Hot pressed LLBO shows a metastability range: after the hot pressing of LLBO, a sensitive increment in LiLaO2 impurities can be observed while the hot pressing temperature increases, as shown in the XRD pattern in Fig. 3a. The LLBO structure undergoes an important shrinkage in the cell parameter (Fig. 3b, red line) when passing from 650 to 700 °C, indicating the occurrence of a side reaction at operating temperatures higher than 650 °C. Interestingly, the crystallite size decreases when the LLBO sample is annealed at 650 °C (430 Å to 270 Å) to subsequently increase again after annealing at 700 °C (430 Å) as shown in Fig. 3b (blue line). The cross-section SEM images and EDS mapping in Fig. 3c show a homogeneous distribution of La and Bi for the sample densified at 600 °C. On the other hand, the elemental distribution for the sample hot-pressed at 700 °C exhibits specific areas with a larger presence of Bi and a relatively lower presence of La, which denote a partial elemental segregation in the form of Bi2O3 that is formed according to:
| 4Li5La3Bi2O12 → 4Bi2O3 + 6LiLa2O3.5 + 7Li2O + 4O2↑ |
Fig. S4† reports a higher magnification image of LLBO hot-pressed at 600 °C, which clearly shows the uniform presence of La on the surface of the sample.
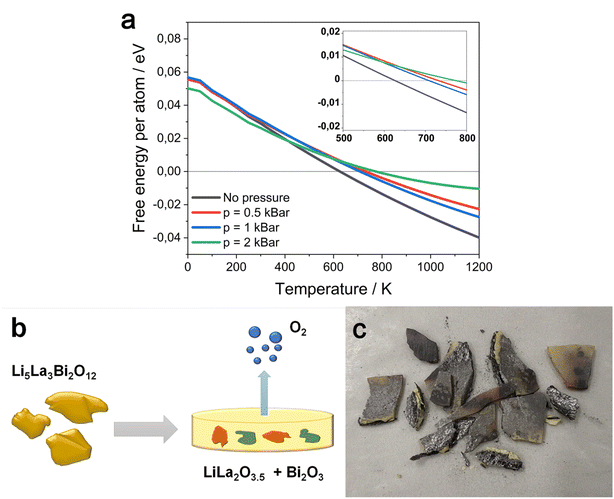
In addition, the working equipment was not sealed, which makes the evolution of oxygen even easier. Fortunately, according to first principles calculations with harmonic approximation, the decomposition temperature of Li5La3Bi2O12 could be raised by applying external pressure. Density functional theory (DFT) and density functional perturbation theory (DFPT) calculations allowed us to derive the free energies of the solid phases using harmonic approximation. Basically, the values of free energy are approximated with the sum of zero-temperature binding energy from DFT, the kinetic energies are obtained from their harmonic vibration and the temperature dependent term involving the entropy is derived from the harmonic vibration, as stated in the formula:
| G ≅ F = Ebind + Evib − TSvib |
where E is the value of binding energy from DFT, c is the constant over-binding correction, R is the gas constant, T is the temperature in kelvin, p is the pressure (1 atm in this case, as the chamber is not sealed), V is the volume of the gas, S is the entropy and H is the enthalpy. The enthalpy and entropy of O2 gas are adopted from JANAF tables. This way, we can estimate the Gibbs energy change for this reaction. If the change is negative, the decomposition of Li5La3Bi2O12 is favored in the equilibrium state. The results of Gibbs energy change are shown in Fig. 4. We can see that the decomposition is more and more favored as the temperature rises, in general. Without external pressure applied, the equilibrium decomposition starts above 626 K (353 °C); nevertheless, under a pressure of 0.5 kbar, the equilibrium decomposition temperature increases to 723 K (450 °C). Further increasing the pressure to 2 kbar, the decomposition temperature keeps rising up to 775 K (502 °C). Although DFT and DFPT can generate significant error in predicting temperatures, a visible tendency in the increase of decomposition temperature under applied pressure is observed. The decomposed LLBO sample after hot pressing at 700 °C is shown in Fig. 4c.
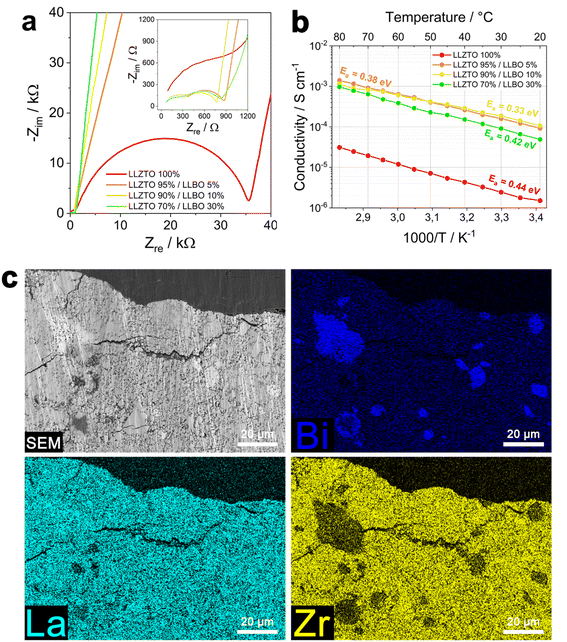
Considering the present results, we investigated the effects of LLBO as a sintering aid for the densification of LLZTO at 600 °C. The Nyquist plots of pristine LLZTO and LLZTO/LLBO samples are shown in Fig. 5a. The Arrhenius plot (Fig. 5b) shows the conductivity trend in the range of temperature from 20 to 80 °C. The highest value of conductivity is reported for LLZTO with the addition of 10% LLBO, showing a value of 1.5 × 10⁻⁴ S cm−1 at room temperature, while the sample with 5% LLBO displays a slightly lower value (9 × 10⁻⁵ S cm−1). Above 50 °C, a trend reversal is observed and LLZTO/5% LLBO exhibits a higher conductivity than LLZTO/10% LLBO. Both samples have a superior ionic conductivity to the pristine LLZTO sample (1 × 10⁻⁶ S cm−1). Interestingly, the introduction of larger amounts of LLBO leads to a significant decrement in the conductivity, as observed for the sample with 30% LLBO, which shows the lowest ionic conductivity at room temperature (4.9 × 10⁻⁵ S cm−1). The graph reported in Fig. S5† shows the values of the apparent density of a series of LLZTO/LLBO samples according to the relative LLBO content. The highest values of density are observed for the samples prepared with 30% LLBO, around 5.4 g cm−3, whilst increasing LLBO content further leads to a decrement in density (LLZTO/50% LLBO) to a value of 4.94 g cm−3. The reasons behind such a discrepancy may possibly depend on the hot-pressing process itself; high temperature treatment can lead to partial material loss, which can impact the production of the pellets and the density of the material, and therefore measuring the effective values of density is often complicated. Additional electrochemical investigation on the material involved a cyclic voltammetry test (Fig. S6†), performed on LLZTO/10% LLBO. The pattern exhibits a broad irreversible peak at high voltages (>4 V vs. Li+/Li) in the oxidation step during the first cycle, which may indicate the bismuth oxidation reaction from Bi3+ to Bi5+. The cycling stability of the hot-pressed material was also investigated and Fig. S7† reports the performance of a Li//LLZO–LLBO//Li symmetric cell. Measurement was performed at a current of 0.3 mA cm−2 and a temperature of 50 °C. The graph shows that the symmetric cell exhibits a higher polarization compared with the cell with pristine LLBO, with an initial polarization of 1 V during both charge and discharge, which slightly decreases to 0.5 V after 300 h of cycling. The presence of more resistive LLZO as a main component can explain the difference in performance between the cells, LLZO being a more resistive material than LLBO.
The LLZTO sample containing 10% LLBO was subsequently analyzed via SEM and EDS and the presence of local LLBO-rich islands dispersed throughout the LLZTO matrix was observed, as reported in Fig. 5c. These observations suggest the absence of a bulk reaction between the two phases of LLZTO and LLBO, while at the same time the structure of the LLBO phase is preserved. Fig. S7† shows a higher magnification SEM image of LLZTO/10% LLBO, in which the uniform distribution of La on the whole surface of the pellet is clearly visible. The XRD diffraction pattern of hot-pressed LLZTO/10% LLBO is reported in Fig. S8† and it can be observed that after the hot-pressing treatment the LLZO cubic phase is preserved and no significant presence of impurities is observed in the structure.
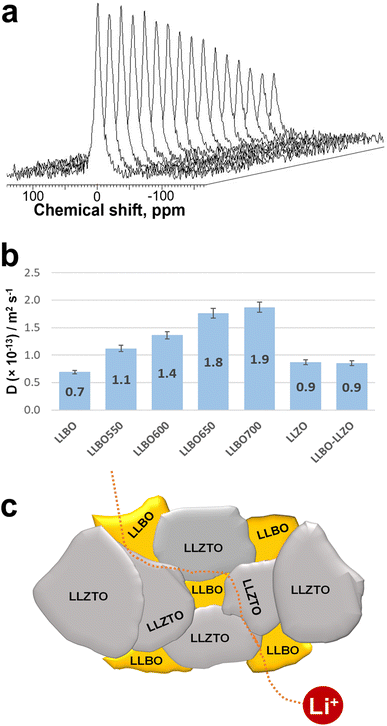
To better understand the Li transport properties of the material, Li diffusion coefficients were measured by the 7Li pulsed-field gradient nuclear magnetic resonance (PFG NMR) technique in LLBO samples densified at different temperatures, as well as in LLZTO with 10% LLBO composite hot pressed at 600 °C. Short-duration magnetic field gradient pulses are introduced into the spin-echo sequence to detect particle displacement in PFG NMR experiments.37 The resultant signal intensity (I) depends on the parameters of the applied gradients and the self-diffusion coefficient (D) of the observed species as the following equation: I = I0e−BD, where I0 is the NMR signal intensity without gradient application and B represents experimental conditions as: B = γ2g2δ2(Δ − δ/3) with γ – gyromagnetic ratio of the observed nuclei, g and δ – strength and duration of the gradient pulses, and Δ – delay between the encoding and the decoding gradients. An example of stacked 7Li PFG NMR spectra of the LLBO sample collected at different gradient strengths (g varied from 100 G cm−1 to 2500 G cm−1 in 16 equidistant steps) is shown in Fig. 6a. The obtained values of lithium diffusion coefficients for all samples measured that way are listed in Fig. 6b. The mean squared displacement of Li during the NMR experiment could be estimated as  With D ∼ 10−13 m2 s−1 and with a diffusion time during the PFG NMR experiment Δ = 0.5 s, the displacement d is about 0.3 μm. This is an order of magnitude larger than the crystallite size (Fig. 3b), but smaller than the crystal size of the analyzed compounds. It means that the obtained values of Li diffusion coefficients reflect mostly Li mobility inside secondary particles (through crystallites and grain boundaries between them), while Li transition between the particles has a negligible effect on the collected data. One can see that Li diffusion in LLBO depends on densification conditions. It means that densification at higher temperature promotes a better contact quality between crystallites decreasing the grain boundary effect. In contrast, there is no difference in Li diffusion between LLZTO and LLZTO/10% LLBO samples. Possibly, a hot pressing temperature of 600 °C is not high enough to affect LLZO crystals. At the same time, a partial incorporation of LLBO, with higher Li diffusivity, increases the bulk conductivity of the electrolyte (Fig. 5b). LLBO is shown to help the densification of LLZTO by keeping secondary particles closer as reported in the scheme in Fig. 6c.
Conclusions
In the present work, we successively reported the pressure driven densification of a garnet-type Li5La3Bi2O12 solid electrolyte at 600 °C, a value of temperature significantly lower than the standard temperature (T > 1000 °C) typically required for zirconium-based Li7La3Zr2O12. By the application of hot pressing, the densification conditions for Li5La3Bi2O12 have been optimized, leading to a high ionic conductivity of 1.2 × 10⁻⁴ S cm−1 after hot pressing at 600 °C. Treatment performed at 700 °C brought about a partial segregation of bismuth and the formation of a LiLa2O3.5 secondary phase as a consequence of LLBO metastability. The impurity formation mechanism has been subsequently described by density functional theory (DFT) and density functional perturbation theory (DFPT) calculations. Moreover, we demonstrated that LLBO may be usefully employed as the sintering aid (5–10%) for the LLZTO solid electrolyte, allowing us to obtain an ionic conductivity higher than 10−4 S cm−1 after densification at low temperature (600 °C).Conflicts of interest
There are no conflicts of interest to declare.Acknowledgements
This research was funded by Hydro-Québec's Center of Excellence in Transportation Electrification and Energy Storage, Varennes, Québec. A. P. wants to thank Dr Chisu Kim, Dr Hendrix Demers, Daniel Clement of CEETSE (Canada) and Sergio Marras of Italian Institute of Technology (Italy) for their useful suggestions. D. C. acknowledges the financial support of Mitacs.References
- M. Armand and J.-M. Tarascon, Building Better Batteries, Nature, 2008, 451(7179), 652–657, DOI:10.1038/451652a
.
- D. Di Lecce, R. Verrelli and J. Hassoun, Lithium-Ion Batteries for Sustainable Energy Storage: Recent Advances towards New Cell Configurations, Green Chem., 2017, 3442–3467, 10.1039/c7gc01328k
.
- B. Scrosati, J. Hassoun and Y.-K. Sun, Lithium-Ion Batteries. A Look into the Future, Energy Environ. Sci., 2011, 4(9), 3287, 10.1039/c1ee01388b
.
- S. J. Harris, A. Timmons and W. J. Pitz, A Combustion Chemistry Analysis of Carbonate Solvents Used in Li-Ion Batteries, J. Power Sources, 2009, 193(2), 855–858, DOI:10.1016/j.jpowsour.2009.04.030
.
- D. Lisbona and T. Snee, A Review of Hazards Associated with Primary Lithium and Lithium-Ion Batteries, Process Saf. Environ. Prot., 2011, 89(6), 434–442, DOI:10.1016/j.psep.2011.06.022
.
- M. Weiss, R. Ruess, J. Kasnatscheew, Y. Levartovsky, N. R. Levy, P. Minnmann, L. Stolz, T. Waldmann, M. Wohlfahrt-Mehrens, D. Aurbach, M. Winter, Y. Ein-Eli and J. Janek, Fast Charging of Lithium-Ion Batteries: A Review of Materials Aspects, Adv. Energy Mater., 2021, 11(33), 2101126, DOI:10.1002/aenm.202101126
.
- L. Fan, S. Wei, S. Li, Q. Li and Y. Lu, Recent Progress of the Solid-State Electrolytes for High-Energy Metal-Based Batteries, Adv. Energy Mater., 2018, 8(11), 1702657, DOI:10.1002/aenm.201702657
.
- J. Li, C. Ma, M. Chi, C. Liang and N. J. Dudney, Solid Electrolyte: The Key for High-Voltage Lithium Batteries, Adv. Energy Mater., 2015, 5(4), 1401408, DOI:10.1002/aenm.201401408
.
- J. Janek and W. G. Zeier, A Solid Future for Battery Development, Nat. Energy, 2016, 1(9), 16141, DOI:10.1038/nenergy.2016.141
.
- Y.-S. Hu, Batteries: Getting Solid, Nat. Energy, 2016, 1(4), 16042, DOI:10.1038/nenergy.2016.42
.
- F. Zheng, M. Kotobuki, S. Song, M. O. Lai and L. Lu, Review on Solid Electrolytes for All-Solid-State Lithium-Ion Batteries, J. Power Sources, 2018, 389, 198–213, DOI:10.1016/j.jpowsour.2018.04.022
.
- R. C. Agrawal and G. P. Pandey, Solid Polymer Electrolytes: Materials Designing and All-Solid-State Battery Applications: An Overview, J. Phys. D: Appl. Phys., 2008, 41(22), 223001, DOI:10.1088/0022-3727/41/22/223001
.
- R. Khurana, J. L. Schaefer, L. A. Archer and G. W. Coates, Suppression of Lithium Dendrite Growth Using Cross-Linked Polyethylene/Poly(Ethylene Oxide) Electrolytes: A New Approach for Practical Lithium-Metal Polymer Batteries, J. Am. Chem. Soc., 2014, 136(20), 7395–7402, DOI:10.1021/ja502133j
.
- Z. Li, A. Li, H. H. Zhang, R. Lin, T. Jin, Q. Cheng, X. Xiao, W.-K. W. K. Lee, M. Ge, H. H. Zhang, A. Zangiabadi, I. Waluyo, A. Hunt, H. Zhai, J. J. J. Borovilas, P. Wang, X. Q. X.-Q. Yang, X. Chuan and Y. Yang, Interfacial Engineering for Stabilizing Polymer Electrolytes with 4V Cathodes in Lithium Metal Batteries at Elevated Temperature, Nano Energy, 2020, 72, 104655, DOI:10.1016/j.nanoen.2020.104655
.
- V. Thangadurai, S. Narayanan and D. Pinzaru, Garnet-Type Solid-State Fast Li Ion Conductors for Li Batteries: Critical Review, Chem. Soc. Rev., 2014, 43(13), 4714, 10.1039/c4cs00020j
.
- Y. Kato, S. Hori, T. Saito, K. Suzuki, M. Hirayama, A. Mitsui, M. Yonemura, H. Iba and R. Kanno, High-Power All-Solid-State
Batteries Using Sulfide Superionic Conductors, Nat. Energy, 2016, 1(4), 16030, DOI:10.1038/nenergy.2016.30
.
- Z. Gao, H. Sun, L. Fu, F. Ye, Y. Zhang, W. Luo and Y. Huang, Promises, Challenges, and Recent Progress of Inorganic Solid-State Electrolytes for All-Solid-State Lithium Batteries, Adv. Mater., 2018, 30(17), 1705702, DOI:10.1002/adma.201705702
.
- Z. Ma, H. G. Xue and S. P. Guo, Recent Achievements on Sulfide-Type Solid Electrolytes: Crystal Structures and Electrochemical Performance, J. Mater. Sci., 2018, 3927–3938, DOI:10.1007/s10853-017-1827-6
.
- J. Zheng, H. Dang, X. Feng, P.-H. Chien and Y.-Y. Hu, Li-Ion Transport in a Representative Ceramic–Polymer–Plasticizer Composite Electrolyte: Li7La3Zr2O12–Polyethylene Oxide–Tetraethylene Glycol Dimethyl Ether, J. Mater. Chem. A, 2017, 5(35), 18457–18463, 10.1039/C7TA05832B
.
- L. Chen, Y. Li, S. P. Li, L. Z. Fan, C. W. Nan and J. B. Goodenough, PEO/Garnet Composite Electrolytes for Solid-State Lithium Batteries: From “Ceramic-in-Polymer” to “Polymer-in-Ceramic”, Nano Energy, 2018, 46, 176–184, DOI:10.1016/j.nanoen.2017.12.037
.
- B. Commarieu, A. Paolella, J. C. Daigle and K. Zaghib, Toward High Lithium Conduction in Solid Polymer and Polymer–Ceramic Batteries, Curr. Opin. Electrochem., 2018, 9, 56–63, DOI:10.1016/j.coelec.2018.03.033
.
- N. Wu, P.-H. Chien, Y. Li, A. Dolocan, H. Xu, B. Xu, N. S. Grundish, H. Jin, Y.-Y. Hu and J. B. Goodenough, Fast Li + Conduction Mechanism and Interfacial Chemistry of a NASICON/Polymer Composite Electrolyte, J. Am. Chem. Soc., 2020, 142(5), 2497–2505, DOI:10.1021/jacs.9b12233
.
- R. Murugan, V. Thangadurai and W. Weppner, Fast Lithium Ion Conduction in Garnet-Type Li7La3Zr2O12, Angew. Chem., Int. Ed., 2007, 46(41), 7778–7781, DOI:10.1002/anie.200701144
.
- Z. Huang, L. Chen, B. Huang, B. Xu, G. Shao, H. Wang, Y. Li and C.-A. Wang, Enhanced Performance of Li6.4La3Zr1.4Ta0.6O12 Solid Electrolyte by the Regulation of Grain and Grain Boundary Phases, ACS Appl. Mater. Interfaces, 2020, 12(50), 56118–56125, DOI:10.1021/acsami.0c18674
.
- M. Rawlence, A. N. Filippin, A. Wäckerlin, T.-Y. Lin, E. Cuervo-Reyes, A. Remhof, C. Battaglia, J. L. M. Rupp and S. Buecheler, Effect of Gallium Substitution on Lithium-Ion Conductivity and Phase Evolution in Sputtered Li 7–3 x Ga x La 3 Zr 2 O 12 Thin Films, ACS Appl. Mater. Interfaces, 2018, 10(16), 13720–13728, DOI:10.1021/acsami.8b03163
.
- Y. Kim, D. Kim, R. Bliem, G. Vardar, I. Waluyo, A. Hunt, J. T. Wright, J. P. Katsoudas and B. Yildiz, Thermally Driven Interfacial Degradation between Li7La3Zr2O12 Electrolyte and LiNi0.6Mn0.2Co0.2O2 Cathode, Chem. Mater., 2020, 32(22), 9531–9541, DOI:10.1021/acs.chemmater.0c02261
.
- F. Han, Y. Zhu, X. He, Y. Mo and C. Wang, Electrochemical Stability of Li 10 GeP 2 S 12 and Li 7 La 3 Zr 2 O 12 Solid Electrolytes, Adv. Energy Mater., 2016, 6(8), 1501590, DOI:10.1002/aenm.201501590
.
- Y. X. Gao, X. P. Wang, W. G. Wang, Z. Zhuang, D. M. Zhang and Q. F. Fang, Synthesis, Ionic Conductivity, and Chemical Compatibility of Garnet-like Lithium Ionic Conductor Li5La3Bi2O12, Solid State Ionics, 2010, 181(31–32), 1415–1419, DOI:10.1016/j.ssi.2010.08.012
.
- H. Peng, L. Xiao, Y. Cao and X. Luan, Synthesis and Ionic Conductivity of Li6La3BiSnO12 with Cubic Garnet-Type Structure via Solid-State Reaction, J. Cent. South Univ., 2015, 22(8), 2883–2886, DOI:10.1007/s11771-015-2821-2
.
- K. Minami, F. Mizuno, A. Hayashi and M. Tatsumisago, Lithium Ion Conductivity of the Li2S–P2S5 Glass-Based Electrolytes Prepared by the Melt Quenching Method, Solid State Ionics, 2007, 178(11–12), 837–841, DOI:10.1016/j.ssi.2007.03.001
.
- H. Peng, Y. Zhang, L. Li and L. Feng, Effect of Quenching Method on Li Ion Conductivity of Li5La3Bi2O12 Solid State Electrolyte, Solid State Ionics, 2017, 304, 71–74, DOI:10.1016/j.ssi.2017.03.030
.
- G. Kresse and J. Furthmüller, Efficient Iterative Schemes for Ab Initio Total-Energy Calculations Using a Plane-Wave Basis Set, Phys. Rev. B, 1996, 54(16), 11169–11186, DOI:10.1103/PhysRevB.54.11169
.
- J. P. Perdew, K. Burke and M. Ernzerhof, Generalized Gradient Approximation Made Simple, Phys. Rev. Lett., 1996, 77(18), 3865–3868, DOI:10.1103/PhysRevLett.77.3865
.
- A. Togo and I. Tanaka, First Principles Phonon Calculations in Materials Science, Scr. Mater., 2015, 108, 1–5, DOI:10.1016/j.scriptamat.2015.07.021
.
- K. Okhotnikov, T. Charpentier and S. Cadars, Supercell Program: A Combinatorial Structure-Generation Approach for the Local-Level Modeling of Atomic Substitutions and Partial Occupancies in Crystals, J. Cheminf., 2016, 8(1), 17, DOI:10.1186/s13321-016-0129-3
.
- H. Peng, Y. Zhang, L. Li and L. Feng, Effect of Quenching Method on Li Ion Conductivity of Li5La3Bi2O12 Solid State Electrolyte, Solid State Ionics, 2017, 304, 71–74, DOI:10.1016/j.ssi.2017.03.030
.
- K. S. Han, J. D. Bazak, Y. Chen, T. R. Graham, N. M. Washton, J. Z. Hu, V. Murugesan and K. T. Mueller, Pulsed Field Gradient Nuclear Magnetic Resonance and Diffusion Analysis in Battery Research, Chem. Mater., 2021, 33(22), 8562–8590, DOI:10.1021/acs.chemmater.1c02891
.
Footnote |
| † Electronic supplementary information (ESI) available. See DOI: https://doi.org/10.1039/d2ta04259b |
| This journal is © The Royal Society of Chemistry 2023 |

