 Open Access Article
Light-driven room temperature methane gas sensor based on Ag modified flower-like ZnO microsphere
Mengwei
Li
a,
Xueya
Sun
a,
Yihui
Wang
a,
Cong
Qin
b,
Jianliang
Cao
 bc and
Yan
Wang
 *ac
*ac
aCollege of Safety Science and Engineering, Henan Polytechnic University, Jiaozuo 454003, China. E-mail: yanwang@hpu.edu.cn
bCollege of Chemistry and Chemical Engineering, Henan Polytechnic University, Jiaozuo, 454003, China
cState Collaborative Innovation Center of Coal Work Safety and Clean-efficiency Utilization, Henan Polytechnic University, Jiaozuo 454003, China
First published on 1st June 2023
Abstract
In this work, light-driven technology is explored to study high-performance CH4 sensing materials, which could work at room temperature. Pure ZnO was prepared with a solvothermal method and noble metal silver was impregnated onto it to obtain Ag–ZnO composites. The morphology, microstructure, chemical valence, and surface and optical properties of the composites were investigated. The results confirmed that pristine ZnO microspheres and Ag/ZnO microspheres with various silver concentrations were synthesized. Moreover, compared with pristine ZnO, the Ag/ZnO composites exhibit obvious visible light absorption properties and lower PL emission intensity. The sensing results showed that the 1.5 at% Ag/ZnO composite exhibited a superior response of 3.43, which is about a 206% improvement compared with pristine ZnO. The enhanced gas sensing mechanisms were discussed. This work serves as a contribution to developing room-temperature methane sensors.
1. Introduction
Methane (CH4) without color or odour is the main component of mine gas and has been widely used in the civil and industrial fields as a fossil fuel and raw material.1,2 A volume fraction of methane in the air of 4.9–15.4% can cause explosion, which will not only cause economic losses, but also may cause casualties.3 Especially, explosion accidents being highly destructive and sudden are the most serious disasters in the process of coal mining.4 The concentration limit of methane has been set in some laws and regulations as 0.5% for coal mining in China. Therefore, reliable detection of methane is of great significance for early warning.Recently, chemical sensors have undergone rapid development.5–8 Research on metal oxide semiconductor CH4 gas sensors has aroused more attention due to their easy integration, low cost, high sensitivity, etc. Metal oxide semiconductors including SnO2, ZnO, TiO2, etc. are the main n-type sensing materials for toxic gas alarms.9,10 ZnO is special among them due to its remarkable electrical properties, optical properties, stability, and environmental friendliness. However, the operating temperature of CH4 sensors is relatively high, about 200–400 °C. The high temperature can bring about some problems such as complex device fabrication, inactivation of sensitive materials, and low device stability. Furthermore, pristine ZnO has inferior sensitivity, slow response/recovery speeds, and weak selectivity. Therefore, it is necessary to explore improved CH4 gas sensors.
A large number of approaches have been developed over the last few decades to overcome such problems of sensors, such as morphological modifications, combining with other elements, heterojunction construction, and photoexcitation.3,11–13 Noble metals possess eminent catalytic activity, which could obviously decrease the chemical energy of the gas under detection and play the role of an active catalytic center. Furthermore, a Schottky barrier can form between the semiconductor and the noble metal. Hence, the doping of noble metals can remarkably improve the sensing properties of pure metal oxide semiconductors. Silver, as the most cost-effective precious metal, is the most common form of sensitizer to enhance the sensing capability of metal oxide semiconductors. For instance, Ghosh et al. explored Pd–Ag modified ZnO thin films, which can detect CH4 at 100 °C.14 Rahman et al.15 reported a significant improvement in sensing response (40%) for 10 ppm CO compared with pure ZnO (9%) by modifying Ag on the ZnO nanoparticles. Recently, photoexcitation has proved its remarkable ability to reduce the working temperature of sensors even to room temperature.13,16 And some noble metal nanoparticles like Ag show local surface plasmon resonance (LSPR) under light, which may promote the sensing process.17,18 However, there have been hardly any reports on the preparation of room temperature methane sensors based on Ag/zinc oxide microspheres assembled into hierarchical porous nanosheets under photoexcitation.
Hence, this work reports the CH4 sensing properties of flower-like ZnO microspheres and Ag/ZnO composites. The composites with various silver concentrations were synthesized via a hydrothermal route. Gas-sensing test results showed that the addition of nano-silver significantly improved the gas-sensing response to methane under light excitation at low temperature. The possible gas-sensing mechanisms by light excitation are also discussed.
2. Experimental
2.1 Sample synthesis
By a simple and convenient hydrothermal method, ZnO hierarchies were synthesized. Briefly, 1.5 mmol of zinc acetate (Zn(CH3COO)2H2O) was dissolved in 80 mL of distilled water. After sufficient magnetic stirring, trisodium citrate (Na3C6H5O7, 10 mL, 10 mM) and hexamethylene tetramine (C6H12N4, 10 mL, 0.15 M) were added into the above solution. The prepared solution was enclosed in a vessel and kept for 3 h at 90 °C.The Ag-decorated ZnO samples were synthesized via an impregnation process. After cooling to room temperature, the above precursor mixture was stirred for 30 min to form a homogeneous solution. The required amount of 15 mM AgNO3 solution was added drop by drop and stirred steadily for 2 h in a natural environment (32 °C). The precipitate obtained via centrifugation was washed for a certain number of times using distilled water and anhydrous ethanol. Then, it was dried for 12 h at 60 °C. After the above processes were completed, the obtained Ag/ZnO precursor was heat-treated in a muffle furnace at 300 °C for 2 h. The products were Ag/ZnO nanocomposites. The obtained composites were respectively named 0 at%, 1.0 at%, 1.5 at%, and 2.0 at% Ag/ZnO according to the molar ratio of silver nitrate to zinc acetate.
2.2 Characterization
X-ray diffraction patterns were recorded on a GIGAKU Intelligent Laboratory (Cu-Kα radiation, 10° min−1 from 20° to 80°). EDS elemental maps and FESEM images were collected using a Hitachi SU 8220 scanning electron microscope equipped with a Brinell Quantax plate four-energy spectrum analyzer. Transmission electron microscope images were acquired on a JEOL JEM-2100. A Thermo Fisher ESCALAB 250 Xi was used for X-ray photoelectron spectroscopy. UV-vis spectroscopy was performed using a Shimadzu UV-240. Photo luminescence (PL) spectra were recorded on a steady state/transient fluorescence phosphorescence spectrometer with an excitation wavelength of 325 nm (FLS1000, Edinburgh Instruments).2.3 Gas sensing measurement
The sensors were fabricated by a droplet coating method.19 In detail, the prepared sample was mixed with water in a centrifuge tube. A homogeneous suspension with a concentration of 0.01 mg μL−1 was obtained via ultrasound treatment for 10 min. Then, 10 μL of the suspension was dropped on a Au-electrode alumina ceramic substrate (6.8 mm in length and 3 mm in width). The resistance sensor could be tested after natural drying and annealing at 60 °C.The gas sensing measurement was carried out at ∼32 °C and 50–55% relative humidity on a CGS-4TPS system (Beijing Elite Tech Co., Ltd.). A xenon lamp was used as the light source of the solar simulator with an optical power density of 6.5 mW cm−2. In a test cycle, the resistance of the sensor was allowed to stabilize in the air under light. Then, the target gas was injected into the measurement chamber (1800 mL) by a syringe. After 200 s, the chamber was opened. The response was calculated as Ra/Rg. Ra and Rg are the resistances in the air and tested gas under light. The response/recovery time was taken as when the resistance reached 90% of the total resistance change.
3. Results and discussion
3.1 Materials characterization
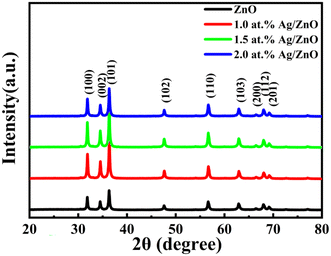
The phase composition and crystalline nature of the samples were studied using X-ray diffraction. Three typical diffraction peaks appearing at 31.7°, 34.4°, and 36.3° for the four sample powders were attributed to the (101), (002), and (100) planes of ZnO (Fig. 1). When the Ag concentration increased from 0 to 2.0 at%, there was no obvious diffraction peak representing the Ag phase for all silver-doped composites. This may be due to the small content of silver nanoparticles in the zinc oxide and the load distribution being relatively uniform. In addition, no other visible diffraction peaks appeared in the XRD patterns. This indicated the purity of the synthesized powders.Fig. 2a and b display the FESEM images of the pristine ZnO. At lower magnification, the pristine ZnO sample appeared as flower-like microspheres. Each sphere was composed of thousands of nanosheets. At higher magnification, it was found that the ZnO microspheres had a diameter of 4–5 μm. Fig. 2c and d show the FESEM images of the Ag/ZnO composites. The special hollow microsphere structure was maintained. This 3D structure with a large surface-to-volume ratio was conducive to gas diffusion. As shown in Fig. 2e–g, the chemical elements of Zn, O, and Ag were scanned with an energy spectrometer. The results proved that silver was evenly distributed in the sample and Ag/ZnO composites were successfully prepared.
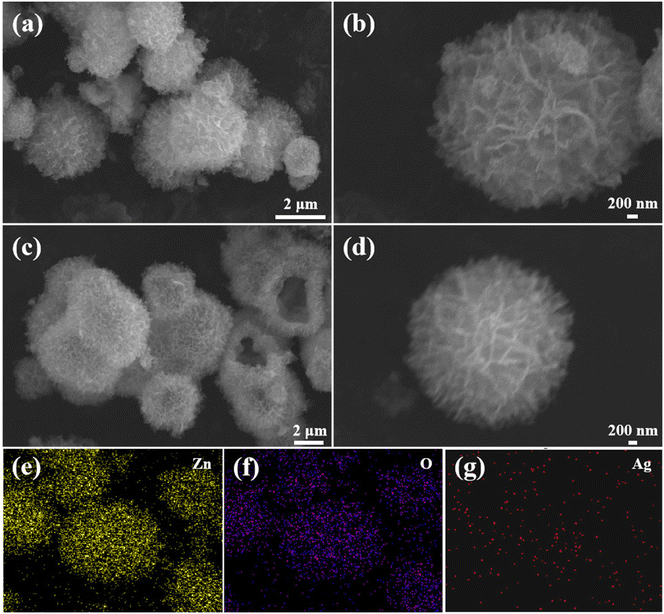 | ||
| Fig. 2 FESEM images of (a and b) ZnO and (c and d) Ag/ZnO, and (e–g) distribution of elements in Ag/ZnO. | ||
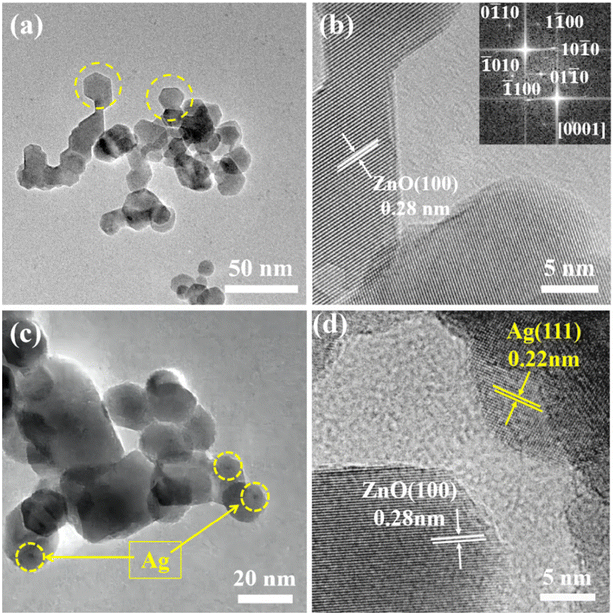
The synthesized samples were thoroughly analyzed using TEM. As shown in Fig. 3a, the yellow circular dotted box highlights that the pristine ZnO microspheres were made up of hexagonal particles with a size of about 18 nm. As shown in Fig. 3b, the lattice fringe associated with the (100) crystal plane of ZnO was 0.28 nm. Fig. 3c and d show TEM images of the composite with silver. Silver nanoparticles with a size of 3–5 nm were dispersed and loaded on the ZnO. The lattice distances in Fig. 3d are 0.28 and 0.22 nm, corresponding to the (100) crystal plane of ZnO and the (111) crystal plane of Ag. Therefore, it was confirmed by transmission electron microscopy that Ag nanoparticles were modified on the surface of ZnO microspheres.
The XPS spectra were collected to further study the samples. The O, Zn, and C elements can be observed in Fig. 4a. O and Zn come from ZnO, while C comes from amorphous carbon-based additives. However, the peak of the Ag element was not obvious in the spectra of the Ag/ZnO composites, which may be due to it being overwhelmed by the high intensity peak of Zn 3p. As shown in Fig. 4b, the two peaks of both samples with binding energies of 1021.8 eV and 1044.9 eV can be assigned to the Zn2+ oxidation state. In the Ag 3d spectrum, the emergence of the peaks at 367.49 eV and 373.56 eV was associated with Ag. The peaks of 374.2 eV and 368.2 eV represent Ag+, which may due to Ag2O forming during heat treatment.20 The Gaussian fitting curve of the O1s spectrum is shown in Fig. 4d. The binding energies of O (at 529.9, 530.4, and 531.5 eV) were collected. They indicated that there were three different oxygen types (OL (lattice oxygen), OV (oxygen vacancies), and OC (adsorbed oxygen)) on the surface. The presence of OV means that new energy levels were introduced, which may promote the band transition of electrons. OV and OC may facilitate the response process to the target molecule.21–23
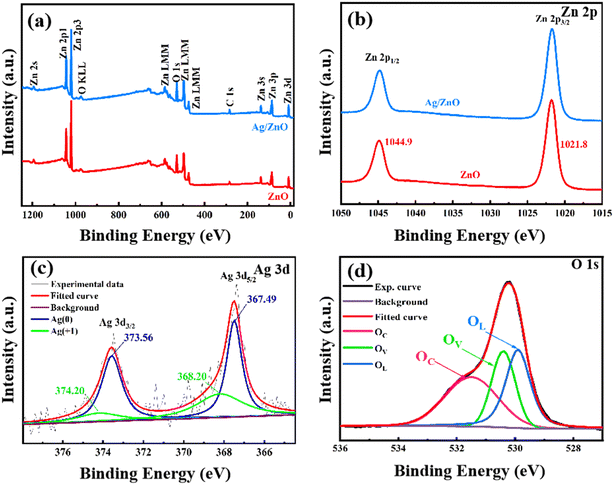 | ||
| Fig. 4 Full-range XPS survey (a) and Zn 2p spectra (b) of 0 at% Ag/ZnO and 1.5 at% Ag/ZnO; Ag 3d spectra (c) and O 1s spectra (d) of 1.5 at% Ag/ZnO. | ||
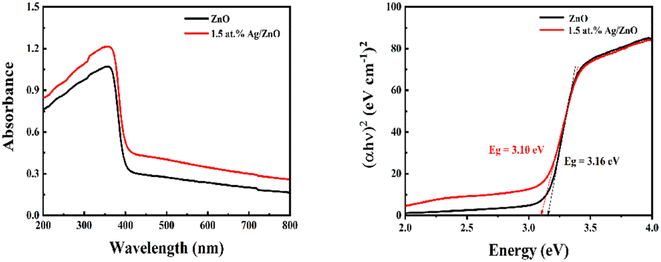
The optical absorption properties of the pristine ZnO and Ag modified composite were investigated using UV-vis spectroscopy, as shown in Fig. 5. As shown in Fig. 5a, pristine ZnO exhibited a strong absorption edge at 368 nm. Compared to ZnO, Ag/ZnO displays improved absorption intensity in the range of 200–800 nm due to the modification of Ag. Fig. 5b shows the corresponding band gaps of ZnO and Ag/ZnO. They were 3.16 and 3.10 eV, respectively. Because of the modification of Ag nanoparticles, the band gap was slightly reduced and the transition between bands was facilitated. This is due to the surface plasmon resonance of Ag, which promotes optical absorption of the composites. The enhanced optical properties of Ag/ZnO provide the potential to use light.
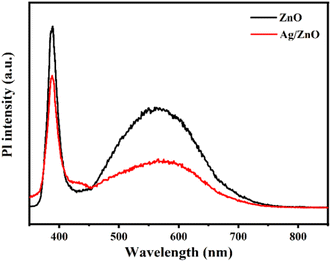
The redox reaction is closely related to photo-generated electrons and holes.24–28 The recombination of photo-induced charge carriers occurs easily, which can affect reaction activity. The carrier separation effect of pristine ZnO and Ag/ZnO was studied via photoluminescence (PL) under excitation at 325 nm, as shown in Fig. 6. The peak at 390 nm was due to the intrinsic exciton radiation from conduction (CB) to valence band (VB) of ZnO.29 The second shorter peak at about 568 nm was due to the oxygen vacancy defect of ZnO.30 The PL intensity in each emission band of the Ag/ZnO composite was lower than that of pure ZnO. This indicates that the recombination of electron–hole pairs in Ag/ZnO was limited compared to pure ZnO. Hence, the modification of Ag improved the efficiency of charge separation, which may lead to enhanced gas sensing performance.
3.2 Methane sensing performance
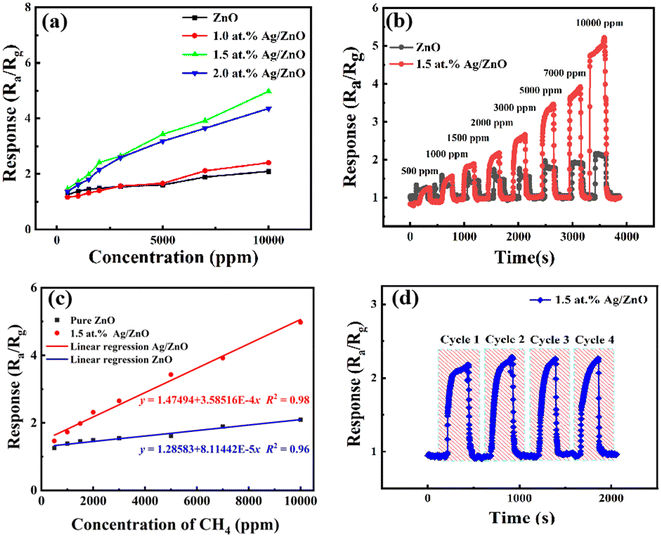
The gas sensing properties of the pristine ZnO and Ag/ZnO products were measured under simulated sunlight light at room temperature (∼32 °C) and ∼53% RH. As shown in Fig. 7a, the sensing performance of sensing materials with different Ag contents of 0.0 at%, 1.0 at%, 1.5 at%, and 2.0 at% was investigated in a controlled methane concentration variation range of 500 to 10![[thin space (1/6-em)]](https://www.rsc.org/images/entities/char_2009.gif) 000 ppm under light activation. With the increase of methane concentration, the response of the sensor presented a similar increasing trend. The response toward 5000 ppm methane was 1.61, 1.66, 3.43, and 3.18, respectively. The best loading content of Ag was 1.5 at%. This could be attributed to the better dispersion of Ag at a low loading content. Overloading might lead to aggregation of the Ag and the formation of recombination centers of photogenerated electrons and holes.
000 ppm under light activation. With the increase of methane concentration, the response of the sensor presented a similar increasing trend. The response toward 5000 ppm methane was 1.61, 1.66, 3.43, and 3.18, respectively. The best loading content of Ag was 1.5 at%. This could be attributed to the better dispersion of Ag at a low loading content. Overloading might lead to aggregation of the Ag and the formation of recombination centers of photogenerated electrons and holes.
Fig. 7b shows the transient response of the sensor based on pristine ZnO and 1.5 at% Ag/ZnO under simulated sunlight. At the same CH4 concentration, 1.5 at% Ag/ZnO exhibited a rapid response. And the response of Ag/ZnO showed obvious differences compared to pure ZnO with the increase of CH4 concentration.
Fig. 7c shows the correlation between response and CH4 gas concentration. The plots can be fitted by y = 1.47494 + 3.58516 × 10⁻⁴x (fitting coefficient R2 was 0.98) for 1.5 at% Ag/ZnO and y = 1.28583 + 8.11442 × 10⁻⁵x (fitting coefficient R2 was 0.96) for the pristine ZnO sensor, where the target gas concentration is x and the gas response is y. Both samples showed a good linear relationship, indicating that they can effectively monitor methane in a wide range of concentrations. The brilliant linearity decreased measurement error over entire concentration range. Further, the limit of detection (LoD) of the sensors was calculated by eqn (1).
 | (1) |
One critical property of gas sensors is repeatability in actual application. Fig. 7d shows the test results of four transient response cycles of the sensor based on 1.5 at% Ag/ZnO to 2000 ppm CH4. The response values displayed a sensible fluctuation in the cycles. This indicates the good reproducibility of 1.5 at% Ag/ZnO.
Fig. 8 shows the transient resistance curves that show the response/recovery times for 1.5 at% Ag/ZnO and ZnO to 1000 ppm CH4 at room temperature. They are 47/35 s and 56/41 s, respectively. Hence, Ag-modified ZnO presented a quicker response/recovery rate than that of pristine ZnO.
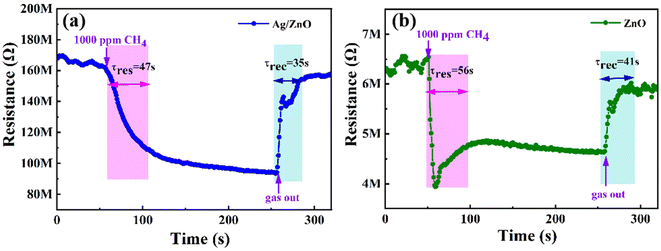 | ||
| Fig. 8 Response/recovery times of (a) 1.5 at% Ag/ZnO and (b) pristine ZnO toward 1000 ppm CH4 at room temperature. | ||
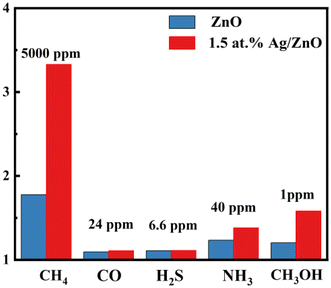
It is well known that CH4, CO, and other volatile organic compounds (VOCs) are contained in coal mine gas. A methane concentration of 0.5–1.5% (5000–15![[thin space (1/6-em)]](https://www.rsc.org/images/entities/char_2009.gif) 000 ppm) should raise the alarm according to the Safety Regulations of Coal Mine of China. In addition, the alarm concentration of other harmful gases is lower. Therefore, the response to some interfering gases was tested based on the coal mine standard. The response values of 1.5 at% Ag/ZnO toward CO, H2S, NH3, CH3OH, and CH4 were 1.109, 1.112, 1.381, 1.581, and 3.43, as shown in Fig. 9. The Ag/ZnO sensor had higher selectivity for methane gas compared to the pristine ZnO sensors.
000 ppm) should raise the alarm according to the Safety Regulations of Coal Mine of China. In addition, the alarm concentration of other harmful gases is lower. Therefore, the response to some interfering gases was tested based on the coal mine standard. The response values of 1.5 at% Ag/ZnO toward CO, H2S, NH3, CH3OH, and CH4 were 1.109, 1.112, 1.381, 1.581, and 3.43, as shown in Fig. 9. The Ag/ZnO sensor had higher selectivity for methane gas compared to the pristine ZnO sensors.
Table 1 contains the CH4 gas sensing performance parameters of this work compared with others. It is clear that the 1.5 at% Ag/ZnO composite sensor has a lower working temperature and more dramatic CH4 response by comparison.
3.3 Sensing mechanism
Under the illumination of the solar simulator, the CH4 sensing performance of the Ag/ZnO composite was remarkably enhanced. Here, we give the mechanism of CH4 gas sensing on the basis of previous studies (Fig. 10).37–41 Firstly, there is the effect of LSPR. Decorated Ag nanoparticles (NPs) enhance the light absorption capacity and enlarge the absorption spectrum to cover the visible region (Fig. 5).42 Meanwhile, the Ag NPs will induce localized fields and thus promote the separation and generation of e–h pairs in zinc oxide (Fig. 6).43 These effects enhance the light utilization efficiency of the composite. Moreover, due to the LSPR, high-energy hot electrons are transferred to ZnO from the Ag NPs, which could improve the reactivity of the gas-sensing system.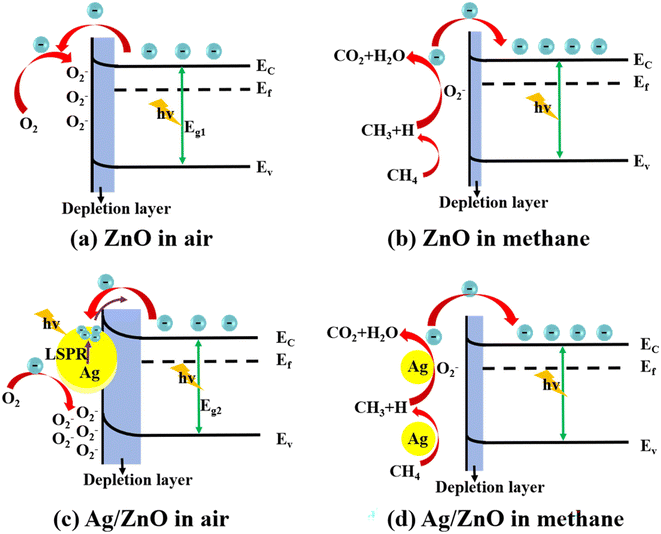 | ||
| Fig. 10 Gas sensing mechanism diagrams of (a) ZnO and (c) Ag/ZnO in air, and (b) ZnO and (d) Ag/ZnO in methane. | ||
Secondly, there is the catalytic effect of silver. In the process of photocatalysis, zinc oxide microspheres become the source of electron and holes. In the effect of photocatalysis, zinc oxide microspheres become the source of electron and holes, and Ag nanoparticles are rich-electrons on the surface.44–46 Because of the various work functions of Ag and ZnO, a Schottky barrier will be formed between ZnO and Ag. This helps the composite to undergo more obvious resistance changes.47 After injecting methane gas, the material resistance can be effectively reduced and the gas sensing ability is achieved. Therefore, adding an appropriate amount of Ag modification onto ZnO can improve the gas-sensing performance.
4. Conclusions
In summary, ZnO flower-like microspheres with different levels of silver modification were synthesized via a hydrothermal route. The results show that the silver-doped ZnO microspheres can effectively detect methane under (32 °C) simulated sunlight at room temperature in comparison with the pure ZnO microspheres. Among all synthesized samples, the 1.50 at% Ag/ZnO sensor has the best gas sensing characteristics for 5000 ppm methane, including an enhanced response (∼2 fold vs. pure ZnO) and faster response/recovery time of 47/35 s (56/41 s of ZnO). This is due to the generation of LSPR and catalytic effect of the Ag NPs. Therefore, 1.5 at% Ag/ZnO flower-like microspheres are a promising sensing material for room temperature CH4 sensing. The work provides an effective idea for the development of CH4 sensors at room temperature.Author contributions
Mengwei Li: formal analysis, investigation, data curation, writing – original draft. Xueya Sun: investigation, data curation, writing – original draft. Yihui Wang: validation, data curation. Cong Qin: conceptualization, investigation. Jianliang Cao: conceptualization, resources. Yan Wang: supervision, project administration, funding acquisition, writing – review & editing.Conflicts of interest
The authors declare no conflict of interest.Acknowledgements
This study was financially supported by the National Natural Science Foundation of China (62173129), Program for Science & Technology Innovative Research Team in the University of Henan Province (21IRTSTHN006), Natural Science Foundation of Henan Province (212300410042), and the Fundamental Research Funds for the Universities of Henan Province (NSFRF220101).References
- Q. Zhou, Z. R. Lu, Z. J. Wei, L. N. Xu, Y. G. Gui and W. G. Chen, Front. Chem., 2018, 6, 2296–2646 Search PubMed.
- X. Gao, Q. Zhou, J. Wang, L. Xu and W. Zeng, Nanomaterials, 2020, 10, 299 CrossRef CAS PubMed.
- S. Ghosh, C. RoyChaudhuri, R. Bhattacharya, H. Saha and N. Mukherjee, ACS Appl. Mater. Interfaces, 2014, 6, 3879–3887 CrossRef CAS PubMed.
- G. Li, X. Wang, L. Yan, Y. Wang, Z. Zhang and J. Xu, ACS Appl. Mater. Interfaces, 2019, 11, 26116–26126 CrossRef CAS PubMed.
- Y. Su, S. Chen, B. Liu, H. Lu, X. Luo, C. Chen, W. Li, Y. Long, H. Tai, G. Xie and Y. Jiang, Mater. Today Phys., 2023, 30, 100951 CrossRef CAS.
- Y. Zhang, L. Zhu, C. Qin, Y. Wang and J. Cao, Sens. Actuators, B, 2023, 381, 133461 CrossRef CAS.
- C. Chen, M. Jiang, X. Luo, H. Tai, Y. Jiang, M. Yang, G. Xie and Y. Su, Sens. Actuators, B, 2022, 370, 132441 CrossRef CAS.
- Y. Su, Y. Liu, W. Li, X. Xiao, C. Chen, H. Lu, Z. Yuan, H. Tai, Y. Jiang, J. Zou, G. Xie and J. Chen, Mater. Horiz., 2023, 10, 842 RSC.
- R. Malik, V. K. Tomer, Y. K. Mishra and L. Lin, Appl. Phys. Rev., 2020, 7, 021301 CAS.
- Y. Su, G. Xie, H. Tai, S. Li, B. Yang, S. Wang, Q. Zhang, H. Du, H. Zhang, X. Du and Y. Jiang, Nano Energy, 2018, 47, 316–324 CrossRef CAS.
- D. Haridas and V. Gupta, Sens. Actuators, B, 2013, 182, 741–746 CrossRef CAS.
- J. Zhang, S. Wang, M. Xu, Y. Wang, B. Zhu, S. Zhang, W. Huang and S. Wu, Cryst. Growth Des., 2009, 9, 3532–3537 CrossRef CAS.
- F. Xu and H. P. Ho, Micromachines, 2017, 8, 333 CrossRef PubMed.
- S. Ghosh, C. Roychaudhuri, R. Bhattacharya, H. Saha and N. Mukherjee, ACS Appl. Mater. Interfaces, 2014, 6, 3879–3887 CrossRef CAS.
- H. Rahman, V. Kumar, P. Singh and A. Kumar, Appl. Nanosci., 2022, 12, 3517–3527 CrossRef CAS.
- J. Wang, H. Shen, Y. Xia and S. Komarneni, Ceram. Int., 2021, 47, 7353–7368 CrossRef CAS.
- J. Li, G. Xie, J. Jiang, Y. Liu, C. Chen, W. Li, J. Huang, X. Luo, M. Xu, Q. Zhang, M. Yang and Y. Su, Nano Energy, 2023, 108, 108234 CrossRef CAS.
- Q. Zhang, G. Xie, M. Xu, Y. Su, H. Tai, H. Du and Y. Jiang, Sens. Actuators, B, 2018, 259, 269–281 CrossRef CAS.
- C. Qin, B. Wang, N. Wu, C. Han and Y. Wang, ACS Appl. Mater. Interfaces, 2021, 13, 26318–26329 CrossRef CAS.
- M. Kohantorabi, G. Moussavi, S. Mohammadi, P. Oulego and S. Giannakis, Chemosphere, 2021, 277, 130271 CrossRef CAS.
- Y. Wang, Y. Cui, X. Meng, Z. Zhang and J. Cao, Surf. Interfaces, 2021, 24, 101110 CrossRef CAS.
- C. Wang, X. Cui, J. Liu, X. Zhou, X. Cheng, P. Sun, X. Hu, X. Li, J. Zheng and G. Lu, ACS Sens., 2016, 1, 131–136 CrossRef CAS.
- Z. Li, X. Liu, M. Zhou, S. Zhang, S. Cao, G. Lei, C. Lou and J. Zhang, J. Hazard. Mater., 2021, 415, 125757 CrossRef CAS PubMed.
- S. A. Ansari, M. M. Khan, M. O. Ansari, J. Lee and M. H. Cho, J. Phys. Chem. C, 2013, 117, 27023–27030 CrossRef CAS.
- W. Lu, S. Gao and J. Wang, J. Phys. Chem. C, 2008, 112, 16792–16800 CrossRef CAS.
- G. Shan, L. Xu, G. Wang and Y. Liu, J. Phys. Chem. C, 2007, 111, 3290–3293 CrossRef CAS.
- S. Ghosh, V. Goudar, K. Padmalekha, S. Bhat, S. Indi and H. Vasan, RSC Adv., 2012, 2, 930–940 RSC.
- W. Xie, Y. Li, W. Sun, J. Huang, H. Xie and X. Zhao, J. Photochem. Photobiol., A, 2010, 216, 149–155 CrossRef CAS.
- A. Zou, Y. Qiu, J. Yu, B. Yin, G. Cao, H. Zhang and L. Hu, Sens. Actuators, B, 2016, 227, 65–72 CrossRef CAS.
- Z. Wang, J. Xue, D. Han and F. Gu, ACS Appl. Mater. Interfaces, 2015, 7, 308–317 CrossRef CAS.
- Y. Guo, M. Gong, Y. Li, Y. Liu and X. Dou, Nanoscale Res. Lett., 2016, 11, 1–9 CrossRef CAS.
- Y. Li, H. Wang, Y. Chen and M. Yang, Sens. Actuators, B, 2008, 132, 155–158 CrossRef CAS.
- S. Zhang, Y. Li, G. Sun, B. Zhang, Y. Wang, J. Cao and Z. Zhang, Appl. Surf. Sci., 2019, 497, 143811 CrossRef CAS.
- D. Zhang, H. Chang, C. Jiang, Y. Yao and Y. Zhang, Sens. Actuators, B, 2017, 252, 624–632 CrossRef CAS.
- N. Shaalan, D. Hamad and O. Saber, Materials, 2019, 12, 4073 CrossRef CAS PubMed.
- K. C. Lam, B. Huang and S. Shi, J. Mater. Chem. A, 2017, 5, 11131–11142 RSC.
- Z. Zheng, J. Yao, B. Wang and G. Yang, Sci. Rep., 2015, 5, 11070 CrossRef CAS.
- Q. Geng, Z. He, X. Chen, W. Dai and X. Wang, Sens. Actuators, B, 2013, 188, 293–297 CrossRef CAS.
- Z. Yang, L. Guo, B. Zu, Y. Guo, T. Xu and X. Dou, Adv. Opt. Mater., 2014, 2, 738–745 CrossRef CAS.
- J. Zhai, L. Wang, D. Wang, Y. Lin, D. He and T. Xie, Sens. Actuators, B, 2012, 161, 292–297 CrossRef CAS.
- Q. Geng, X. Lin, R. Si, X. Chen, W. Dai, X. Fu and X. Wang, Sens. Actuators, B, 2012, 174, 449–457 CrossRef CAS.
- K. Liu, Y. Bi, S. Qu, F. Tan, D. Chi, S. Lu, Y. Li, Y. Kou and Z. Wang, Nanoscale Res. Lett., 2014, 6, 6180–6186 RSC.
- S. K. Cushing, J. Li, F. Meng, T. R. Senty, S. Suri, M. Zhi, M. Li, A. D. Bristow and N. Wu, J. Am. Chem. Soc., 2012, 134, 15033–15041 CrossRef CAS.
- J. Chang, C. Qin, W. Guo, L. Zhu, Y. Zhang, Y. Wang and J. Cao, Sens. Actuators, B, 2023, 385, 133633 CrossRef CAS.
- T. Tan, Y. Li, Y. Liu, B. Wang, X. Song, E. Li, H. Wang and H. Yan, Mater. Chem. Phys., 2008, 111, 305–308 CrossRef CAS.
- M. Ahmad, S. Yingying, A. Nisar, H. Sun, W. Shen, M. Wei and J. Zhu, J. Mater. Chem., 2011, 21, 7723–7729 RSC.
- Y. Sun, Y. Sun, T. Zhang, G. Chen, F. Zhang, D. Liu, W. Cai, Y. Li, X. Yang and C. Li, Nanoscale Res. Lett., 2016, 8, 10774–10782 RSC.
| This journal is © The Royal Society of Chemistry 2023 |

