
 Open Access Article
 This Open Access Article is licensed under a
 Creative Commons Attribution 3.0 Unported Licence
A three-dimensional microfluidic flow cell and system integration for improved electrochemical substrate detection in HRP/TMB-based immunoassays†
Alexander
Ecke‡
 ab,
Jérémy
Bell
*a and
Rudolf J.
Schneider
*ac
ab,
Jérémy
Bell
*a and
Rudolf J.
Schneider
*ac
aDepartment of Analytical Chemistry; Reference Materials, Bundesanstalt für Materialforschung und-prüfung (BAM), 12205 Berlin, Germany. E-mail: jeremy.bell@bam.de; rudolf.schneider@bam.de
bDepartment of Chemistry, Humboldt-Universität zu Berlin, 12489 Berlin, Germany
cFaculty III Process Sciences, Technische Universität Berlin, 10623 Berlin, Germany
First published on 12th June 2023
Abstract
Immunoassays, based on the recognition and capture of analytes by highly selective antibodies, are now used extensively in all areas of diagnostics, but the challenge is to further integrate them into online sensors. To improve the transition from laboratory immunoassays to immunosensors, we have developed a complete flow system, based on a microfluidic core flow cell to enable automated detection of one of the most commonly used immunoassay substrates, TMB, by chronoamperometry. The architecture and fluidic optimisation of the system showed that a specially designed 3D flow cell allows higher flow rates (500 μL min−1) than a standard enlarged microfluidic channel (50 μL min−1) resulting in a significantly shorter detection time of 30 seconds per sample and making the system more robust against interferences due to bubble formation in the chip. The electrochemical measurements showed an improved signal-to-noise ratio (SNR) and thus higher sensitivity for a model immunoassay for diclofenac (SNR = 59), compared to the analytical performance of a conventional laboratory microplate-based assay with optical detection (SNR = 19). In general, this system facilitates the conversion of any conventional immunoassay into an immunosensor with automatic and continuous detection.
Introduction
Immunoassays have become increasingly important in recent decades as a valuable tool in food and environmental analysis. The range of potential analytes that can be detected and quantified by immunoassays is quite broad and limited only by the availability of a suitable and sufficiently selective antibody.1–3 Accordingly, immunoassays have been used for the analysis of biological samples,4–6 or new environmental contaminants such as small organic molecules.7 Along with the advance of new immunodetection techniques, the development of immunosensors for mobile, autonomous and continuous monitoring capabilities has gained more and more importance.8 The first challenge in converting an immunoassay into an immunosensor is to find a suitable assay platform that allows for ease of use, increased sensitivity, and a short time-to-result. Regarding the assay platform, silica-coated magnetic microparticles (“core/shell particles”) appear eminently dominant.9–12 Their main advantage is that their shell can be surface-tailored according to the assay requirements (e.g., blocking of active sites), while the magnetic core enables the retention of some control over the particles, even in a microfluidic system.In terms of detection, most immunoassays use an enzyme label to convert a substrate for indirect optical or electrochemical detection.13 One of the most common combinations for immunoassays is horseradish peroxidase (HRP) with 3,3′,5,5′-tetramethylbenzidine (TMB) as substrate. TMB is oxidised by HRP with hydrogen peroxide as a co-substrate to the corresponding diimine and can be detected optically by absorbance measurement at 450 nm with a spectrophotometer or plate reader; or electrochemically by potentiometric or amperometric methods via reduction to the original form.14,15 The second method is usually chosen for sensor development, as it allows measurements with high sensitivity at lower instrumental cost, enabling miniaturisation along the way.16 Indeed, the availability of miniature potentiostats and screen-printed electrodes (SPE) provides an ideal basis for the transition from conventional immunoassays to integrated immunosensors.17,18
The challenges for online immunosensors remain in their reliable, robust, and complete integration. Of the few examples for full online integration that have been reported, the common point is the use of a microfluidic unit.11,19 Indeed, microfluidics technology is a fast-developing field defined by systems below 100 μm in size. Inside the chip, microfluidic channels enable fluid processing, such as mixing and in situ physicochemical analyses, like electrochemical or optical readout. This technique significantly reduces the number of samples and reagents needed for high-throughput screening and can be used to build miniature devices that precisely regulate the physicochemical reactions of the fluid inside. Therefore, to minimise the size of an online fluidic sensor, microfluidic chips appear as ideal solution to minimise the cost per analysis, while increasing the robustness of the assay.20–22
Here, we report the development of a microfluidics-based system with pressure-driven flow control, automated valves, an SPE in conjunction with a dedicated mini-potentiostat and innovative microfluidic chip designs to enable automated electrochemical detection of the oxidised TMB substrate from an immunoassay (Fig. 1). The focus was on the architecture of the microfluidic chip by developing conventional and three-dimensional designs to evaluate the impact of the design on the assay performance numbers. Using this system, conventional plate-based immunoassays, such as a previously reported assay for diclofenac,23 can be easily converted into an immunosensor for automated and continuous detection, that can be used directly in a (waste)water treatment plant or with biological fluids.24–26
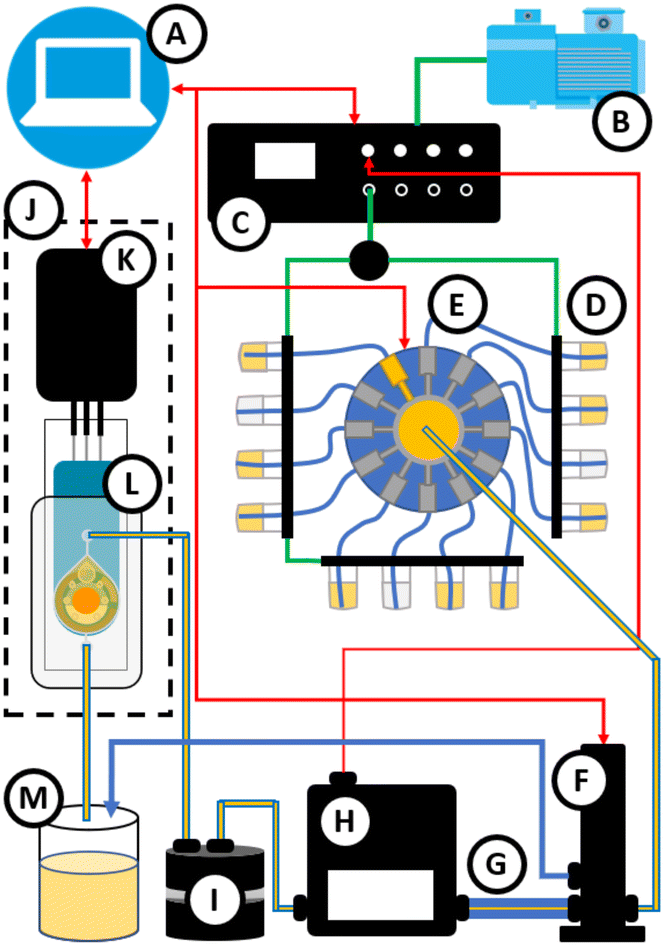 | ||
Fig. 1 Schematic representation of the microfluidic setup for electrochemical measurements on an SPE. Legend: A – control unit, B – pressure source, C – pressure controller, D – reservoirs, E – 12![[thin space (1/6-em)]](https://www.rsc.org/images/entities/char_2009.gif) :1-directional valve, F – 3-directional bypass valve, G – microfluidic resistor, H – flow rate sensor, I – bubble trap, J – Faraday cage, K – potentiostat, L – microfluidic chip with SPE, M – waste reservoir. Green lines mark compressed air connections, blue lines fluidic hoses, and red arrows data connections. :1-directional valve, F – 3-directional bypass valve, G – microfluidic resistor, H – flow rate sensor, I – bubble trap, J – Faraday cage, K – potentiostat, L – microfluidic chip with SPE, M – waste reservoir. Green lines mark compressed air connections, blue lines fluidic hoses, and red arrows data connections. | ||
Experimental
Microfluidic setup
The equipment for pressure-driven flow control was purchased from Elveflow (Paris, France): OB1 MK3+ Pressure Controller with one channel 0–2000 mbar, MUX Distribution 12:1-port valve, MUX Wire solenoid valve (3-way) with valve driver, flow sensors MFS4 40–1000 μL min−1 and MFS3 2.4–80 μL min−1, and reservoir holder racks 4-XS for 2 mL reaction tubes. The pressure controller was connected to a compressed air supply with a PVC fabric hose 19 (3/4′′) × 26.0 mm from REHAU Industries (Rehau, Germany) and 6 × 4 mm polyether polyurethane tubing (Darwin Microfluidics, Paris, France) via a particle/humidity filter (Elveflow). Reservoirs were connected to the pressure controller using pneumatic polyurethane flexible tubing with 4 mm outer diameter (Darwin Microfluidics). Reservoirs were connected to the 12:1-way valve, the three-port valve, the flow rate sensor, a bubble trap (Darwin Microfluidics) and the self-made microfluidic chips. Between the three-port valve and the flow rate sensor, a microfluidic resistor of 6.5 cm length was installed with 100 μm internal diameter with flow rate sensor MFS4 for the 3D chip or with 65 μm internal diameter and sensor MFS3 for the 2D chip. To ensure efficient sealing between the PDMS chip and the SPE, chip holders for each chip architecture were designed. These chip holders consist of a bottom plate made of aluminium and a replaceable top plate made of poly(methyl methacrylate) (PMMA), different for each of the two chip designs. Top and bottom plates were aligned and held together with four screws in each corner while the chip was placed in between so that the central bore holes in the top plate allowed connection of the fluidic tubing to the inlet and outlet of the chip (ESI,† section I).
Results and discussion
Optimisation of the electrochemical measurements
The developed integrated microfluidic electrochemical system was designed for highest compatibility with existing immunoassays and is therefore based on the widely used HRP/H2O2/TMB combination. In this configuration, TMB, oxidised by the enzyme HRP, can be quantified by reduction to the starting form using chronoamperometry. Electrochemical detection of oxidised TMB by chronoamperometry was tested at potentials between 100 and 400 mV vs. Ag/AgCl, all lower than the reduction peak potential (Epc = 408 mV) observed in the cyclic voltammogram showing a reversible redox process at pH 1 (Fig. S2a†). These potentials are sufficiently negative for diffusion-controlled (rather than reaction-controlled) reduction of oxidised TMB. However, the background signal due to side reactions in the amperometric measurement, i.e. the reduction of co-substrates, such as hydrogen peroxide, increased proportionally to the decreasing applied potential (Fig. S2b†). Since this background current reduces the sensitivity of the detection method, the background signal should be as low as possible.27 In this context, the background current was found to be optimal at 330 mV vs. Ag/AgCl, while it carried a positive sign at the higher potential of 350 mV, indicating opposite oxidation processes. For this reason, in this work, TMB was quantified at a potential of 330 mV vs. Ag/AgCl, as no effect of this potential change was found on the signal intensity of the faradaic current for the reduction of oxidised TMB. Consequently, the net signal intensity, i.e., the difference between the faradaic current and the background current, is highest at 330 mV vs. Ag/AgCl, which allows quantification of TMB with optimal sensitivity.Development of the integrated system
Previous studies of ours have shown that a flow cell combined with an SPE consisting of a gold working electrode, a platinum counter electrode and a silver pseudo-reference electrode buffered at pH 1, showed stable and reproducible responses over several measurement cycles for HRP/H2O2/TMB immunoassays.14 However, this macroscopic flow cell required rather high sample volumes and increased flow rates that consumed a lot of reagents. We therefore focused on integrating a more economical system organised around a microfluidic flow cell. The average sample volume involved in immunoassays is only 300 μL (substrate solution after completion of oxidation, stopped with sulphuric acid), so reducing the internal flow cell volume would ensure detection with high signal intensities in a short measurement time.For optimal flow control and signals as stable as possible during the electrochemical measurement, a pressure-driven flow control system was used to inject the substrate solution(s) into the chip.28 The system consisted of closed reservoirs containing the solutions to be injected and pressurised by an external pressure source – here: compressed air – so that the fluids were pumped through the tubing system, the valves, and the chip. A 12:1-directional valve allowed sequential injection of different fluids (samples) while a three-directional bypass valve allowed rapid flushing of the tubing with fluid to remove air in the system. By incorporating a microfluidic resistor with a smaller internal diameter, the flow rate could be precisely adjusted by altering the pressure and was also maintained automatically by a feedback loop between the flow sensor and the pressure controller. Further down the line, a bubble trap ensured the exclusion of bubbles from the core of the microfluidic chip that would interfere with the measurement. The SPE was connected to a USB mini-potentiostat, which was connected to a control unit (laptop & software). To avoid interference of the electrochemical measurement by electrostatic charge or electromagnetic waves, both the chip and the potentiostat were placed in an externally grounded Faraday cage (Fig. 1).29
Two different microfluidic chip architectures were designed to be fabricated from PDMS: a conventional single channel and a miniaturised flow cell. Since the reversible process of 3,3′,5,5′-tetramethylbenzidine diimine reduction at the electrode surface is diffusion-controlled, the faradaic current depends on the flow rate Q in the microfluidic chip: the signal intensity increases with increasing flow rate.30 A higher flow rate also shortens the measurement time at constant sample volume. The optimal design should therefore allow sufficient flow rates to ensure sensitive and fast measurements, without producing air bubbles that could interfere with the electrochemical measurements.31
The conventional single-channel architecture (Fig. 2) was designed to cover the entire electrode surface, so that it is completely wetted by the substrate solution with a liquid layer thickness of 100 μm. The addition of dispatchers to fractionate and stabilise the flow distribution32 over the electrode proved to be efficient. Similarly, the microcolumns prevented the almost 8 mm wide chamber (100 μm height) from collapsing. With this design, a maximum flow rate of 50 μL min−1 could be achieved before bubbles formed in the chip due to increased friction and evaporation of the solvent. Therefore, this architecture allowed a detection time of 5 minutes per sample, consuming a volume of 250 μL of the substrate.
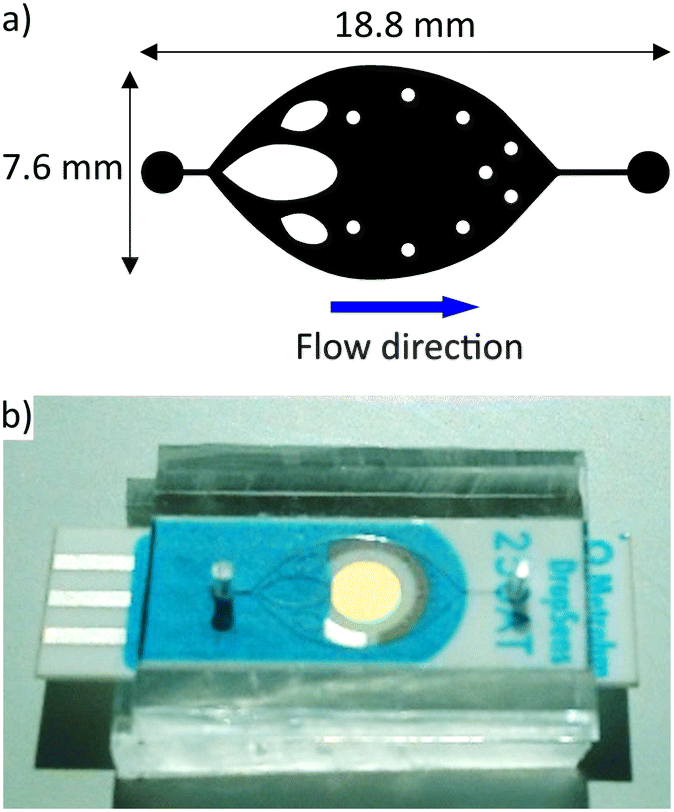 | ||
| Fig. 2 a) 2D microfluidic chip channel layout with 100 μm height: from left to right, a single inlet leads to an enlarged channel with 3 dispatchers for homogeneous flow distribution, microcolumns were placed in the channel to match the electrodes' distribution and to avoid collapse of the channel, a single outlet. b) Image of the chip with SPE inserted, where the electrode surface is spanned by the microfluidic chamber with an inlet on the left and an outlet on the right connected to external tubing. | ||
Alternatively, a 3D chip architecture (Fig. 3) was designed and fabricated as described in the literature using a sacrificial ABS scaffold.33 This design features a miniaturised flow cell chamber aligned over the electrodes, a central inlet channel for sample injection and four outlet channels, that merge into one. This configuration, combined with the slightly larger chamber volume, allows for higher flow rates and thus shorter detection times. In addition, the direction of flow, with a vertical injection at the centre of the electrode to the outside and top outlets facilitated the transport of the bubbles formed.34 Indeed, a remarkable stability of the chip was observed up to flow rates of 500–600 μL min−1, above which bubble formation was observed. This design allowed a fast detection time of 30 seconds per sample at a sample volume of 250 μL and was therefore selected for system integration.
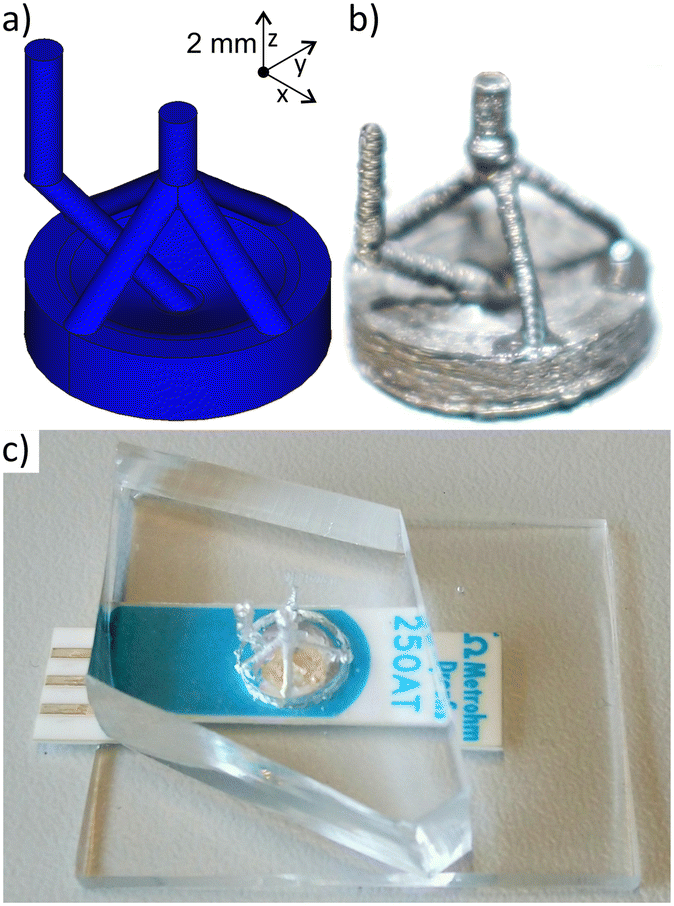 | ||
| Fig. 3 a) 3D model of the internal structure of the microfluidic chip: cell, inlet channel (in the centre) and outlet channels (cell edges) were printed separately to produce b) the complete ABS scaffold, which was assembled from individual parts. c) The obtained 3D microfluidic chip with a flow cell chamber aligned on the electrode and a channel structure for inlet and outlet connections. | ||
Integrated system for immuno-sensing – model assay for diclofenac detection.
With the selected 3D chip, the integrated system was tested as an example for a previously optimised and described23 magnetic bead-based immunoassay (MBBA) for the detection of diclofenac (DCF) constructed with the selective and robust anti-DCF antibody F01G21.35The influence of flow rate on amperometric measurement was investigated with oxidised TMB substrate obtained in the MBBA for the determination of DCF injected sequentially (Fig. S3a†). An expected increase in signal intensity with increasing flow rate was observed in the investigated flow rate range of 100–600 μL min−1 (Fig. 4a). Unfortunately, at a flow rate of 600 μL min−1, the formation of bubbles excessively influenced the measurement and the signal shape, resulting in larger deviations between the individual measurements. By calculating the signal-to-noise ratios (Fig. 4b), it was possible to estimate the dependence of the current and its deviation from the flow rate. In the literature, a proportionality of the current to Q3/4 or Q1/2 is reported.36 Here, a negative square root function seems best suited to fit the data (Fig. S3b†). Accordingly, the signal current intensity and thus the sensitivity could theoretically be further increased by raising the flow rate. However, due to the formation of bubbles, the system showed a lower signal-to-noise ratio at too high flow rates. To circumvent this source of variation, a flow rate of 500 μL min−1 seems optimal to ensure sufficient reproducibility at the highest possible signal intensity and fastest rate.
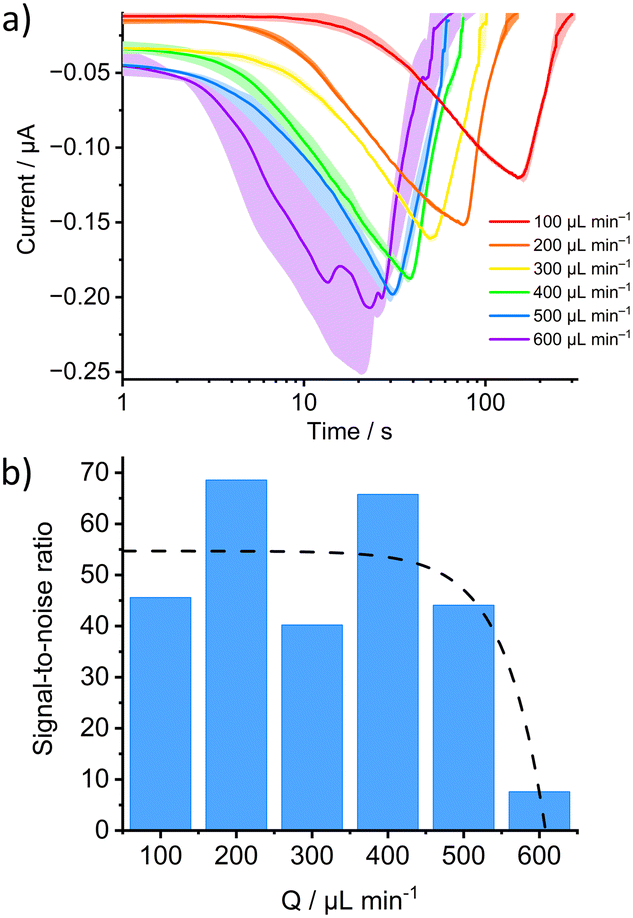 | ||
| Fig. 4 Influence of the flow rate on the current signal: a) time course (logarithmic scale) of the current signal after injection of 250 μL oxidised TMB solutions and buffer in triplicate for each flow rate (lighter coloured area corresponds to the standard deviation); b) calculated signal-to-noise ratios against the respective flow rates. | ||
The reproducibility of the system was then assessed by calibration with substrate solutions from the MBBA for the quantification of DCF. In three consecutive measurements, each with eight samples of differently oxidised TMB solutions from the DCF-MBBA, reproducible matching signal intensities were observed (Fig. 5a and S4†). Subsequent plotting of the peak currents against the DCF concentration of the calibrators used in the assay showed that the calibration curves of the integrated system (electrochemical) and the well plate assay (optical detection) are equivalent to each other (Fig. 5b) with IC50 values of 6.2 and 7.1 μg L−1 for electrochemical and optical detection, respectively. Furthermore, the higher robustness of the electrofluidic system can be clearly quantified by calculating a signal-to-noise ratio (SNR) of 59 for the integrated DCF immunosensor. This improved signal stability, which is three times higher than the SNR for optical detection (SNR = 19), demonstrates that such an integrated platform can readily serve as an alternative to the optical detection mode for HRP/H2O2/TMB-based immunoassays. Compared to existing or already published chromogenic detection methods for TMB, such as spectrometry,37 optical microscopy,38 fluorescence39 or even naked-eye sensing,40 this method allows for a shorter detection time with a higher signal-to-noise ratio. Also, compared to recent electrochemical sensor studies, the sensitivity and throughput of the developed method for TMB substrate detection is improved significantly.
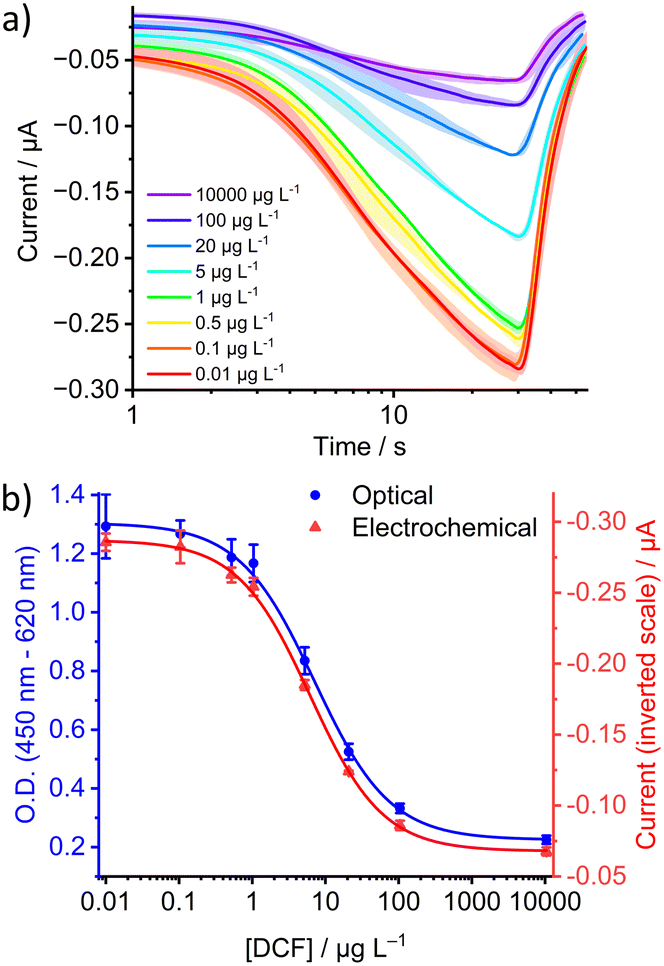 | ||
| Fig. 5 a) Time course (logarithmic scale) of the current during the successive injection of eight different substrate solutions from the DCF-MBBA with different DCF concentrations (U = 330 mV vs. Ag/AgCl, Q = 500 μL min−1, lighter coloured area corresponds to the standard deviation). b) Plot of the peak currents against the concentration of the DCF calibrators and comparison with the calibration curve obtained with optical detection. | ||
Conclusions
In summary, we have developed an integrated system based on a microfluidic flow cell and a gold SPE for chronoamperometric detection of the TMB substrate from an immunoassay. Two microfluidic chips were designed and tested for optimal readout of the electrochemical signals. A complete assembly for fluid control and electrochemical readout was built around the microfluidic chips from commercially available parts so that interested scientists working with HRP/H2O2/TMB-based immunoassays can replicate them. After optimisation, the detection time per substrate solution could be reduced to 30 seconds with robust and reproducible signals. Another challenge is the ability to perform parallel multiple analyses as in optical reading of well plate-based immunoassays. However, our system offers higher sensitivity for single samples with three times higher SNR and is a promising alternative for high-throughput sample analysis, as it forms a space-saving and mobile detection device with the microfluidic chip core unit. In that, the system developed here facilitates the transition from a conventional immunoassay using the HRP/H2O2/TMB system to an autonomously operating immunosensor.Author contributions
Conceptualization, A. E. and J. B.; methodology, A. E. and J. B.; validation, A. E.; formal analysis, A. E.; investigation, A. E.; resources, R. J. S.; writing – original draft preparation, A. E.; writing – review and editing, J. B. and R. J. S.; visualization, A. E. and J. B.; supervision, R. J. S.; project administration, R. J. S.; funding acquisition, R. J. S.Conflicts of interest
There are no conflicts to declare.Acknowledgements
The authors thank C. Naese of BAM's Structure Analysis Division for the chip holder manufacturing. A. E. and R. J. S. thank the Indo-German Science and Technology Centre (IGSTC) and the Federal Ministry of Education and Research (BMBF) for funding (IDC-Water project, grant number: FKZ 01DQ18003A).Notes and references
- X. Y. Xiao, S. Hu, X. C. Lai, J. Peng and W. H. Lai, Trends Food Sci. Technol., 2021, 111, 68–88 CrossRef CAS
.
- F. Li, M. You, S. Li, J. Hu, C. Liu, Y. Gong, H. Yang and F. Xu, Biotechnol. Adv., 2020, 39, 107442 CrossRef CAS PubMed
-
S. K. Vashist and J. H. T. Luong, Handbook of Immunoassay Technologies: Approaches, Performances, and Applications, Elsevier Science, 2018 Search PubMed
- L. N. Dou, Y. C. Bai, M. G. Liu, S. B. Shao, H. J. Yang, X. Z. Yu, K. Wen, Z. H. Wang, J. Z. Shen and W. B. Yu, Biosens. Bioelectron., 2022, 204, 114093 CrossRef CAS PubMed
- I. M. Khoris, A. B. Ganganboina, T. Suzuki and E. Y. Park, Nanoscale, 2021, 13, 388–396 RSC
- Y. Si, J. Li, S. H. Jhung and H. J. Lee, Anal. Sci., 2022, 38, 11–21 CrossRef CAS PubMed
- H. Mehta, P. Patel, A. Mukherjee and N. S. Munshi, Clean: Soil, Air, Water, 2023, 51, 2100439 CAS
-
M. Aydin, E. B. Aydin and M. K. Sezgintürk, in Advances in Clinical Chemistry, ed. G. S. Makowski, Elsevier, 2021, vol. 102, pp. 1–62 Search PubMed
- L. F. Huergo, K. A. Selim, M. S. Conzentino, E. C. M. Gerhardt, A. R. S. Santos, B. Wagner, J. T. Alford, N. Deobald, F. O. Pedrosa, E. M. de Souza, M. B. Nogueira, S. M. Raboni, D. Souto, F. G. M. Rego, D. L. Zanette, M. N. Aoki, J. M. Nardin, B. Fornazari, H. M. P. Morales, V. A. Borges, A. Nelde, J. S. Walz, M. Becker, N. Schneiderhan-Marra, U. Rothbauer, R. A. Reis and K. Forchhammer, ACS Sens., 2021, 6, 703–708 CrossRef CAS PubMed
- N. A. Abdelshafi, J. Bell, K. Rurack and R. J. Schneider, Drug Test. Anal., 2019, 11, 492–500 CrossRef CAS PubMed
- J. Li and P. B. Lillehoj, ACS Sens., 2021, 6, 1270–1278 CrossRef CAS PubMed
- O. D. Hendrickson, J. O. Chertovich, A. V. Zherdev, P. G. Sveshnikov and B. B. Dzantiev, Food Control, 2018, 84, 330–338 CrossRef CAS
- T. T. Ngo, Anal. Lett., 2010, 43, 1572–1587 CrossRef CAS
- S. Höfs, D. Hülagü, F. Bennet, P. Carl, S. Flemig, T. Schmid, J. A. Schenk, V. D. Hodoroaba and R. J. Schneider, ChemElectroChem, 2021, 8, 2597–2606 CrossRef
- P. Fanjul-Bolado, M. B. Gonzalez-Garcia and A. Costa-Garcia, Anal. Bioanal. Chem., 2005, 382, 297–302 CrossRef CAS PubMed
- F. S. Felix and L. Angnes, Biosens. Bioelectron., 2018, 102, 470–478 CrossRef CAS PubMed
- N. Soda, K. Clack and M. J. A. Shiddiky, Sens. Diagn., 2022, 1, 343–375 RSC
- T. Thiele, B. Ibarlucea, T. F. Akbar, C. Werner and G. Cuniberti, Sens. Diagn., 2022, 1, 558–565 RSC
- B. Dai, S. Chen, W. Li, L. Zheng, X. Han, Y. Fu, J. Wu, F. Lin, D. Zhang and S. Zhuang, Sens. Actuators, B, 2019, 300, 127017 CrossRef CAS
- P. Ashokkumar, J. Bell, M. Buurman and K. Rurack, Sens. Actuators, B, 2018, 256, 609–615 CrossRef CAS
- C. M. Pandey, S. Augustine, S. Kumar, S. Kumar, S. Nara, S. Srivastava and B. D. Malhotra, Biotechnol. J., 2018, 13, 1700047 CrossRef PubMed
- S. C. Burnage, J. Bell, W. Wan, E. Kislenko and K. Rurack, Lab Chip, 2023, 23, 466–474 RSC
- A. Ecke, T. Westphalen, J. Hornung, M. Voetz and R. J. Schneider, Anal. Bioanal. Chem., 2022, 414, 1563–1573 CrossRef CAS PubMed
- N. Steinke, S. Döring, R. Wuchrer, C. Kroh, G. Gerlach and T. Härtling, Sens. Actuators, B, 2019, 288, 594–600 CrossRef CAS
- S. Dini and H. Khanmohammadi, Spectrochim. Acta, Part A, 2019, 222, 117157 CrossRef CAS PubMed
- T. Kokab, A. Shah, M. A. Khan, M. Arshad, J. Nisar, M. N. Ashiq and M. A. Zia, ACS Appl. Nano Mater., 2021, 4, 4699–4712 CrossRef CAS
- H. Wang and Z. Ma, Biosens. Bioelectron., 2019, 132, 265–270 CrossRef CAS PubMed
- Y. Liu, H. Shen, X. Yang, S. Kang, L. Cai, T. Tian, R. Su, C. Yang and Z. Zhu, TrAC, Trends Anal. Chem., 2023, 158, 116894 CrossRef CAS
- M. W. Glasscott, E. W. Brown, K. Dorsey, C. H. Laber, K. Conley, J. D. Ray, L. C. Moores and A. Netchaev, Anal. Chem., 2022, 94, 11983–11989 CrossRef CAS
- J. Yamada and H. Matsuda, J. Electroanal. Chem. Interfacial Electrochem., 1973, 44, 189–198 CrossRef CAS
- A. A. Karyakin, E. E. Karyakina and L. Gorton, J. Electroanal. Chem., 1998, 456, 97–104 CrossRef CAS
- P. Gharpure, S. Veeralingam and S. Badhulika, Microfluid. Nanofluid., 2021, 25, 84 CrossRef CAS
- D.-G. Jeon, M. J. Lee, J. Heo, S. Y. Lee, Y. C. Boo and S.-W. Nam, Electron. Mater. Lett., 2023, 19, 342–349 CrossRef CAS
- A. Tillo, J. Bartelmess, V. P. Chauhan, J. Bell and K. Rurack, Anal. Chem., 2019, 91, 12980–12987 CrossRef CAS PubMed
- A. Harrer, R. Lang, R. Grims, M. Braitsch, T. Hawranek, W. Aberer, L. Vogel, W. Schmid, F. Ferreira and M. Himly, PLoS One, 2010, 5, e13707 CrossRef PubMed
- J. Yamada and H. Matsuda, J. Electroanal. Chem. Interfacial Electrochem., 1973, 44, 189–198 CrossRef CAS
- P. Palladino, F. Torrini, S. Scarano and M. Minunni, Anal. Bioanal. Chem., 2020, 412, 7861–7869 CrossRef CAS PubMed
- X. F. Yang, W. He, Y. F. Li, P. F. Gao and C. Z. Huang, ACS Appl. Nano Mater., 2022, 5, 1484–1490 CrossRef CAS
- Z. P. Meng, S. L. Wu, L. H. Zhong, X. Q. Sun, L. Li and S. F. Zhang, Nanotechnology, 2019, 30, 135502 CrossRef CAS PubMed
- X. Zhang, X. M. Li, Y. H. Lang and P. Wu, Anal. Chem., 2022, 94, 4373–4379 CrossRef CAS PubMed
Footnotes |
| † Electronic supplementary information (ESI) available: Microfluidic setup and electrochemical immunoassays. See DOI: https://doi.org/10.1039/d3sd00095h |
| ‡ Current address: BGE Bundesgesellschaft für Endlagerung mbH; 38226 Salzgitter, Germany. |
| This journal is © The Royal Society of Chemistry 2023 |