 Open Access Article
Creative Commons Attribution 3.0 Unported Licence
A nucleic acid-based magnetic potentiometric aptasensing platform for indirect detection of prostate-specific antigen with catalytic hairpin assembly
Shuo
Tian
,
Lingting
Huang
,
Yuan
Gao
,
Zhichao
Yu
and
Dianping
Tang
 *
*
Key Laboratory for Analytical Science of Food Safety and Biology (MOE & Fujian Province), Department of Chemistry, Fuzhou University, Fuzhou 350108, People's Republic of China. E-mail: dianping.tang@fzu.edu.cn
First published on 4th April 2023
Abstract
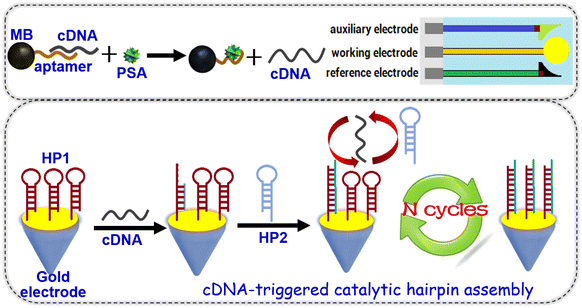
In this work, a new nucleic acid-based magnetic potentiometric aptasensing platform was designed for in situ amplified measurement of prostate-specific antigen (PSA) with the catalytic hairpin assembly (CHA). The nucleic acid biosensor was constructed by immobilizing thiolated hairpin DNA1 (HP1) on a screen-printed gold electrode (SPGE). PSA-specific aptamers were conjugated onto magnetic beads through the avidin–biotin reaction, followed by hybridization with partially complementary DNA (cDNA). Introduction of target PSA could cause the detachment of cDNA from magnetic beads because of the PSA–aptamer reaction. The detached cDNA opened the immobilized HP1 on the SPGE to induce the catalytic hairpin assembly between HP1 and hairpin DNA2 (HP2), thereby resulting in the recycling of cDNA for repeated utilization. In this case, numerous HP1 and HP2 probes were opened to form many double-stranded DNA molecules on the electrode. Relative to the HP1-modified SPGE, the electric potential was shifted before and after hybridization with HP2. Under optimum conditions, the potential shift was proportional to the PSA concentration within the dynamic range of 0.01–30 ng mL−1, and the limit of detection was estimated to be 9.3 pg mL−1 PSA. The reproducibility with the inter-assay and intro-assay was below 10.58% (RSD). Good specificity and long-term stability were acquired for PSA measurement. Importantly, the method accuracy of nucleic acid-based magnetic potentiometric aptasensing was acceptable for analysis of human serum samples in comparison with that of reference human PSA ELISA kits.
Introduction
An aptamer (an oligonucleotide sequence of DNA or RNA, XNA, or peptide) is usually obtained from a library of nucleic acids through an in vitro screening technique (i.e., systematic evolution of ligands by exponential enrichment, SELEX).1 Thanks to specifically binding with different molecules (e.g., cancer biomarkers, small molecules, metal ions and so on), aptamers have been widely applied in analytical fields.2,3 The enzyme-linked immunosorbent assay (ELISA) method plays an important role in the detection of various biological molecules, and many kits on the market have been developed on the basis of this principle.4,5 However, the corresponding antibodies as biosensing probes are relatively expensive and easy to denature through environmental factors such as pH and temperature.6 In contrast, aptamers are smaller than proteins, easy to synthesize, stable, and have the same sensitivity as antigen–antibody reactions.7,8 Therefore, aptamers are expected to replace the conventional ELISAs and become powerful tools for the detection of various biomolecules.Recently, different aptasensing protocols have been reported and developed for analysis and quantification of biomolecules.9–11 Mahjub et al. constructed a label-free colorimetric aptasensing approach for the detection of tobramycin in milk based on a cationic polymer and silver nanoparticles.12 Zeng et al. presented an engineered palindromic molecular beacon based Z-scheme photoelectrochemical aptasensing platform for the selective screening of kanamycin.13 Mohammadi et al. developed an electrochemical aptasensing platform for solvated mercuric ions based on gold nanoparticle-coated MoS2 multiwalled carbon nanotubes.14 Recent studies have looked at developing innovative and powerful aptasensing schemes for detection of disease-related proteins, e.g., carcinoembryonic antigen (CEA),15 and prostate-specific antigen (PSA).16 Loyez et al. summarized recent advances on optical fiber aptasensing systems over the last decade for the detection of biomarkers at extremely low concentrations and in small volumes.17 Kou et al. highlighted recent advances in optical platform-based sensing strategies for cancer diagnostics using aptamers.18 Introduction of aptamers gave a low-cost sensing design and a similar analytical performance to antibody-based assays.
For the successful development of aptamer-based cancer diagnostics, an important aspect is how to achieve an in situ amplified detectable signal through various signal-transduction methods.19,20 Potentiometers (i.e., pH meter) are currently one of the most widely used devices in the world because of their portable size, easy operation, low cost and reliable quantitative results.21 Potentiometric measurements are often carried out with a two-electrode system including a working electrode and reference electrode without external excitement such as current and voltage.22 Gao et al. introduced a versatile approach to carry out potentiometric aptasensing of Escherichia coli by electrogenerated chemiluminescence.23 To the best of our knowledge, a few reports were focused on the potentiometric measurement of cancer biomarkers.24–28 One of the major bottlenecks for potentiometric aptasensors is how to amplify the detectable signal. Catalytic hairpin assembly (CHA; an enzyme-free amplification method) has been proven to be useful in amplifying the transducing signals at the terminus since it could yield a hundred-fold catalytic amplification with a negligible background and the transducer analyte binding to various detection modalities.29 In this regard, CHA can be employed as the specific end-point transducer for development of isothermal amplification strategies.30 To this end, our motivation in this study is to utilize the CHA-based amplification strategy for fabrication of a potentiometric aptasensing platform to determine disease-related proteins.
Prostate-specific antigen (PSA) belongs to the serine protease family with tissue specificity and a chymotrypsin-like effect, and decomposes the main gelatinous protein in semen and dilute semen.31 Elevated serum PSA is seen in pathological conditions of the prostate, such as prostatitis and benign prostatic hyperplasia.32 Herein, we devise a magnetic potentiometric aptasensing platform for indirect detection of PSA with catalytic hairpin assembly (Scheme 1). This system involves two hairpin DNA probes, complementary DNA and PSA-specific aptamers. The dissolution of complementary DNA by the target PSA triggers catalytic hairpin assembly between hairpin DNA1 and hairpin DNA2. The recycling of complementary DNA can amplify the detectable signal via the shift in the electrode potential before and after hybridization of hairpin DNA1 with hairpin DNA2. The major objective of this work is to construct a new potentiometric aptasensing system for the analysis of low-abundance proteins with high sensitivity and specificity.
Experimental section
Materials and reagents
Human PSA standards were purchased from AmyJet Sci. Inc. (Wuhan, China). All the oligonucleotides used in this study were acquired from Sangon Biotech. Co., Ltd. (Shanghai, China) as follows: PSA-specific biotinylated aptamer: 5′-biotin-(T)10-ATTAAAGCTCGCCATCAAATAGC TGC-3′, partially complementary DNA with PSA aptamer (cDNA): 5′-CGACATCT AACCTAGCTCACTGACGCAGCTATTT-3′, hairpin DNA1 (HP1): 5′-SH-GTCAGTGAGCTAGGTTAGATGTCGCCATGTGTAGACGACA TCTAACCTAGC-3′, and hairpin DNA2 (HP2): 5′-AGATGTCGTCTACACATGG CGACATCTAACCTAGCCCATGTGTAGA-3′ (note: the sequences of these oligonucleotides were designed by consulting these two studies16,33). Prior to the experiment, we used RNA folding prediction software to simulate the designed DNA structures for the formation of DNA hairpins (software: web servers for RNA secondary structure prediction, Mathews Lab, https://www.rna.urmc.rochester.edu). Streptavidin magnetic beads (Cat no.: HY-K0208; 10 mg mL−1; mean diameter: 1.0 μm; bind capacity for biotinylated oligonucleotides: >500 pmol mg−1) were obtained from MedChemExpress Inc. (Shanghai, China). All the screen-printed gold electrodes were obtained from Taobao (Weihai, China), which comprised a 4.0 mm gold working electrode, carbon counter electrode and Ag/AgCl reference electrode. 6-Mercaptohexanol (MCH) was obtained from Sigma-Aldrich (Shanghai, China). Ultrapure water was obtained from a Millipore water purification system (18.2 MΩ cm, Milli-Q, Millipore). All the other chemicals were of analytical grade, and used without further purification. All the buffers, including phosphate-buffered saline (PBS; 10 mM, pH 7.4) solution, were prepared according to guidelines. Tris-HCl buffer (10 mM, pH 7.5) contained 1.0 mM EDTA, 1.0 M NaCl and 0.1% Tween-20.Binding of biotinylated aptamers with streptavidin magnetic beads
The biotinylated aptamers were conjugated to streptavidin magnetic beads on the basis of the avidin–biotin reaction. Initially, the purchased magnetic beads were suspended on a mixer for vortex oscillation for 20 s. Then, 100 μL of 10 mg mL−1 magnetic beads were injected into a 1.5 mL centrifuge tube and magnetically separated on a magnetic rack, and the supernatant was discarded. The collected magnetic beads were washed twice with 1.0 mL of Tris-HCl buffer (10 mM, pH 7.5). Following that, 500 μL of 10 μM aptamers dispersed in the above Tris–HCl buffer was added to the magnetic beads, and incubated (30 min at room temperature and 2 h at 4 °C) on a rotary mixer. The resulting suspension was separated magnetically and washed as before. Aptamer-conjugated magnetic beads (designated as Apt-MB) were dispersed into 500 μL of Tris-HCl buffer (10 mM, pH 7.5) at an Apt-MB concentration of ∼2.0 mg mL−1 for use.Preparation of the hairpin DNA1-modified screen-printed electrode
The thiolated hairpin DNA1 probes were modified onto a screen-printed gold electrode (active area: 12.56 mm2) through typical Au–S bonds. Firstly, the purchased screen-printed gold electrode was washed by sonication in ultrapure water and ethanol for 5 min, respectively. Then, the resulting electrode was scanned in 0.5 M deoxygenated H2SO4 with applied potentials from −0.3 to 1.5 V at 50 mV s−1 until a voltammogram characteristic of a clean gold electrode was established. After thorough rinsing with ultrapure water and ethanol, 100 μL of 10 μM thiolated aptamers were thrown on the working electrode, and incubated for 60 min at room temperature. After that, the resulting electrode was washed as before. 100 μL of 1.0 mM 6-mercaptohexanol in 10 mM Tris-HCl buffer (pH 7.5) was dropped on the electrode and reacted for 60 min at room temperature to block possible active sites and avoid non-specific adsorption. Finally, the hairpin DNA1-modified screen-printed gold electrode (HP1/SPGE) was stored at 4 °C for subsequent usage.Analytical process and potentiometric measurements
Scheme 1 gives a schematic illustration of the nucleic acid-based magnetic potentiometric aptasensing platform for the indirect determination of PSA with catalytic hairpin assembly. Prior to measurement, Apt-MB was initially hybridized with complementary DNA (cDNA) via adding 500 μL of 25 μM cDNA (excess) (note: The reason for using excess cDNA was to ensure an adequate hybridization reaction with the conjugated aptamers on magnetic beads for formation of cDNA/Apt-MB) into the Apt-MB suspension (500 μL, 2.0 mg mL−1) in Tris-HCl buffer (10 mM, pH 7.5) and reacted for 2.0 h at 37 °C to form cDNA/Apt-MB conjugates. After magnetic separation, the collected cDNA/Apt-MB conjugates were dispersed in 500 μL of Tris-HCl buffer (10 mM, pH 7.5) (Conc.[cDNA/Apt-MB] ≈ 2.0 mg mL−1). Following that, 50 μL of PSA standard/sample at a certain level was mixed with 50 μL of cDNA/Apt-MB conjugates (2.0 mg mL−1), and incubated for 70 min at 37 °C with slight shaking on a shaker. During this process, target PSA was specifically bound with the aptamer to release the cDNA. The supernatant after magnetic separation was dropped on the HP1/SPGE (note: The supernatant should contain the released cDNA and excess PSA protein, which should be discussed for non-specific adsorption in the subsequent work). Meanwhile, 50 μL of 25 μM hairpin DNA2 (HP2, excess) was added to the mixture, and incubated for 90 min at 37 °C to carry out the catalytic hairpin assembly. After washing with Tris-HCl buffer (10 mM, pH 7.5), the resulting electrode (i.e., HP2-HP1/SPGE) was measured in Tris-HCl buffer (10 mM, pH 7.5) by potentiometry with a two-electrode system including the HP2-HP1/SPGE working electrode and an Ag/AgCl reference electrode. The electrode potential (mV) was collected and registered as the sensing signal toward different concentrations of PSA standard/sample. All measurements were carried out at room temperature (25 ± 1.0 °C). Analyses were always made in triplicate.Results and discussion
Design and characterization of electrochemical aptasensor
In this work, PSA-specific aptamers were labeled onto the surface of magnetic beads through the classical avidin–biotin reaction between PSA-specific biotinylated aptamers and streptavidin magnetic beads. To fabricate the electrochemical sensing system, thiolated HP1 probes were modified onto the surface of a screen-printed gold electrode via Au–S bonds. In the presence of target PSA, the analyte specifically reacted with the labeled aptamer on a magnetic bead. In this case, the complementary DNA was released from the magnetic bead, which could readily open the hairpin DNA1 probe to implement the catalytic hairpin assembly upon addition of hairpin DNA2. In this case, the electrical potential (EMF) of the modified SPGE was changed before and after the catalytic hairpin assembly. By monitoring the shift in the EMF, we could quantitatively determine the concentration of target PSA in the sample.To realize our design, one crucial issue was whether the released cDNA could readily open hairpin DNA1. To demonstrate this concern, we used agarose gel electrophoresis to monitor the reaction. The results indicated that hairpin DNA1 could be opened through hybridization reaction with cDNA. Furthermore, the progression of catalytic hairpin assembly was investigated with gel electrophoresis by mixing cDNA, hairpin DNA1 and hairpin DNA2, acquiring an expected experimental result. Significantly, cDNA and hairpin DNA1 could not hybridize with hairpin DNA2 alone, indicating that the catalytic hairpin assembly was derived from the released cDNA in the presence of HP1 and HP2. Note: to avoid the possible overlapping with our previous work and the repeated description, the experimental results were not shown in this study. Please see our previously published work.16
Logically, another important concern arises about whether thiolated hairpin DNA1 probes could be immobilized onto the screen-printed gold electrode. To clarify this point, we employed a high-resolution inverted microscope to investigate the gold electrode before and after modification with thiolated hairpin DNA1 (Fig. 1). Fig. 1A gives a typical microscopy image of the cleaned gold electrode. When the thiolated hairpin DNA1 probes were modified onto the electrode, however, the gold surface became rougher than that of the cleaned gold electrode (Fig. 1B). Therefore, thiolated hairpin DNA1 could be modified onto the screen-printed gold electrode through Au–S bonds.
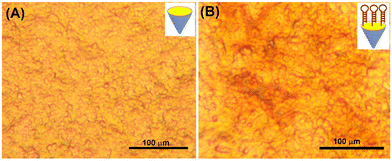 | ||
| Fig. 1 Microscopy images of (A) the cleaned screen-printed gold electrode and (B) HP1-modified screen-printed gold electrode. | ||
Electrochemical characterization and feasibility evaluation
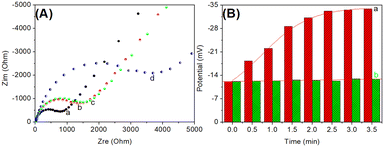
In this system, the electrical potential was acquired on the basis of the released cDNA, which triggered catalytic hairpin assembly on the HP1-modified SGPE. Because of specific PSA–aptamer reaction, the complementary cDNA could be dissociated from the aptamer/cDNA in the presence of target PSA. Logically, one puzzling issue is whether cDNA could cause the catalytic hairpin assembly on the modified electrode. To verify this issue, we used electrochemical impedance spectroscopy (EIS) to investigate this process on HP1-modified SPGE in pH 7.4 10 mM PBS containing 2.5 mM Fe(CN)64−/3− and 0.1 M KCl (Fig. 2A). Typically, the diameter of the semicircle in a Nyquist diagram is equivalent to the electron transfer resistance (Ret, ohms). Curve ‘a’ represents a typical Nyquist diagram of the cleaned SPGE, and a small resistance was achieved. After modification with HP1, the resistance of HP1/SPGE became large (curve ‘b’). The increased resistance was mainly derived from the negatively charged phosphate groups on the oligonucleotides, which repulsed the negatively charged Fe(CN)64−/3−. When the as-prepared HP1/SPGE reacted with cDNA, the resistance generally increased (curve ‘c’). The reason might be the fact that the resistance of hairpin HP1 (loop region) was almost the same as that of the partially complementary double-stranded DNA. Significantly, the resistance increased again after the catalytic hairpin assembly with HP2 (curve ‘d’), indicating the formation of double-stranded DNA. These results revealed that the prepared HP1/SPGE could be utilized for the catalytic hairpin assembly during the measurement.To further investigate the feasibility of this method, the prepared Apt-MB and HP1/SPGE were employed for the detection of PSA (1.0 ng mL−1 used as an example) with potentiometric measurement in Tris-HCl buffer (10 mM, pH 7.5) under different conditions (Fig. 2B). Column ‘b’ gives the electrical potentials of the magnetic potentiometric aptasensing system in the absence of target PSA, and the steady-state potential was about −12.2 mV. After the cDNA-Apt/MB reacted with 1.0 ng mL−1 PSA, the electrical potential of the formed HP2-HP1/SPGE became −33.2 mV (column ‘a’). The shift in the potential was mainly derived from the formed double-stranded DNA with a negative charge. These results indicated that the magnetic potentiometric aptasensing platform could be preliminarily applied for detection of target PSA.
Optimization of experimental conditions
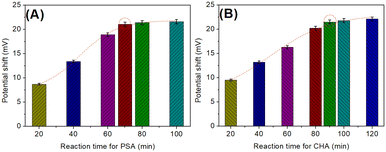
To acquire an optimal analytical performance, some experimental conditions, e.g., reaction time of cDNA/Apt-MB with target PSA, and time for the catalytic hairpin assembly, should be investigated. Note: 1.0 ng mL−1 PSA was used as an example for condition optimization. During the measurement, the signal intensity mainly depended on the released cDNA in the presence of target PSA. Fig. 3A shows the change in the electrical potential of the developed potentiometric aptasensing system relative to different reaction times between cDNA/Apt-MB and target PSA. The detectable signal increased with increased reaction time, and tended to level off after 70 min. A longer reaction time did not cause a significant increase. To save time for the assay, 70 min was used for the reaction of cDNA/Apt-MB with target PSA in this study.By the same token, we also investigated the effect of the catalytic hairpin assembly time on the electrical potential of the potentiometric aptasensing platform. As shown in Fig. 3B, an optimal electrical potential was achieved after 90 min. The results indicated that the reaction of HP1/SPGE with HP2 and cDNA could reach a dynamic equilibrium. Similarly, 90 min was selected for the catalytic hairpin assembly.
Analytical performance of potentiometric aptasensing toward PSA
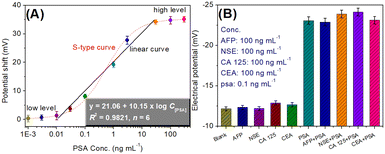
By using the as-prepared cDNA/Apt-MB and HP1/SPGE, target PSA standards with different concentrations were determined under the optimum conditions. The signal was collected on the basis of the shift in the electrical potential relative to background EMF. Fig. 4A gives the relationship between the potential shift and the logarithm of PSA concentration. Within the ranges of PSA standards at low levels (from 0.001 to 0.01 ng mL−1) or high concentrations (from 30 to 300 ng mL−1), the shift in the electrical potential was not obvious. Significantly, a good linear relationship between the potential shifts and the logarithm of PSA concentrations could be achieved in the dynamic range from 0.01 to 30 ng mL−1. The regression equation could be fit as y (mV) = 21.06 + 10.15 × log![[thin space (1/6-em)]](https://www.rsc.org/images/entities/char_2009.gif) C[PSA] (ng mL−1, R2 = 0.9821, n = 6). The limit of detection (LOD) could be estimated to be 9.3 pg mL−1 on the basis of 3S/K (where S stands for the slope of linear curve, and K is the standard deviation of 13 blank samples). Moreover, the linear range and LOD of our system were comparable with those of other PSA analytical methods with a potential readout (Table 1).
C[PSA] (ng mL−1, R2 = 0.9821, n = 6). The limit of detection (LOD) could be estimated to be 9.3 pg mL−1 on the basis of 3S/K (where S stands for the slope of linear curve, and K is the standard deviation of 13 blank samples). Moreover, the linear range and LOD of our system were comparable with those of other PSA analytical methods with a potential readout (Table 1).
| Method | Linear range | LOD | Ref. |
|---|---|---|---|
| Potentiometric immunoassay | 4.0–13 ng mL−1 | 3.4 ng mL−1 | 34 |
| Potentiometric immunoassay | 0.1–50 ng mL−1 | 0.1 ng mL−1 | 35 |
| Potentiometric immunoassay | 0.5–18 ng mL−1 | 0.1 ng mL−1 | 36 |
| Potentiometric immunoassay | 0.1–50 ng mL−1 | 0.04 ng mL−1 | 37 |
| Potentiometric immunoassay | 2.6–59.4 ng mL−1 | 2.0 ng mL−1 | 38 |
| Potentiometric immunoassay | 0.05–20 ng mL−1 | 13.6 pg mL−1 | 39 |
| Potentiometric aptasensing | 0.01–30 ng mL−1 | 9.3 pg mL−1 | This work |
Specificity, reproducibility and storage stability
The specificity of the potentiometric aptasensing system was monitored for the analysis of other non-target PSA proteins or biomarkers, e.g., alpha-fetoprotein (AFP), neuron-specific enolase (NSE), cancer antigen 125 (CA 125) and carcinoembryonic antigen (CEA). As seen from Fig. 4B, the electrical potentials of the modified HP1/SPGE were almost the same toward these non-target analytes. However, the electrical potential was obviously higher in the presence of target PSA. These results indicated that our developed potentiometric aptasensing system had good selectivity toward target PSA.Further, the reproducibility of the potentiometric aptasensing system was evaluated toward three PSA standards by using the same-batch or various-batch cDNA/Apt-MB and HP1/SPGE, respectively. Table 2 gives the experimental results. Obviously, the relative standard deviations (RSDs) were 9.81%, 7.69% and 5.59% for the inter-assay with 0.05, 1.0 and 20.0 ng mL−1 PSA, respectively, whereas these were 10.58%, 9.38% and 10.11% for the intra-assay toward the corresponding levels, indicating good reproducibility.
| Conc. | 1st assay | 2nd assay | 3rd assay | RSD (%) | |
|---|---|---|---|---|---|
| Intra-assay | 0.05 | 0.056 | 0.046 | 0.052 | 9.81 |
| 1.0 | 1.04 | 0.96 | 1.12 | 7.69 | |
| 20.0 | 18.9 | 21.1 | 19.7 | 5.95 | |
| Inter-assay | 0.05 | 0.056 | 0.046 | 0.048 | 10.58 |
| 1.0 | 0.94 | 1.08 | 1.13 | 9.38 | |
| 20.0 | 21.5 | 22.4 | 18.4 | 10.11 |
Finally, the storage stability of Apt-MB and HP1/SPGE was studied at 4 °C. The evaluation was implemented after storing them at 4 °C for some time, and then 1.0 ng mL−1 PSA was determined. The results indicated that the signals of the potentiometric aptasensing system could be maintained at 98.3%, 97.4%, 96.6%, 94.1%, 92.4% and 90.1% of the initial signal after storage for 1, 2, 3, 4, 6 and 8 months, respectively. Thus, the storage stability of Apt-MB and HP1/SPGE at 4 °C was acceptable.
Analysis of human serum samples
The accuracy of the potentiometric aptasensing system was evaluated for the analysis of real human serum samples, which were gifted by the hospital of our university. All the serum samples were measured referring to the above-described process. To study the practical application of the newly developed method, the obtained results from our system were compared with those obtained from a commercialized human PSA ELISA kit. As indicated from Table 3, no significant differences were encountered between the two methods at the 0.05 significance level because all texp values were less than 4.30 (tcrit [0.05, 2] = 4.30) (texp: experimental value; tcrit: critical value) by the application of an F-test. To this end, the potentiometric aptasensing method can be preliminarily used for the measurement of target PSA in real samples.| Sample no.a | Method, Conc. (mean ± SD, ng mL−1, n = 3) | t exp | |
|---|---|---|---|
| Aptasensor | ELISA kit | ||
| a All samples were diluted with a blank human serum sample within the linear range of the potentiometric aptasensor. b Sample #6 was obtained through the dilution of sample #5 to 10-fold. | |||
| 1 | 23.11 ± 2.12 | 21.23 ± 1.36 | 1.29 |
| 2 | 4.56 ± 0.31 | 4.89 ± 0.28 | 1.37 |
| 3 | 13.12 ± 0.12 | 14.27 ± 0.89 | 2.22 |
| 4 | 27.12 ± 1.29 | 25.6 ± 1.65 | 1.26 |
| 5 | 5.41 ± 0.31 | 5.23 ± 0.22 | 0.82 |
| 6b | 0.51 ± 0.019 | 0.59 ± 0.035 | 3.48 |
Conclusions
In summary, a simple sensitive potentiometric aptasensing method was designed for quantitative monitoring of a low-abundance disease-related biomarker, PSA, in biological fluids. This system could be carried out by coupling with aptamer-functionalized magnetic beads and a hairpin probe-modified electrode. Relative to traditional PSA electrochemical detection methods, our strategy had the following advantages, e.g., avoiding the participation of expensive antibodies, and no requirement of enzyme labels. Meanwhile, the reaction of the target with the aptamer and potentiometric measurements were executed in two different systems, thereby efficiently decreasing the system interference. Significantly, our system can be extended for the fabrication of other biomarker-specific aptasensing systems by controlling the corresponding aptamer.Compliance with ethical standards
All experiments were performed in accordance with the Guidelines of Fuzhou University (China), and approved by the ethics committee at Fuzhou University, China. Informed consents were obtained from the human participants of this study.Author contributions
Shuo Tian: conceptualization, methodology, investigation, and writing – original draft. Lingting Huang: conceptualization, visualization, investigation, and writing – original draft. Zhichao Yu: resources, software, and data curation. Yuan Gao: investigation, validation, formal analysis, and writing – original draft. Dianping Tang: funding acquisition, supervision, and writing – review & editing.Conflicts of interest
There are no conflicts to declare.Acknowledgements
The authors acknowledge the financial support from the National Natural Science Foundation of China (grant no.: 22274022 & 21874022).References
- R. Canovas, E. Daems, A. Langley and K. De Wael, Biosens. Bioelectron., 2023, 220, 114881 CrossRef CAS PubMed.
- J. Pan, W. Xu, W. Li, S. Chen, Y. Dai, S. Yu, Q. Zhou and F. Xia, Anal. Chem., 2023, 95, 420–432 CrossRef CAS PubMed.
- A. Downs and K. Plaxco, ACS Sens., 2022, 7, 2823–2832 CrossRef CAS PubMed.
- Z. Luo, L. Zhang, R. Zeng, L. Su and D. Tang, Anal. Chem., 2018, 90, 9568–9575 CrossRef CAS PubMed.
- L. Huang, J. Chen, Z. Yu and D. Tang, Anal. Chem., 2020, 92, 2809–2814 CrossRef CAS PubMed.
- B. Zhang, D. Tang, R. Goryacheva, R. Niessner and D. Knopp, Chem. – Eur. J., 2013, 19, 2496–2503 CrossRef CAS PubMed.
- M. Kohlberger and G. Gadermaier, Biotechnol. Appl. Biochem., 2022, 69, 1771–1792 CrossRef CAS PubMed.
- A. Miller, A. Rao, S. Nelakanti, C. Kujalowicz, T. Shi, T. Rodriguez, A. Ellington and G. Stovall, Anal. Chem., 2022, 94, 7731–7737 CrossRef CAS PubMed.
- B. Manuel, S. Sterling, A. Sanford and J. Heemstra, Anal. Chem., 2022, 94, 6436–6440 CrossRef CAS PubMed.
- M. Negahdary and L. Angnes, Biomater. Adv., 2022, 135, 112689 CrossRef PubMed.
- Y. Zhao, K. Yavari and J. Liu, TrAC, Trends Anal. Chem., 2022, 146, 116480 CrossRef CAS.
- R. Mahjub, O. Shayesteb, K. Derahshandeh, A. Ranjbar, F. Mehri and A. Heshmati, Food Chem., 2020, 382, 132580 CrossRef PubMed.
- R. Zeng, Z. Luo, L. Su, L. Zhang, D. Tang, R. Niessener and D. Knopp, Anal. Chem., 2019, 91, 2447–2454 CrossRef CAS PubMed.
- A. Mohammadi, E. Heydari-Bafrooei, M. Foroughi and M. Mohammadi, Microchem. J., 2020, 158, 105154 CrossRef CAS.
- S. Lv, K. Zhang, L. Zhu and D. Tang, Anal. Chem., 2020, 92, 1470–1476 CrossRef CAS PubMed.
- S. Lv, K. Zhang, Y. Zeng and D. Tang, Anal. Chem., 2018, 90, 7086–7093 CrossRef CAS PubMed.
- M. Loyez, M. DeRosa, C. Caucheteur and R. Wattiez, Biosens. Bioelectron., 2022, 196, 113694 CrossRef CAS PubMed.
- X. Kou, X. Zhang, X. Shao, C. Jiang and L. Ning, Anal. Bioanal. Chem., 2020, 412, 6691–6705 CrossRef CAS PubMed.
- X. Pei, B. Zhang, J. Tang, B. Liu, W. Lai and D. Tang, Anal. Chim. Acta, 2013, 758, 1–18 CrossRef CAS PubMed.
- G. Ibanez-Redin, G. Rosso Cagnani, O. Nathalia, P. Raymundo-Pereira, S. Sergio, M. Gutierrez, J. Krieger and O. Oliveira, Biosens. Bioelectron., 2023, 223, 114994 CrossRef CAS PubMed.
- X. Shang, J. Yu, C. Wang and Y. Du, Electroanalysis, 2022, 34, 535–541 CrossRef CAS.
- R. Gao, B. Liu, D. Luo, Y. Su and L. Su, Electroanalysis, 2022, 34, 275–280 CrossRef CAS.
- X. Gao, T. Jiang and W. Qin, Biosens. Bioelectron., 2022, 200, 113923 CrossRef CAS PubMed.
- Y. Chen, B. Liu, P. Lyu, H. Kwok, L. Ge and Q. Wu, Anal. Bioanal. Chem., 2021, 413, 1073–1080 CrossRef CAS PubMed.
- G. Li, W. Li, S. Li, X. Shi, J. Liang, J. Lai and Z. Zhou, Biochem. Eng. J., 2020, 164, 107780 CrossRef CAS.
- Z. Hong, G. Chen, S. Yu, R. Huang and C. Fan, Anal. Methods, 2018, 10, 5364–5371 RSC.
- G. Zelada-Guillen, A. Tweed-Kent, M. Niemann, H. Goringer, J. Riu and F. Rius, Biosens. Bioelectron., 2013, 41, 366–371 CrossRef CAS PubMed.
- A. Duzgun, A. Maroto, T. Mairal, C. O'Sullivan and F. Rius, Analyst, 2010, 135, 1037–1041 RSC.
- J. Zhuang, W. Lai, G. Chen and D. Tang, Chem. Commun., 2014, 50, 2935–2938 RSC.
- H. Gong, X. Hu, R. Zeng, Y. Li, J. Xu, M. Li and D. Tang, Sens. Actuators, B, 2022, 369, 132307 CrossRef CAS.
- Z. Lv, R. Zeng, L. Zhu, Z. Qiu, M. Li and D. Tang, Sens. Actuators, B, 2022, 370, 132440 CrossRef CAS.
- G. Cai, Z. Yu, R. Ren and D. Tang, ACS Sens., 2018, 3, 632–639 CrossRef CAS PubMed.
- C. Jung, P. Allen and A. Ellington, Nat. Nanotechnol., 2016, 11, 157–163 CrossRef CAS PubMed.
- Y. Liu, Thin Solid Films, 2008, 516, 1803–1808 CrossRef CAS.
- J. Szucs, E. Pretsch and R. Gyurcsanyi, Analyst, 2009, 134, 1601–1607 RSC.
- X. Wang, G. Tao and Y. Meng, Electroanalysis, 2009, 21, 2109–2115 CrossRef CAS.
- B. Zhang, B. Liu, G. Chen and D. Tang, Biosens. Bioelectron., 2014, 53, 465–471 CrossRef CAS PubMed.
- M. Rebelo, C. Santos, J. Costa-Rodrigues, M. Fernandes, J. Noronha and M. Sales, Electrochim. Acta, 2014, 132, 142–150 CrossRef.
- S. Lv, Z. Lin, K. Zhang, M. Lu and D. Tang, Anal. Chim. Acta, 2017, 964, 67–73 CrossRef CAS PubMed.
| This journal is © The Royal Society of Chemistry 2023 |

