 Open Access Article
First-principles surface reaction rates by ring polymer molecular dynamics and neural network potential: role of anharmonicity and lattice motion
Chen
Li
a,
Yongle
Li
 *b and
Bin
Jiang
 *a
*a
aKey Laboratory of Precision and Intelligent Chemistry, Department of Chemical Physics, Key Laboratory of Surface and Interface Chemistry and Energy Catalysis of Anhui Higher Education Institutes, University of Science and Technology of China, Hefei, Anhui 230026, China. E-mail: bjiangch@ustc.edu.cn
bDepartment of Physics, International Center of Quantum and Molecular Structures, Shanghai Key Laboratory of High Temperature Superconductors, Shanghai University, Shanghai 200444, China. E-mail: yongleli@shu.edu.cn
First published on 6th April 2023
Abstract
Elementary gas–surface processes are essential steps in heterogeneous catalysis. A predictive understanding of catalytic mechanisms remains challenging due largely to difficulties in accurately characterizing the kinetics of such steps. Experimentally, thermal rates for elementary surface reactions can now be measured using a novel velocity imaging technique, providing a stringent testing ground for ab initio rate theories. Here, we propose to combine ring polymer molecular dynamics (RPMD) rate theory with state-of-the-art first-principles-determined neural network potential to calculate surface reaction rates. Taking NO desorption from Pd(111) as an example, we show that the harmonic approximation and the neglect of lattice motion in the commonly-used transition state theory overestimates and underestimates the entropy change during the desorption process, respectively, leading to opposite errors in rate coefficient predictions and artificial error cancellations. Including anharmonicity and lattice motion, our results reveal a generally neglected surface entropy change due to significant local structural change during desorption and obtain the right answer for the right reasons. Although quantum effects are found to be less important in this system, the proposed approach establishes a more reliable theoretical benchmark for accurately predicting the kinetics of elementary gas–surface processes.
1. Introduction
Heterogeneous catalysis plays an irreplaceable role in large-scale chemical production and energy conversion. But achieving a predictive understanding of heterogeneous catalysis remains a grand challenge, as each catalytic reaction may involve a chain of interfacial elementary processes.1 Accurate kinetics of elementary reactions at catalyst surfaces are thus crucial for reliable microkinetic modelling of whole catalytic processes across a wide range of reaction conditions that can guide rational catalysis design.2 Experimental methods for measuring surface reaction rate coefficients were limited until very recently. Wodtke, Kitsopoulos and coworkers have accurately measured the thermal rates of a number of representative elementary reactions at metal surfaces by detecting velocity-resolved kinetic traces via ion imaging techniques.3–11 Such experiments not only shed valuable light onto site-dependent surface reaction mechanisms,5 inspiring further ab initio molecular dynamics (AIMD) investigations,12,13 but also reveal quantum effects in the thermal recombination of H2 at metal surfaces.10 These experimental data are of great value for benchmarking surface reaction rate theories.6On the other hand, theoretical predictions of surface reaction rate coefficients, especially in heterogeneous catalysis, rely largely on traditional transition state theory (TST)14,15 using energetic information of stationary points that can be routinely optimized by density functional theory (DFT). However, the traditional TST method for surface reactions16 often invokes several over-simplified assumptions. Firstly, it considers only the transition state (TS) with the lowest energy and neglects multiple site-dependence. Secondly, it uses a harmonic approximation to estimate partition functions. Finally, it assumes that the partition function of the surface site is unchanged by adsorption/desorption and neglects coupling between molecular and surface degrees of freedom (DOFs), not to mention the intrinsic absence of recrossing and quantum tunneling in the TST. With such simplifications, TST-predicted surface reaction rate coefficients sometimes deviate heavily from experimental data.5,10 Improvements have been made to the TST for surface reactions by using, for example, the hindered translator and hindered rotor models17–19 or complete potential energy sampling.20 Lattice vibrational modes (i.e. phonons) and dynamical effects (i.e. recrossing) were, however, rarely included in these improved TST models. One exception was the recent work by Jackson21 who calculated the TST rate constant for CH4 dissociation on Ir(111), adding 81 lattice DOFs to the partition functions.
There are several theoretical studies on surface reaction kinetics which try to go beyond this TST framework and include lattice motion. Gillan and Alfè derived the formulae for calculating the thermal desorption rate of the adsorbate(s) with varying coverage on a surface based on chemical potentials,22 which can be compared with a temperature programmed desorption (TPD) experiment. They applied this approach to the desorption of H2O/D2O on MgO(001) using an empirical potential23,24 or AIMD at the DFT level.22,25 Wang and Zhao calculated the diffusion rate coefficients of H on Ni(100) and the dissociation/recombination rate coefficients of CH4 on Ni(111) using the quantum instanton approach based on embedded diatomics-in-molecules force fields.26–28 Recently, Chen et al. computed thermal diffusion rates of CO on Ru(0001) with AIMD using a novel enhanced sampling scheme.29 Galparsoro et al. directly calculated the reactive flux for thermal recombinative desorption of hydrogen from Cu(111) via classical AIMD and compared it with a thermal desorption experiment based on a high-temperature permeation method.30 These studies, however, suffer from either the low accuracy of the empirical potential or the high cost of the AIMD simulation.
A recently proposed ring polymer molecular dynamics (RPMD) approach offers a promising way to calculate rate coefficients with high accuracy.31–33 Exploiting the isomorphism between the statistical properties of a quantum system and those of a classical system in which each particle is represented by the centroid of a ring polymer,34 the path integral-based RPMD method has proven to yield correct quantum mechanical rate coefficients in the harmonic potential, high-temperature, and short-time limits.31,35 The RPMD rate theory has been widely applied in calculating rate coefficients of bimolecular reactions in the gas phase based on highly-accurate ab initio potential energy surfaces (PESs) and has been shown to be able to properly describe quantum effects, e.g., zero-point energy and tunneling, representing a superior alternative to TST-based methods.36–50 However, RPMD has rarely been applied in surface reactions, where many more DOFs are involved. In an early study, Suleimanov applied RPMD rate theory to calculate the diffusion constants of hydrogen on Ni(100) with an embedded atom method interatomic potential.51 More recently, non-equilibrium RPMD simulations for gas–surface scattering was carried out to calculate dissociative sticking probabilities52–55 and diffusion constants of hydrogen on a single-atom catalytic surface.56
On the other hand, recently developed machine learning methods have greatly facilitated the construction of high-dimensional gas–surface PESs57–61 with first-principles accuracy, which offer a new opportunity for the efficient prediction of surface reaction rates. In this work, we combine RPMD rate theory with a state-of-the-art neural network (NN) based PES including all relevant DOFs. This combination allows us to compute thermal rate coefficients of elementary gas–surface processes efficiently and accurately. We chose to study the desorption of NO on Pd(111) as the first example, for which accurate velocity-resolved kinetic data between 620 K and 800 K have been measured very recently.8 Our work differs from recent work by Chen et al., who calculated the diffusion constants of CO on Ru(0001) with a neural network potential on a rigid surface.62 As we will show below, surface relaxation can significantly affect the entropy change and thus the desorption rate coefficients.
The rest of this article is organized as follows. Section 2 presents the potential energy surface of the system of interest and an overview of the general RPMD rate theory adapted to gas–surface reactions. Section 3 discusses how the harmonic approximation and the neglect of surface DOFs affect the desorption rate coefficients of NO from Pd(111) where entropy plays a critical role. We provide conclusions in Section 4.
2. Computational details
2.1. Potential energy surface
A global PES including all relevant molecular and surface DOFs is necessary for computing rate coefficients using MD-based approaches. To achieve high efficiency, an analytical PES for the NO + Pd(111) system was constructed in this work by the recently developed embedded atom neural network (EANN) method, which has been detailed elsewhere.63–65 In the EANN approach, the total energy is expressed as the sum of atomic energies and the complexity of the PES thus scales linearly with system size. Each atomic energy is dependent on its atomic environment, which is represented by an array of embedded atom density (EAD) descriptors.66 Such EAD descriptors are obtained from the square of the linear combination of Gaussian-type orbitals (GTOs) located at neighbor atoms inside a cutoff sphere with a radius of 6 Å, serving as the input vector of each atomic NN to output the atomic energy. The GTO is expressed as,φ(rij) = xlxylyzlz![[thin space (1/6-em)]](https://www.rsc.org/images/entities/char_2009.gif) exp(−α|r − rs|2), exp(−α|r − rs|2), | (1) |
The training dataset containing 2503 DFT points with both energies and forces was generated by a trajectory-free active learning strategy.67,68 All DFT calculations were performed by the Vienna ab initio simulation package (VASP)69,70 with spin-polarization using the revised Perdew–Burke–Ernzerhof (RPBE) functional.71 The flat surface of Pd(111) was modeled by a four-layer slab, which has a 3 × 3 surface unit cell with the top two layers relaxed and a vacuum region of 15 Å in the Z direction. The kinetic energy in the plane wave basis set was truncated at 400 eV and the Brillouin zone was sampled by a 5 × 5 × 1 Monkhorst–Pack k-point mesh. The adsorption energy was found to converge within a few dozens of meV with respect to the number of layers and k-points.
2.2. Ring polymer molecular dynamics
The RPMD rate theory has been well established elsewhere,72 so here we give only a brief summary. The quantum mechanical expression of the thermal rate coefficient was first formulated in terms of the Kubo-transformed flux–side correlation function,73–75 | (2) |
 | (3) |
 | (4) |
![[s with combining macron]](https://www.rsc.org/images/entities/i_char_0073_0304.gif) (q) in eqn (3) is the dividing surface defined in terms of reaction coordinate ξ(
(q) in eqn (3) is the dividing surface defined in terms of reaction coordinate ξ(![[q with combining macron]](https://www.rsc.org/images/entities/b_char_0071_0304.gif) ), namely,
), namely,![[s with combining macron]](https://www.rsc.org/images/entities/i_char_0073_0304.gif) (q) = ξ( (q) = ξ(![[q with combining macron]](https://www.rsc.org/images/entities/b_char_0071_0304.gif) 1, …, 1, …, ![[q with combining macron]](https://www.rsc.org/images/entities/b_char_0071_0304.gif) N) − ξ‡ N) − ξ‡ | (5) |
![[v with combining macron]](https://www.rsc.org/images/entities/i_char_0076_0304.gif) s(p,q) is its conjugated speed,
s(p,q) is its conjugated speed, | (6) |
![[p with combining macron]](https://www.rsc.org/images/entities/b_char_0070_0304.gif) i and
i and ![[q with combining macron]](https://www.rsc.org/images/entities/b_char_0071_0304.gif) i are the centroid momentum and position vectors of the ith atom. h[
i are the centroid momentum and position vectors of the ith atom. h[![[s with combining macron]](https://www.rsc.org/images/entities/i_char_0073_0304.gif) (qt)] in eqn (3) is a Heaviside function of the dividing surface, which counts the fraction of trajectories passing through the dividing surface to the product side at time t. It is worthwhile pointing out that the RPMD rate coefficient is independent of the choice of the dividing surface and naturally reduces to the classical MD result when using a single bead.33
(qt)] in eqn (3) is a Heaviside function of the dividing surface, which counts the fraction of trajectories passing through the dividing surface to the product side at time t. It is worthwhile pointing out that the RPMD rate coefficient is independent of the choice of the dividing surface and naturally reduces to the classical MD result when using a single bead.33
To describe molecular desorption from the surface, we defined the reaction coordinate ξ(![[q with combining macron]](https://www.rsc.org/images/entities/b_char_0071_0304.gif) ) as the difference between the height of the molecular center of mass (COM) and the average height of the top layer of the surface as
) as the difference between the height of the molecular center of mass (COM) and the average height of the top layer of the surface as
 | (7) |
![[z with combining macron]](https://www.rsc.org/images/entities/i_char_007a_0304.gif) i and
i and ![[z with combining macron]](https://www.rsc.org/images/entities/i_char_007a_0304.gif) i′ are the z coordinates of the ith atomic centroid of the adsorbate and the i′th atomic centroid of the top layer surface. Since the NO desorption is barrierless, the TS is assumed to be the free molecule plus the clean surface in the asymptote; the position of the dividing surface ξ‡ is thus placed in the asymptotic area (here, ξ‡ = 13.4 bohr above the uppermost surface layer).
i′ are the z coordinates of the ith atomic centroid of the adsorbate and the i′th atomic centroid of the top layer surface. Since the NO desorption is barrierless, the TS is assumed to be the free molecule plus the clean surface in the asymptote; the position of the dividing surface ξ‡ is thus placed in the asymptotic area (here, ξ‡ = 13.4 bohr above the uppermost surface layer).
In practical calculations, it is advantageous to rewrite the RPMD rate coefficient in the Bennett–Chandler form,76,77
| k(T) = κ(t → ∞)kQTST(T). | (8) |
 | (9) |
On the other hand, kQTST(T) = cfs(t → 0+)/Qr(T) is the centroid-density quantum transition state theory (QTST) rate coefficient in the short-time limit.33 The QTST rate coefficient can be conveniently evaluated by the centroid potential of mean force (PMF) along the reaction coordinate,
 | (10) |
For comparison, we also computed rate coefficients with a harmonic TST (HTST) model,
 | (11) |
 is the partition function of the free NO molecule in a (1 × 1) unit cell excluding its translation in the z direction (i.e. the reaction coordinate); Qs is the clean surface component and Qad is the adsorbate–surface system. Note that in common TST implementations, the partition function of the surface component is generally assumed to be unchanged during desorption, so that Qs will be cancelled out and Qad will depend only on the DOFs of the adsorbate.
In both RPMD and HTST calculations, since the electronic DOFs were not explicitly taken into account, as suggested in the experimental work,8 we introduced approximate electronic partition functions, namely Qelg = 2 + 2![[thin space (1/6-em)]](https://www.rsc.org/images/entities/char_2009.gif) exp(−ΔE1/2→3/2/kBT) where ΔE1/2→3/2 = 120 cm−1 is the energy separation between the two lowest spin–orbital states of NO80 and Qelad = 2, for the free and adsorbed NO molecules, respectively.
exp(−ΔE1/2→3/2/kBT) where ΔE1/2→3/2 = 120 cm−1 is the energy separation between the two lowest spin–orbital states of NO80 and Qelad = 2, for the free and adsorbed NO molecules, respectively.
3. Results and discussion
3.1. Potential energy surface
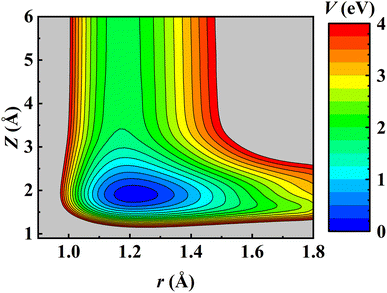
Consistent with previous theoretical studies,81–83 the NO molecule is found to adsorb perpendicularly on the fcc site with the N-terminal facing down with an adsorption energy of 1.844 eV on the relaxed Pd(111) surface. After the ZPE correction, the calculated binding energy E0 is 1.773 eV, very close to the experimental value (1.766 ± 0.024 eV) derived by fitting the measured data to a hindered-translator TST model.8 The NO adsorbate can diffuse on Pd(111) from the fcc site to the hcp site (∼0.045 eV higher in energy) through the bridge site and the corresponding barrier is 0.320 eV, in good agreement with the experimental estimate (0.29 ± 0.11 eV).8 It should be noted that the experimentally fitted diffusion barrier was not super accurate because the C3v symmetry of the Pd(111) surface was not held well by simply using two orthogonal one-dimensional potentials.8 On the other hand, the dissociation barrier of NO on Pd(111) was reported as 2.7 eV using the RPBE functional.81 Experimentally, NO dissociation was also never detected at surface temperatures from 620 K to 800 K.8 This implies that NO dissociation is much more difficult than its desorption on Pd(111) and would not affect the computation of desorption rates. Consequently, the NO + Pd(111) EANN PES in this work covers only the region where the N–O distance (r) is less than 1.8 Å. A two-dimensional cut of the PES is illustrated in Fig. 1, demonstrating the energy barrierless feature of molecular desorption and the smoothness of the PES that is beneficial to long-time MD simulations.The prediction root mean squared errors (RMSEs) of the PES with respect to the total energy and atomic forces are 37.7 meV (per cell; that is, ∼1.9 meV per mobile atom) and 37.3 meV Å−1, respectively. The stationary points of the PES compare well with the DFT data, as shown in Table 1, where the geometries and vibrational harmonic frequencies of NO are listed. The good agreement indicates that the EANN PES faithfully reproduces the DFT description along the reaction coordinate for NO desorption from Pd(111).
| Species | Property | EANN PES | DFT |
|---|---|---|---|
| a θ refers to the angle between the vector pointing from N to O and the surface normal. | |||
| Isolated NO | r (Å) | 1.174 | 1.176 |
| ν (cm−1) | 1848.0 | 1897.2 | |
| Adsorbed NO | Z (Å) | 1.923 | 1.931 |
| θ (°) | 0 | 0 | |
| r (Å) | 1.217 | 1.216 | |
| ν 1 (cm−1) | 1553.8 | 1547.5 | |
| ν 2 (cm−1) | 432.4 | 433.6 | |
| ν 3 (cm−1) | 432.3 | 433.1 | |
| ν 4 (cm−1) | 320.6 | 324.6 | |
| ν 5 (cm−1) | 182.0 | 184.7 | |
| ν 6 (cm−1) | 182.0 | 183.0 | |
3.2. Convergence tests on PMF
In the RPMD rate theory, the rate coefficient is obtained by calculating the transmission coefficient κ(t → ∞) and QTST rate coefficient kQTST(T), separately. Specifically, kQTST(T) depends on the PMF along the reaction coordinate. Here, the PMF is calculated by umbrella sampling78 and umbrella integration.79 In umbrella sampling, one defines a number of windows along the reaction coordinate ξ(![[q with combining macron]](https://www.rsc.org/images/entities/b_char_0071_0304.gif) ) and a biased ring-polymer Hamiltonian,
) and a biased ring-polymer Hamiltonian, ![[H with combining tilde]](https://www.rsc.org/images/entities/i_char_0048_0303.gif) n = (p,q), is constructed at each window,
n = (p,q), is constructed at each window, | (12) |
![[q with combining macron]](https://www.rsc.org/images/entities/b_char_0071_0304.gif) ) in each window, the PMF profile is calculated by umbrella integration along the reaction coordinate.
) in each window, the PMF profile is calculated by umbrella integration along the reaction coordinate.
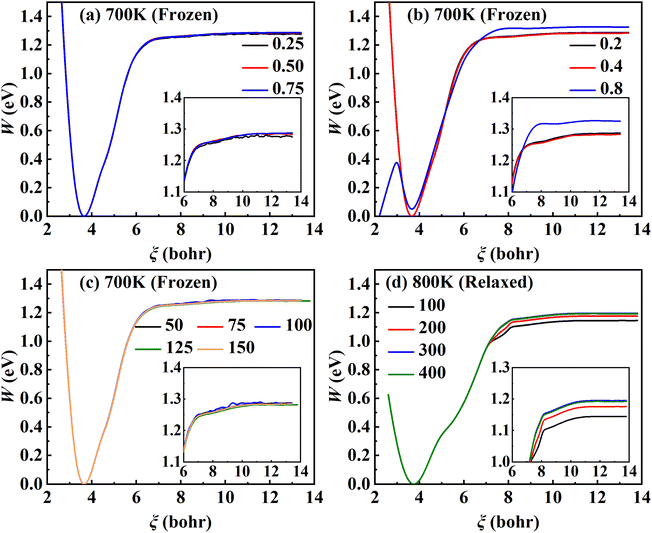
As the first RPMD application for a surface desorption process, we performed extensive convergence tests in calculating the PMF profile. For simplicity, we first tested in the frozen surface calculations with one bead (RPMD-1, or classical MD) the influence of some parameters, including the strength of the umbrella potential (kl), the window interval (Δξl) as well as the single trajectory time. In the umbrella integration, the probability density of ξ(![[q with combining macron]](https://www.rsc.org/images/entities/b_char_0071_0304.gif) ) in each window follows a normal distribution centered at ξl. It is advisable to have a sufficient overlap between the probability density distributions of neighboring windows. The ratio between the crossing point of two adjacent normal distributions and their average height was defined as an overlap factor (λ), which correlates kl with Δξl, namely,
) in each window follows a normal distribution centered at ξl. It is advisable to have a sufficient overlap between the probability density distributions of neighboring windows. The ratio between the crossing point of two adjacent normal distributions and their average height was defined as an overlap factor (λ), which correlates kl with Δξl, namely,
 | (13) |
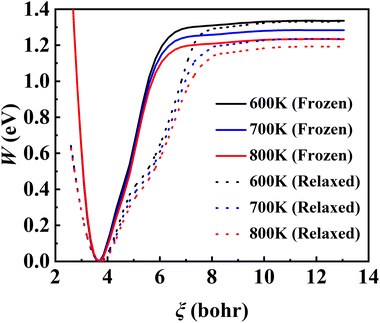
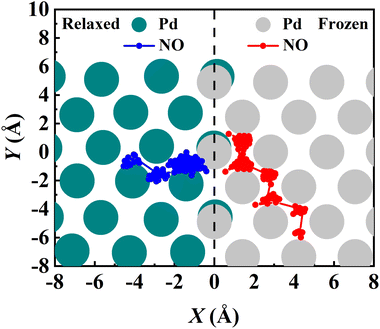
The converged PMF results with one bead on the frozen and relaxed surfaces at different temperatures are compared in Fig. 3. As expected, the increasing temperature gradually lowers the free energy of desorption, promoting the desorption of NO on Pd(111). Interestingly, the surface motion modifies the shape of the PMF profile, leaving the profile less harmonic along the reaction coordinate from the adsorbate (minimum) to the asymptote (TS). This is likely to be due to the involvement of surface DOFs allowing for anharmonic coupling between the molecular and surface vibrations, which may soften the frequency along the reaction coordinate. However, the overall free energy change is less affected by the lattice motion, the reasons for which will be discussed below. Moreover, to check the effect of NO diffusion on PMF convergence, snapshots of two representative trajectories at 700 K in the window near the PMF well are taken every 0.5 ps and are shown in Fig. 4. Clearly, NO can jump to neighboring sites and diffuse across unit cells. The diffusion occurs faster on the frozen surface than on the relaxed surface, because the kinetic energy of NO cannot dissipate to surface phonons in the former case. This explains why convergence of the PMF profiles for the relaxed surface is more difficult than for the frozen surface. In practice, the sufficiently long-time umbrella sampling by hundreds of consecutive trajectories adequately describes the diffusional behavior and guarantees the molecular traversal on the surface in determining the desorption PMF profiles.
3.3. Quantum effects
The RPMD rate theory is known to approximately capture quantum effects with multiple beads. While this has been routinely validated in polyatomic reactions in the gas phase,84 multi-bead RPMD simulations in gas–surface systems that involve many more DOFs remain very time-consuming. Fortunately, since all atoms in this NO + Pd(111) system are heavy, it is unlikely that the quantum tunneling effect will play any significant role. The ZPE change from the adsorbed NO to the free NO molecule is the most probable source of quantum effects. To check this possibility, we have calculated PMFs for NO desorption on a frozen Pd(111) at 700 K with different numbers of beads and the results are compared in Fig. 5. It is clear that the PMF profile barely changes with the number of beads increasing from one to eight, indicating a negligible quantum effect in this system. Unlike hydrogen atom diffusion51,85 (at low temperatures) and recombination10 on the metal surface where remarkable nuclear quantum effects were identified, our results suggest that quantum effects are less important in the case of molecular desorption of a heavy adsorbate, at least at high temperatures. Indeed, the diffusion of a hydrogen atom was also found to be not greatly influenced by quantum effects at moderate temperatures (e.g., 300 K).56 This is understandable since the molecular desorption (rather than recombination) process involves neither the breaking of a strong chemical bond nor a big change in ZPE. In addition, the binding energy is so large that the desorption has to occur at a very high temperature. It is thus encouraging that a classical description (one bead) is sufficient to converge the PMF of this process, which is adopted for all subsequent calculations. Hereafter, the corresponding single-bead results with and without consideration of the transmission coefficient are referred to as MD and classical TST (cTST), respectively.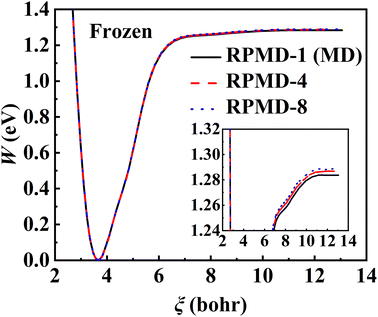 | ||
| Fig. 5 PMF profiles calculated by RPMD calculations with 1 bead (black solid line), 4 beads (red dashed line), and 8 beads (blue dotted line) at 700 K where Pd(111) is frozen. | ||
3.4. The effect of harmonic approximation
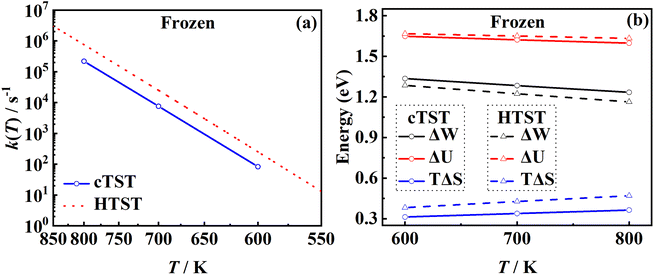
One of the major advantages of the RPMD method over the traditional TST is that the PMF is accurately determined from MD trajectories rather than invoking the harmonic approximation at static stationary points. To analyze the influence of anharmonicity alone, the surface is temporarily fixed at its equilibrium and the transmission coefficient is temporarily neglected. In this case, the MD rate coefficients reduce to the cTST ones, which are compared with those obtained by the HTST based on DFT-optimized energies and harmonic frequencies of stationary points on the frozen surface at various temperatures in Fig. 6a. Not surprisingly, the cTST rate coefficients are about 3–4 times lower than the HTST ones. To clearly analyze this difference, the changes in thermodynamic variables in the desorption process are evaluated. In the cTST case, the internal energy along the reaction coordinate U(ξ) was calculated from centroid virial theorem86 with the system constrained at the reaction coordinate ξ via the umbrella potential, | (14) |
3.5. The lattice effect
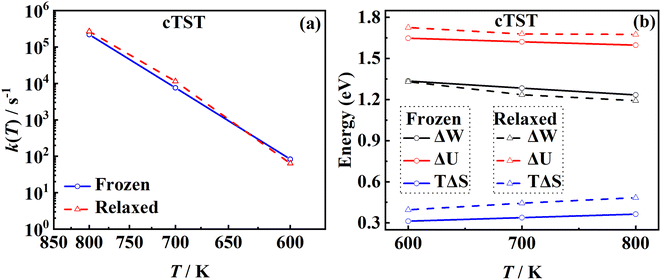
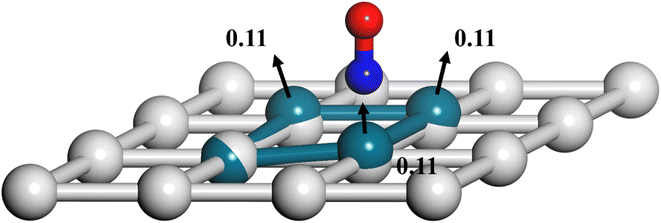
Another important advantage of the current RPMD method is that the couplings of DOFs belonging to the molecule and the substrate are fully included. In comparison, the traditional TST method is typically implemented by including vibrational frequencies associated with the adsorbate motion alone, while most of the time neglecting partition functions of surface DOFs, although the optimized stationary structures are obtained with surface relaxation. If the interactions between the adsorbate and the substrate in the reactant and barrier regions are very different, lattice motion could play a significant role. To check this possibility, the calculated cTST rate coefficients with frozen and relaxed surfaces are compared in Fig. 7a. At first glance, it is surprising that the desorption rate coefficients in the two cases are almost identical. This phenomenon can be rationalized after investigating the changes in internal energy, entropy and free energy separately in the desorption process, as shown in Fig. 7b. It turns out that the internal energy change on the non-frozen surface is higher than that on the frozen surface by about 71 meV, due largely to the increased binding energy via surface relaxation. In contrast, the entropy change on the non-frozen surface also becomes higher than that on the frozen surface by about 103 meV. The increase in entropy change in the former case can be understood as follows. Specifically, the molecule–surface interaction in the favorable adsorption site is so strong that the local surface configuration has been largely rearranged and the three Pd atoms closest to the NO molecule deviate most from their equilibrium positions, as shown in Fig. 8. This interaction confines the surface structure and leads naturally to a lower entropy than that for the unconstrained equilibrium surface structure after the molecule desorbs. This part of entropy change is absent in the frozen surface approximation. A similar entropy change of molecules adsorbed at different sites has actually been discussed before in the desorption of Pb from Mo(100) by Starr and Campbell, who found a large difference in the entropy of the adsorbates between the strongly bound step site and the weakly bound terrace site.87 What is different is that the change in surface structure is essential for the entropy change here.Overall, the effects of the changes in internal energy and entropy due to the lattice motion cancel out, leaving similar free energies and rate coefficients with or without surface DOFs. Similarly, in the RPMD calculations of H diffusion on Ni(100) with either one bead (classical) or multiple beads (quantum), a very minor lattice effect was also found on the diffusion coefficient, especially above the quantum-classical crossover temperature (70 K).51 For the dissociation of CH4 on Ir(111), Jackson also found that the lattice vibrational modes only lead to a slight change to the HTST rate constant.21 This is possibly because the entropy change in the dissociation of CH4 is mainly contributed by the breaking of the C–H bond rather than a change in the lattice structure.
3.6. The transmission coefficient
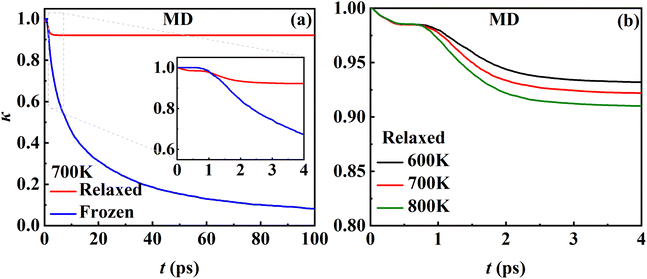
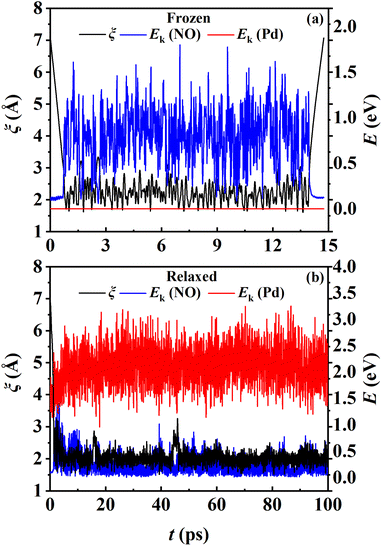
While the transmission coefficient (κ) is often neglected in the traditional TST, the RPMD rate theory accounts for this factor in a quantitative way, by the ratio of the flux–side correlation function in the long-time limit to that at time zero. In Fig. 9a, the time-dependent transmission coefficients for the frozen and relaxed surfaces at 700 K are compared. Interestingly, the transmission coefficient exhibits completely different behaviors in the two cases. For the frozen surface, κ experiences a plateau at the very beginning (the first ∼1 ps) and then decreases quite rapidly. Its value decays to ∼0.1 at 100 ps and appears to further decay to zero when the time is long enough. This behavior is uncommon in gas-phase reactions, where κ typically converges within tens to hundreds of fs.45,46 For the relaxed surface, however, the transmission coefficient converges to 0.92 very quickly at ∼4 ps. This indicates that the recrossing is practically insignificant in this process, which is consistent with the experimental observation.8 The large difference in κ in the two cases may have to be understood in terms of energy dissipation. Fig. 10 illustrates the evolution of the kinetic energies of the NO molecule moving towards the surface and of Pd atoms in the top two layers, and the associated reaction coordinate (ξ) as a function of time during two representative trajectories for computing κ on the frozen and relaxed surfaces. In any case, NO molecules slide from the TS to the adsorption well and are accelerated by the attraction. When the surface is frozen, the kinetic energy of NO has no way to dissipate and only exchanges with the potential energy. Thanks to conservation of energy, the total energy of NO on the frozen surface is always larger than the adsorption energy. As a result, the highly energetic NO adsorbate will scatter back after sufficient time and recross the dividing surface with a velocity towards the vacuum (Fig. 10a), which makes a negative contribution to eqn (9). In this way, κ decays to zero in the long-time limit. By contrast, on the relaxed surface, the molecular kinetic energy can largely transfer to surface Pd atoms, which stabilizes the adsorbate and prevents recrossing (Fig. 10b).In addition, Fig. 9b shows that κ on the relaxed surface decreases slightly with increasing temperature, possibly because the recrossing is enhanced at a higher temperature as the adsorbate has a higher thermal energy. These results underscore the importance of considering energy dissipation in the adsorption/desorption rate calculation. Therefore, the transmission coefficients are included in the following comparison of MD rate coefficients with experimental ones. Our observation is somewhat different from that in the RPMD calculations for the site-to-site hopping of hydrogen on the Ni(100) surface, where the recrossing was found not to be affected significantly by the lattice motion.51 It is likely that the diffusion of the adsorbed hydrogen is weakly coupled with the surface motion.
3.7. Comparison between the HTST and experiment
In Fig. 11, the MD rate coefficients of NO desorption on the movable Pd(111) surface are compared with the measured velocity-resolved kinetic data.8 The MD results give a good prediction of the shape of the log![[thin space (1/6-em)]](https://www.rsc.org/images/entities/char_2009.gif) k ∼ 1/T curve and the fitted activation energy (Ea = 1.731 eV) is very close to the experimental one (Ea = 1.71 ± 0.03 eV), as evidenced by the good agreement with the experimental binding energy E0 shown above. Whereas absolute rate coefficients are 3–4 times larger than experimental ones, because the calculated pre-factor (A = 1016.37 s−1) relying on the multi-dimensional topography of the PES deviates from experimental data (A = 1015.65±0.20 s−1). This discrepancy may have multiple sources of errors. For example, the diffusion barrier is probably too high so that the adsorbate entropy is underestimated, leading to desorption rate coefficients that are too large. In addition, the 3 × 3 supercell may not be large enough to eliminate the adsorbate–adsorbate interactions and/or perfectly reflect the surface structure change closest to the adsorbate so that the surface entropy change is underestimated. Another possibility is the neglect of the interaction of the adsorbate and metallic electron–hole pairs which is expected to be much stronger for the adsorbed NO than for the asymptotic NO, as observed for the NO + Au(111) case.88 This nonadiabatic effect may slow down the molecular motion so as to lower the desorption rate coefficients. In fact, Gu et al. have found that H* diffusion is slowed by electronic friction due to interaction with surface electron–hole pairs, leading to better agreement with experiment.56 More investigations in this direction will be interesting.
k ∼ 1/T curve and the fitted activation energy (Ea = 1.731 eV) is very close to the experimental one (Ea = 1.71 ± 0.03 eV), as evidenced by the good agreement with the experimental binding energy E0 shown above. Whereas absolute rate coefficients are 3–4 times larger than experimental ones, because the calculated pre-factor (A = 1016.37 s−1) relying on the multi-dimensional topography of the PES deviates from experimental data (A = 1015.65±0.20 s−1). This discrepancy may have multiple sources of errors. For example, the diffusion barrier is probably too high so that the adsorbate entropy is underestimated, leading to desorption rate coefficients that are too large. In addition, the 3 × 3 supercell may not be large enough to eliminate the adsorbate–adsorbate interactions and/or perfectly reflect the surface structure change closest to the adsorbate so that the surface entropy change is underestimated. Another possibility is the neglect of the interaction of the adsorbate and metallic electron–hole pairs which is expected to be much stronger for the adsorbed NO than for the asymptotic NO, as observed for the NO + Au(111) case.88 This nonadiabatic effect may slow down the molecular motion so as to lower the desorption rate coefficients. In fact, Gu et al. have found that H* diffusion is slowed by electronic friction due to interaction with surface electron–hole pairs, leading to better agreement with experiment.56 More investigations in this direction will be interesting.
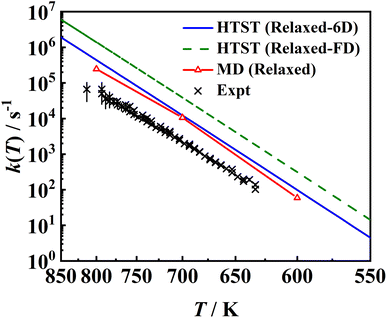 | ||
| Fig. 11 Comparison between two sets of HTST rate coefficients (blue solid line and green dashed line), MD ones (red solid line with triangles) for the relaxed surface including transmission coefficients and the experimental data8 (black ×). The HTST (Relaxed-6D) (blue solid line) model only considers partition functions of the NO molecule based on the optimized DFT parameters on the relaxed Pd(111), while the HTST (Relaxed-FD) (green dashed line) model additionally includes the surface partition functions via the harmonic approximation and DFT-determined frequencies of surface phonons. | ||
Also compared are two sets of HTST results assuming κ = 1. It is important to note that the effect of surface entropy was not well realized in common TST applications. Instead, the effect of surface relaxation on the binding energy was taken into account by including surface DOFs when optimizing stationary structures, but only the partition functions associated with the adsorbate DOFs were usually considered. According to our analysis above, the absence of entropy change contributed by lattice motion will overestimate the free energy change. On the other hand, the harmonic approximation will underestimate the free energy change. The combination of both approximations will thus result in an artificial error cancellation in the commonly used HTST model, rendering a spurious coincidence with the MD results, as displayed as HTST (Relaxed-6D) in Fig. 11. In comparison, the full-dimensional HTST model (HTST (Relaxed-FD)) considering all surface vibrational modes yields much higher rate coefficients than the MD and experimental results. Note that experimental data were used to fit a hindered-translator TST model in ref. 8, assuming a square symmetry of the Pd(111) surface to determine the diffusion barrier and parallel translational frequencies, while all parameters here are taken from DFT calculations. Our results to some extent justify the use of the traditional TST model with the assumption of neglecting the surface entropy, at least in the molecular desorption process. More investigations for other surface reactions will be interesting.
4. Conclusions
In this work, we combine RPMD rate theory with a newly-constructed machine-learned PES from first principles to calculate desorption rate coefficients of NO from Pd(111) including all relevant DOFs. This treatment moves beyond the traditional TST for surface processes, including anharmonicity, adsorbate–substrate coupling, dynamical recrossing, and quantum effects. In particular, we find that the harmonic approximation underestimates the entropy of the adsorbate, resulting in an overestimation of desorption rate coefficients. When the surface is relaxed, the local surface structural change increases the surface entropy change during the desorption process, which offsets the increase in binding energy and keeps the free energy change close to that in the frozen surface approximation. Our results indicate that the commonly-used harmonic TST approach relying on stationary points and energies with surface relaxation but only considering partition functions of the molecule DOFs actually suffers from error cancellation. Moreover, we find that the transmission coefficient is physically sound only when the energy dissipation between the adsorbate and substrate is considered with a movable surface. Overall, while the binding energy is well captured, the theoretical desorption rate coefficients remain 3–4 times higher than the experimental ones, suggesting the need for further improvement in the current PES or the adiabatic dynamics based model. The proposed computational scheme will be useful for including quantum effects that are expected to be more important in surface reactions with light atoms10,51 from first principles instead of using parametric models and be applicable to more general elementary surface reaction rates towards accurate microkinetic modeling of heterogeneous catalysis.Data availability
The data that support the findings of this study are available from the corresponding author upon reasonable request.Author contributions
B. J. conceived the idea behind this work and led the supervision of this research. C. L. did all calculations with the initial supervision of Y. L. All authors contributed to the analysis and discussion of the calculated data. C. L. and B. J. wrote the first draft of the manuscript and all authors edited its subsequent versions.Conflicts of interest
There are no conflicts to declare.Acknowledgements
This work was supported by Strategic Priority Research Program of the Chinese Academy of Sciences (XDB0450101 to B. J.), CAS Project for Young Scientists in Basic Research (YSBR-005 to B. J.), National Natural Science Foundation of China (No. 22221003, 22073089, and 22033007 to B. J., No. 22173057 to Y. L.), Science and Technology Commission of Shanghai Municipality (No. 21JC1402700 to Y. L.). Calculations were done on the Supercomputing Center of USTC and Hefei Advanced Computing Center. We thank Dr Dmitriy Borodin and Prof. Alec M. Wodtke for providing us the experimental data and thoughtful discussion, and Prof. Hua Guo for helpful suggestions.References
- A. Hellman, E. J. Baerends, M. Biczysko, T. Bligaard, C. H. Christensen, D. C. Clary, S. Dahl, R. van Harrevelt, K. Honkala, H. Jonsson, G. J. Kroes, M. Luppi, U. Manthe, J. K. Nørskov, R. A. Olsen, J. Rossmeisl, E. Skúlason, C. S. Tautermann, A. J. C. Varandas and J. K. Vincent, J. Phys. Chem. B, 2006, 110, 17719–17735 CrossRef CAS PubMed.
- Z. Chen, H. Wang, N. Q. Su, S. Duan, T. Shen and X. Xu, ACS Catal., 2018, 8, 5816–5826 CrossRef CAS.
- K. Golibrzuch, P. R. Shirhatti, J. Geweke, J. Werdecker, A. Kandratsenka, D. J. Auerbach, A. M. Wodtke and C. Bartels, J. Am. Chem. Soc., 2015, 137, 1465–1475 CrossRef CAS PubMed.
- D. J. Harding, J. Neugebohren, H. Hahn, D. J. Auerbach, T. N. Kitsopoulos and A. M. Wodtke, J. Chem. Phys., 2017, 147, 013939 CrossRef PubMed.
- J. Neugebohren, D. Borodin, H. W. Hahn, J. Altschäffel, A. Kandratsenka, D. J. Auerbach, C. T. Campbell, D. Schwarzer, D. J. Harding, A. M. Wodtke and T. N. Kitsopoulos, Nature, 2018, 558, 280–283 CrossRef CAS PubMed.
- G. B. Park, T. N. Kitsopoulos, D. Borodin, K. Golibrzuch, J. Neugebohren, D. J. Auerbach, C. T. Campbell and A. M. Wodtke, Nat. Rev. Chem., 2019, 3, 723–732 CrossRef.
- D. Borodin, K. Golibrzuch, M. Schwarzer, J. Fingerhut, G. Skoulatakis, D. Schwarzer, T. Seelemann, T. Kitsopoulos and A. M. Wodtke, ACS Catal., 2020, 10, 14056–14066 CrossRef CAS PubMed.
- D. Borodin, I. Rahinov, J. Fingerhut, M. Schwarzer, S. Hörandl, G. Skoulatakis, D. Schwarzer, T. N. Kitsopoulos and A. M. Wodtke, J. Phys. Chem. C, 2021, 125, 11773–11781 CrossRef CAS PubMed.
- D. Borodin, I. Rahinov, O. Galparsoro, J. Fingerhut, M. Schwarzer, K. Golibrzuch, G. Skoulatakis, D. J. Auerbach, A. Kandratsenka, D. Schwarzer, T. N. Kitsopoulos and A. M. Wodtke, J. Am. Chem. Soc., 2021, 143, 18305–18316 CrossRef CAS PubMed.
- D. Borodin, N. Hertl, G. B. Park, M. Schwarzer, J. Fingerhut, Y. Wang, J. Zuo, F. Nitz, G. Skoulatakis, A. Kandratsenka, D. J. Auerbach, D. Schwarzer, H. Guo, T. N. Kitsopoulos and A. M. Wodtke, Science, 2022, 377, 394–398 CrossRef CAS PubMed.
- M. Schwarzer, N. Hertl, F. Nitz, D. Borodin, J. Fingerhut, T. N. Kitsopoulos and A. M. Wodtke, J. Phys. Chem. C, 2022, 126, 14500–14508 CrossRef CAS PubMed.
- L. Zhou, A. Kandratsenka, C. T. Campbell, A. M. Wodtke and H. Guo, Angew. Chem., Int. Ed., 2019, 58, 6916–6920 CrossRef CAS PubMed.
- M. del Cueto, X. Zhou, L. Zhou, Y. Zhang, B. Jiang and H. Guo, J. Phys. Chem. C, 2020, 124, 5174–5181 CrossRef CAS.
- H. Eyring, Chem. Rev., 1935, 17, 65–77 CrossRef CAS.
- M. G. Evans and M. Polanyi, Trans. Faraday Soc., 1935, 31, 875–894 RSC.
- P. L. Houston, Chemical Kinetics and Reaction Dynamics, New York, 2001, vol. 78, pp. 1466 Search PubMed.
- C. T. Campbell, L. H. Sprowl and L. Árnadóttir, J. Phys. Chem. C, 2016, 120, 10283–10297 CrossRef CAS.
- L. H. Sprowl, C. T. Campbell and L. Árnadóttir, J. Phys. Chem. C, 2016, 120, 9719–9731 CrossRef CAS.
- R. B. McClurg, R. C. Flagan and W. A. Goddard III, J. Chem. Phys., 1997, 106, 6675–6680 CrossRef CAS.
- M. Jørgensen and H. Grönbeck, J. Phys. Chem. C, 2017, 121, 7199–7207 CrossRef.
- B. Jackson, J. Chem. Phys., 2020, 153, 034704 CrossRef CAS PubMed.
- D. Alfè and M. J. Gillan, J. Phys.: Condens. Matter, 2006, 18, L451–L457 CrossRef PubMed.
- H. Fox, M. J. Gillan and A. P. Horsfield, Surf. Sci., 2007, 601, 5016–5025 CrossRef CAS.
- H. Fox, M. J. Gillan and A. P. Horsfield, Surf. Sci., 2009, 603, 2171–2178 CrossRef CAS.
- D. Alfè and M. J. Gillan, J. Chem. Phys., 2007, 127, 114709 CrossRef PubMed.
- W. Wang and Y. Zhao, J. Phys. Chem. A, 2015, 119, 12953–12961 CrossRef CAS PubMed.
- W. Wang and Y. Zhao, J. Chem. Phys., 2017, 147, 044703 CrossRef PubMed.
- W. Wang and Y. Zhao, J. Chem. Phys., 2009, 130, 114708 CrossRef PubMed.
- Z.-N. Chen, L. Shen, M. Yang, G. Fu and H. Hu, J. Phys. Chem. C, 2015, 119, 26422–26428 CrossRef CAS.
- O. Galparsoro, S. Kaufmann, D. J. Auerbach, A. Kandratsenka and A. M. Wodtke, Phys. Chem. Chem. Phys., 2020, 22, 17532–17539 RSC.
- I. R. Craig and D. E. Manolopoulos, J. Chem. Phys., 2004, 121, 3368–3373 CrossRef CAS PubMed.
- I. R. Craig and D. E. Manolopoulos, J. Chem. Phys., 2005, 122, 084106 CrossRef PubMed.
- I. R. Craig and D. E. Manolopoulos, J. Chem. Phys., 2005, 123, 034102 CrossRef PubMed.
- D. Chandler and P. G. Wolynes, J. Chem. Phys., 1981, 74, 4078–4095 CrossRef CAS.
- S. Habershon, D. E. Manolopoulos, T. E. Markland and T. F. Miller III, Annu. Rev. Phys. Chem., 2013, 64, 387–413 CrossRef CAS PubMed.
- R. Collepardo-Guevara, Y. V. Suleimanov and D. E. Manolopoulos, J. Chem. Phys., 2009, 130, 174713 CrossRef PubMed.
- Y. V. Suleimanov, R. Collepardo-Guevara and D. E. Manolopoulos, J. Chem. Phys., 2011, 134, 044131 CrossRef PubMed.
- R. Pérez de Tudela, F. J. Aoiz, Y. V. Suleimanov and D. E. Manolopoulos, J. Phys. Chem. Lett., 2012, 3, 493–497 CrossRef PubMed.
- Y. V. Suleimanov, R. Pérez de Tudela, P. G. Jambrina, J. F. Castillo, V. Sáez-Rábanos, D. E. Manolopoulos and F. J. Aoiz, Phys. Chem. Chem. Phys., 2013, 15, 3655–3665 RSC.
- J. W. Allen, W. H. Green, Y. Li, H. Guo and Y. V. Suleimanov, J. Chem. Phys., 2013, 138, 221103 CrossRef PubMed.
- Y. V. Suleimanov, J. W. Allen and W. H. Green, Comput. Phys. Commun., 2013, 184, 833–840 CrossRef CAS.
- R. Pérez de Tudela, Y. V. Suleimanov, J. O. Richardson, V. Sáez Rábanos, W. H. Green and F. J. Aoiz, J. Phys. Chem. Lett., 2014, 5, 4219–4224 CrossRef PubMed.
- J. Espinosa-Garcia, M. Garcia-Chamorro, J. C. Corchado, S. Bhowmick and Y. V. Suleimanov, Phys. Chem. Chem. Phys., 2020, 22, 13790–13801 RSC.
- Y. Li, Y. V. Suleimanov, J. Li, W. H. Green and H. Guo, J. Chem. Phys., 2013, 138, 094307 CrossRef PubMed.
- Y. Li, Y. V. Suleimanov, M. Yang, W. H. Green and H. Guo, J. Phys. Chem. Lett., 2013, 4, 48–52 CrossRef CAS PubMed.
- Y. Li, Y. V. Suleimanov, W. H. Green and H. Guo, J. Phys. Chem. A, 2014, 118, 1989–1996 CrossRef CAS PubMed.
- Y. Li, Y. V. Suleimanov and H. Guo, J. Phys. Chem. Lett., 2014, 5, 700–705 CrossRef CAS PubMed.
- J. Zuo, Y. Li, H. Guo and D. Xie, J. Phys. Chem. A, 2016, 120, 3433–3440 CrossRef CAS PubMed.
- J. Zuo, Y. Li, H. Guo and D. Xie, J. Phys. Chem. A, 2017, 121, 5067 CrossRef CAS PubMed.
- H. Wang, J. Fang, H. Yang, J. Song and Y. Li, Chem. Phys. Lett., 2019, 730, 227–233 CrossRef CAS.
- Y. V. Suleimanov, J. Phys. Chem. C, 2012, 116, 11141–11153 CrossRef CAS.
- H. Jiang, M. Kammler, F. Ding, Y. Dorenkamp, F. R. Manby, A. M. Wodtke, T. F. Miller, A. Kandratsenka and O. Bünermann, Science, 2019, 364, 379 CrossRef CAS PubMed.
- H. Jiang, X. Tao, M. Kammler, F. Ding, A. M. Wodtke, A. Kandratsenka, T. F. Miller and O. Bünermann, J. Phys. Chem. Lett., 2021, 12, 1991–1996 CrossRef CAS PubMed.
- Q. Liu, L. Zhang, Y. Li and B. Jiang, J. Phys. Chem. Lett., 2019, 10, 7475–7481 CrossRef CAS PubMed.
- C. Li, Q. Liu, L. Zhang, Y. Li and B. Jiang, Mol. Phys., 2021, 119, e1941367 Search PubMed.
- K. Gu, C. Li, B. Jiang, S. Lin and H. Guo, J. Phys. Chem. C, 2022, 126, 17093–17101 CrossRef CAS.
- B. Jiang, J. Li and H. Guo, J. Phys. Chem. Lett., 2020, 11, 5120–5131 CrossRef CAS PubMed.
- K. Shakouri, J. Behler, J. Meyer and G.-J. Kroes, J. Phys. Chem. Lett., 2017, 8, 2131–2136 CrossRef CAS PubMed.
- R. Moiraghi, A. Lozano, E. Peterson, A. Utz, W. Dong and H. F. Busnengo, J. Phys. Chem. Lett., 2020, 11, 2211–2218 CrossRef CAS PubMed.
- B. Kolb, X. Luo, X. Zhou, B. Jiang and H. Guo, J. Phys. Chem. Lett., 2017, 8, 666–672 CrossRef CAS PubMed.
- A. Rivero Santamaría, M. Ramos, M. Alducin, H. F. Busnengo, R. Díez Muiño and J. I. Juaristi, J. Phys. Chem. A, 2021, 125, 2588–2600 CrossRef PubMed.
- J. Chen, T. Jin, Y. Jiang, T. Shen, M. Yang and Z.-N. Chen, Chin. Chem. Lett., 2022, 33, 4936–4942 CrossRef CAS.
- Y. Zhang, C. Hu and B. Jiang, J. Phys. Chem. Lett., 2019, 10, 4962–4967 CrossRef CAS PubMed.
- Y. Zhang, C. Hu and B. Jiang, Phys. Chem. Chem. Phys., 2021, 23, 1815–1821 RSC.
- Y. Zhang, J. Xia and B. Jiang, Phys. Rev. Lett., 2021, 127, 156002 CrossRef CAS PubMed.
- J. Xia, Y. Zhang and B. Jiang, Chin. J. Chem. Phys., 2021, 34, 695–703 CrossRef CAS.
- Q. Lin, Y. Zhang, B. Zhao and B. Jiang, J. Chem. Phys., 2020, 152, 154104 CrossRef CAS PubMed.
- Q. Lin, L. Zhang, Y. Zhang and B. Jiang, J. Chem. Theory Comput., 2021, 17, 2691–2701 CrossRef CAS PubMed.
- G. Kresse and J. Furthmuller, Phys. Rev. B: Condens. Matter Mater. Phys., 1996, 54, 11169–11186 CrossRef CAS PubMed.
- G. Kresse and J. Furthmuller, Comput. Mater. Sci., 1996, 6, 15–50 CrossRef CAS.
- B. Hammer, L. B. Hansen and J. K. Nørskov, Phys. Rev. B: Condens. Matter Mater. Phys., 1999, 59, 7413–7421 CrossRef.
- R. Collepardo-Guevara, I. R. Craig and D. E. Manolopoulos, J. Chem. Phys., 2008, 128, 144502 CrossRef PubMed.
- T. Yamamoto, J. Chem. Phys., 1960, 33, 281 CrossRef CAS.
- W. H. Miller, J. Chem. Phys., 1974, 61, 1823–1834 CrossRef CAS.
- W. H. Miller, S. D. Schwartz and J. W. Tromp, J. Chem. Phys., 1983, 79, 4889–4899 CrossRef CAS.
- C. H. Bennett, in Algorithms for Chemical Computations, ACS Symposium Series, ed. R. E. Christofferson, ACS, 1977, vol. 46 Search PubMed.
- D. Chandler, J. Chem. Phys., 1978, 68, 2959–2970 CrossRef CAS.
- G. M. Torrie and J. P. Valleau, J. Comput. Phys., 1977, 23, 187–199 CrossRef.
- J. Kästner and W. Thiel, J. Chem. Phys., 2005, 123, 144104 CrossRef PubMed.
- J. M. Brown, A. R. H. Cole and F. R. Honey, Mol. Phys., 1972, 23, 287–295 CrossRef CAS.
- B. Hammer, J. Catal., 2001, 199, 171–176 CrossRef CAS.
- M. Gajdoš, J. Hafner and A. Eichler, J. Phys.: Condens. Matter, 2005, 18, 13–40 CrossRef.
- J. A. Herron, S. Tonelli and M. Mavrikakis, Surf. Sci., 2012, 606, 1670–1679 CrossRef CAS.
- Y. V. Suleimanov, F. J. Aoiz and H. Guo, J. Phys. Chem. A, 2016, 120, 8488–8502 CrossRef CAS PubMed.
- W. Fang, J. O. Richardson, J. Chen, X.-Z. Li and A. Michaelides, Phys. Rev. Lett., 2017, 119, 126001 CrossRef PubMed.
- M. F. Herman, E. J. Bruskin and B. J. Berne, J. Chem. Phys., 1982, 76, 5150–5155 CrossRef CAS.
- D. E. Starr and C. T. Campbell, J. Am. Chem. Soc., 2008, 130, 7321–7327 CrossRef CAS PubMed.
- C. L. Box, Y. Zhang, R. Yin, B. Jiang and R. J. Maurer, JACS Au, 2021, 1, 164–173 CrossRef CAS PubMed.
| This journal is © The Royal Society of Chemistry 2023 |

