 Open Access Article
The enhanced properties and bioactivity of poly-ε-caprolactone/poly lactic-co-glycolic acid doped with carbonate hydroxyapatite–egg white
Diana Julaidy Patty ab,
Ari Dwi Nugrahenia,
Ika Dewi Ana
 cd,
Aminatun
 e,
Yessie Widya Sarif,
Gunawarmang and
Yusril Yusuf
 *ad
*ad
aDepartment of Physics, Faculty of Mathematics and Natural Science, Universitas Gadjah Mada, Yogyakarta, Indonesia
bDepartment of Physics, Faculty of Mathematics and Natural Science, Universitas Pattimura, Ambon, Indonesia
cDepartment of Dental Biomedical Sciences, Faculty of Dentistry, Universitas Gadjah Mada, Yogyakarta, Indonesia
dResearch Collaboration Center for Biomedical Scaffolds National Research and Innovation Agency of the Republic of Indonesia (BRIN), Universitas Gadjah Mada (UGM), Bulaksumur, Yogyakarta 55281, Indonesia
eDepartment of Physics, Universitas Airlangga, Surabaya 60115, Indonesia
fDepartment of Physics, Institut Pertanian Bogor, Bogor 16680, Indonesia. E-mail: yusril@ugm.ac.id
gDepartment of Mechanical Engineering, Universitas Andalas, Padang 25163, Indonesia
First published on 24th November 2023
Abstract
Synthetic polymers, such as PCL and PLGA, are among the main material choices in tissue engineering because of their stable structures and strong mechanical properties. In this study, we designed polycaprolactone (PCL)/polylactic-co-glycolate acid (PLGA) nanofibers doped with carbonate hydroxyapatite (CHA) and egg white (EW) with enhanced properties. The addition of CHA and EW significantly influenced the properties and morphology of PCL/PLGA nanofibers; whereby the CHA substitution (PCL/PLGA/CHA) greatly increased the mechanical properties related to the Young's modulus and EW doping (PCL/PLGA/CHA/EW) increased the elongation at break. Bioactivity tests of PCL/PLGA/CHA/EW after immersion in the SBF for 3 to 9 days showed increased fiber diameters and a good swelling capacity that could improve cell adhesion, while biocompatibility tests with NIH-3T3 fibroblast cells showed good cell proliferation (85%) after 48 h and antibacterial properties against S. aureus.
1. Introduction
Polycaprolactone (PCL) polymers are flexible materials, and the electrospun nets of polylactic-co-glycolate acid (PLGA)/PCL have shown strong mechanical properties. Adding PLGA as a doping agent in the PCL/PLGA electrospun net increases the potential of the composite, which plays an important role in many biomaterials and tissue engineering applications considering the improved biocompatibility, cell attachment, and cell proliferation.7 Specifically, PCL/PLGA composite electrospun nanofibrous scaffolds have been extensively developed in tissue engineering1 for neural regeneration,2 guided bone regeneration,3,4 and controlled drug release.5,6Implant designs based on polymer and protein interactions play an important role in biomedical applications, especially wound healing, because such interactions can increase protein adsorption on the polymer surface. Chicken egg white (EW) as a natural polymer, contains complete nutrition (80% protein, 85–89% water, and cell culture media), supports cell viability, and biocompatibility, and increases in vitro bioactivity.8 Lysozymes in EW have antibacterial properties and can hydrolyze specific polysaccharides that make up the cell walls of some Gram-positive bacteria.9–12 Owing to their biodegradability, natural and synthetic polymers play essential roles in drug delivery, wound care, scaffold, dental, and cardiovascular applications.13
Advanced materials design in bone tissue engineering requires a combination of different materials to obtain superior properties (physiochemical, mechanical, and biological properties). Carbonate hydroxyapatite (CHA) is a synthetic bone graft substitute with a chemical composition identical to the bone mineral component. The hydroxyapatite (HA) present in the human body is not pure (Ca10(PO4)6(OH)2) but rather contains carbonate ions, which are essential for the breakdown of HAp in solution and play an important role in several biological processes, such as dental caries and bone resorption.
CHA is synthesized from biogenic materials containing large amounts of calcium carbonate by combining calcium and phosphate sources, such as mammalian bones, shells,11,14,15 coral, and egg shells. One biogenic material particularly high in calcium carbonate is pearl shell (Pinctada maxima), which, also because of being abundant, has significant potential for use in the synthesis of CHA for bone tissue reconstruction.16 The carbonate group can replace hydroxyl ions (type-A carbonate/CHA type-A) and phosphate (type-B carbonate/CHA type B) in the hydroxyapatite structure. CHA type-B in the apatite lattice has been shown to cause a decrease in crystallinity and increase solubility in in vitro and in vivo tests.17
One of the most demanding medical applications is the repair and formation of musculoskeletal tissue, especially bone, where a scaffold is needed that must have a high elastic modulus to provide temporary mechanical support without showing symptoms of fatigue or failure to maintain the repair in place while providing tissues with adequate space for growth.18 Furthermore, it has antibacterial properties to prevent bacterial invasion, which can help prevent failure during application. Implant-based nanofibers could provide many advantages when designed with uniform and continuous nanofibers, including a porous structure with highly interconnected porosity, and a good swelling capacity, thus increasing the ability for cell adhesion.
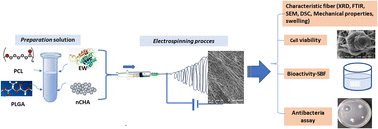
This study aimed to design and analyze the polymer–bioceramic–protein interactions of PCL/PLGA doped with CHA-EW as a multifunctional bone graft (Fig. 1) by analyzing the physicochemical, mechanical properties, bioactivity, biocompatibility (NIH-3T3 fibroblast cells), and antibacterial activity of the doped material.
2. Materials and methods
2.1 Materials
PCL (Mn = 80![[thin space (1/6-em)]](https://www.rsc.org/images/entities/char_2009.gif) 000, viscosity 2.2 dL g−1), and PLGA (lactide
000, viscosity 2.2 dL g−1), and PLGA (lactide![[thin space (1/6-em)]](https://www.rsc.org/images/entities/char_2009.gif) :
:![[thin space (1/6-em)]](https://www.rsc.org/images/entities/char_2009.gif) glycolide (75
glycolide (75![[thin space (1/6-em)]](https://www.rsc.org/images/entities/char_2009.gif) :
:![[thin space (1/6-em)]](https://www.rsc.org/images/entities/char_2009.gif) 25), mol wt 66
25), mol wt 66![[thin space (1/6-em)]](https://www.rsc.org/images/entities/char_2009.gif) 000–107
000–107![[thin space (1/6-em)]](https://www.rsc.org/images/entities/char_2009.gif) 000) were purchased from Sigma Aldrich. N,N-Dimethylformamide (DMF) was purchased from Sigma Aldrich. CaO, diammonium hydrogen phosphate ([NH4]2HPO4), ammonium hydroxide (NH4OH) were obtained as a 25% solution from Merck (Kenilworth, NJ, USA). Ammonium bicarbonate (NH4HCO3) was purchased from PT Brataco (Indonesia). CHA was synthesized from the P. maxima shell. EW powder was obtained from Distributor Co Id Teknoboga (Central Jakarta, Indonesia). Fibroblast cells (NIH-3T3), DMEM high glucose medium (Gibco, CA, USA), 10% bovine calf serum supplementation were obtained from Sigma (MA, USA). Pen Strep 2% and Fungizone 0.5% were obtained from Gibco (CA, USA).
000) were purchased from Sigma Aldrich. N,N-Dimethylformamide (DMF) was purchased from Sigma Aldrich. CaO, diammonium hydrogen phosphate ([NH4]2HPO4), ammonium hydroxide (NH4OH) were obtained as a 25% solution from Merck (Kenilworth, NJ, USA). Ammonium bicarbonate (NH4HCO3) was purchased from PT Brataco (Indonesia). CHA was synthesized from the P. maxima shell. EW powder was obtained from Distributor Co Id Teknoboga (Central Jakarta, Indonesia). Fibroblast cells (NIH-3T3), DMEM high glucose medium (Gibco, CA, USA), 10% bovine calf serum supplementation were obtained from Sigma (MA, USA). Pen Strep 2% and Fungizone 0.5% were obtained from Gibco (CA, USA).
2.2 Synthesis of carbonate hydroxyapatite
The CHA synthesis followed the protocol reported in a previous study12 by extracting CaO as a source of calcium from P. maxima shells. After the synthesis and aging for 24 h, the obtained CHA slurry was filtered using Whatman 42 filter paper. The CHA was dried in an oven for 6 h, without annealing, and then the physicochemical properties were characterized by SEM, XRD, and FTIR.2.3 Electrospinning process
Electrospun nanofiber membranes were designed using the Electrospinning Nanosense-UGM device in the Materials and Instrumentation Physics Laboratory, Department of Physics, Faculty of Mathematics and Natural Sciences, UGM.The PCL 10% w/v and PLGA 10% w/v spinning solutions were prepared using DMF and stirred with a magnetic stirrer at 40 °C for 6 h (700 rpm) until the solution was homogeneous. CHA powder was added to the PCL/PLGA solution and stirred until homogeneous for ∼24 h. Then, homogenized EW powder was added into the PCL/PLGA/CHA solution.
Table 1 shows the compositions of the blended polymer solutions prepared in 12 mL syringes with a 0.05 mm needle. The voltage used was 10 kV, with the distance between the syringes and collector being 10 cm, with a flow rate 30–35 μL m−1. The nanofiber membranes were characterized by XRD, DSC, FTIR, SEM, and cell viability tests.
| Materials | Composition of the polymer blends | Sample code |
|---|---|---|
| PCL (10%), PLGA (10%) CHA (0.008 g), EW (0.02 g), DMF | PCL (5 mL) | PCL |
PCL![[thin space (1/6-em)]](https://www.rsc.org/images/entities/char_2009.gif) : :![[thin space (1/6-em)]](https://www.rsc.org/images/entities/char_2009.gif) PLGA (4 mL/2 mL) PLGA (4 mL/2 mL) |
PCL/PLGA | |
PCL![[thin space (1/6-em)]](https://www.rsc.org/images/entities/char_2009.gif) : :![[thin space (1/6-em)]](https://www.rsc.org/images/entities/char_2009.gif) PLGA PLGA![[thin space (1/6-em)]](https://www.rsc.org/images/entities/char_2009.gif) : :![[thin space (1/6-em)]](https://www.rsc.org/images/entities/char_2009.gif) CHA (4 mL/2 mL/0.008 g) CHA (4 mL/2 mL/0.008 g) |
PCL/PLGA/CHA | |
PCL![[thin space (1/6-em)]](https://www.rsc.org/images/entities/char_2009.gif) : :![[thin space (1/6-em)]](https://www.rsc.org/images/entities/char_2009.gif) PLGA PLGA![[thin space (1/6-em)]](https://www.rsc.org/images/entities/char_2009.gif) : :![[thin space (1/6-em)]](https://www.rsc.org/images/entities/char_2009.gif) CHA CHA![[thin space (1/6-em)]](https://www.rsc.org/images/entities/char_2009.gif) : :![[thin space (1/6-em)]](https://www.rsc.org/images/entities/char_2009.gif) EW (4 mL/2 mL/0.008 g/0.02 g) EW (4 mL/2 mL/0.008 g/0.02 g) |
PCL/PLGA/CHA/EW |
2.4 Sample characteristics
2.5 Swelling ratio
The swelling characteristics of the electrospun fibers were evaluated for water absorption using the method of Meng et al.21 The fiber was cut into a rectangular shape (10 × 10 mm), weighed (Wo), and then immersed in distilled water for 24 h. Next, the samples were rinsed and placed on filter paper to remove excess water, and then weighed in a wet state (W). The swelling ratio was calculated according to the equation,2.6 Nanofiber bioactivity in SBF
Bioactivity is essential to a scaffold to form an interface bond between bone and tissue before application. Evaluation of the nanofibers' bioactivity followed the protocol proposed by Kokubo et al.22 First, samples (10 × 10 mm) were immersed in SBF solution for 3 to 9 days, and dried at room temperature, and then, the apatite mineralization on nanofibers composition was reviewed by SEM-EDS.2.7 Cell viability by MTT assay
2.8 Antibacterial activity by disk diffusion
3. Results and discussion
3.1 Characteristics of carbonate-hydroxyapatite and nanofiber
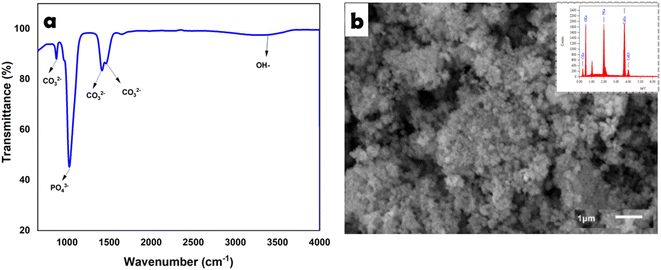
The FTIR spectrum of CHA is shown in Fig. 2a, revealing several absorption peaks at 871 cm−1 [CO32−/carbonate (plane bending) type B], 1417–1465 cm−1 [CO32−/carbonate (asymmetric stretching) type B], 1024 cm−1 [PO43−/phosphate (asymmetric stretching)], and 3392 cm−1 [presence of OH-hydroxyl (ion stretching)].23SEM imaging of CHA (Fig. 2b) showed a uniform grain size <1 μm, while the EDS results showed the presence of phosphate, calcium, and oxygen elements with high absorption peaks. In addition, the EDS data for CHA (oven-dried) showed the stoichiometry of Ca/P of 1.65.
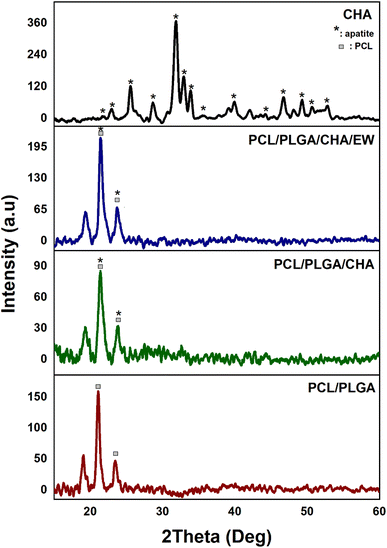
The PCL/PLGA, PCL/PLGA/CHA, and PCL/PLGA/CHA/EE spectra showed the same peaks (2θ) at 21° and 23°, with estimated crystal sizes (according to Scherrer's equation) of 17.7, 12.6, and 13.6 nm, respectively. The phase angles of the nanofibers showed almost the same peaks as pure PCL, at 2θ (hkl) 21.3° (100) and 23.7° (200),26–28 with sharp peaks. PCL was thus a semi-crystalline polymer, while PLGA and EW were amorphous. The crystallinity of PCL/PLGA, PCL/PLGA/CHA, and PCL/PLGA/CHA/EW were 31%, 32%, and 46% respectively, with high-intensity and sharp peaks. The PCL/PLGA nanofibers had high-intensity peaks at 21.1° and 23.4°, which were shifted to the left (∼0.3°), while adding CHA in PCL/PLGA/CHA decreased the intensity.
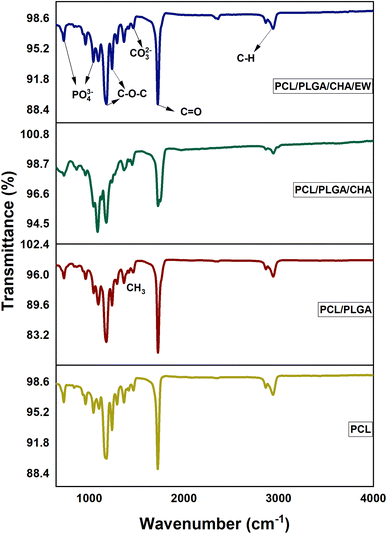
![[double bond, length as m-dash]](https://www.rsc.org/images/entities/char_e001.gif) O, stretching),30 1240 cm−1 (C–O–C, asymmetric stretching), and 1180 cm−1 (C–O–C, symmetric stretching).1,29
O, stretching),30 1240 cm−1 (C–O–C, asymmetric stretching), and 1180 cm−1 (C–O–C, symmetric stretching).1,29
The PCL/PLGA spectra showed absorption peaks nearly the same as for PCL. The pure PLGA spectrum [6] showed peaks at 2996 cm−1 (C–H, asymmetric stretching), 1750 cm−1 (C![[double bond, length as m-dash]](https://www.rsc.org/images/entities/char_e001.gif) O, stretching), 1455 cm−1 (C–H, bending), and at 1080 cm−1, and 1179 cm−1 (C–O–C stretching).
O, stretching), 1455 cm−1 (C–H, bending), and at 1080 cm−1, and 1179 cm−1 (C–O–C stretching).
The PCL/PLGA spectrum showed typical absorption band characteristics at 2942–2863 cm−1, referring to C–H asymmetric and symmetric stretching, and 1725–1750 cm−1, referring to an ester group (C![[double bond, length as m-dash]](https://www.rsc.org/images/entities/char_e001.gif) O). The peaks at 1239, 1179, and 1094 cm−1 were for C–O–C stretching, and the peak at 2942 cm−1 was C–H stretching.
O). The peaks at 1239, 1179, and 1094 cm−1 were for C–O–C stretching, and the peak at 2942 cm−1 was C–H stretching.
The presence of CHA on the PCL/PLGA/CHA nanofibers was indicated by a change in the absorption intensity at 1725 cm−1 and the appearance of two sharp peaks at 1180 and 1087 cm−1. The absorption peak at 3596 cm−1 referred to the presence of OH-hydroxyl (ion stretching), 2942 cm−1 to C–H (asymmetric stretching), 2860 cm−1 to C–H (symmetric stretching), and 1725 to C![[double bond, length as m-dash]](https://www.rsc.org/images/entities/char_e001.gif) O (stretching). The peak at 1454 cm−1 referred to CO32−/carbonate (asymmetric stretching) type B, while other peaks were at 1179 cm−1 for C–O–C (stretching), 1089 cm−1 for C–O–C (stretching), 1044 for PO43−/phosphate (asymmetric stretching), and 865 cm−1 for CO32−/carbonate (plane bending).
O (stretching). The peak at 1454 cm−1 referred to CO32−/carbonate (asymmetric stretching) type B, while other peaks were at 1179 cm−1 for C–O–C (stretching), 1089 cm−1 for C–O–C (stretching), 1044 for PO43−/phosphate (asymmetric stretching), and 865 cm−1 for CO32−/carbonate (plane bending).
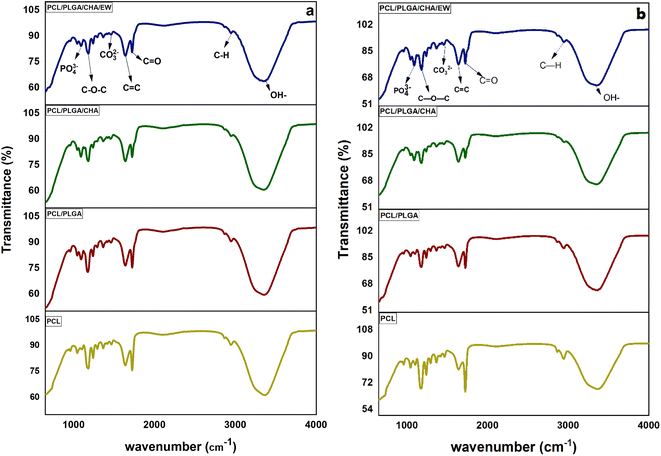
The FTIR spectra of all the samples showed a single peak at 1724 cm−1, which was related to the carbonyl group in the crystalline region. The highest peak intensity was in the PCL/PLGA/CHA sample (95.7%), followed by PCL/PLGA/CHA/EW (89%), PCL (88%), and PCL/PLGA (79.5%). The intensity at this region decreased after SBF immersion treatment for 3–9 days, as shown in Fig. 5.
Fig. 5 shows the FTIR analysis of the nanofibers after being immersed in SBF solution for 3 and 9 days. All the samples showed the same spectral pattern, absorption band, and intensities. Significant absorption bands at 3200–3500 cm−1 and 1638–1641 cm−1 were identified for the hydroxyl group and the amide/amino acid group. The behavior of the nanofibers after 3 days of SBF immersion showed a transmittance (at 3200–3500 cm−1) of around 60% for PCL, PCL/PLGA, and PCL/PLGA/CHA, and 64% for PCL/PLGA/CHA/EW. At 9 days of SBF immersion, PCL/PLGA, PCL/PLGA/CHA, and PCL/PLGA/CHA/EW were around 64–66%, while PCL was 68%. These results show that all the nanofiber blends with PCL had hydrophobic properties, which meant a longer degradation time. Therefore, the absorption intensity of nanofibers in the SBF immersion affected the nanofiber size as confirmed by SEM morphology.
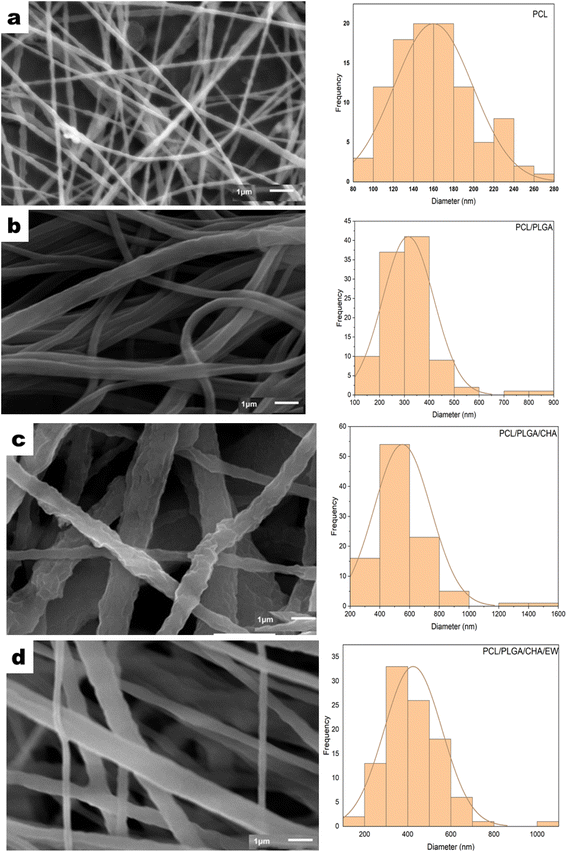 | ||
Fig. 6 The SEM morphology and distribution of the diameters of PCL (a), PCL/PLGA (b), PCL/PLGA/CHA (c), and PCL/PLGA/CHA/EW (d) with *×10![[thin space (1/6-em)]](https://www.rsc.org/images/entities/char_2009.gif) 000 magnification. 000 magnification. | ||
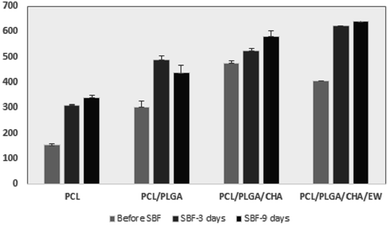
Electrospinning produced nanofiber diameters from 100–600 nm to 1000 nm.33 The increase in fiber diameter was also influenced by adding composites in the PCL polymer. PCL, PCL/PLGA, PCL/PLGA/CHA, and PCL/PLGA/CHA/EW nanofibers had fibers with diameters of 152.8 ± 3.5 nm, 304 ± 2.4 nm, 474.68 ± 27.17 nm, and 404.8 ± 10 nm, respectively. The increased fiber diameter was due to various factors, including the solution viscosity, surface tension, applied voltage, and crystallization characteristics of the polymer. Previous research has shown that the solution viscosity had a more significant influence on the average increase in fiber diameter. Increased diameters of the fibers were prepared in the pretreatment of the electrospinning process to enhance the mechanical properties of the fibers.
The morphology of the PCL nanofibers fabricated with a flow rate of 1 mL m−1 shows beads on the surface of the nanofibers (Fig. 6a) due to the low conductivity of the PCL, which will produce a small net charge on the droplet surface.34 Therefore, for meeting application requirements such as in bone grafts, PCL blended nanofibers were fabricated with increasing the flow rate to 30–35 μL m−1.
The addition of PLGA (10%) increased the nanofibers size of PCL/PLGA up to 50%, with the formation of a cylindrical shape, continuous fibers, and a smooth surface (Fig. 6b). The addition of CHA (0.08 g) increased the size of the nanofibers PCL/PLGA/CHA by up to 64%, producing fibers with a rough, continuous cylindrical surface due to the CHA crystals. However, the morphology of the PCL/PLGA/CHA/EW showed cylindrical-continuous nanofibers and porosity, with smaller nanofibers than PCL/PLGA/CHA, due to the protein binding process with CHA through a phosphorylation process, whereby smaller CHA particles could absorb the EW, and change the surface of the nanofiber.
| Sample | Melting range of PCL (°C) | ΔH(PCL) | ||
|---|---|---|---|---|
| Tonset | Tm | Tendset | (J g−1) | |
| PCL | 60 | 64.45 | 68.21 | 23.8 |
| PCL/PLGA | 57.87 | 63.12 | 66.47 | 33.54 |
| PCL/PLGA/CHA | 59.85 | 64.67 | 68.23 | 16.54 |
| PCL/PLGA/CHA/EW | 55.03 | 60.92 | 64.91 | 36.42 |
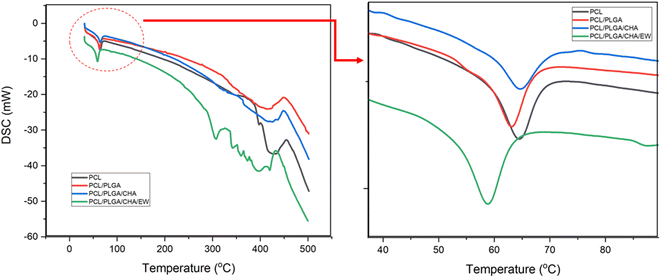
The DSC curve of PCL/PLGA/CHA showed a broader endothermic peak and lower enthalpy of fusion. This is because the melting points of PCL and PLGA were below 65 °C, while CHA had a higher melting point of ∼1000 °C. The low enthalpy due to the internal energy of the sample was directly related to temperature. The DSC curves for all samples showed PCL decomposed in the 350–430 °C range, while PCL/PLGA/CHA/EW showed gradual EW decomposition in the 270–400 °C range, as previously reported.37
| Sample | Elongation at break (%) | Young's Modulus (MPa) | Tensile strength (MPa) |
|---|---|---|---|
| PCL | 11.25 ± 2.50 | 85.58 ± 15 | 9.04 ± 0.87 |
| PCL/PLGA | 13.12 ± 1.25 | 262.74 ± 46 | 35.21 ± 3.68 |
| PCL/PLGA/CHA | 8.08 ± 3.17 | 412.94 ± 102 | 33.16 ± 4.21 |
| PCL/PLGA/CHA/EW | 20 ± 7.07 | 172.48 ± 75 | 29.50 ± 8.64 |
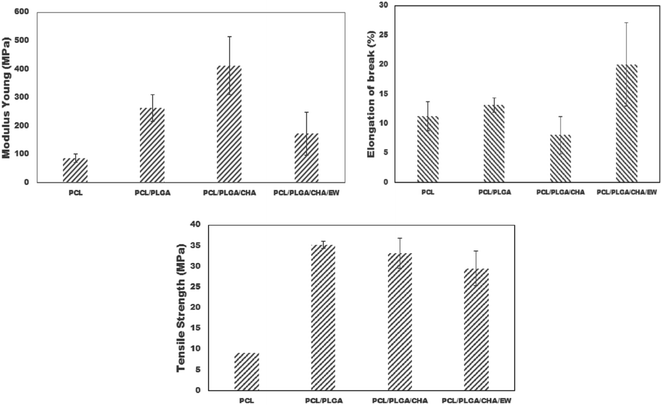
On the contrary, adding EW to PCL/PLGA/CHA/EW significantly decreased the Young's modulus, but increased the elongation at break. The higher Young's modulus of a material will reduce the material's elasticity and vice versa. The mechanical properties of PCL/PLGA/CHA/EW showed the highest elongation at break, indicating that the addition of EW can increase the implant ductility when applied and can resist changes in shape without cracks. The tensile strength of nanofibers is highly dependent on the polymer composition and the size distribution of the fibers.
The key fabrication parameters (solution concentration, flow rate, voltage, collector distance) influence the nanofiber properties, whereby a high concentration of the solution will reduce the porosity of the fibers and increase the mechanical characteristics (Young's modulus and tensile strength).38
3.2 Swelling ratio
Swelling tests were performed for the blended PCL nanofibers through immersion in distilled water for 24 h at room temperature, as shown in Fig. 9. Quantitative analysis showed significant increases in the swelling ratios (%) of PCL, PCL/PLGA, and PCL/PLGA/CHA nanofibers of 100 ± 0.01, 113.15 ± 3.72, 140 ± 37.71, and 53.78 ± 15.05, respectively. PCL and PLGA are hydrophobic polymers,39 but the test results showed increased swelling ratios. PCL is a semi-crystalline polymer with only a part of the surface area permeated; but with amorphous PLGA, it can increase the swelling ratio because permeation occurs through mass transport only through the amorphous polymer phase, not at all through the crystal.41 PCL and PLGA also have the physical adsorption properties of most polymers used in electrospinning.42 The swelling test process for 24 h showed increases in the swelling ratios of PCL/PLGA, due to the contribution of PLGA being easily degraded through hydrolytic cutting and then being able to absorb water/swell. The increase in the swelling ratio was also contributed to by the morphology or porosity of the fiber due to water becoming trapped in the pores.40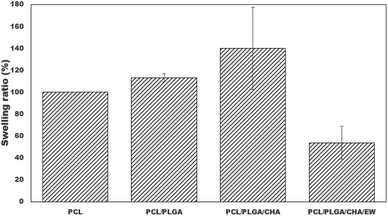 | ||
| Fig. 9 Swelling ratios of the nanofiber after immersion in distilled water for 24 hours (*: p < 0.05). | ||
PCL/PLGA/CHA had the highest swelling ratio due to CHA having a hydroxyl group (OH–) and the increased water absorption into the nanofibers.43 Furthermore, PCL/PLGA/CHA/EW showed the lowest swelling ratio, caused by the addition of the EW composition, which included hydrophobic protein.44 We presume that a phosphorylation process occurred in the EW and CHA to reduce the water absorption in the samples and make them appear more hydrophobic. The low swelling ratio was also caused by the interaction between calcium ions in CHA and protein, facilitating cross-linking and aggregation of the protein chains and causing a high concentration of calcium ions, which could effectively reduce the swelling capacity of the original egg white. The swelling behavior of PCL/PLGA/CHA/EW showed morphological changes after the immersion process in SBF after 3 to 9 days, as confirmed by the FTIR data and SEM morphology. Swelling behaviors were reported in previous studies, reporting that PCL/EW fibers showed hydrophilic properties according to contact angle (CA) testing, showing a CA of 70° at the beginning, followed by a rapid decrease with the absorbance of water droplets throughout the test time.37
3.3 Bioactivity in SBF
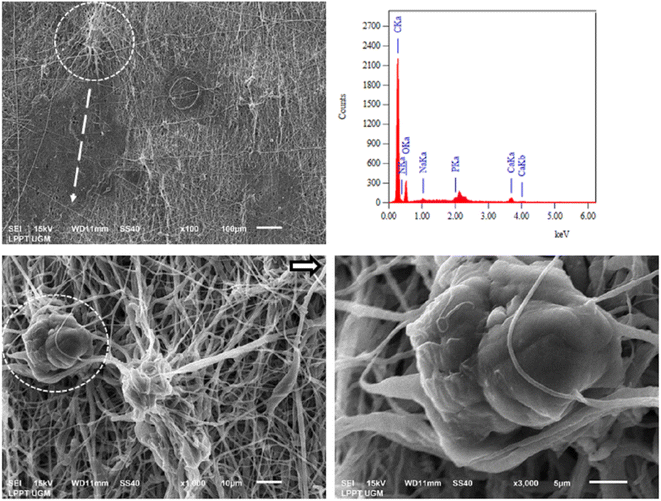
Fig. 10 shows the SEM-EDS morphology and nanofiber size distribution after SBF immersion for 3 and 9 days. The nanofibers before and after immersion in SBF showed an increase in the concentration of Ca and P ions after three days,45 but on day 9, there was a decrease in the concentration of both ions (Ca and P), caused by deposition and melting processes in SBF solution, which was confirmed by previous studies.46–48 In addition, SEM morphology analysis of the nanofibers showed changes in their surface and diameter size after immersion in SBF.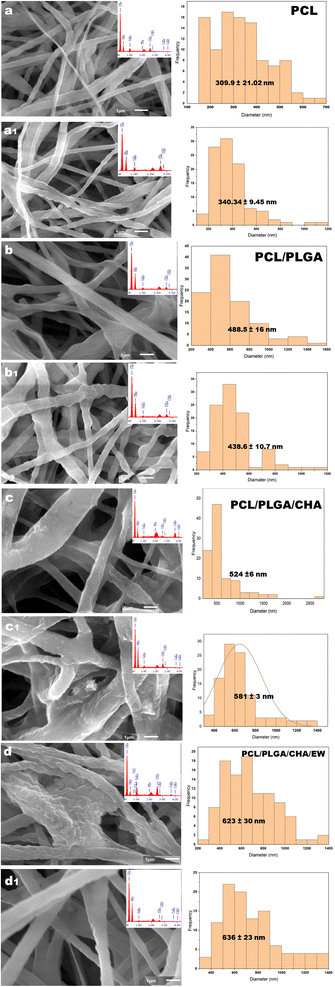 | ||
| Fig. 10 The SEM morphology and nanofiber diameter after immersion in the SBF for 3 and 9 days for PCL (a and a1), PCL/PLGA (b and b1), PCL/PLGA/CHA (c and c1), and PCL/PLGA/CHA/EW (d and d1). | ||
On the 3rd day of SBF immersion, the fibers showed an increase in diameter, and lumps grew on the fiber surface, which indicated apatite growth, which was typically seen in all the samples. On the 9th day, the fibers showed an increased diameter for PCL, PCL/PLGA/CHA, and PCL/PLGA/CHA/EW, but the PCL/PLGA nanofiber size decreased slightly (Fig. 11), due to the composite compositions (PCL![[thin space (1/6-em)]](https://www.rsc.org/images/entities/char_2009.gif) :
:![[thin space (1/6-em)]](https://www.rsc.org/images/entities/char_2009.gif) PLGA, 2
PLGA, 2![[thin space (1/6-em)]](https://www.rsc.org/images/entities/char_2009.gif) :
:![[thin space (1/6-em)]](https://www.rsc.org/images/entities/char_2009.gif) 1) and even hydrophobicity properties, so the immersion process in SBF after nine days did not affect the fiber size. PCL/PLGA/CHA/EW had the highest fiber diameter after SBF immersion for 9 days, indicating the ability of this nanofiber to absorb a lot of water due to the protein content of EW, which is an important parameter application due to its cell adhesion ability.
1) and even hydrophobicity properties, so the immersion process in SBF after nine days did not affect the fiber size. PCL/PLGA/CHA/EW had the highest fiber diameter after SBF immersion for 9 days, indicating the ability of this nanofiber to absorb a lot of water due to the protein content of EW, which is an important parameter application due to its cell adhesion ability.
3.4 Cell viability assay
Biocompatibility testing of PCL/PLGA/CHA/EW was performed using NIH-3T3 fibroblast cells after 48 h of incubation, as shown in Fig. 12. Fibroblasts are the most common types of native connective tissue cells and have interconnections with cartilage cells and bone cells, are responsible for the architectural framework of the body, and can synthesize collagen, elastic fibers, and proteoglycans from the extracellular matrix.49 Collagen produced by fibroblast cells connects the ends of broken bones (fibrocartilaginous callus), and then osteoblast cells will begin to form new spongy bone tissue. So indirectly, fibroblast cells help regulate bone damage through the osteoclast/osteoblast axis.50Fig. 12 shows the PCL/PLGA/CHA/EW surface with the distribution of fibroblast cells attached (yellow arrow), with a magnification of 1000× (yellow circle). The attachment of fibroblast cells that bind and form the surrounding tissue can be seen with the appearance of fibroblast cells. The EDS spectra showed the presence of elements of calcium and phosphate, which are active minerals that formulate bone around the fibroblast cell tissue. MTT assay of fibroblast cells at 48 hours had a cell viability of 85% against control cells (100%) when used as a hydroxyapatite nanoparticle-based gel (20 wt%) for enamel remineralization, showing its cytocompatibility.51
The increase in absorbance after 48 h was due to the high optical density (OD) with the increase in cell concentration, indicating nanofiber biocompatibility; as reported, PCL proliferation with fibroblast cells showed an increase in OD after 48 h.52 Fibroblast cells participate in bone remodeling by communicating between several types of bone tissue cells. With abundant fibroblasts around osteoblasts, secreting ECM can encourage the regeneration of muscle tissue, nerves, arteries, and bone tissue.53
3.5 Antibacterial analysis
Antibacterial activity tests on the PCL-based nanofiber membranes on PCL/PLGA. PCL/PLGA/CHA and PCL/PLGA/CHA/EW were carried out using the disk diffusion method against E. coli and S. aureus bacteria (Fig. 13). As previously reported, PCL54 and PLGA55,56 had no antibacterial activity. The antibacterial agent used in the fabrication of nanofiber membranes was egg white (EW), which has antibacterial properties.9,11,12,57,58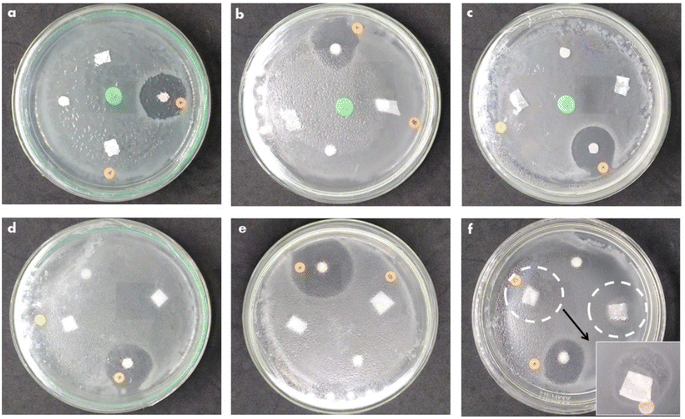 | ||
| Fig. 13 The antibacterial activity of PCL/PLGA (a and d). PCL/PLGA/CHA (b and e), and PCL/PLGA/CHA/EW (c and f) against E. coli (top) and S. aureus (bottom). | ||
The antibacterial activity of PCL/PLGA, PCL/PLGA/CHA, and PCL/PLGA/CHA/EW against E. coli showed a clear area in the positive control (chloramphenicol), while the nanofiber swarmed with bacteria without a clear zone around. Escherichia coli is a Gram-negative bacterium that is resistant to antibiotics. The antibacterial activity of EW against E. coli showed no antibacterial activity, as previously reported by Abdel-Shafi et al.,59 but egg yolk (immunoglobulin, (Ig)Y) could inhibit the growth of E. coli bacteria.60,61 The antibacterial activity in the PCL/PLGA/CHA/EW nanofibers came from the EW protein (lysozyme), a hydrolytic enzyme capable of degrading bacterial cell walls against Gram-positive bacteria, such as S. aureus.62 A clear zone was seen in the control for the antibacterial activity of nanofibers against S. aureus, and the PCL/PLGA/CHA/EW nanofibers showed low antibacterial activity. An inhibition zone was found with the distribution of bacteria, presumably due to the low concentration of EW (0.02 g) and due to protein denaturation by the DMF solvent.
4. Conclusion
In this research, we successfully fabricated a nanofiber PCL/PLGA doped with CHA and EW by an electrospinning technique that showed unique characteristics. The substitution of CHA and EW greatly influenced the mechanical properties of the nanofiber. The additional CHA (PCL/PLGA/CHA) increased the Young's modulus while EW substitution (PCL/PLGA/CHA/EW) increased the elongation at break. PCL/PLGA/CHA/EW had the highest fiber diameter after SBF immersion for 9 days, indicating the ability to absorb a lot of water, which is an important parameter for its cell adhesion ability. Biocompatibility assay of fibroblast cells on PCL/PLGA/CHA/EW showed good cell proliferation (85%) and the sample with EW with a lower concentration showed ability as an antibacterial agent in PCL/PLGA/CHA/EW against S. aureus.Conflicts of interest
There are no conflicts to declare.Acknowledgements
The authors would like to thank the Riset Kolaborasi Indonesia (RKI) 2023 Program (2639/UN1/DITLIT/Dit-Lit/PT.01.03/2023) of the Directorate of Research, Universitas Gadjah Mada, Yogyakarta, Indonesia. The authors also express gratitude for the facilities and technical assistance of the Material Physics and Electronics Laboratory and staff of the Integrated Laboratory for Research and Testing (LPPT) Universitas Gadjah Mada, Yogyakarta, Indonesia.References
- J. Pawlik, K. Łukowicz, K. Cholewa-Kowalska and A. M. Osyczka, Mater. Res. Express, 2019, 6(8), 1–13 CrossRef.
- A. Subramanian, U. M. Krishnan and S. Sethuraman, Ann. Biomed. Eng., 2012, 40, 2098–2110 CrossRef PubMed.
- Y. Qian, H. Chen, Y. Xu, J. Yang, X. Zhou, F. Zhang and N. Gu, Int. J. Nanomed., 2016, 11, 4157–4171 CrossRef CAS PubMed.
- Z. Wang, R. Liang, X. Jiang, J. Xie, P. Cai, H. Chen, X. Zhan, D. Lei, J. Zhao and L. Zheng, Mater. Sci. Eng., C, 2019, 104, 109796 CrossRef CAS PubMed.
- T. Eren Boncu, A. Uskudar Guclu, M. F. Catma, A. Savaser, A. Gokce and N. Ozdemir, Int. J. Pharm., 2020, 573, 118758 CrossRef CAS PubMed.
- M. Milosevic, D. B. Stojanovic, V. Simic, M. Grkovic, M. Bjelovic, P. S. Uskokovic and M. Kojic, Sci. Rep., 2020, 10(1), 11126 CrossRef CAS PubMed.
- N. T. Hiep and B. T. Lee, J. Mater. Sci.: Mater. Med., 2010, 21(6), 1969–1978 CrossRef CAS PubMed.
- Z. Guo, T. Zhang, K. Fang, P. Liu, M. Li and N. Gu, Colloids Surf., A, 2016, 504, 43–52 CrossRef CAS.
- N. Guyot, S. Jan, S. Réhault-godbert, Y. Nys, M. Gautier, N. Guyot, S. Jan, S. Réhault-godbert, Y. Nys and M. Gautier, World’s Poult. Sci. J., 2013, 69, 1–15 CrossRef.
- H. B. Han, X. Li, K. Yu, W. Z. Ma and Z. C. Cao, Asian J. Anim. Vet. Adv., 2011, 6(7), 667–677 CrossRef CAS.
- D. J. Patty, A. D. Nugraheni, I. D. Ana and Y. Yusuf, J. Biomed. Mater. Res., Part B, 2022, 110(6), 1412–1424 CrossRef CAS PubMed.
- D. J. Patty, A. D. Nugraheni, I. D. Ana and Y. Yusuf, J. Biomater. Sci. Polym. Ed., 2022, 1–19 Search PubMed.
- M. Alizadeh-Osgouei, Y. Li and C. Wen, Bioact. Mater., 2019, 4, 22–36 Search PubMed.
- M. Sari, P. Hening, Chotimah, I. D. Ana and Y. Yusuf, Mater. Today Commun., 2021, 26, 102135 CrossRef CAS.
- R. M. Anggraini and Y. Yusuf, IOP Conf. Ser.: Mater. Sci. Eng., 2019, 546(4), 042002 CAS.
- B. ben Nissan, A. H. Choi, and D. W. Green, Marine-Derived Biomaterials for Tissue Engineering Applications, Springer Singapore, Sydney, 2019 Search PubMed.
- E. Landi, G. Celotti, G. Logroscino and A. Tampieri, J. Eur. Ceram. Soc., 2003, 23, 2931–2937 CrossRef CAS.
- C. Cha, F. Piraino and A. Khademhosseini, Microfabrication Technology in Tissue Engineering, Elsevier Inc., 2nd edn., 2014 Search PubMed.
- S. F. Abdellah Ali, IOP Conf. Ser.: Mater. Sci. Eng., 2016, 137, 012035 Search PubMed.
- M. Avella, M. E. Errico, P. Laurienzo, E. Martuscelli, M. Raimo and R. Rimedio, Polym. Commun., 2000, 41, 3875–3881 CrossRef CAS.
- Z. X. Meng, Y. S. Wang, C. Ma, W. Zheng, L. Li and Y. F. Zheng, Mater. Sci. Eng., C, 2010, 30, 1204–1210 CrossRef CAS.
- T. Kokubo and H. Takadama, Biomaterials, 2006, 27, 2907–2915 CrossRef CAS PubMed.
- M. Fleet, Carbonated hydroxyapatite: Materials, synthesis, and applications, 2014 Search PubMed.
- M. Markovic, B. O. Fowler and M. S. Tung, J. Res. Natl. Inst. Stand. Technol., 2004, 109, 553–568 CrossRef CAS PubMed.
- Z. Hajizadeh, R. Taheri-Ledari, and F. R. Asl, Heterogeneous Micro and Nanoscale Composites for the Catalysis of Organic Reactions, Elsevier, 2022, pp. 33–51 Search PubMed.
- X. Wang, H. Zhao, L. S. Turng and Q. Li, Ind. Eng. Chem. Res., 2013, 52, 4939–4949 CrossRef CAS.
- S. M. Kamath, K. Sridhar, D. Jaison, V. Gopinath, B. K. M. Ibrahim, N. Gupta, A. Sundaram, P. Sivaperumal, S. Padmapriya and S. S. Patil, Sci. Rep., 2020, 10(1), 18179 CrossRef CAS PubMed.
- S. Gautam, A. K. Dinda and N. C. Mishra, Mater. Sci. Eng. C, 2013, 33, 1228–1235 CrossRef CAS PubMed.
- J. E. Oliveira, L. H. C. Mattoso, W. J. Orts and E. S. Medeiros, Adv. Mater. Sci. Eng., 2013, 2013, 1–14 Search PubMed.
- O. Gil-Castell, J. D. Badia, I. Ontoria-Oviedo, D. Castellano, P. Sepúlveda and A. Ribes-Greus, Mater. Sci. Eng., C, 2020, 107, 1–14 CrossRef PubMed.
- T. J. Sill and H. A. von Recum, Biomaterials, 2008, 29, 1989–2006 CrossRef CAS PubMed.
- A. Ghajarieh, S. Habibi and A. Talebian, Russ. J. Appl. Chem., 2021, 94, 847–872 CrossRef CAS.
- M. Milosevic, D. Stojanovic, V. Simic, B. Milicevic, A. Radisavljevic, P. Uskokovic and M. Kojic, Materials, 2018, 11(12), 2416 CrossRef CAS PubMed.
- W. Zeng, N. Cheng, X. Liang, H. Hu, F. Luo, J. Jin and Y. Li, Sci. Rep., 2022, 12, 10900 CrossRef CAS PubMed.
- M. Kemme and R. Heinzel-Wieland, J. Funct. Biomater., 2018, 9(1), 1–11 Search PubMed.
- T. A. Vilgis, Rep. Prog. Phys., 2015, 78(12), 124602 CrossRef PubMed.
- N. Z. Renkler, E. Ergene, S. Gokyer, M. Tuzlakoglu Ozturk, P. Yilgor Huri and K. Tuzlakoglu, J. Mater. Sci.: Mater. Med., 2021, 32(4), 1–11 CrossRef PubMed.
- R. Vasita and D. S. Katti, Int. J. Nanomed., 2006, 1, 15–30 CrossRef CAS PubMed.
- D. S. Kohane and R. Langer, Polymeric Biomaterials in Tissue Engineering, 2008 Search PubMed.
- S. Goreninskii, N. Danilenko, E. Bolbasov, A. Evtina, M. Buldakov, N. Cherdyntseva, M. Saqib, N. Beshchasna, J. Opitz, V. Filimonov and S. Tverdokhlebov, J. Appl. Polym. Sci., 2021, 138(23), 1–11 CrossRef.
- J. G. A. Bitter, Desalination, 1984, 51, 19–35 CrossRef CAS.
- B. Niemczyk-Soczynska, A. Gradys and P. Sajkiewicz, Polymers, 2020, 12, 1–20 CrossRef PubMed.
- I. K. Januariyasa, I. D. Ana and Y. Yusuf, Mater. Sci. Eng., C, 2020, 107, 110347 CrossRef CAS PubMed.
- E. E. G. Rojas, J. S. dos Reis Coimbra, L. A. Minim, S. H. Saraiva and C. A. S. da Silva, J. Chromatogr. B, 2006, 840, 85–93 CrossRef CAS PubMed.
- J. A. Rincón-López, J. A. Hermann-Muñoz, A. L. Giraldo-Betancur, A. de Vizcaya-Ruiz, J. M. Alvarado-Orozco and J. Muñoz-Saldaña, Materials, 2018, 11, 17 CrossRef PubMed.
- C. R. Campion, S. L. Ball, D. L. Clarke and K. A. Hing, J. Mater. Sci.: Mater. Med., 2013, 24, 597–610 CrossRef CAS PubMed.
- N. Hashim, S. Sabudin, S. Ibrahim, N. M. Zin, S. H. A. Bakar and F. Fazan, Med. J. Malaysia, 2004, 59(Suppl B), 103–104 Search PubMed.
- P. Ducheyne, Comprehensive Biomaterial, 2011 Search PubMed.
- B. Alberts, A. Johnson, J. Lewis, M. Raff, K. Roberts and P. Walter, Molecular Biology of the Cell, Fibroblasts and Their Transformations: The Connective-Tissue Cell Family, Garland Science, New York, 4th edn, 2002 Search PubMed.
- J. D. Turner, A. J. Naylor, C. Buckley, A. Filer and P. P. Tak, Advances in Experimental Medicine and Biology, Springer New York LLC, 2018, vol. 1060, pp. 37–54 Search PubMed.
- M. Sari, D. M. Ramadhanti, R. Amalina, Chotimah, I. D. Ana and Y. Yusuf, Dent. Mater. J., 2022, 41, 68–77 CrossRef CAS PubMed.
- A. Satish and P. S. Korrapati, RSC Adv., 2015, 5, 83773–83780 RSC.
- M. Li, A. Zhang, J. Li, J. Zhou, Y. Zheng, C. Zhang, D. Xia, H. Mao and J. Zhao, Bioact. Mater., 2020, 5, 938–948 Search PubMed.
- X. H. Bai, J. Zhang, G. T. Cheng, X. F. Liu, T. C. Sun, J. Yang, Z. K. Cao, S. Ramakrishna and Y. Z. Long, J. Mater. Sci., 2022, 57, 3678–3687 CrossRef CAS.
- F. N. Almajhdi, H. Fouad, K. A. Khalil, H. M. Awad, S. H. S. Mohamed, T. Elsarnagawy, A. M. Albarrag, F. F. Al-Jassir and H. S. Abdo, J. Mater. Sci.: Mater. Med., 2014, 25, 1045–1053 CrossRef CAS PubMed.
- A. Haider, S. Kwak, K. C. Gupta and I. K. Kang, J. Nanomater., 2015, 2015, 1–10 CrossRef.
- K. Thiyagarajan, V. K. Bharti, S. Tyagi, P. K. Tyagi, A. Ahuja, K. Kumar, T. Raj and B. Kumar, RSC Adv., 2018, 8, 23213–23229 RSC.
- O. Wellman-Labadie, J. Picman and M. T. Hincke, Br. Poult. Sci., 2008, 49, 125–132 CrossRef CAS PubMed.
- S. Abdel-Shafi, A. Osman, G. Enan, M. El-Nemer and M. Sitohy, SpringerPlus, 2016, 5(1), 1–13 CrossRef PubMed.
- J. Kovacs-Nolan, M. Phillips and Y. Mine, J. Agric. Food Chem., 2005, 53, 8421–8431 CrossRef CAS PubMed.
- Y. H. Zhen, L. J. Jin, J. Guo, X. Y. Li, Y. N. Lu, J. Chen and Y. P. Xu, Vet. Microbiol., 2008, 130, 126–133 CrossRef CAS PubMed.
- X. Shi, X. Li, X. Li, Z. He, X. Chen, J. Song, L. Zeng, Q. Liang, J. Li, G. Xu and J. Zheng, Foods, 2022, 11(4), 1–14 Search PubMed.
| This journal is © The Royal Society of Chemistry 2023 |

