 Open Access Article
Predicted superconductivity in one-dimensional A3Hf2B3-type electrides†
Yulong Chen,
Teng Xie,
Ziqiang Chen,
Zhou Cui,
Cuilian Wen * and
Baisheng Sa
 *
*
Multiscale Computational Materials Facility & Materials Genome Institute, School of Materials Science and Engineering, Fuzhou University, Fuzhou 350108, P. R. China. E-mail: clwen@fzu.edu.cn; bssa@fzu.edu.cn
First published on 23rd November 2023
Abstract
Inorganic electrides are considered potential superconductors due to the unique properties of their anionic electrons. However, most electrides require external high-pressure conditions to exhibit considerable superconducting transition temperatures (Tc). Therefore, searching for superconducting electrides under low or moderate external pressures is of significant research interest and importance. In this work, a series of A3Hf2B3-type compounds (A = Mg, Ca, Sr, Ba; B = Si, Ge, Sn, Pb) were constructed and systematically studied based on density functional theory calculations. According to the analysis of the electronic structures and phonon dispersion spectrums, stable one-dimensional electrides Ca3Hf2Ge3, Ca3Hf2Sn3, and Sr3Hf2Pb3, were screened out. Interestingly, the superconductivity of these electrides were predicted from electron phonon coupling calculations. It is highlighted that Sr3Hf2Pb3 showed the highest Tc, reaching 4.02 K, while the Tc values of Ca3Hf2Ge3 and Ca3Hf2Sn3 were 1.16 K and 1.04 K, respectively. Moreover, the Tc value of Ca3Hf2Ge3 can be increased to 1.96 K under 20 GPa due to the effect of phonon softening. This work enriches the types of superconducting electrides and has important guiding significance for the research on constructing electrides and related superconducting materials.
1. Introduction
The pursuit of high-temperature superconductivity is a pressing research topic. Unfortunately, most of the superconductors discovered through experiments and theory require either excessively high pressures or extremely low temperatures.1–5 To overcome these limitations, a new class of ionic compounds, named electrides, has attracted growing attention and wide interest as novel candidates for superconductors.6–8 Electrides are unique compounds with interstitial anionic electrons that are relatively free in the interstitial region and do not attach to the nucleus.9 This distinctive structure confers upon electrides exceptional electron mobility, low work function, and robust electron-donating capacity, rendering them highly attractive for deployment in various areas, such as superconductivity,10–12 as well as ferromagnetism,13–15 catalysis,16–18 and battery electrodes.19–21 The exploration and development of novel electrides are still ongoing and of great interest.22–25Based on the distribution of anionic electrons, electrides can be categorized into zero-dimensional (0D), one-dimensional (1D), and two-dimensional (2D).26 For 0D electrides, the electrons are localized at specific positions, forming electron anion pairs or isolated electron anions. For 1D electrides, the electron anions can diffuse along one direction in the crystal, forming 1D electron anion chains. For 2D electride, the electron anions can diffuse along two directions, forming planar structures. C12A7:e− is an example of a zero-dimensional (0D) inorganic electride and is the first stable electride at room temperature.27,28 Ca2N was subsequently discovered as the first two-dimensional (2D) inorganic electride, where the anionic electrons are loosely confined in the interlayer space, making Ca2N a highly active catalyst.29,30 Nevertheless, the synthesis of electrides has been a challenging endeavor, as only a handful of them, such as Ca2N19 and Y2C,31 have been successfully prepared owing to their inherent high reactivity, which often translates into lower stability. Among various types of electrides, 1D electrides, which exhibit electron confinement in one dimension, can enhance the thermal stability of the electride.32 Therefore, extending the superconducting electrides to 1D may enable achieving higher superconducting transition temperatures (Tc) at lower external pressures. For example, the 1D electride Nb5Ir3 has been reported to exhibit a Tc of 9.4 K at ambient pressure,33 while Y3Si has been reported to have a Tc of 14.49 K at 50 GPa.34 It is noteworthy that Ca3Si has been found to have the highest Tc among 1D electrides discovered to date, with a value of 17.6 K at 100 GPa. The superconducting properties of Ca3Si are mainly attributed to the electron–phonon coupling between the interstitial electrons and Ca atoms.35
In addition, the application of external pressure to materials has been theoretically and experimentally demonstrated as an effective approach to induce superconductivity or enhance the superconducting transition temperature of materials.36–38 In the case of electrides, external pressure leads to a reduction of the lattice constant and distance between atoms in the crystal. This results in a change in the electron arrangement, thereby influencing the electronic structure and properties of the compound. Pressure can either bring free electrons closer or modify the interactions between electron pairs, affecting their superconducting behavior.39 Recently, the electride Li8Au has been predicted to possess the highest Tc among known electrides, with a value of 73.1 K at a pressure of 250 GPa.11 Despite the fact that many electrides have demonstrated superconducting properties, the majority of them still require high pressure conditions to exhibit high Tc. Therefore, considering the excellent superconducting properties of 1D electrides under low or moderate pressure conditions, it is highly valuable to search for superconductors among 1D electrides.
In this work, by screening A3Hf2B3-type compounds (A = Mg, Ca, Sr, Ba; B = Si, Ge, Sn, Pb) inspired by the realization of novel stable 1D electride Ca3Hf2Pb3,40 we predicted three additional stable one-dimensional electrides (Ca3Hf2Ge3, Ca3Hf2Sn3, and Sr3Hf2Pb3) based on the results of the electron localization function (ELF), electrostatic difference potential (ESDP), band structure, partial charge density around the Fermi level, and phonon dispersions. Furthermore, the superconducting properties of three electrides at ambient pressure were analyzed. Finally, external pressure was applied to attempt to increase the superconducting transition temperature of the electrides while maintaining lattice dynamic stability.
2. Computational details
Herein, structural optimizations and ELF calculations were carried out within the density-functional theory (DFT)41 as implemented in the Vienna ab initio Simulation Package (VASP)42 and employed in conjunction with the ALKEMIE platform.43 Considering both accuracy and computational efficiency, the Perdew–Burke–Ernzerhof generalized gradient approximation (GGA) exchange and correlation functional was used.44 During the structural relaxations, the energy difference between sequential steps were taken to be 10−5 eV to ensure that the calculations were well converged. Crystal structures and isosurfaces were plotted using VESTA software.45 For the constructed electrides, the enthalpy of formation was calculated using the following formula:
 | (1) |
The QuantumWise Atomistix ToolKit (QuantumATK) package46 was used to calculate the ESDP. The PBE-GGA functional was adopted to describe the exchange and correctional interactions of electrons with a linear combination of atomic orbitals (LCAO) norm-conserving PseudoDojo pseudopotential,47 which contains scalar relativistic and fully relativistic pseudopotentials for each element and it is shipped with multiple projectors for each angular channel to ensure high accuracy.48 The density mesh cutoff was set to 85 Hartree,and a 7 × 7 × 7 k-point mesh was generated by the Monkhorst–Pack method with Γ symmetry. Structural optimization was executed until the maximum forces converged to 0.001 eV Å−1.
We used VASP for the study of electronic structures and Quantum ESPRESSO (QE) for the superconducting calculations,49 because this code has all the tools needed to study phonons and electron–phonon coupling (EPC) effects in the context of superconductivity. To investigate the phonon spectra and electron–phonon coupling, the density functional perturbation theory (DFPT)50 calculations were performed with the QE package. The kinetic energy cutoffs of 70 and 700 Ry were chosen for the wavefunctions and the charge densities, respectively. The Fermi surface was also broadened by the Gaussian smearing method with a width of 0.02 eV (0.00147 Ry). Self-consistent electron density and EPC were evaluated by employing a 16 × 16 × 16 k mesh and centered 2 × 2 × 2 q mesh. The superconducting transition temperature Tc was calculated with the McMillan–Allen–Dynes formula:51
 | (2) |
 | (3) |
 | (4) |
 | (5) |
 is an EPC matrix element, which was straightforwardly calculated from the response of the self-consistent potential to lattice distortion as:
 | (6) |
The logarithmic average frequency ωlog is defined as:
 | (7) |
3. Results and discussions
3.1 Crystal structure and screening process
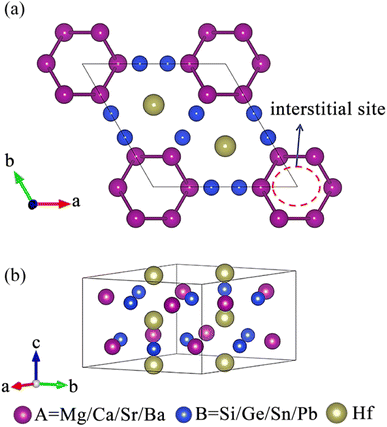
The existence of a sufficiently large void in the crystal structure to accommodate anionic electrons is an important prerequisite for the formation of electrides.26 As shown in Fig. 1, a void surrounded by A site atoms appears along the c-axis direction of the crystal, which is beneficial for accommodating interstitial electrons and forming electrides.40 The design principle of our electride screening is stated as following: considering the good electron donor ability of alkaline earth metals, alkaline earth metals were chosen to replace the A site elements to act as electron donors,35 facilitating the formation of electrides, such as Ca2N55 and Ca3Si.35 On the other hand, to reduce the attraction of anionic atoms to electrons, the electronegativity of element B should not be too strong.35 Group IVA elements, including Si, Ge, Sn, and Pb, have moderate electronegativity (Pauling scale) ranging from 1.87 to 2.01, which is lower than that of group VA elements (the electronegativity of N and P is 3.04 and 2.19, respectively).56 Therefore, group IVA elements were chosen to replace the B site elements.Fig. 2 illustrates our research flow for achieve A3Hf2B3-type electrides and superconductors. Firstly, 15 compounds were constructed by replacing A and B with alkaline earth metal elements and group IVA elements. To identify the characteristics of electrides, ELF was calculated to observe the localization of gap electrons. Herein, ELF is a suitable method for distinguishing localized electrons and electron gas, which has been used as a powerful tool for identifying electrides.57,58 By judging the electron localization phenomenon of the compounds with ELF > 0.75, 8 compounds with obvious electron localization were initially screened, and their stability was analyzed by further phonon dispersion calculations. Through this screening process, three new stable electrides of Ca3Hf2Ge3, Ca3Hf2Sn3, Sr3Hf2Pb3 were finally screened out, and their superconducting properties were further analyzed by the electron–phonon coupling calculations.
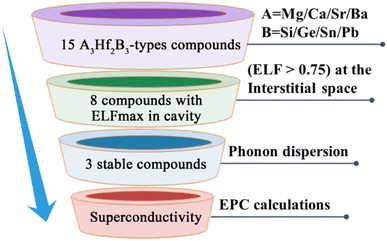 | ||
| Fig. 2 The schematic illustration for the discovery of possible A3Hf2B3-type superconducting electrides. | ||
3.2 Electronic structure and stability at ambient pressure
Fig. 3 displays the preliminary screening results of the ELF with localized electronic features. The results indicate that eight compounds (Ca3Hf2Si3, Ca3Hf2Ge3, Ca3Hf2Sn3, Ba3Hf2Pb3, Sr3Hf2Si3, Sr3Hf2Ge3, Sr3Hf2Sn3, and Sr3Hf2Pb3) exhibit distinctive electron localization phenomena at the interstitial sites along the c-axis direction, indicating the potential to be 1D electrides. These eight compounds show clear 1D channels and characteristic features of 1D electrides at ELF = 0.75. Conversely, Fig. S1† shows that the remaining seven compounds (Ba3Hf2Ge3, Ba3Hf2Si3, Ba3Hf2Sn3, Mg3Hf2Ge3, Mg3Hf2Pb3, Mg3Hf2Si3, and Mg3Hf2Sn3) did not exhibit clear electron localization phenomena, implying that they lack the characteristics of electrides. Hence, our later discussion will focus on the eight compounds exhibiting localized features.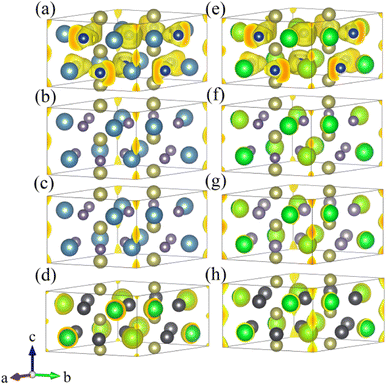 | ||
| Fig. 3 The ELF 3D plots with isosurface value of 0.75 for (a) Ca3Hf2Si3, (b) Ca3Hf2Ge3, (c) Ca3Hf2Sn3, (d) Ba3Hf2Pb3, (e) Sr3Hf2Si3, (f) Sr3Hf2Ge3, (g) Sr3Hf2Sn3, and (h) Sr3Hf2Pb3. | ||
To investigate the lattice dynamic stability of the eight compounds that were preliminarily screened for localized electron phenomena, we calculated the phonon dispersion curves at 0 GPa. Fig. S2† displays the phonon dispersion results. Among the eight compounds, Ca3Hf2Ge3, Ca3Hf2Sn3, and Sr3Hf2Pb3 exhibit no imaginary frequencies throughout the Brillouin zone, indicating dynamic stability at ambient pressure in Fig. S2(b), (c) and (h).† In contrast, the remaining compounds show imaginary frequencies in their phonon dispersion curves, implying instability at 0 GPa. Therefore, we conclude that Ca3Hf2Ge3, Ca3Hf2Sn3, and Sr3Hf2Pb3 have the potential to be stable electrides at 0 GPa.
To further demonstrate the electride nature of Ca3Hf2Ge3, Ca3Hf2Sn3, and Sr3Hf2Pb3, we calculated the electrostatic difference potential (ESDP) to investigate the spatial charge distribution during electronic transitions that lead to electrical conductivity in real space.59 In typical compounds, electrons are tightly bounded to atoms or molecules, making their locations challenging to figure out. However, in electrides, the electrons are dispersed and located in cavities or channels within the crystal structure, which makes it relatively easier to identify their positions.35 Anions, which typically carry negative charges, generate a particular charge distribution in the cavities or channels, leading to a potential difference. The expression for ESDP is given by:
 | (8) |
 | (9) |
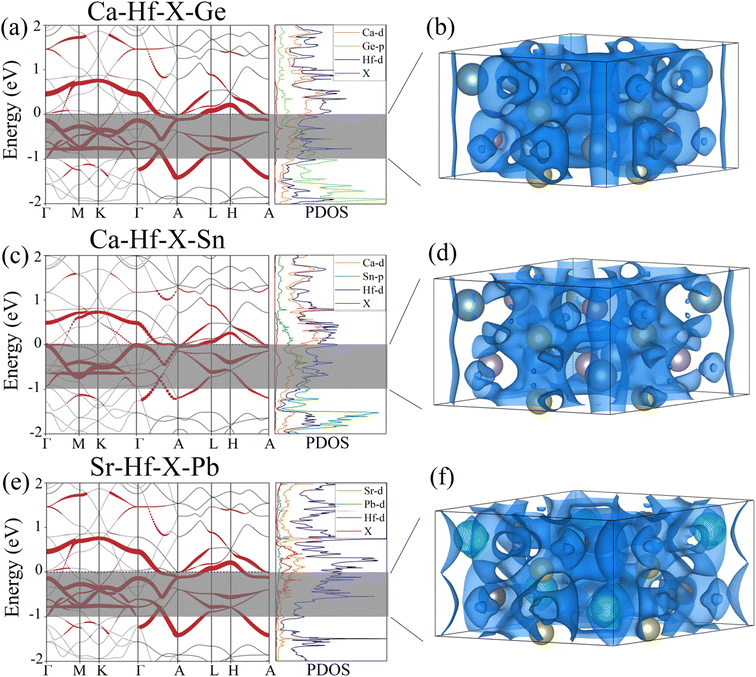
To further understand the electronic structures of three stable potential electrides, we added pseudo atoms (marked as X) to simulate the contribution of anionic electrons at the interstitial positions of (0, 0, 0) and (0, 0, 0.5). Then, we calculated the corresponding projected band structures and partial density of states (PDOS). Fig. 4(a), (c) and (e) show the contribution of interstitial electrons to the band structure marked in red. The energy bands contributed by the interstitial electrons are primarily located near and cross the Fermi level, exhibiting metallic features. Combined with PDOS of the three compounds, we can see that the PDOS contributed by the interstitial electrons are mainly concentrated around the Fermi level, and the PDOS at the Fermi surface is mainly contributed by the Hf d orbitals. To visualize the contribution of interstitial electrons more intuitively, the partial charge densities were calculated within the range of −1 eV < E − EFermi < 0 eV, as shown in Fig. 4(b), (d) and (f). It can be seen that one-dimensional electron channels similar to those shown in the previous ESDP results appear at the interstitial positions, which further verifies the 1D electride characteristics of Ca3Hf2Ge3, Ca3Hf2Sn3, and Sr3Hf2Pb3. Therefore, the above results show that Ca3Hf2Ge3, Ca3Hf2Sn3, and Sr3Hf2Pb3 are stable 1D electride at 0 GPa. Table S1† lists the basic structural information and calculated formation energy values of Ca3Hf2Ge3, Ca3Hf2Sn3, and Sr3Hf2Pb3 for further references. They have the same hexagonal crystal structure as Ca3Hf2Pb3, with a space group of P63/mcm.40 By calculating the formation energy, it is found that the formation energies of these three electrides are all negative, indicating that their formation is an exothermic process, and therefore corresponding experimental synthesis is possible.
3.3 Superconductivity at ambient pressure
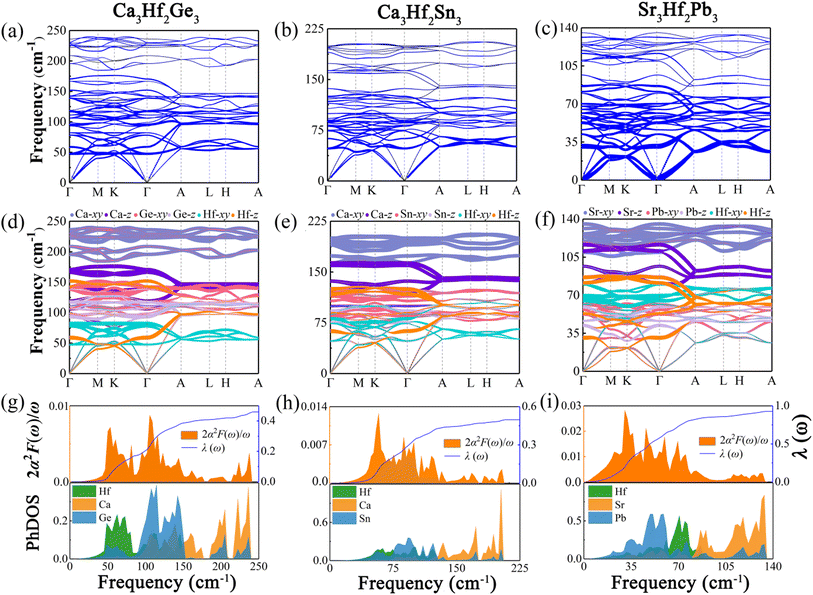
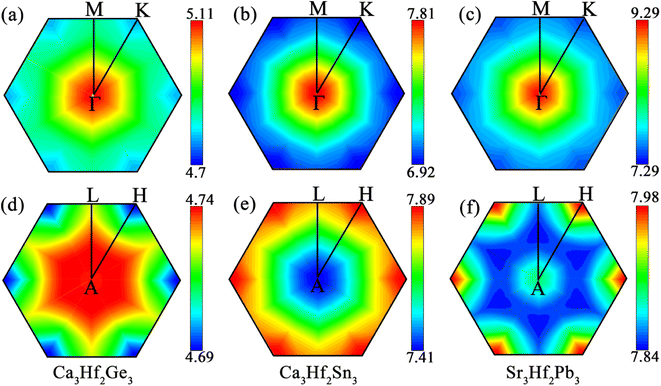
To analyze the vibrational modes and calculate the superconductivity of the three novel electrides, we calculated the phonon dispersion curves weighted by the phonon linewidth γqν, along with the Eliashberg spectral function 2α2F(ω)/ω and the electron–phonon coupling coefficient λ(ω), as illustrated in Fig. 5. The Eliashberg spectral function is represented by the orange area, while the blue line depicts how λ(ω) increases by integrating the spectral function. The phonon dispersion curves weighted by the phonon linewidth γqν are presented in Fig. 5(a)–(c), where the size of the blue lines is proportional to the electron–phonon coupling contribution in that region. The observation reveals that the electron–phonon coupling of the three electrides is primarily concentrated in the middle and low-frequency modes, particularly in Sr3Hf2Pb3. To understand the contribution of different vibrational modes to EPC, we generated the phonon dispersions distinguished by the atomic vibrational modes, as illustrated in Fig. 5(d)–(f). The investigation reveals that the high-frequency vibrational modes in the three electrides, contributed by the alkali-earth metals (Ca, Sr), are mainly associated with the in-plane vibrations (Ca-xy, Sr-xy), with the highest frequency range, while the out-of-plane vibrations (Ca-z, Sr-z) of the alkali-earth metals occupy the next highest frequency range. Vibrational modes associated with the Hf element and the IVA group elements (Ge, Sn, Pb) mainly dominate the low-to-medium frequency range. Fig. 5(g)–(i) show the Eliashberg spectral function 2α2F(ω)/ω and the phonon density of states (PhDOS) of the three electrides. By analyzing the Eliashberg spectral function, it can be observed that the entire range of the Eliashberg spectral function is similar to the phonon dispersion curve weighted by the phonon linewidth γqν. It can be roughly divided into two regions, namely, the low-to-medium frequency range and the high frequency range. For instance, in Fig. 5(i), Sr3Hf2Pb3 exhibits distinct peaks in the low-to-medium frequency range, which diminish considerably in high frequency modes. The result of λ for Sr3Hf2Pb3 reveals that its primary contribution (over 50%) arises from the 0 to 100 cm−1 in the low-to-medium frequency range, while modes in the high frequency range (above 100 cm−1) contribute negligibly to the overall EPC. The final calculated λ values for Ca3Hf2Ge3 and Ca3Hf2Sn3 are both equal to 0.46. Sr3Hf2Pb3 has the highest λ value, reaching 0.74. According to the McMillan–Allen–Dynes equation, the Tc values of Ca3Hf2Ge3, Ca3Hf2Sn3, and Sr3Hf2Pb3 at 0 GPa are calculated to be 1.16 K, 1.04 K, and 4.02 K, respectively. Herein, Sr3Hf2Pb3 has the highest Tc value. By analyzing the PhDOS, it can be more intuitively seen how the vibration modes of different elements contribute to the phonon dispersion. The contribution of alkali earth metals is significantly concentrated in the high frequency region, with a distinct peak in the high frequency area. On the other hand, the contributions of Hf and group IVA elements are relatively evenly distributed in the low-to-medium frequency modes. Therefore, considering the dominant position of Hf d-orbital electrons at the Fermi level, the superconductivity of the three electrides mainly comes from the electron–phonon coupling between the low-to-medium frequency modes dominated by Hf and group IVA elements vibrations and Hf d-orbital electrons.To visualize the contribution regions of EPC, we plotted the integrated distribution within qz = 0 and 0.5 planes in the first Brillouin zone (BZ), by summing up the EPC of all phonon branches on these two planes.60,61 As shown in Fig. 6, in the qz = 0 plane, the EPC integrated distribution of all three electrides is mainly concentrated near the Γ point, indicating a stronger EPC contribution near the Γ point than other positions in this plane. In the qz = 0.5 plane, the EPC integrated distribution of Ca3Hf2Ge3 is relatively concentrated around the A point, with a larger range of hotspots and a radiating shape expanding outwards. However, for Ca3Hf2Sn3 and Sr3Hf2Pb3, the EPC integrated distribution is mainly concentrated near the H point. Although the qz = 0.5 plane exhibits different hotspot distributions, we found that the EPC integrated distribution is more evenly spread out than in the qz = 0 plane, as evidenced by the numerical values on the color scale, indicating a more uniform EPC contribution in various regions on the qz = 0.5 plane.
3.4 Superconductivity under external pressures
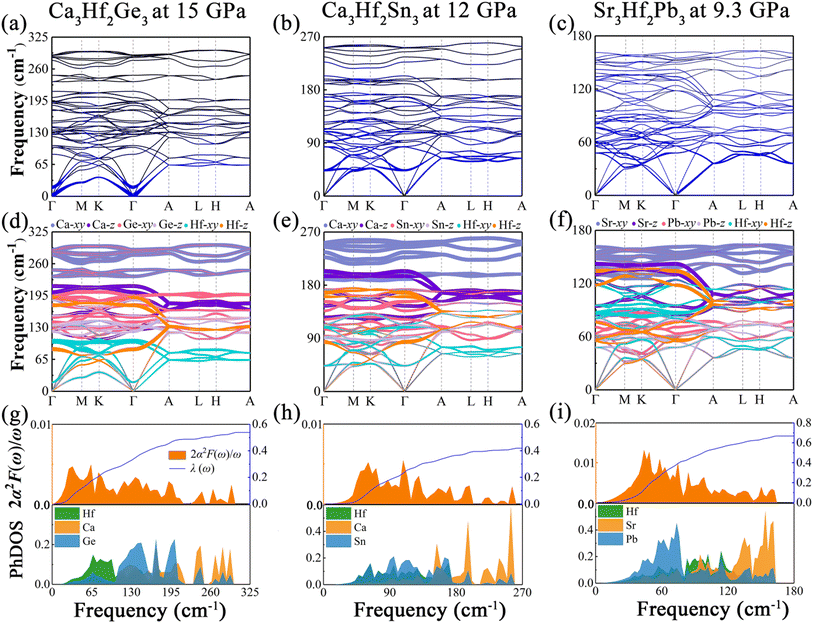
Pressure is a promising method to enhance the superconducting transition temperature. Here, we examined the impact of pressure on the superconducting properties of three artificial electrides. Firstly, we evaluated the lattice dynamical stability of the three electrides at different pressures by computing the phonon dispersion curves, which are depicted in Fig. S4.† Specifically, Fig. S4(a), (c) and (d)† illustrate the phonon dispersion curves of Ca3Hf2Ge3, Ca3Hf2Sn3, and Sr3Hf2Pb3, respectively, at pressures of 15, 12, and 9.3 GPa. Notably, no imaginary frequencies were found in the entire Brillouin zone of these electrides, suggesting their lattice dynamical stability under the corresponding pressure conditions. Nevertheless, at 20 GPa, a clear imaginary frequency appeared near the Γ point of Ca3Hf2Ge3, indicating its instability under this pressure and rendering it unsuitable for further compression in future research.To gain further insight into the impact of external pressure on superconductivity, we calculated the phonon dispersion weighted by the phonon linewidth γqν, as well as the Eliashberg spectral function 2α2F(ω)/ω and the electron–phonon coupling coefficient λ(ω) under selected pressures, as illustrated in Fig. 7. As shown in Fig. 7(a), under a pressure of 15 GPa, the EPC contribution region of Ca3Hf2Ge3 is mainly concentrated in the low frequency region, which is different from that at ambient pressure, where the EPC contribution mainly comes from the low-to-medium frequency region. In contrast, for Ca3Hf2Sn3 and Sr3Hf2Pb3, depicted in Fig. 7(a) and (b), the EPC contributions are still primarily located in the low-to-medium frequency modes, similar to the distribution observed at ambient pressure. Additionally, we saw a phonon softening phenomenon of Ca3Hf2Ge3 on the Γ–M–K–Γ path (qz = 0 plane), especially at the Γ point, which is not observed in the other two compounds. According to the phonon dispersion curves differentiated by vibrational modes shown in Fig. 7(d)–(f), the high-frequency modes are still dominated by the alkali metals under pressure, while the vibration modes of Hf and IVA elements stay concentrated in the low-to-medium frequency region. Based on our analysis, it appears that the softening phonon modes of Ca3Hf2Ge3 are primarily dominated by the in-plane vibration mode of Hf (Hf-xy). Furthermore, from the Eliashberg spectral functions shown in Fig. 7(g)–(i), we observed a clear peak in the low frequency modes of Ca3Hf2Ge3, while the peaks of Ca3Hf2Sn3 and Sr3Hf2Pb3 are still concentrated in the low-to-medium frequency region, and the calculated λ(ω) curve rapidly increases in this region. Based on the analysis of PhDOS, we found that the states in the low frequency modes of Ca3Hf2Ge3 are mainly contributed by Hf atoms, while the results of PhDOS of the other two compounds under pressure are similar to those at 0 GPa. According to the McMillan–Allen–Dynes equation, the calculated Tc value of Ca3Hf2Ge3 under a pressure of 15 GPa is 1.96 K, which is significantly higher than that at 0 GPa. Therefore, we conclude that the enhancement of Tc in Ca3Hf2Ge3 under pressure mainly results from phonon softening. However, for Ca3Hf2Sn3 and Sr3Hf2Pb3, their Tc values decreased to 0.71 K and 2.69 K under pressures of 12 GPa and 9.3 GPa, respectively, indicating that further increasing of the external pressure could not increase their Tc values.
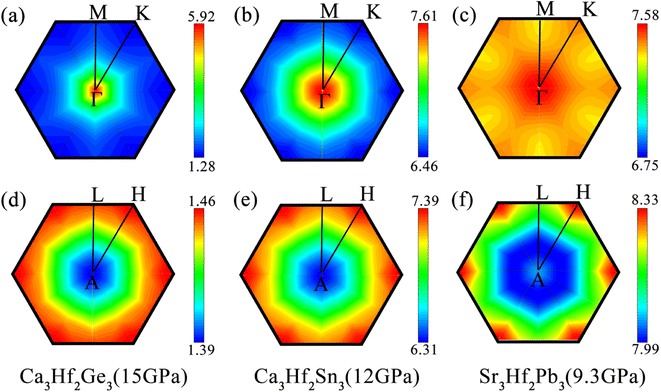
To observe the distribution of EPC under external pressures, we also plotted the integrated distribution on the qz = 0 and 0.5 planes in the first Brillouin zone (BZ) under different pressure, as shown in Fig. 8. It can be seen that, similar to the results at 0 GPa, the EPC integrated distributions of the three electron compounds are mainly concentrated near the Γ point on the qz = 0 plane. However, on the qz = 0.5 plane, the EPC integrated distributions of the three electrides are more concentrated around the H point. Except for Ca3Hf2Sn3, the EPC integrated distributions on the qz = 0.5 plane still appear more uniform compared to the qz = 0 plane. For Ca3Hf2Ge3, we can observe a significant distribution around the Γ point, which is contributed by the softening phonon mode mentioned earlier in qz = 0 plane. This phenomenon further confirms that the increase in Tc value of Ca3Hf2Ge3 under pressure is due to the contribution of phonon softening.
To gain a deeper understanding of the superconducting mechanism of A3Hf2B3-type electrides under various pressure conditions, we investigated the superconducting transition temperature (Tc), logarithmic phonon frequency (ωlog), and λ(ω) of Ca3Hf2Ge3, Ca3Hf2Sn3, and Sr3Hf2Pb3 under different pressure conditions, as shown in Fig. 9. We can see that the changes in λ(ω) values are consistent with those of Tc values, while ωlog shows an opposite trend. For the calculated compound with the highest Tc, Sr3Hf2Pb3, also has the highest calculated λ(ω) value of 0.74. Conversely, for Ca3Hf2Sn3 under 12 GPa with the smallest Tc value, its calculated λ(ω) is the minimum value of 0.42. To evaluate the effect of pressure on the superconducting properties of the three electrides more intuitively, Table S2† lists the calculated λ, ωlog, and Tc values under selected pressures for the three electron compounds. Fig. S5† depicts the influence of various μ* values on Tc. It is evidently that despite a significant decreasing trend in Tc values of all electrides with increasing μ* values, the order of Tc for the selected pressures remains unchanged, irrespective of the μ* value. It is seen that Sr3Hf2Pb3 still exhibits the highest Tc value at 0 GPa, while Ca3Hf2Sn3 at 12 GPa has the smallest Tc.
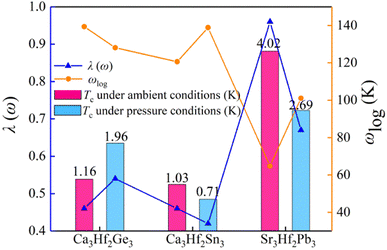 | ||
| Fig. 9 The estimated superconducting transition temperature Tc, logarithmic phonon frequency ωlog, and λ(ω) for Ca3Hf2Ge3, Ca3Hf2Sn3, and Sr3Hf2Pb3 under different pressure conditions. | ||
4. Conclusion
In summary, we have systematically investigated the electron localization function (ELF), electrostatic difference potential (ESDP), band structure, partial charge density around the Fermi level, and phonon dispersions of A3Hf2B3-type compounds (A = Mg, Ca, Sr, Ba; B = Si, Ge, Sn, Pb) via density functional theory calculations combined with electron phonon coupling calculations. Among them, we identified three novel stable 1D electrides, Ca3Hf2Ge3, Ca3Hf2Sn3, and Sr3Hf2Pb3. By calculating their electron–phonon coupling properties, the superconducting transition temperatures (Tc) of Ca3Hf2Ge3, Ca3Hf2Sn3, and Sr3Hf2Pb3 were predicted to be 1.16 K, 1.04 K, and 4.02 K, respectively, and their superconducting properties were mainly derived from the electron–phonon coupling between the d-electrons of Hf and the low-to-medium frequency range vibration modes dominated by Hf and group IVA elements. Under external pressure, the Tc of Ca3Hf2Ge3 increased to 1.96 K at 15 GPa, while the Tc of Ca3Hf2Sn3 and Sr3Hf2Pb3 decreased. The increase in Tc of Ca3Hf2Ge3 was attributed to the pressure-induced phonon softening phenomenon. The analysis of the superconducting properties revealed that the trend of λ values was consistent with that of Tc, while the trend of ωlog values was opposite. The value of μ* did not affect the trend and magnitude of the changes in Tc with pressure for the three electrides.Conflicts of interest
The authors declare no competing financial interest.Acknowledgements
This work was supported by the National Key Research and Development Program of China (No. 2022YFB3807200), the National Natural Science Foundation of China (No. 21973012), the Natural Science Foundation of Fujian Province (No. 2021J06011, 2021H6011 and 2021J01590), and the “Qishan Scholar” Scientific Research Project of Fuzhou University.References
- A. P. Drozdov, M. I. Eremets, I. A. Troyan, V. Ksenofontov and S. I. Shylin, Nature, 2015, 525, 73–76 CrossRef CAS PubMed.
- Y. Li, J. Hao, H. Liu, Y. Li and Y. Ma, J. Chem. Phys., 2014, 140, 174712 CrossRef PubMed.
- H. Liu, I. I. Naumov, R. Hoffmann, N. W. Ashcroft and R. J. Hemley, Proc. Natl. Acad. Sci. U. S. A., 2017, 114, 6990–6995 CrossRef CAS PubMed.
- J. Nagamatsu, N. Nakagawa, T. Muranaka, Y. Zenitani and J. Akimitsu, Nature, 2001, 410, 63–64 CrossRef CAS PubMed.
- F. Peng, Y. Sun, C. J. Pickard, R. J. Needs, Q. Wu and Y. Ma, Phys. Rev. Lett., 2017, 119, 107001 CrossRef PubMed.
- J. L. Dye, Science, 2003, 301, 607–608 CrossRef CAS PubMed.
- Y. Gong, H. Li, J. Wu, X. Song, X. Yang, X. Bao, X. Han, M. Kitano, J. Wang and H. Hosono, J. Am. Chem. Soc., 2022, 144, 8683–8692 CrossRef CAS PubMed.
- X. Yang, K. Parrish, Y.-L. Li, B. Sa, H. Zhan and Q. Zhu, Phys. Rev. B, 2021, 103, 125103 CrossRef CAS.
- K. Li, V. A. Blatov and J. Wang, Adv. Funct. Mater., 2022, 32, 2112198 CrossRef CAS.
- M. Miyakawa, S. W. Kim, M. Hirano, Y. Kohama, H. Kawaji, T. Atake, H. Ikegami, K. Kono and H. Hosono, J. Am. Chem. Soc., 2007, 129, 7270–7271 CrossRef CAS PubMed.
- X. Zhang, Y. Yao, S. Ding, A. Bergara, F. Li, Y. Liu, X.-F. Zhou and G. Yang, Phys. Rev. B, 2023, 107, L100501 CrossRef CAS.
- X. Zhang, Y. Zhao, A. Bergara and G. Yang, J. Chem. Phys., 2022, 156, 194112 CrossRef CAS PubMed.
- L. Liu, C. Wang, S. Yi, D. K. Kim, C. H. Park and J.-H. Cho, Phys. Rev. B, 2019, 99, 220401 CrossRef CAS.
- X.-L. Qiu, J.-F. Zhang, Z.-Y. Lu and K. Liu, J. Phys. Chem. C, 2019, 123, 24698–24704 CrossRef CAS.
- X. Zhang, W. Meng, Y. Liu, X. Dai, G. Liu and L. Kou, J. Am. Chem. Soc., 2023, 145, 5523–5535 CrossRef CAS PubMed.
- S. H. Kang, J. Bang, K. Chung, C. N. Nandadasa, G. Han, S. Lee, K. H. Lee, K. Lee, Y. Ma and S. H. Oh, Sci. Adv., 2020, 6, 7416 CrossRef PubMed.
- J. Wu, J. Li, Y. Gong, M. Kitano, T. Inoshita and H. Hosono, Angew. Chem., Int. Ed., 2019, 58, 825–829 CrossRef CAS PubMed.
- W. Li, C. Liu, C. Gu, J.-H. Choi, S. Wang and J. Jiang, J. Am. Chem. Soc., 2023, 145, 4774–4783 CrossRef CAS PubMed.
- D. L. Druffel, K. L. Kuntz, A. H. Woomer, F. M. Alcorn, J. Hu, C. L. Donley and S. C. Warren, J. Am. Chem. Soc., 2016, 138, 16089–16094 CrossRef CAS PubMed.
- S. Qi, C. Li, J. Wang, X. Song, M. Zhao and G. Chen, J. Phys. Chem. Lett., 2023, 14, 7992–7999 CrossRef CAS PubMed.
- M. Xu, C. Wang, B. J. Morgan and L. A. Burton, J. Mater. Chem. C, 2022, 10, 6628–6633 RSC.
- J. Wang, K. Hanzawa, H. Hiramatsu, J. Kim, N. Umezawa, K. Iwanaka, T. Tada and H. Hosono, J. Am. Chem. Soc., 2017, 139, 15668–15680 CrossRef CAS PubMed.
- J.-Y. You, B. Gu, G. Su and Y. P. Feng, J. Am. Chem. Soc., 2022, 144, 5527–5534 CrossRef CAS PubMed.
- B. Sa, Z. Yang, Y. Zhang, Y. Si, H. Li, C. Zhu, C. Wen, B. Wu and T. Yu, Dalton Trans., 2022, 51, 16836–16844 RSC.
- L. M. McRae, R. C. Radomsky, J. T. Pawlik, D. L. Druffel, J. D. Sundberg, M. G. Lanetti, C. L. Donley, K. L. White and S. C. Warren, J. Am. Chem. Soc., 2022, 144, 10862–10869 CrossRef CAS PubMed.
- Q. Zhu, T. Frolov and K. Choudhary, Matter, 2019, 1, 1293–1303 CrossRef.
- S. Matsuishi, Y. Toda, M. Miyakawa, K. Hayashi, T. Kamiya, M. Hirano, I. Tanaka and H. Hosono, Science, 2003, 301, 626–629 CrossRef CAS PubMed.
- W. Meng, X. Zhang, Y. Liu, X. Dai, G. Liu, Y. Gu, E. P. Kenny and L. Kou, Advanced Science, 2023, 10, 2205940 CrossRef CAS PubMed.
- K. Lee, S. W. Kim, Y. Toda, S. Matsuishi and H. Hosono, Nature, 2013, 494, 336–340 CrossRef CAS PubMed.
- B. Liu, Z. Chen, R. Xiong, X. Yang, Y. Zhang, T. Xie, C. Wen and B. Sa, Chin. Chem. Lett., 2023, 34, 107643 CrossRef CAS.
- X. Zhang, Z. Xiao, H. Lei, Y. Toda, S. Matsuishi, T. Kamiya, S. Ueda and H. Hosono, Chem. Mater., 2014, 26, 6638–6643 CrossRef CAS.
- Y. Zhang, Z. Xiao, T. Kamiya and H. Hosono, J. Phys. Chem. Lett., 2015, 6, 4966–4971 CrossRef CAS PubMed.
- Y. Zhang, B. Wang, Z. Xiao, Y. Lu, T. Kamiya, Y. Uwatoko, H. Kageyama and H. Hosono, npj Quantum Mater., 2017, 2, 45 CrossRef.
- J. Zhang, G. Chen and H. Liu, J. Phys. Chem. Lett., 2021, 12, 10388–10393 CrossRef CAS PubMed.
- B. Sa, R. Xiong, C. Wen, Y.-L. Li, P. Lin, Q. Lin, M. Anpo and Z. Sun, J. Phys. Chem. C, 2020, 124, 7683–7690 CrossRef CAS.
- K. Yang, W. Cui, J. Hao, J. Shi and Y. Li, Phys. Rev. B, 2023, 107, 024501 CrossRef CAS.
- J.-G. Si, W.-J. Lu, Y.-P. Sun, P.-F. Liu and B.-T. Wang, Phys. Rev. B, 2022, 105, 024517 CrossRef CAS.
- M. Xu, Y. Li and Y. Ma, Chem. Sci., 2022, 13, 329–344 RSC.
- Q. Wang, S. Zhang, H. Li, H. Wang, G. Liu, J. Ma, H. Xu, H. Liu and Y. Ma, J. Mater. Chem. A, 2023, 11, 21345–21353 RSC.
- K. Li, Y. Gong, J. Wang and H. Hosono, J. Am. Chem. Soc., 2021, 143, 8821–8828 CrossRef CAS PubMed.
- P. Hohenberg and W. Kohn, Phys. Rev., 1964, 136, B864–B871 CrossRef.
- G. Kresse and J. Furthmüller, Phys. Rev. B: Condens. Matter Mater. Phys., 1996, 54, 11169–11186 CrossRef CAS PubMed.
- G. Wang, L. Peng, K. Li, L. Zhu, J. Zhou, N. Miao and Z. Sun, Comput. Mater. Sci., 2021, 186, 110064 CrossRef CAS.
- J. P. Perdew, K. Burke and M. Ernzerhof, Phys. Rev. Lett., 1996, 77, 3865 CrossRef CAS PubMed.
- K. Momma and F. Izumi, J. Appl. Crystallogr., 2011, 44, 1272–1276 CrossRef CAS.
- S. Smidstrup, T. Markussen, P. Vancraeyveld, J. Wellendorff, J. Schneider, T. Gunst, B. Verstichel, D. Stradi, P. A. Khomyakov and U. G. Vej-Hansen, J. Phys.: Condens. Matter, 2019, 32, 015901 CrossRef PubMed.
- V. Blum, R. Gehrke, F. Hanke, P. Havu, V. Havu, X. Ren, K. Reuter and M. Scheffler, Comput. Phys. Commun., 2009, 180, 2175–2196 CrossRef CAS.
- B. Sa, X. Shen, S. Cai, Z. Cui, R. Xiong, C. Xu, C. Wen and B. Wu, Phys. Chem. Chem. Phys., 2022, 24, 15376–15388 RSC.
- P. Giannozzi, S. Baroni, N. Bonini, M. Calandra, R. Car, C. Cavazzoni, D. Ceresoli, G. L. Chiarotti, M. Cococcioni, I. Dabo, A. Dal Corso, S. de Gironcoli, S. Fabris, G. Fratesi, R. Gebauer, U. Gerstmann, C. Gougoussis, A. Kokalj, M. Lazzeri, L. Martin-Samos, N. Marzari, F. Mauri, R. Mazzarello, S. Paolini, A. Pasquarello, L. Paulatto, C. Sbraccia, S. Scandolo, G. Sclauzero, A. P. Seitsonen, A. Smogunov, P. Umari and R. M. Wentzcovitch, J. Phys.: Condens. Matter, 2009, 21, 395502 CrossRef PubMed.
- A. D. Becke, J. Chem. Phys., 1992, 96, 2155–2160 CrossRef CAS.
- P. B. Allen, Phys. Rev. B: Solid State, 1972, 6, 2577–2579 CrossRef CAS.
- K.-H. Lee, K. J. Chang and M. L. Cohen, Phys. Rev. B: Condens. Matter Mater. Phys., 1995, 52, 1425–1428 CrossRef CAS PubMed.
- C. F. Richardson and N. W. Ashcroft, Phys. Rev. Lett., 1997, 78, 118–121 CrossRef CAS.
- G. Eliashberg, Soviet Physics – JETP, 1960, 11, 696–702 Search PubMed.
- H. Tang, B. Wan, B. Gao, Y. Muraba, Q. Qin, B. Yan, P. Chen, Q. Hu, D. Zhang, L. Wu, M. Wang, H. Xiao, H. Gou, F. Gao, H.-k. Mao and H. Hosono, Adv. Sci., 2018, 5 Search PubMed.
- L. Pauling, J. Am. Chem. Soc., 1932, 54, 3570–3582 CrossRef CAS.
- Y. Ma, M. Eremets, A. R. Oganov, Y. Xie, I. Trojan, S. Medvedev, A. O. Lyakhov, M. Valle and V. J. N. Prakapenka, Nature, 2009, 458, 182–185 CrossRef CAS PubMed.
- M. s. Miao and R. Hoffmann, J. Am. Chem. Soc., 2015, 137, 3631–3637 CrossRef CAS PubMed.
- A. L. Despotuli and A. V. Andreeva, J. Electroanal. Chem., 2018, 829, 1–6 CrossRef CAS.
- Y. Han, Y. Li, L. Yang, H. Liu, N. Jiao, B. Wang, H. Lu and P. Zhang, Mater. Today Phys., 2023, 30, 100954 CrossRef CAS.
- P. Liu, F. Zheng, J. Li, J. Si, L. Wei, J. Zhang and B. Wang, Phys. Rev. B: Condens. Matter Mater. Phys., 2022, 105, 245420 CrossRef CAS.
Footnote |
| † Electronic supplementary information (ESI) available. See DOI: https://doi.org/10.1039/d3ra07383a |
| This journal is © The Royal Society of Chemistry 2023 |

