 Open Access Article
Exploring the source of ammonia generation in electrochemical nitrogen reduction using niobium nitride†
So Young Parkac,
So Eun Janga,
Chang Woo Kim b,
Youn Jeong Jang*c and
Duck Hyun Youn
 *a
*a
aDepartment of Chemical Engineering, Department of Integrative Engineering for Hydrogen Safety, Kangwon National University, Chuncheon 24341, South Korea. E-mail: youndh@kangwon.ac.kr
bDepartment of Nanotechnology Engineering, Pukyong National University, Busan 48513, South Korea
cDepartment of Chemical Engineering, Hanyang University, Seoul 04763, South Korea. E-mail: yjang53@hanyang.ac.kr
First published on 24th November 2023
Abstract
In this study, niobium nitride (NbN) is prepared via the urea-glass route by annealing a mixture of NbCl5 and urea at 650 °C under a flow of N2, and is used as a catalyst for the electrochemical nitrogen reduction reaction (NRR). The as-prepared NbN exhibits a maximum production rate of 5.46 × 10⁻¹⁰ mol s−1 cm−2 at −0.6 V vs. RHE, along with an apparent FE of 16.33% at −0.3 V vs. RHE. In addition, the leaching of NbN is confirmed by ICP-OES, where the leached amount of Nb is almost identical to the amount of N measured by UV-vis. Moreover, 1H NMR experiments are performed using 15N2 as the feeder gas; the dominant detection of 14NH4+ peaks strongly suggests that the produced NH3 originates from the leaching of NbN rather than via an electrocatalytic process. Hence, for a comprehensive understanding of NH3 generation, especially when utilizing transition metal nitride (TMN)-based NRR catalysts, a thorough investigation employing multiple analytical methods is imperative.
Introduction
Ammonia (NH3) is an indispensable material in various industrial fields, including fertilizers, explosives, pharmaceuticals, and plastics.1,2 Moreover, due to its high hydrogen density of 17.6 wt%, along with its relatively high liquefaction point of −33.4 °C compared with that of hydrogen (−253 °C), increased attention has been focused on ammonia as an effective hydrogen carrier.3,4 Currently, the Haber–Bosch (H–B) process is the dominant method for producing ammonia on an industrial scale. However, this process has significant drawbacks in terms of energy consumption (1% of the global total) and CO2 emissions (1.67 tons per ton of NH3), because it is operated at high temperatures (400–500 °C) and pressures (150–300 atm),5,6 and because the necessary H2 gas is mainly sourced from the steam methane reforming (SMR) of fossil fuels.7–10 By contrast, the electrochemical nitrogen reduction reaction (NRR) can be operated under ambient conditions, and the requisite H2 molecules are produced by water electrolysis powered by solar or wind energy,11,12 thereby enabling a significant reduction in CO2 emissions and energy consumption compared with the H–B process. Hence, the NRR is regarded as a promising approach for environmental-friendly production of ammonia.In view of the above considerations, many studies and pioneering works have been conducted with the aim of developing efficient catalysts for the NRR. However, the NRR performance is generally compromised by the competing hydrogen evolution reaction (HER), which involves only two electrons and requires a lower overpotential than the NRR.13,14 Consequently, the NH3 production rates and faradaic efficiencies (FE) of the presently-available NRR catalysts remain far below the target set by the practical utilization guidelines of the United States Department of Energy (US DOE), which call for a current density 300 mA cm−2 and an FE of 90%.15,16 Therefore, to enhance the NRR activity of the catalyst, it is necessary to develop a catalyst that can reduce its HER performance by reducing its affinity for hydrogen and increasing its affinity for nitrogen.
Among the various catalysts, transition metal nitrides (TMNs) are regarded as particularly promising catalysts for the NRR due to their unique Mars–van Krevelen (MvK) mechanism.16,17 Indeed, density functional theory (DFT) studies have suggested that TMNs can effectively lower the HER, thereby potentially providing enhanced NRR activities.18–22 In particular, VN, CrN, NbN, and ZrN have been suggested as promising candidates for the NRR. Inspired by DFT results, various TMNs were employed for NRR. However, recent studies on the TMNs and their ability to produce ammonia have suggested two different opinions, namely: (1) catalytic reaction via the MvK mechanism (or others), and (2) non-catalytic reaction via leaching or decomposition of the catalyst. For instance, Zhang et al. reported that VN loaded on carbon cloth (VN/CC) catalyst yielded NH3 at a rate of 2.48 × 10⁻¹⁰ mol s−1 cm−2 with an FE of 3.58%,23 thereby indicating catalytic activity, whereas Du et al. reported that VN displayed non-catalytic activity, and produced NH3 via the reduction of the released lattice N3− atoms.24 Similarly, Mo2N has been investigated by two different groups, with one group reporting an NH3 yield of 78.4 μg h−1 mg−1cat with an FE of 4.5% via a catalytic mechanism,25 while the second group reported a maximum FE of 42.3% at −0.05 V vs. RHE and a yield of 2.73 μg h−1 mg−1 at 0.05 V, due to Mo2N decomposition.26 The latter conclusion was evidenced by the 1H NMR spectra, which exhibited only 14NH4+ peaks despite the use of 15N2 as the feeder gas. The other studies concerning the leaching or decomposition of TMN-based catalysts are summarized in Table S1.† Meanwhile, NbN catalysts are expected to have catalytic activity for NRR owing to the N-vacancy regeneration and durability of the catalytic cycle on NbN (111) facet based on previous DFT investigations.27 Nevertheless, experimental studies on the use of NbN as an NRR catalyst are rare.
Hence, in the present study, an NbN catalyst is prepared by a simple urea glass route, and its NRR performance in alkaline solution is investigated thoroughly in order to determine the origin of the produced ammonia. The as-prepared NbN exhibits an NH3 yield of 5.46 × 10⁻¹⁰ mol s−1 cm−2 at −0.6 V vs. RHE, and an apparent FE of 16.33% at −0.3 V vs. RHE. By combining inductively coupled plasma optical emission spectrometry (ICP-OES), ultraviolet-visible spectrophotometer (UV-vis) and isotope nuclear magnetic resonance (NMR) characterization, the produced ammonia is proven to be generated by leaching of the catalyst, with mainly 14NH4+ peaks being detected in the NMR spectrum despite the use of 15N2 as the feeder gas. Moreover, the amount of leached Nb measured by ICP-OES is almost identical to the amount of N detected by UV-vis. Thus, the present study strongly demonstrates that the produced NH3 originates from leaching of the NbN, and is expected to provide a good guideline for the selection of catalysts for the NRR.
Materials and methods
Materials
Niobium(V) chloride (NbCl5; 99%), ammonium chloride (NH4Cl; ≥99.5%), 4-(dimethylamino)benzaldehyde (p-C9H11NO; ≥99%), dimethyl sulfoxide-d6 (DMSO-d6; 99.9 atom% D), 15N2 (98 atom% 15N), ammonium-15N chloride (15NH4Cl; ≥98 atom% 15N), potassium sodium tartrate tetrahydrate (KNaC4H4O6; 99%), and graphite rods (99.995% trace metals basis) were purchased from Sigma-Aldrich. N2 (high purity, 99.999%) and Ar (high purity, 99.999%) gases were purchased from Hyundai energy. Urea (99.0%), ethyl alcohol (C2H5OH; 99.9%, anhydrous), and hydrochloric acid (HCl; 35.0–37.0%) were purchased from Samchun Chemicals. Hydrazine monohydrate (N2H4·H2O; 98+%) was obtained from Alfa-Aesar, Nessler solution was obtained from Fischer Chemical, and carbon paper (CP; AvCarb MGL 370) was purchased from Fuel Cell store.NbN synthesis
NbN was synthesized via the urea-glass route.28 In a typical synthesis, 1000 mg of NbCl5 was dispersed in 2.53 ml of ethanol, and 1509 mg of urea was added to the solution under magnetic stirring. After stirring for 1 h, the resultant viscous solution was transferred into an alumina boat and annealed at 650 °C for 3 h under a flow of N2. Before removing the alumina boat from the furnace at room temperature, mixed N2/air gas was allowed to flow for 10 min to prevent rapid oxidation of the NbN (passivation).Characterization
The crystalline structure of the catalyst was analyzed by X-ray diffraction (XRD; Rigaku, MiniFlex 600) with Cu-Kα (λ = 1.54 Å) radiation. The surface morphologies were investigated using a field-emission scanning electron microscope (FE-SEM; JEOL, JMS-7000F) equipped with an energy dispersive spectrometer (EDS). X-ray photoelectron spectroscopy (XPS; Thermo Scientific, K alpha) was used to characterize the surface oxidation states and chemical compositions. The produced ammonia was detected by UV-vis spectrophotometer (UV-vis; SHIMADZU, UV-2600i) and the leached metal was quantified via inductively coupled plasma optical emission spectrometer (ICP-OES; Agilent, Agilent 5900).Electrochemical measurements
A potentiostat (AMETEK, VersaSTAT 3) was used to conduct the electrochemical measurements in a single-compartment cell equipped with a three-electrode system, and a 0.1 M KOH solution served as the electrolyte (Fig. S1†). The working electrode, designated as NbN/CP, was prepared by dispersing 10 mg of the NbN catalyst in 500 μL of ethanol and then loading it onto 1 × 1 cm2 carbon paper (with a mass loading of 2 mg cm−2) by drop casting. A graphite rod and Ag/AgCl (3 M NaCl) were used as the counter and reference electrode, respectively. All recorded potentials were converted to reversible hydrogen electrode (RHE). Linear sweep voltammetry (LSV) was conducted at a scan rate of 5 mV s−1 and chronoamperometry tests were performed for 2 h at −0.3 to −0.6 V vs. RHE. Prior to the LSV test, cyclic voltammetry (CV) was performed at a scan rate of 50 mV s−1 for 20 cycles in order to stabilize the catalyst. The electrolyte was continuously bubbled with N2 gas for 30 min prior to and throughout the duration of these tests.Ammonia detection
The amounts of produced NH3 in the electrolyte and in the acid trap after electrolysis were detected via Nessler's method.29 The acid trap, connected to the gas-out line of the reaction cell (Fig. S1†), was employed to capture NH3 that escaped without dissolving in the electrolyte during the reaction. 0.05 M H2SO4 was utilized for this purpose. In this approach, 5 ml of each aliquot from each source was mixed with 0.1 ml of 500 g L−1 KNaC4H4O6 and 0.1 ml of Nessler's solution and incubated for 20 min at room temperature. The absorbance of the mixed solution was then analyzed at 420 nm. The absorbance concentration (abs–conc) plots were calibrated against standard NH4Cl solutions with concentrations of 0, 0.5, 1.0, 2.0, 3.0, 4.0, and 5.0 μg ml−1 in 0.1 M KOH (Fig. S2a of the ESI†), and the calibration curve showed y = 0.1419x − 0.0017 (r2 = 0.99996) (Fig. S2b†). In addition, the abs–conc plots of the aliquots from the acid trap solution were calibrated against standard NH4Cl solutions with concentrations of 0, 0.1, 0.2, 0.5, 1.0, and 2.0 μg ml−1 in 0.05 M H2SO4 (Fig. S2c†), and the calibration curve was y = 0.1851x − 0.0005 (r2 = 0.99892) with a good linear relationship (Fig. S2d†). The pH of the acid trap solution was adjusted to ∼13 by the addition of 1 M KOH solution.30Hydrazine detection
The Watt and Chrisp method was used to test for the presence of N2H4, which is a potential by-product of the NRR.31 First, the detection reagent was prepared by adding 5.99 g of p-C9H11NO to 30 ml of HCl and 300 ml of C2H5OH. After collecting 5 ml of electrolyte from the electrolytic cell, 5 ml of the reagent was added and the resulting mixture was allowed to stand for 10 min prior to measurement of the absorbance at 455 nm. The abs–conc plots were calibrated against standard N2H4·H2O solutions with concentrations of 0, 0.2, 0.4, 0.6, 0.8, 1.0 μg ml−1 in 0.1 M KOH (Fig. S3a†), and the fitted curve was y = 0.7401x + 0.1140 (r2 = 0.99984) (Fig. S3b†).15N2 isotope test and NMR analysis
To determine whether ammonia was produced from the N2 feeder gas, the 15N2 isotopic test was conducted and the 15NH4+ was analyzed by proton nuclear magnetic resonance spectrometer (1H NMR; Bruker, Bruker Avance Neo 600) with 600 MHz. After 2 h of chronoamperometry (Ammonia detection section), 20 ml of the electrolyte was acidified to pH 2 by addition to concentrated HCl (20 μl), and then concentrated to 2–3 ml via rotary evaporator. Next, 950 μl of the condensed solution was mixed with 50 μl of DMSO-d6, and 600 μl of the resulting mixture was transferred to an NMR tube.32 For comparison, the 0.1 M KOH solution, the 14NH4Cl standard, the 15NH4Cl standard, and a sample obtained after chronoamperometry using 14N2 as the feeder gas were also analyzed. The spectrum of each sample was obtained using 1024 scans with an acquisition time of 3 s and a relaxation delay of 1.5 s.33Calculation of production rates and faradaic efficiency (FE)
The ammonia production rate (r) and faradaic efficiency (FE) were calculated by using eqn (1) and (2), respectively:
 | (1) |
 | (2) |
![[thin space (1/6-em)]](https://www.rsc.org/images/entities/char_2009.gif) 485C mol−1), Q is the passed charge during electrolysis, and n is the number of electrons needed to produce ammonia (i.e., 3).
485C mol−1), Q is the passed charge during electrolysis, and n is the number of electrons needed to produce ammonia (i.e., 3).
Results and discussion
The physical properties of the NbN catalyst
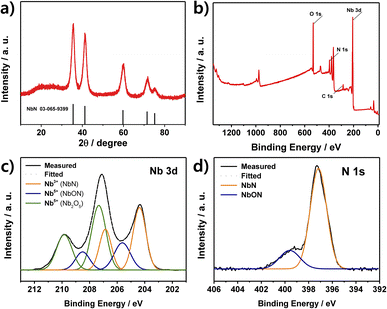
The XRD pattern of the as-prepared NbN catalyst is presented in Fig. 1a, where the observed peaks at 35.5°, 41.2°, 59.7°, 71.4°, and 75.1° are assigned to the respective 111, 200, 220, 311, and 222 planes, corresponding to the reference pattern for cubic NbN (JCPDS 03-065-9399). The broad peak at around 20–30° is due to residual carbon from the urea,34 while peaks due to other potential impurities such as niobium metal or niobium oxides are not observed. The particle size of the catalyst was calculated to be about 5 nm according to the Debye–Scherrer equation. For comparison, the XRD pattern of the NbN without passivation is provided in Fig. S4,† where intense Nb2O5 peaks are observed along with those of NbN, and the unpassivated sample is seen to be oxidized and has developed a white coloration (lower inset). These results demonstrate that passivation can prevent the formation of the crystalline Nb2O5 phase, thereby resulting in the formation of crystalline NbN with an amorphous oxide layer.The surface chemical composition and oxidation state of the NbN catalyst are revealed by the XPS results in Fig. 1b–d. Here, the survey spectrum indicates the presence of the elements Nb, N, C, and O elements (Fig. 1b). Moreover, the high-resolution Nb 3d spectrum can be deconvoluted into three pairs of peaks, corresponding to NbN (204.4 and 206.8 eV), NbON (205.6 and 208.5 eV), and Nb2O5 (207.3 and 209.8 eV), respectively (Fig. 1c).35–38 Here, the oxidized species, NbON and Nb2O5, are due to the passivation step and the inevitable oxidation upon exposure to air. Meanwhile, the N 1s spectrum in Fig. 1d exhibits two deconvoluted peaks at 397.17 and 399.6 eV due to NbN and NbON, respectively.35,39,40
The NbN catalyst is further characterized by the SEM image in Fig. 2a, where the NbN particles form clusters with sizes of ∼50 μm. In addition, the high-resolution SEM image and corresponding elemental mapping images in Fig. 2b reveal almost identical distributions of Nb, N, and O, thereby indicating the generation of NbN with surface oxidized species.
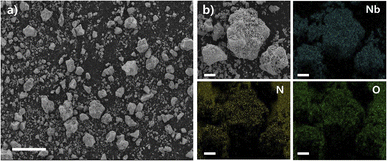 | ||
| Fig. 2 (a) A SEM image of the as-synthesized NbN. (Scale bar = 100 μm) (b) a high-resolution SEM image and the corresponding EDS elemental mapping images of Nb, N and O. (Scale bar = 10 μm). | ||
The electrochemical properties of the NbN on a carbon paper electrode
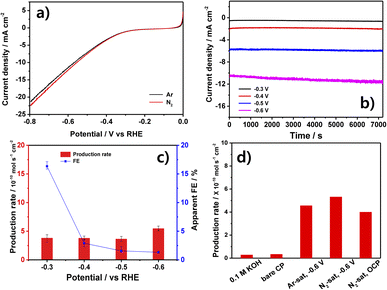
The LSV curves of the NbN/CP electrode in N2- and Ar-saturated 0.1 M KOH solutions are presented in Fig. 3a. Here, the N2-saturated solution (red profile) exhibits a slightly higher current density than does the Ar-saturated solution (black profile) below −0.3 V. Therefore, the chronoamperometry (CA) tests in Fig. 3b were conducted in the range of −0.3 to −0.6 V for 2 h, during which a stable current density was observed at each applied potential, and the current density was seen to increase with the increase in applied potential. Further, the average production rates and apparent FEs calculated after the 2 h CA tests are presented in Fig. 3c, where the apparent FE is seen to decrease gradually from a maximum of 16.33% at −0.3 V to 1.32% at −0.6 V. This is because the competitive HER becomes dominant at the more negative potentials.23,25,34,41 However, the measured production rates are fairly similar at each potential (with a maximum of 5.46 × 10⁻¹⁰ mol s−1 cm−2 at −0.6 V), thus suggesting that the detected NH3 might not have originated from the NRR. Hence, the NH3 production rates under various control conditions are presented in Fig. 3d.Here, near-zero NH3 production rates are observed for both the 0.1 M KOH and the bare CP (without any catalyst), thereby demonstrating that these components do not contribute to the production of ammonia in the presence of NbN/CP. Meanwhile, in the presence of the NbN/CP electrode, the similar NH3 production rate of 5.32 × 10⁻¹⁰ mol s−1 cm−2 is observed in the N2-saturated solution and that of 4.56 × 10⁻¹⁰ mol s−1 cm−2 in the Ar-saturated solution after 2 h at −0.6 V. Moreover, the NbN/CP produces a similarly low amount of ammonia (4.3 × 10⁻¹⁰ mol s−1 cm−2) even in the N2-saturated solution when open circuit potential (OCP) conditions are used. Generally, TMN-based catalysts can generate ammonia via the leaching and subsequent reduction of surface N atoms under N2-saturated solution. This leaves surface N-vacancies that can become occupied by N2 molecules, thereby proceeding the catalytic reaction. Meanwhile, under Ar-saturated solution, ammonia can only be generated via leaching and the surface N-vacancies can't be replenished by N2 molecules, thereby preventing the catalytic reaction. Therefore, a much lower amount of ammonia is produced in Ar-saturated solutions than in N2-saturated solutions.25,42 Hence, the present results strongly suggest that the produced ammonia does not originate from the NRR, and is likely to be the result of catalyst leaching. In the following hydrazine detection experiment in Fig. S5,† no hydrazine was detected, eliminating the possibility for by-product generation. Hence, the non-electrochemical origin of the produced ammonia is further investigated in the following section.
The origin of produced ammonia
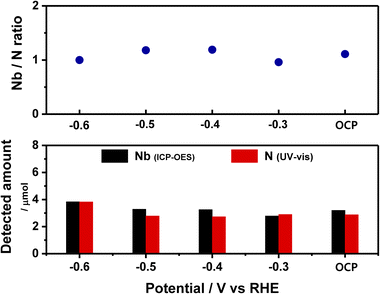
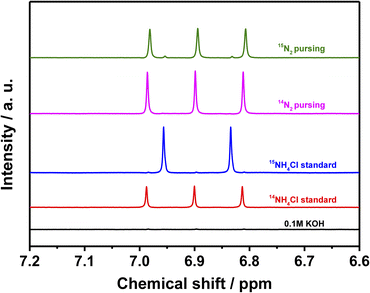
The leaching of the catalyst is revealed by monitoring the Nb concentration via ICP-OES while simultaneously monitoring the concentration of N (in form of NH3) via UV-vis spectroscopy.43 The results are presented in Fig. 4 and summarized in Table S2.† Thus, in the potential range of −0.3 to −0.6 V (including OCP), the measured concentrations of Nb and N are quite similar, and the Nb/N molar ratio is close to 1. These results strongly support the hypothesis that the NbN catalyst leaches into the electrolyte, and that the N of the leached NbN is responsible for the produced ammonia.24To further confirm the origin of the produced ammonia, the 1H NMR spectra of the 0.1 M KOH, the 14NH4Cl and 15NH4Cl standards (each dissolved in 0.1 M KOH), and the electrolyte samples collected after 2 h of chronoamperometry in the presence of the NbN/CP using 14N2 and 15N2 as the feeder gas are presented in Fig. 5. Here, no peaks are detected for the 0.1 M KOH (black line, Fig. 5), thereby indicating that the electrolyte itself does not contribute to the production of ammonia. Meanwhile, the standard 14NH4Cl (red line) and 15NH4Cl (blue line) solutions in 0.1 M KOH exhibit the characteristic triplet peaks of 14NH4+ and doublet peaks of 15NH4+, respectively. Moreover, when 14N2 is employed as the feeder gas in the presence of the catalyst, only the 14NH4+ triplet is observed, as expected (pink line). However, when 15N2 is used as the feeder gas (green line), the 14NH4+ triplet is again observed, along with a negligible 15NH4+ doublet. This confirms that the produced NH3 does not originate from the electrocatalytic reaction.
Based on the above ICP-OES and NMR results, it is concluded that the NbN is leached out to the electrolyte, and that the leached N atoms are reduced to ammonia ions. Therefore, the ammonia produced using NbN/CP is primarily a result of the non-electrocatalytic reaction (the nitride leaching process). Based on the results presented earlier, the FE calculated using eqn (2) as depicted in Fig. 3 lacks significance due to the non-electrochemical nature of our process. FE is traditionally expressed as the ratio of the charge applied to generate the target product to the total charge passed during the reaction. According to this definition, the product should receive electrons through the charge applied. However, given that the production of ammonia is not exclusively a result of the passed charge, our findings are not well-suited for the use of FE, a metric commonly employed in electrochemical reactions. Therefore, we wrote it as ‘apparent FE’, instead of FE (Fig. 3c). In light of this, researchers interested in employing TMN-based catalysts should exercise caution. As we have elucidated earlier, ammonia can be generated through the leaching or decomposition of the catalyst itself. Therefore, it is crucial to determine whether this process qualifies as an electrochemical reaction or a chemical reaction by employing multiple analytical techniques such as ICP-OES and NMR using 15N2 isotope.
Conclusions
Herein, a niobium nitride (NbN) for the electrochemical nitrogen reduction reaction (NRR) was prepared via the urea-glass route by annealing a mixture of niobium(V) chloride (NbCl5) and urea. An electrode consisting of the as-synthesized NbN on carbon paper (NbN/CP) exhibited an NH3 yield of 5.46 × 10⁻¹⁰ mol s−1 cm−2 at −0.6 V, with an apparent faradaic efficiency (FE) of 16.33% at −0.3 V. However, the results of inductively coupled plasma optical emission spectrometry (ICP-OES) indicated leaching of the NbN, with the leached amount of Nb closely matching the amount of N measured by ultraviolet-visible (UV-vis) spectroscopy. Moreover, this conclusion was further supported by the dominant detection of 14NH4+ peaks in proton nuclear magnetic resonance (1H NMR) experiments using 15N2 as the feeder gas. Therefore, it is crucial to thoroughly investigate the origin of NH3 in transition metal nitride (TMN)-based catalysts for the NRR, and the approach used in the present study is expected to provide a good guideline for selecting suitable catalysts for NRR.Conflicts of interest
The authors declare that they have no known competing financial interests or personal relationships that could have appeared to influence the work reported in this paper.Acknowledgements
This study was supported by the National Research Foundation of Korea (NRF) grant funded by the Korea government (Ministry of Education) (2019R1I1A3A01052741) and Quantum Simulator Development Project for Materials Innovation through the NRF funded by the Korea government (Ministry of Science and ICT, MSIT) (No. NRF-2023M3K5A1094813). This work was also supported by the Korea Institute of Energy Technology Evaluation and Planning (KETEP) and the Ministry of Trade, Industry & Energy (MOTIE) of the Republic of Korea (No. 20224000000080). The Korea Basic Science Institute (Chuncheon) provided assistance with the SEM analyses.Notes and references
- G. Qing, R. Ghazfar, S. T. Jackowski, F. Habibzadeh, M. M. Ashtiani, C.-P. Chen, M. R. Smith III and T. W. Hamann, Chem. Rev., 2020, 120, 5437–5516 CrossRef CAS PubMed.
- A. Afif, N. Radenahmad, Q. Cheok, S. Shams, J. H. Kim and A. K. Azad, Renewable Sustainable Energy Rev., 2016, 60, 822–835 CrossRef CAS.
- S. Ghavam, M. Vahdati, I. A. G. Wilson and P. Styring, Front. Energy Res., 2021, 9, 580808 CrossRef.
- B. Yang, W. Ding, H. Zhang and S. Zhang, Energy Environ. Sci., 2021, 14, 672–687 RSC.
- N. Cao and G. Zheng, Nano Res., 2018, 11, 2992–3008 CrossRef CAS.
- X. Guo, H. Du, F. Qu and J. Li, J. Mater. Chem. A, 2019, 7, 3531–3543 RSC.
- C. Smith, A. K. Hill and L. Torrente-Murciano, Energy Environ. Sci., 2020, 13, 331–344 RSC.
- F. Bird, A. Clarke, P. Davies and E. Surkovic, Ammonia: Zero-Carbon Fertiliser, Fuel and Energy Store (Policy Briefing), The Royal Society, London, UK, 2020 Search PubMed.
- J. G. Chen, R. M. Crooks, L. C. Seefeldt, K. L. Bren, R. M. Bullock, M. Y. Darensbourg, P. L. Holland, B. Hoffman, M. J. Janik, A. K. Jones, M. G. Kanatzidis, P. King, K. M. Lancaster, S. V. Lymar, P. Pfromm, W. F. Schneider and R. R. Schrock, Science, 2018, 360, eaar6611 CrossRef PubMed.
- S. Chatterjee, R. K. Parsapur and K.-W. Huang, ACS Energy Lett., 2021, 6, 4390–4394 CrossRef CAS.
- R. F. Service, Science, 2018, 361, 120–123 CrossRef CAS PubMed.
- S. Bouckaert, A. F. Pales, C. McGlade, U. Remme, B. Wanner, L. Varro, D. D'Ambrosio and T. Spencer, Net Zero by 2050: A Roadmap for the Global Energy Sector, International Energy Agency, Paris, France, 2021 Search PubMed.
- L. Hu, Z. Xing and X. Feng, ACS Energy Lett., 2020, 5, 430–436 CrossRef CAS.
- D. Liu, M. Chen, X. Du, H. Ai, K. H. Lo, S. Wang, S. Chen, G. Xing, X. Wang and H. Pan, Adv. Funct. Mater., 2021, 31, 2008983 CrossRef CAS.
- M. Wang, M. A. Khan, I. Mohsin, J. Wicks, A. H. Ip, K. Z. Sumon, C.-T. Dinh, E. H. Sargent, I. D. Gates and M. G. Kibria, Energy Environ. Sci., 2021, 14, 2535–2548 RSC.
- D. R. MacFarlane, P. V. Cherepanov, J. Choi, B. H. R. Suryanto, R. Y. Hodgetts, J. M. Bakker, F. M. Ferrero Vallana and A. N. Simonov, Joule, 2020, 4, 1186–1205 CrossRef CAS.
- S. Y. Park, Y. J. Jang and D. H. Youn, Catalysts, 2023, 13, 639 CrossRef CAS.
- Y. Abghoui, A. L. Garden, V. F. Hlynsson, S. Björgvinsdóttir, H. Ólafsdóttir and E. Skúlason, Phys. Chem. Chem. Phys., 2015, 17, 4909–4918 RSC.
- Y. Abghoui, A. L. Garden, J. G. Howalt, T. Vegge and E. Skúlason, ACS Catal., 2016, 6, 635–646 CrossRef CAS.
- Y. Abghoui and E. Skúlasson, Procedia Comput. Sci., 2015, 51, 1897–1906 CrossRef.
- Y. Abghoui and E. Skúlason, Catal. Today, 2016, 286, 69–77 CrossRef.
- Y. Abghoui and E. Skúlason, J. Phys. Chem. C, 2017, 121, 6141–6151 CrossRef CAS.
- X. Zhang, R.-M. Kong, H. Du, L. Xia and F. Qu, ChemComm, 2018, 54, 5323–5325 RSC.
- H.-L. Du, T. R. Gengenbach, R. Hodgetts, D. R. MacFarlane and A. N. Simonov, ACS Sustain. Chem. Eng., 2019, 7, 6839–6850 CrossRef CAS.
- X. Ren, G. Cui, L. Chen, F. Xie, Q. Wei, Z. Tian and X. Sun, ChemComm, 2018, 54, 8474–8477 RSC.
- B. Hu, M. Hu, L. Seefeldt and T. L. Liu, ACS Energy Lett., 2019, 4, 1053–1054 CrossRef CAS.
- Y. Abghoui and E. Skúlason, Catal. Today, 2017, 286, 78–84 CrossRef CAS.
- D. H. Youn, G. Bae, S. Han, J. Y. Kim, J.-W. Jang, H. Park, S. H. Choi and J. S. Lee, J. Mater. Chem. A, 2013, 1, 8007–8015 RSC.
- Y. Wang, W. Zhou, R. Jia, Y. Yu and B. Zhang, Angew. Chem., Int. Ed., 2020, 59, 5350–5354 CrossRef CAS PubMed.
- X. Yang, J. Nash, J. Anibal, M. Dunwell, S. Kattel, E. Stavitski, K. Attenkofer, J. G. Chen, Y. Yan and B. Xu, J. Am. Chem. Soc., 2018, 140, 13387–13391 CrossRef CAS PubMed.
- P. Song, H. Wang, L. Kang, B. Ran, H. Song and R. Wang, Chem. Commun., 2019, 55, 687–690 RSC.
- H. E. Kim, J. Kim, E. C. Ra, H. Zhang, Y. J. Jang and J. S. Lee, Angew. Chem., Int. Ed., 2022, 61, e202204117 CrossRef CAS PubMed.
- Y. J. Jang and K.-S. Choi, J. Mater. Chem. A, 2020, 8, 13842–13851 RSC.
- W. Guo, Z. Liang, Y. Tang, K. Cai, T. Qiu, Y. Wu, K. Zhang, S. Gao and R. Zou, J. Mater. Chem. A, 2021, 9, 8568–8575 RSC.
- G. Jouve, C. Séverac and S. Cantacuzène, Thin Solid Films, 1996, 287, 146–153 CrossRef CAS.
- B. Kościelska and A. Winiarski, J. Non-Cryst. Solids, 2008, 354, 4349–4353 CrossRef.
- H. Cui, G. Zhu, X. Liu, F. Liu, Y. Xie, C. Yang, T. Lin, H. Gu and F. Huang, Adv. Sci., 2015, 2, 1500126 CrossRef PubMed.
- T. Zhao, S. Shen, X. Liu, Y. Guo, C.-W. Pao, J.-L. Chen and Y. Wang, Catal. Sci. Technol., 2019, 9, 4002–4009 RSC.
- S. Leith, M. Vogel, X. Jiang, E. Seiler and R. Ries, 2019, 947–951.
- J. Alfonso, J. Buitrago, J. Torres, J. Marco and B. Santos, J. Mater. Sci., 2010, 45, 5528–5533 CrossRef CAS.
- L. Zhang, X. Ji, X. Ren, Y. Luo, X. Shi, A. M. Asiri, B. Zheng and X. Sun, ACS Sustain. Chem. Eng., 2018, 6, 9550–9554 CrossRef CAS.
- S. Kang, J. Wang, S. Zhang, C. Zhao, G. Wang, W. Cai and H. Zhang, Electrochem. Commun., 2019, 100, 90–95 CrossRef CAS.
- R. Manjunatha, A. Karajić, H. Teller, K. Nicoara and A. Schechter, ChemCatChem, 2020, 12, 438–443 CrossRef CAS.
Footnote |
| † Electronic supplementary information (ESI) available. See DOI: https://doi.org/10.1039/d3ra06475a |
| This journal is © The Royal Society of Chemistry 2023 |

