 Open Access Article
Study of electrospun nanofibers loaded with Ru(II) phenanthroline complexes as a potential material for use in dye-sensitized solar cells (DSSCs)†
Luis Jesús Villarreal Gómez *ab,
Ana Leticia Iglesias
 *a,
Valentín Miranda Sotoc,
Amelia Olivas Sarabiad,
Ricardo Valdez Castrod,
Eduardo Alberto López Maldonadob,
Mercedes Teresita Oropeza Guzmánc,
Christian Alfonso Romero Sotoac,
Eder German Lizarraga Medinaa and
Jorge Luis Vazquez Arced
aFacultad de Ciencias de la Ingeniería y Tecnología, Universidad Autónoma de Baja California, Unidad Valle de las Palmas, Tijuana, Baja California, Mexico. E-mail: luis.villarreal@uabc.edu.mx; aiglesias@uabc.edu.mx
bFacultad de Ciencias Químicas e Ingeniería, Universidad Autónoma de Baja California, Unidad Otay, Tijuana, Baja California, Mexico
cCentro de Graduados e Investigación en Química, Instituto Tecnológico de Tijuana, Tijuana, Baja California, Mexico
dCentro de Nanociencias y Nanotecnología, Universidad Nacional Autónoma de México, Ensenada, Baja California, Mexico
First published on 12th December 2023
Abstract
Dye-sensitized solar cells (DSSCs) are an increasingly attractive alternative energy source because of their low cost. Therefore, researchers have intensified efforts over the past decade to increase their energy conversion efficiency by employing new materials in each DSSC component. The present research focuses on synthesizing electrospun nanofibers as a potential new material as a counter electrode in DSSCs. Two Ru(II) half sandwich 1,10 phenanthroline (phen) Ru-1 and 5-amino- phen Ru-2 complexes were prepared for its functionalization. As a deposition medium, poly(caprolactone) (PCL) dissolved in chloroform was used. Different Ru(II) complex concentrations were made at 0.1% wt., 0.5% wt., and 1% wt. Thermal characterization studies using differential scanning calorimetry (DSC) and thermogravimetric analysis (TGA) were conducted to evaluate the behavior and weight loss of the samples with temperature variations. Fourier transform infrared spectroscopy (FTIR) measurements were taken to observe the bond interaction of the ruthenium complexes and the PCL. Finally, scanning electron microscopy (SEM) was used to structurally and morphologically evaluate the fiber distribution and porosity. These fibers have a homogeneous morphology, without bulbs, but with evident solid inlays on the surface, with fibers between ∼0.58 to 2.47 μm and percentages of porosity ∼45%. TGA and DSC thermograms show minor temperature variations that demonstrate the incorporation of the Ru(II) complexes into the fiber. Furthermore, the melting and degradation temperature of the fibers is suitable for use in a DSSC approach. The incorporation of the ruthenium compounds into PCL fibers, along with the addition of the NH2 group into complex Ru-2, resulted in a higher current density for both anodic and cathodic peaks in Cyclic Voltammetry (CV). It is noteworthy that from I–V curves, PCL-Ru2 1% fibers demonstrated a conductivity of 0.461 μS cm−1, which is comparable to other PCL fibers carrying a higher metal load. Future studies will delve into the mechanical properties of these fibers to highlight their potential for application in this field.
1 Introduction
Dye-sensitized solar cells (DSSCs) are photovoltaic cells whose main characteristic is to mimic plants in the capture of sunlight, and their objective is to simulate artificial photosynthesis, absorbing solar energy that is later transformed into electrical power.1Conventional DSSCs are comprised of four main parts: photo-anode, sensitizing dye layer, electrolyte, and counter-electrode (Fig. 1).1–4 Due to their low cost and ability to operate under non-standard conditions, they are ideal for locations where environmental conditions vary widely. DSSCs are efficient in dim and diffuse light (dusk, cloudy days, or even indoors), making them suitable for various applications such as panels, tiles, facades, solar roofs, mobile electronic devices, and intelligent sensors in the automotive and nautical industries.5
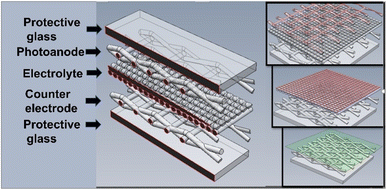 | ||
| Fig. 1 Assembly of dye-sensitized solar cells (DSSC).9,10 | ||
One of the drawbacks of DSSCs is their low efficiency despite its multiple advantages. Recently, many studies have investigated strategies to increase their efficiency, including developing electrolytic components such as photo-anodes, counter-electrodes, and electrolytes.6
The electrospinning technique is used to fabricate fibers that create three-dimensional fibrous scaffolds with important applications, particularly in medicine and engineering.7,8 In this technology, a conductive polymer solution is injected, electrically charged, and directed towards a collector against a ground-connected electrode, closing the circuit. The solution passes through a field of electrostatic forces ranging from 5 to 35 kV, producing a stretching effect that forms fibers from a few nanometers to micrometers.6,9,11,12
Due to their excellent performance, Pt-based counter-electrodes are the most widely used in DSSCs. However, the methods for their manufacture are based on thermal deposition and vacuum bombardment. However, such techniques require high temperatures and complex installations.13 Therefore, alternatives to these increased operating costs are required in addition to the cost of Pt compounds.
Several studies have proposed the manufacture of the DSSC's counter-electrode (CE) using the electrospinning technique.13–25 The CE is typically made of conducting materials that facilitate the regeneration of the photosensitizer, so it plays a crucial role in DSSC because it performs as the catalyst by reducing the oxidized form of the photosensitizer, allowing it to be regenerated and participate in subsequent light absorption and electron transfer processes, thereby completing the DSSC circuit.16
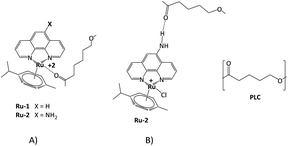
Transition metals have been used to manufacture electrospun fibers as CE in DSSCs. Bimetallic systems, such as Ni–Co,20,24 Fe–Ni,21 and Co–Ti,23 have been incorporated into carbon nanofibers (CNFs) for this purpose. Additionally, nanofibers with Pt nanoparticles,15 Ni,25 and Zr–O2 (ref. 26) have been reported. Although ruthenium(II) complexes have traditionally been used as photosensitizers in DSSCs,27,28 they are also promising for producing electrospun nanofibers as the CE due to their high electrical conductivity and catalytic properties. In a recent study,29 researchers used Ru(II) nanofibers instead of the usual Pt counter-electrode for DSSCs. The nanofibers were created through electrospinning, post-calcination, and hydrogen reduction, resulting in improved photovoltaic performance.29 This is attributed to their high electrical conductivity and unique network structure, which outperforms the traditional Pt CE. In this research, a novel electrospun fibrous scaffold system was created for potential use as a counter electrode in DSSCs (Fig. 2). Poly(caprolactone) (PCL) nanofibers were utilized and loaded with two different types of Ru(II) complexes ([RuCl (p-cymene) (phen)] Cl) Ru-1 and ([RuCl (p-cymene) (5-amino-phen] Cl) Ru-2. We predict that introducing the –NH2 group in the Ru-2 complex will influence the structure and conductivity of the nanofibers. To the best of our knowledge, these Ru(II) complexes have not been previously used as functionalizing agents of electrospun nanofibers as a material for this potential application in DSSCs.
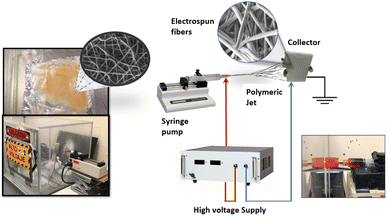 | ||
| Fig. 2 Assembly of electrospinning device, counter-electrode with electrospinning nanofibers in DSSC.5,6,9,10 | ||
2 Materials and methods
2.1 Materials
Poly (ε-caprolactone) (PCL) (MW: 80![[thin space (1/6-em)]](https://www.rsc.org/images/entities/char_2009.gif) 000 Sigma Aldrich), solvents such as chloroform, methanol, and hexane are analytical grade. Commercially available reagents 1,10 phenanthroline and 5-amino-1,10-phenanthroline were obtained from Aldrich Chemical and used as received.
000 Sigma Aldrich), solvents such as chloroform, methanol, and hexane are analytical grade. Commercially available reagents 1,10 phenanthroline and 5-amino-1,10-phenanthroline were obtained from Aldrich Chemical and used as received.
2.2 Experimental
Ruthenium(II) complexes synthesis was carried out in an argon-filled Glove Box or using standard Schlenk techniques. [Ru(p-cymene] Cl2]2 was prepared using published procedures.30 NMR spectra were recorded at 400 MHz with Bruker Avance III spectrometer at 30 °C unless otherwise specified. 1H and 13C NMR chemical shifts are reported in ppm referenced to residual solvent resonances (1H NMR: 7.24 for CHCl3 in CDCl3, 2.50 for DMSO d6.) 13C {1H} NMR: 77.23, 39.52 respectively). Coupling constants J are given in Hertz (Hz). IR spectra were recorded on a PerkinElmer FT-IR 1605 spectrophotometer (ATR mode). Spectra were collected at 20 °C, in the 4000–500 cm−1 range. Four sweeps were performed at a resolution of 16 cm−1. High-Resolution Mass Spectrometry (HRMS) data were obtained in a micrOTOF-Q III MS instrument with electrospray ionization using sodium formate as a calibrant.2.3 Synthesis of complex Ru-1 [RuCl(p-cymene)(phen)]Cl
To a solution of 1,10-phenanthroline (phen) (0.035 g, 0.1942 mmol) in methanol, [RuCl2(p-cymene)]2 (0.059 g, 0.0971 mmol) was added and stirred at room temperature for 3 hours. The yellow–red solution was evaporated under vacuum, washed (3 × 10 mL) with hexane, and dried under vacuum to afford a yellow solid. Yield: (0.076 g, 80.5%). 1H NMR (400 MHz, DMSO d6): δ 0.90 (d, J = 6.8 Hz, 6H –CH(CH3)2), 2.17 (s, 3H, CH3-p-Cymene), 2.62 (sept, J = 6.8 Hz, 1H, –CH(CH3)2), 6.14 (d, J = 6.1 Hz, 2H, Ar-p-cymene), 6.38 (d, J = 6.2 Hz, 2H, Ar-p-cymene), 8.16 (dd, J = 8.16, 5.24 Hz, 2H), 8.3 (s, 2H), 8.94 (d, J = 7.72 Hz, 2H), 9.99 (d, J = 5 Hz, 2H) ppm. 13C {1H} (101 MHz, DMSO d6) δ: 18.1 (CH3-p-Cymene), 21.6 (-CH(CH3)2), 30.3 (–CH(CH3)2), 83.7 (Ar-p-cymene), 85.9 (Ar-p-cymene), 102.0 (C-iPr, p-cymene), 103.9 (C–CH3, p-cymene), 126.3, 127.4, 129.0, 138.7, 145.0, 156.0 (CH![[double bond, length as m-dash]](https://www.rsc.org/images/entities/char_e001.gif) N) ppm. UV-Vis (DMSO, 5 × 10 −4 M), λ 302 nm, ε = 25
N) ppm. UV-Vis (DMSO, 5 × 10 −4 M), λ 302 nm, ε = 25![[thin space (1/6-em)]](https://www.rsc.org/images/entities/char_2009.gif) 150 L cm−1 mol−1, λ 317 nm, ε = 17
150 L cm−1 mol−1, λ 317 nm, ε = 17![[thin space (1/6-em)]](https://www.rsc.org/images/entities/char_2009.gif) 080 L cm−1 mol−1. HRMS (ESI-TOF) m/z: [M
080 L cm−1 mol−1. HRMS (ESI-TOF) m/z: [M![[thin space (1/6-em)]](https://www.rsc.org/images/entities/char_2009.gif) −
−![[thin space (1/6-em)]](https://www.rsc.org/images/entities/char_2009.gif) Cl]+ calculated for C22H22ClN2Ru 451.0510; found: 451.0502.
Cl]+ calculated for C22H22ClN2Ru 451.0510; found: 451.0502.
2.4 Ru-2 [RuCl (p-cymene)(5-amino-phen)]Cl
To a solution of 5-amino-1,10-phenanthroline (5-amino-phen) (0.060 g, 0.307 mmol) in methanol, [RuCl2(p-cymene)]2 (0.094 gr, 0.1536 mmol) was added, and stirred for 3 hours; the orange–red solution was evaporated in vacuo, washed (3 × 10 mL) with hexane, to afford a red solid. Yield: (0.127 g, 82.2%) 1H RMN (400 MHz, DMSO d6): δ 0.88 (dd, J = 4.9 Hz, 6H, –CH(CH3)2), 2.16 (s, 3H, CH3-p-Cymene), 2.57 (sept, J = 6.8 Hz, 1H, –CH(CH3)2), 6.05 (dd, J = 10.9, 6.6 Hz, 2H, Ar-p-cymene), 6.27 (dd, J = 6.5, 0.8 Hz, 2H, Ar-p-cymene), 6.96 (s, 1H), 7.00 (s, 1H), 7.81 (dd, J = 8.3, 5.1 Hz, 1H), 8.09 (dd, J = 8.4, 5.2 Hz, 1H), 8.41 (dd, J = 8.3, 0.7 Hz, 1H), 9.12 (d, J = 8 Hz, 1H), 9.43 (dd, J = 5.1, 0.9 Hz, 1H), 9.88 (d, J = 4.5 Hz, 1H) ppm. 13C {1H} (DMSO d6, 101 MHz) δ: 18.1 (CH3-p-Cymene), 21.5 (–CH(CH3)2), 30.3(–CH(CH3)2), 83.5 (Ar-p-cymene), 85.8 (Ar-p-cymene), 102.6 (C-iPr, p-cymene), 103.4 (C–CH3, p-cymene), 123.0, 124.6, 125.8, 132.1, 133.9, 134.7, 138.9, 145.9, 150.2 (CH![[double bond, length as m-dash]](https://www.rsc.org/images/entities/char_e001.gif) N), 155.6 (CH
N), 155.6 (CH![[double bond, length as m-dash]](https://www.rsc.org/images/entities/char_e001.gif) N) ppm UV-Vis (DMSO, 5 × 10⁻⁴ M), λ 270 nm, ε = 12
N) ppm UV-Vis (DMSO, 5 × 10⁻⁴ M), λ 270 nm, ε = 12![[thin space (1/6-em)]](https://www.rsc.org/images/entities/char_2009.gif) 690 L cm−1 mol−1, λ 297 nm, ε = 12
690 L cm−1 mol−1, λ 297 nm, ε = 12![[thin space (1/6-em)]](https://www.rsc.org/images/entities/char_2009.gif) 890 L cm−1 mol−1, λ 344 nm, ε = 4840 L cm−1 mol−1, λ 437 nm, ε = 1680 L cm−1 mol−1. HRMS (ESI-TOF) m/z: [M − Cl] +. Calculated for C22H23ClN3Ru [M]+ 466.0621; found: 466.0625.
890 L cm−1 mol−1, λ 344 nm, ε = 4840 L cm−1 mol−1, λ 437 nm, ε = 1680 L cm−1 mol−1. HRMS (ESI-TOF) m/z: [M − Cl] +. Calculated for C22H23ClN3Ru [M]+ 466.0621; found: 466.0625.
2.5 Preparation of polymeric solution (PCL)
A 10% (v/w) solution of PCL in chloroform was used. The preparation was done at room temperature (∼25 °C) and humidity of ∼33%, under constant stirring (200 rpm) for 24 h until a homogeneous state.2.6 Electrospinning
To a 10% (v/w) chloroform solution of PCL (vide supra), the Ru(II) complexes (Ru-1 and Ru-2) were added according to the concentrations in Table 1 and stirred at 850 rpm for 1 hour until a homogeneous mixture was obtained. To electrospun the samples (at room temperature and relative humidity of 32–36%), 1.5 mL of the solutions were poured into a 5 mL syringe at a distance of 10 cm from the needle to the collector. A voltage of 20 kV was applied using a power source, with a constant injection flow of 0.5 mL min−1, using a needle 22 G × 40 mm, and an exposition time of 200 min (Table 1).| Samples | Ru complex concentration (wt%) |
|---|---|
| PCL/Ru-1 0.1% | 0.1 |
| PCL/Ru-1 1.0% | 1.0 |
| PCL/Ru-2 0.1% | 0.1 |
| PCL/Ru-2 0.5% | 0.5 |
| PCL/Ru-2 1.0% | 1.0 |
2.7 Scanning electron microscopy (SEM)
The morphology and diameter of the polymer fibers were determined by SEM. A small section of the fibrous material was placed in a JEOL JSM 7600F field emission microscope. The samples were prepared in advance, randomly cutting about 5 × 5 mm pieces and placing them on an aluminum base with magnetic tape to fix the sample on the surface. This system was coated by sputtering with gold to prevent surface charging effects, and a 20 kV accelerated voltage was used to obtain the images.The diameter of the fibers was calculated using the program ImageJ in its option MultiMeasure. Thirty measurements were made of at least two different images of each sample; then, the average and standard deviation were calculated using the option summarize. Similarly, the porosity of the samples was calculated with the same program under its threshold option. The data obtained was plotted using Minitab17.
2.8 Fourier transform infrared spectroscopy (FTIR)
ATR-Thermo Scientific Nicolet 6700 was used to determine the infrared spectra by the Fourier transform, measuring the attenuated total reflectance in the 4000–400 cm−1 range. The spectra found were analyzed with OMNIC software.2.9 Thermal behavior analysis (TGA and DSC)
This analysis determined the glass transition temperature (Tm) and the degradation temperature (Td). The samples were evaluated on a TA Instruments DSC Q5000 equipment in unsealed aluminum trays, programmed to heat from room temperature (±20 °C) to 300 °C at a heat rate of 10 °C min−1 in a nitrogen atmosphere. The thermogram was analyzed using TA Universal Analysis software.
2.10 Cyclic voltammetry (CV)
The CV technique provided information on electrochemical reactions and the redox potential of electroactive species in the fibers, using a reference electrode of silver/silver chloride (Ag/AgCl) with a potential +0.25 V with respect to the standard hydrogen electrode (ENH) 25 °C. As a counter-electrode, copper was used, and the electrolytic solution was a 0.1 M. acetonitrile HPLC (CH3CN) and tetrafluoroborate tetrabutylammonium (C16H36BF4N). Measurements were made by integrating nanofiber samples into a gold working electrode.2.11 Current–voltage (IV) curves
Current–voltage (IV) curves were obtained inside a Faraday cage at room temperature using a Source Measure Unit Keithley SourceMeter 2450. The sample contacts were prepared with silver paint (PELCO® Colloidal Silver Paste Product No. 16032). The current was measured while applying a −10 to 10 V sweep. The following equation was used to obtain the conductivity σ:
 | (1) |
3 Results and discussions
3.1 Synthesis and characterization of Ru-1 and Ru-2 complexes
Compounds Ru-1 and Ru-2 were synthesized according to eqn (2) and fully characterized by 1H NMR,13 C NMR, HRMS, UV-Vis, and FT-IR. Peak assignments were done with 2D NMR Techniques COSY, HSQC, and HMBC (Electronic Supplementary Information, ESI†). Compounds are cationic with an octahedral geometry around the metal center, as expected for analogous p-cymene Ru(II) complexes.31 Compounds are very soluble in most organic solvents.
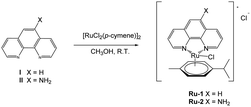 | (2) |
3.2 Nuclear magnetic resonance (NMR)
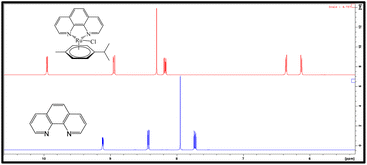
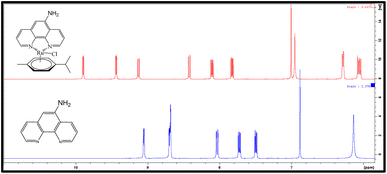
As expected, the 1H NMR spectra of both complexes are very similar (Fig. 3 and 4); the principal difference is the number of signals, owing to the difference in the symmetry of the free ligands, which leads in the case of Ru-2, to a chiral metal center. In general, the signals suffer a downfield shift upon coordination compared with the free phenanthroline ligands (Fig. 3 and 4). The multiplicity of the p-cymene ring is also a striking difference; for Ru-1, the signals retain an A2B2 system (as observed in the starting product; Fig. S1†), but for Ru-2, an AA’B2 system can be observed due to non-equivalent-isopropyl protons owing to the chiral environment. Of interest, in Ru-2, the amine peak (NH2) moves Δ 0.85 ppm to low field, from 6.14 ppm in the free ligand to 6.98 ppm, due to coordination to the metallic center (Fig. 4).In 13C NMR (Fig. S2†), for Ru-1, the most characteristic signals are those corresponding to (C![[double bond, length as m-dash]](https://www.rsc.org/images/entities/char_e001.gif) N)- at 156 ppm, the peaks assigned to the –CH (CH3)2 of the p-cymene ring at 21.6 and 30.3 ppm, and –CH3 at 18.1 ppm. The signals for the aromatic protons at 83.5 ppm and 85.8 ppm and the aromatic ipso carbons of the p-cymene at 103.97 and 102.68 (Fig. S2†). The ESI† includes the complete assignment of signals for the Ru-1 complex (Fig. S2 and S3†), using two-dimensional techniques, COSY (Fig. S4–S6†), HSQC (Fig. S7–S9†), and HMBC (Fig. S10–S12†).
N)- at 156 ppm, the peaks assigned to the –CH (CH3)2 of the p-cymene ring at 21.6 and 30.3 ppm, and –CH3 at 18.1 ppm. The signals for the aromatic protons at 83.5 ppm and 85.8 ppm and the aromatic ipso carbons of the p-cymene at 103.97 and 102.68 (Fig. S2†). The ESI† includes the complete assignment of signals for the Ru-1 complex (Fig. S2 and S3†), using two-dimensional techniques, COSY (Fig. S4–S6†), HSQC (Fig. S7–S9†), and HMBC (Fig. S10–S12†).
In 13C NMR (Fig. S15, ESI†), the chiral nature of the complex Ru-2 is corroborated. Two signals corresponding to the inequivalent (C![[double bond, length as m-dash]](https://www.rsc.org/images/entities/char_e001.gif) N) of the 5-amino-1,10-phenanthroline are seen at 155.6 ppm and 150.2 ppm, and four signals corresponding to the aromatic carbons of the p-cymene fragment are observed between 83.5 ppm and 86.11 ppm. The isopropyl groups are diasterotopic, with two signals at 21.5 and 21.54 ppm. The ESI† includes the complete assignment of the signals of the Ru-2 complex (Fig. S15 and S16†) using two-dimensional techniques, COSY (Fig. S17 and S18†), HSQC (Fig. S19 and S20†), and HMBC (Fig. S21 and S22†).
N) of the 5-amino-1,10-phenanthroline are seen at 155.6 ppm and 150.2 ppm, and four signals corresponding to the aromatic carbons of the p-cymene fragment are observed between 83.5 ppm and 86.11 ppm. The isopropyl groups are diasterotopic, with two signals at 21.5 and 21.54 ppm. The ESI† includes the complete assignment of the signals of the Ru-2 complex (Fig. S15 and S16†) using two-dimensional techniques, COSY (Fig. S17 and S18†), HSQC (Fig. S19 and S20†), and HMBC (Fig. S21 and S22†).
3.3 UV-vis spectroscopy
The UV-Vis spectra of the Ru(II) complexes can be seen in Fig. 5; for the free phenanthroline ligand, a single peak can be observed at 271 nm (Fig. 5A), attributed to the π–π*-type transitions of the aromatic ring, for complex Ru-1 this band undergoes a bathochromic shift at 302 nm, upon complex formation.32 Also, a new band at 317 nm for Ru-1 can be seen, which can be attributed to the d–d* type transitions for the metal. Moreover, the complex is hyperchromic compared to the free ligand.33,34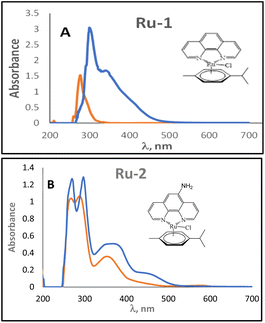 | ||
| Fig. 5 (A) Comparison of the UV-vis spectrum for Ru-1 complex (blue) and free ligand (red) in DMSO. (B) UV-vis spectrum comparison for complex Ru-2 (blue) and free ligand (red) in DMSO. | ||
The UV-vis spectrum of the 5-amino-phenanthroline ligand (Fig. 5B) shows peaks at 247 nm, 275 nm, and 328 nm, attributed to the n–π*, π–π* aromatic transitions of the aromatic ring and to the presence of auxochrome NH2 in phenanthroline; for Ru-2 these bands suffer a bathochromic shift to 270 nm, 297 nm, and 344 nm when the complex is formed. Fig. 5B shows a new band at 437 nm, which can be attributed to the d–d* type transitions for the metal. As observed earlier, the complex is hyperchromic compared to the free ligand.32–34
3.4 IR spectroscopy
The characteristic ν(N![[double bond, length as m-dash]](https://www.rsc.org/images/entities/char_e001.gif) C) bands for phenanthroline (phen) are found at 1691 and 1626 cm−1 (Fig. S25†), and for 5-amine-phenanthroline (5-phen) at 1634 and 1612 cm−1 (Fig. S26†); additional bands between 1592 and 1423 cm−1 can be attributed to the stretching bands of the aromatic rings; for 5-amine-phenanthroline (5-phen), bands at 3418 cm−1 and 3315 cm−1 corresponding to the symmetrical and asymmetric stretching frequencies of the amino group NH2 can be observed. These vibrations move 4 cm−1 for phen (Fig. S27†) and 9 cm−1 for 5-phen (Fig. S28†) upon coordination to the metal center, as seen in similar phenanthroline complexes.35–37
C) bands for phenanthroline (phen) are found at 1691 and 1626 cm−1 (Fig. S25†), and for 5-amine-phenanthroline (5-phen) at 1634 and 1612 cm−1 (Fig. S26†); additional bands between 1592 and 1423 cm−1 can be attributed to the stretching bands of the aromatic rings; for 5-amine-phenanthroline (5-phen), bands at 3418 cm−1 and 3315 cm−1 corresponding to the symmetrical and asymmetric stretching frequencies of the amino group NH2 can be observed. These vibrations move 4 cm−1 for phen (Fig. S27†) and 9 cm−1 for 5-phen (Fig. S28†) upon coordination to the metal center, as seen in similar phenanthroline complexes.35–37
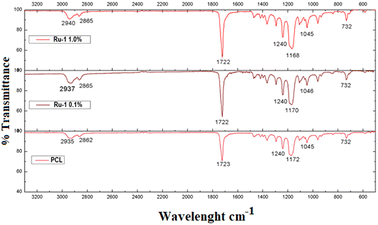
Fig. 6 compares the different FTIR spectra of the PCL and PCL/Ru-1 fibers. An intense signal between 1722 and 1723 cm−1 can be found in all the samples, characteristic of the carbonyl group of PCL,38–42 ν(CH) bands between 2935 to 2940 cm−1, which corresponds to the alkyl groups, can also be observed. In addition, multiple signals can be observed between 1168 and 1172 cm−1, corresponding to the alkyl ester group with symmetrical and asymmetric stretching. Finally, the small signal of 728 cm−1 corresponds to methyl chains (CH2), part of the basic polymer skeleton. However, the latter does not provide evidence of the presence of the Ru-1 complex since the ν (N![[double bond, length as m-dash]](https://www.rsc.org/images/entities/char_e001.gif) C) bands at 1632 and 1511 cm−1 (Fig. S27†), corresponding to the complex, are not observed. The absence of these signals may be due to the low proportion of the complex in the fibers (Table 1).
C) bands at 1632 and 1511 cm−1 (Fig. S27†), corresponding to the complex, are not observed. The absence of these signals may be due to the low proportion of the complex in the fibers (Table 1).
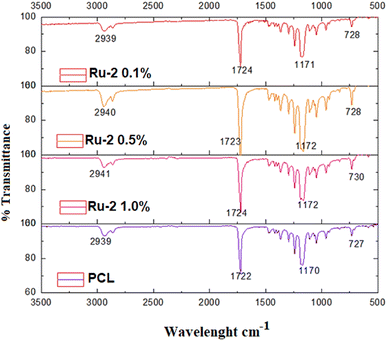
In the case of the PCL/Ru-2 fibers (Fig. 7), the signal for the amine group (NH2) corresponding to the Ru-2 complex is absent in the polymer fibers (Fig. S28†). As observed (vide supra), the signals for the PCL/Ru-2 samples mainly correspond to the PCL control. The signals between 2939 to 2941 cm−1 corresponding to the vibration of the alkyl groups are a little more pronounced in the fibers with a higher concentration of Ru(II) complex (0.5 and 1.0%); compared to the PCL control spectrum, these bands generally move slightly to higher wave numbers (2940 2941 cm−1 vs. 2935–2939 cm−1).
These signals, as before, do not provide evidence of the presence of the Ru-2 complex, possibly due to the low proportion of the complex in the fibers (Table 1).
Various factors influence the formation of PCL fibers in electrospinning, including solvent composition, electrolyte parameters, and polymer concentration. Preventing bulb formation is crucial for consistent, high-quality fiber production. Chloroform is the favoured solvent for electrospinning PCL because it produces uniform fibers without bulbs. Other solvents, such as formic acid and acetic acid, were also studied, including binary solvents, such as formic acid/ethanol, formic acid/chloroform, and acetic acid/chloroform. Still, they resulted in the formation of bulbs.43
A study conducted by the Enis group44 in 2016 revealed that a combination of formic acid and chloroform resulted in fibers of around 500 nm with bulbs. However, further research discovered that a binary formic acid and acetic acid solvent produced fibers at the nanometric scale more effectively. Our previous study found that a concentration of 10% chloroform was optimal for creating polymeric fibers.45 We also examined various electrospinning parameters and concluded that a fixed power of 20 kV and a constant flow rate of 0.450 mL h−1 using a 22 G × 40 mm needle at a distance of 10 cm from the collector led to successful fiber formation.46
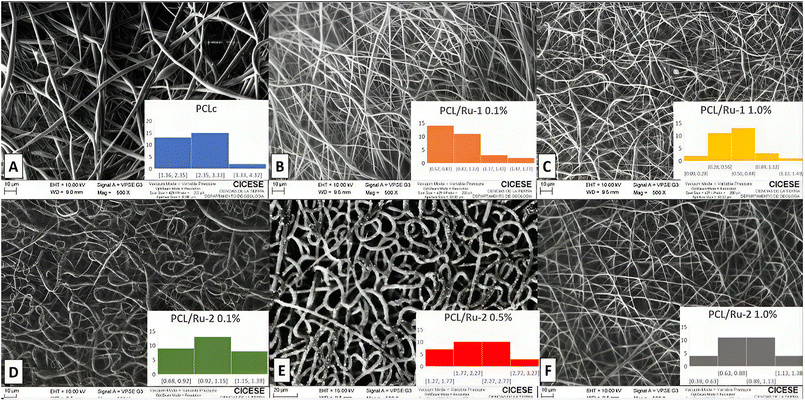
Fig. 8 shows the morphology and fiber diameter distribution of the PCLc, PCL/Ru-1, and PCL-Ru-2 fibers from this study. PCL control fibers (PCLc) are randomly distributed in the collector (Fig. 8A). While not uniformly sized, there are no prominent bulbous formations; the fibers generally display varying thicknesses, with some areas thicker than others. Some areas may show signs of swelling; although bulbs exist, they aren't numerous. Additionally, very thin and extensive fibers are present, resulting in a diversity of diameters. Overall, the structure forms a three-dimensional scaffold with fibers arranged haphazardly. Upon closer examination using SEM (Fig. 8A), the surface of the PCL fibers appears smooth and continuous, displaying some irregularities but lacking noticeable porosity. The average fiber diameter for the PCLc sample is 2.47 ± 0.68 μm with a higher distribution between 2.35–3.33 μm, as shown in Table 2 and Fig. 8A. A random arrangement in the collector is observed for all ruthenium fibers (Fig. 8B–F).
| Sample | Average fiber diameter (![[x with combining macron]](https://www.rsc.org/images/entities/i_char_0078_0304.gif) ± σ) (μm) ± σ) (μm) |
Percentage of porosity (%) | Higher fiber diameter distribution (μm) |
|---|---|---|---|
a ![[x with combining macron]](https://www.rsc.org/images/entities/i_char_0078_0304.gif) : Average; σ: standard deviation. : Average; σ: standard deviation. |
|||
| PCLc | 2.47 ± 0.68 | 57.12 | 2.35–3.33 |
| PCL/Ru-1 0.1% | 0.92 ± 0.27 | 26.47 | 0.57–0.87 |
| PCL/Ru-1 1.0% | 0.58 ± 0.24 | 26.01 | 0.56–0.84 |
| PCL/Ru-2 0.1% | 1.05 ± 0.17 | 39.45 | 0.92–1.15 |
| PCL/Ru-2 0.5% | 2.14 ± 0.44 | 40.96 | 1.77–2.27 |
| PCL/Ru-2 1.0% | 0.87 ± 0.23 | 48.43 | 0.63–0.88 |
Table 2 summarizes the average diameters and porosity percentages of each sample. For most of the PCL/Ru-1 0.1%, PCL/Ru-1 1.0%, PCL/Ru-2 0.1%, and PCL/Ru-2 1.0%, a decrease in thickness can be observed so fibers no longer appear swollen. A three-dimensional structure was obtained, which integrates homogeneous thin fibers. There is no presence of bulbs or artifacts in the scaffolding. The average diameter of the PCL/Ru-1 0.1% sample fibers is 0.92 ± 0.27 μm, with a higher distribution between 0.57–0.87 μm, which is thinner than the PCL control fibers. In general, the average diameter of all the fibers is thinner than the PCL control, except for PCL/Ru-2 0.5% fibers with a diameter of 2.14 ± 0.44 μm, mainly concentrated between 1.77–2.27 μm. Nevertheless, the fiber diameter is thicker for Ru-2 than for Ru-1 complex fibers, potentially attributed to the presence of the amine group within the Ru-2 complex. Despite this difference, the overall structure maintains a three-dimensional arrangement that combines slender and broader fibers without any observable presence of protrusions or abnormalities within the scaffold. The observed residues (Fig. 8E) are most likely the Ru-2 complex not embedded in the fiber, thus remaining on the surface of the electrospun fibers, giving the thickest diameter of all the fibers (Table 2). The latter is a convenient feature for this work, whose objective is that the complex can be exposed to photons and thus capture them and promote the transfer of electrons in said 3D network.
As mentioned earlier, the thickest fibers were PCL/Ru-2 0.5%, with an average diameter of 2.14 ± 0.44 μm (higher distribution 1.77–2.27 μm), and the thinnest fibers were PCL/Ru-1 0.1%, with a diameter of 0.58 ± 0.24 μm (higher distribution 0.56–0.84 μm) (Table 2). The PCLc samples have the highest percentage of porosity with 57.12%, while the lowest percentage corresponds to PCL/Ru-1 1% and PCL/Ru-1 0.1% fibers with 26.01% and 26.47%, respectively. The rest of the samples are in a range of ∼45%. The fiber diameter and % of porosity does not have a linear relationship. Albeit, in general, for Ru-2 fibers, the % of porosity increases as the concentration of Ru-2 complex increases in the fiber. Furthermore, the % of porosity for Ru-2 > Ru-1 nanofibers. The presence of the amine group is possibly responsible for the increase in fiber diameter (thickness) and the percentage of porosity.
For DSSC applications, various fiber diameters have been described. For instance, a study reported carbon fibers with a diameter of 230 μm, which are much thicker than the fibers discussed in this research and were suggested to form part of the photoanode.50 Conversely, thinner poly (methyl methacrylate) (PMMA) fibers have also been reported for CSST solar cells, which have an average diameter of 350 nm.51
| Sample | Initial degradation | Critical degradation |
|---|---|---|
| PCL | 374 °C, 90% | 435 °C, 11% |
| Ru-1 1% | 344 °C, 90% | 390 °C, 14% |
| Ru-1 0.1% | 347 °C, 94% | 416 °C, 9% |
| PCL | 373 °C, 92% | 435 °C, 11% |
| Ru-2 1% | 361 °C, 81% | 416 °C, 17% |
| Ru-2 0.5% | 353 °C, 83% | 422 °C, 2% |
| Ru-2 0.1% | 365 °C, 85% | 424 °C, 0.01% |
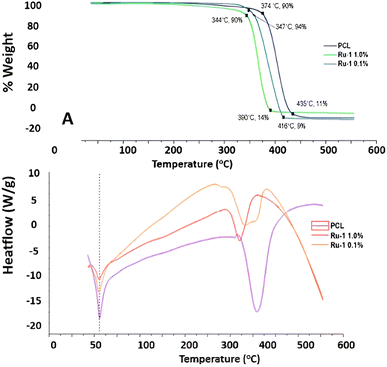 | ||
| Fig. 9 (A) TGA thermograph of PCL and PCL/Ru-1 fibers, (B) DSC thermograph of PCL and PCL/Ru-1 fibers. | ||
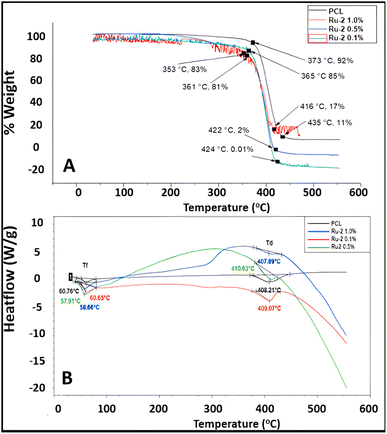 | ||
| Fig. 10 (A) TGA thermograph of PCL and PCL/Ru-2 fibers, (B) DSC thermograph of PCL and PCL/Ru-2 fibers. | ||
Furthermore, PCL fibers lost most of their mass at 435 °C, while PCL/Ru-1 0.1% fibers lost mass at 416 °C, and PCL/Ru-1 1.0% sample lost the total mass at 390 °C (Fig. 9A). PCL/Ru-2 0.1% fibers lost most of their mass at 424 °C, PCL/Ru-2 0.5% scaffolding at 422 °C, and PCL/Ru-2, 1.0% samples lost their total mass at 416 °C (Fig. 10A). These temperatures correspond to the maximum temperature (Tmax). Tmax for PCL is reported to be 412.2 °C,52 which is close to the results obtained in this study (Fig. 9A and 10A).
In the case of the results obtained in differential scanning calorimetry (DSC), it should be considered that poly (caprolactone) is a semi-crystalline polymer with a regular structure, with a reported melting temperature (Tm) between 59 °C and 64 °C. Its glass transition temperature (Tg) is at −60 °C, which gives it high hardness due to its amorphous domains when they are in the elastic state.53
In Fig. 9B and 10B, the DSC thermograms of the fibers of PCLc, PCL/Ru-1, and PCL/Ru-2 are observed, and all the samples have presented a change of temperature flux between ∼57 to 61 °C; this temperature corresponds to Tm, reported in the literature.53 (Table 4). However, there are some variations in temperature between samples, with no significant difference.
| Sample | Melting temperature | Decomposition temperature |
|---|---|---|
| PCL | 61 °C | 412 °C |
| Ru-1 1% | 62 °C | 375 °C |
| Ru-1 0.1% | 62 °C | 385 °C |
| PCL | 61 °C | 412 °C |
| Ru-2 1% | 59 °C | 408 °C |
| Ru-2 0.5% | 58 °C | 411 °C |
| Ru-2 0.1% | 61 °C | 409 °C |
The PCL and PCL/Ru-1 fibers have a decomposition or degradation temperature (Td) of approximately 375–415 °C (Fig. 9B), while for PCL/Ru-2, it is between 407–410 °C (Fig. 10B). These temperatures correspond to the maximum temperature (Tmax) of the TGA thermograms for the same samples (Table 4). The reported degradation temperature for PCL is ∼380 °C.54
It has been reported that the operating temperatures of DSSC range from −20 °C to 70 °C,2,55,56 so the fusion and decomposition temperatures of the samples will not affect the optimal functioning of the solar cell.
| Data | Ru-1 1.0% | Ru-1 0.1% | Ru-2 1.0% | Ru-2 0.5% | Ru-2 0.1% | PCLRu-1 | PCLRu-2 |
|---|---|---|---|---|---|---|---|
| a Ip, a: Current of anodic peak. Ip, c: Cathode peak current. Ep, a: Anodic peak potential. Ep, c: Cathodic peak potential. | |||||||
| Ip, a (mA) | 9.34 | 9.50 | 10.60 | 6.70 | 5.38 | 6.14 | 6.17 |
| Ip, c (mA) | 8.38 | 8.74 | 8.47 | 7.15 | 5.63 | 3.29 | 2.90 |
| Ep, a (V) | 0.870 | 0.870 | 1.012 | 0.818 | 0.916 | 0.928 | 0.930 |
| Ep, c (V) | −0.753 | −0.849 | −0.940 | −0.812 | −0.958 | −0.955 | −0.956 |
| Ep/2, a (V) | 0.348 | 0.390 | 0.437 | 0.384 | 0.377 | 0.928 | 0.031 |
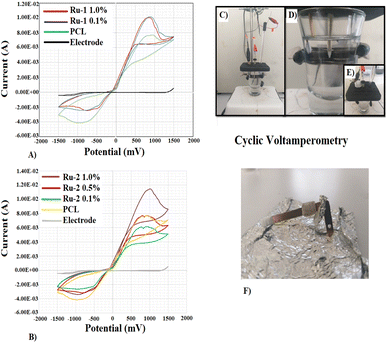
Catalytic activity is observed from the binding of the PCL sample, even without the presence of the Ru-1 compound. The current density of the anodic peak (Ip, a) increases by adding Ru-1 0.1%; however, it decreases by 0.16 mA by increasing the concentration to 1.0%. Likewise, the cathode peak current density (Ip, c) increases when Ru-1 0.1% is incorporated and decreases by 0.36 mA when the concentration increases (Table 5).
Electrofiber voltammetry tests lead to understanding and visualizing the potential of these materials in redox processes.55 These electron exchange processes are of great importance in manufacturing power generation devices. The reference voltammogram for both the pure Au electrode and the electrode covered with the PCL electrospun fiber allows us to evaluate the effect and role of the two Ru species in oxidation and reduction.56 The voltammograms show us that the fibers based on Ru-1 and Ru-2 complexes give rise to a similar oxidation and reduction process. The incorporation of Ru-1 at 0.1% favours the anodic processes in the different electrocatalytic sites arranged in the PCL scaffolds. It compares to the performance of the electrospun fibers with the Ru-2 compound, specifically at 1%; it reaches a higher value of anode current intensity, indicating that the arrangements between the active centers of Ru and the PCL scaffolds encourage electronic transfer. The behaviour observed in the CV of PCL is indicative that the fibers undergo a non-reversible oxidation–reduction process, considering the anodic and cathodic current intensity. While the incorporation of Ru-1 and Ru-2 complexes favours reversibility, considering the values of the current intensities of the anodic and cathodic peaks, they are almost comparable. All these phenomena are associated with the Ru compounds' structure; the fact that the Ru-2 complex contains an amino group generates an electronic delocalization effect that improves charge transfer in redox processes.57–59
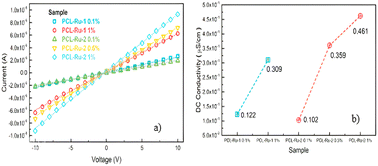
Fig. 12 shows the I–V curves taken for PCL-Ru1 and PCL-Ru2 nanofibers. The nanofibers were electrically contacted with silver paint, and measurements were made on one-inch-long samples. The curves were taken from −10 to 10 V, and an ohmic contact was observed. Therefore, it was possible to extract the conductivity through the geometric relationship:
Fig. 12a shows the I–V curves taken for PCL-Ru1 and PCL-Ru2 nanofibers, where the slope is the inverse of the resistance. The steeper the slope, the higher the conductivity. The I–V curves show that the 1% PCL-Ru2 nanofiber has higher conductivity with the same load percentages as the PCL-Ru1 nanofiber.
Based on the I–V curves shown in Fig. 12a, the behaviour appears similar at a low concentration of 0.1% of the Ru(II) complexes. However, as the amount of Ru(II) complex increases, so does the conductivity. While Ru-1 1% and Ru-2 0.5% show similar curves, the Ru-2 1% nanofiber demonstrates the highest conductivity. Fig. 12b displays the calculated conductivity, which reveals an increase in conductivity with an increase in the concentration of Ru-1 and Ru-2 complexes in the PCL nanofiber, regardless of structure. Notably, PCL with Ru-2 complex exhibits higher conductivities than Ru-1; for instance, the conductivity value of 0.5% in Ru-2 is slightly higher than 1% in Ru-1.
The obtained range of conductivity values falls between 0.102 and 0.461 μS cm−1. Previous studies have reported similar conductivities for PCL with 12% LiBF4 (0.10 μS cm−1)60 and PCL with 20% LiSCN (0.443 μS cm−1).61 Our results suggest that it is possible to increase the conductivity of PCL with lower concentrations using the discussed Ru(II) complexes.
The increase in the nanofibers' conductivity by increasing the concentration of the Ru-1 and Ru-2 complexes is why the cathodic and anodic currents increase in the cyclic voltammetry curves. Ruthenium(II) complexes enhanced the charge transfer with the electrolyte.
4 Conclusions
In this work, we successfully utilized the electrospinning technique to create poly (caprolactone) microfibers that were functionalized with Ru(II) complexes. The electrochemical properties of these fibers were analyzed to assess their potential as a counter electrode in DSSCs. These fibers have a uniform morphology, with no bulbs but visible solid inlays on the surface. They range in size from approximately 10 to 25 μm and with porosity levels of ∼45%. While FTIR spectroscopy did not provide evidence of Ru(II) compound incorporation into the polymer fibers, TGA and DSC thermograms indicated minor temperature variations, demonstrating their incorporation. Moreover, the fibers' melting and degradation temperature are suitable for use in DSSC. The incorporation of ruthenium complex into PCL fibers, along with the addition of the NH2 group in Ru-2, resulted in a higher current density for both anodic and cathodic peaks. Notably, PCL-Ru2 1% fibers demonstrated a conductivity of 0.461 μS cm−1, comparable to other PCL fibers with a higher metal load. The latter are the desired characteristics of a counter electrode material. Therefore, PCL-Ru2 fibers appear suitable for evaluation as a counter electrode in DSSC. No direct relation between the morphology of the nanofibers and the increase in the material's conductivity is observed. The effect appears to be caused by the presence of the ruthenium and the amino group that generates a charge delocalization effect. More experiments are underway to assess the latter and increase the concentration of the Ru-2 complex in the nanofibers.Conflicts of interest
There are no conflicts to declare.Acknowledgements
This work was supported by “Consejo Nacional de Ciencia y Tecnología (CONAHCyT)” grant number 169578 and by “Fondo de Cooperación Internacional en Ciencia y Tecnología del CONAHCyT (FONCICYT)” and grant “Convocatoria Conjunta de Movilidad 2015 CONAHCyT-DST México-India” with CONAHCyT project number 266380 and SICASPI-UABC number 351/6/C/63/7. We thank CONAHCyT for ITT NMR facilities (Grant INFR-2011-3-173395).References
- M. A. Mingsukang, M. H. Buraidah and A. K. Arof, Third-Generation-Sensitized Solar Cells, in Nanostructured Solar Cells [Internet], ed. N. Das, InTech, 2017, [cited 2023 Feb 28]. Available from: http://www.intechopen.com/books/nanostructured-solar-cells/third-generation-sensitized-solar-cells Search PubMed.
- J. Gong, K. Sumathy, Q. Qiao and Z. Zhou, Review on dye-sensitized solar cells (DSSCs): Advanced techniques and research trends, Renewable Sustainable Energy Rev., 2017, 68, 234–246 CrossRef CAS.
- S. Mozaffari, M. R. Nateghi and M. B. Zarandi, An overview of the Challenges in the commercialization of dye-sensitized solar cells, Renewable Sustainable Energy Rev., 2017, 71, 675–686 CrossRef CAS.
- M. E. Yeoh and K. Y. Chan, Recent advances in photo-anode for dye-sensitized solar cells: a review: Recent advances in photo-anode for DSSCs: A review, Int. J. Energy Res., 2017, 41, 2446–2467 CrossRef.
- E. Kabir, P. Kumar, S. Kumar, A. A. Adelodun and K. H. Kim, Solar energy: Potential and future prospects, Renewable Sustainable Energy Rev., 2018, 82, 894–900 CrossRef.
- M. Buzgo, A. Mickova, M. Rampichova and M. Doupnik, Blend electrospinning, coaxial electrospinning, and emulsion electrospinning techniques, in Core-Shell Nanostructures for Drug Delivery and Theranostics [Internet], Elsevier, 2018, [cited 2023 Feb 28], pp. 325–347, Available from: https://linkinghub.elsevier.com/retrieve/pii/B97800810219890001198 Search PubMed.
- Y. Dzenis, Spinning Continuous Fibers for Nanotechnology, Science, 2004, 304, 1917–1919 CrossRef CAS PubMed.
- J. M. Li, Realizing single-crystalline vertically-oriented and high-density electrospun nanofibril bundles by controlled postcalcination, CrystEngComm, 2017, 19, 3392–3397 RSC.
- J. G. López-Covarrubias, L. Soto-Muñoz, A. L. Iglesias and L. J. Villarreal-Gómez, Electrospun Nanofibers Applied to Dye Solar Sensitive Cells: A Review, Materials, 2019, 12, 3190 CrossRef PubMed.
- L. J. Villarreal-Gómez, J. M. Cornejo-Bravo, R. Vera-Graziano and D. Grande, Electrospinning as a powerful technique for biomedical applications: a critically selected survey, J. Biomater. Sci., Polym. Ed., 2016, 27, 157–176 CrossRef PubMed.
- E. J. Torres-Martinez, J. M. Cornejo Bravo, A. Serrano Medina, G. L. Pérez González and L. J. Villarreal Gómez, A Summary of Electrospun Nanofibers as Drug Delivery System: Drugs Loaded and Biopolymers Used as Matrices, Curr. Drug Delivery, 2018, 15, 1360–1374 CrossRef CAS PubMed.
- G. L. Pérez-González, L. J. Villarreal-Gómez, A. Serrano-Medina, E. J. Torres-Martínez and J. M. Cornejo-Bravo, Mucoadhesive electrospun nanofibers for drug delivery systems: applications of polymers and the parameters' roles, Indian J. Nephrol., 2019, 14, 5271–5285 Search PubMed.
- A. Al-Abduljabbar and I. Farooq, Electrospun Polymer Nanofibers: Processing, Properties, and Applications, Polymers, 2022, 15, 65 CrossRef PubMed.
- X. Shi, W. Zhou, D. Ma, Q. Ma, D. Bridges and Y. Ma, et al., Electrospinning of Nanofibers and Their Applications for Energy Devices, J. Nanomater., 2015, 1–20 Search PubMed.
- A. Aboagye, H. Elbohy, A. D. Kelkar, Q. Qiao, J. Zai and X. Qian, et al., Electrospun carbon nanofibers with surface-attached platinum nanoparticles as cost-effective and efficient counter electrode for dye-sensitized solar cells, Nano Energy, 2015, 11, 550–556 CrossRef CAS.
- G. H. An, H. An and H. J. Ahn, Ruthenium nanofibers as efficient counter electrodes for dye-sensitized solar cells, J. Electroanal. Chem., 2016, 775, 280–285 CrossRef CAS.
- J. H. He, H. Y. Kong, R. X. Chen, H. M. Sheng and C. Q. Ling, Variational iteration method for Bratu-like equation arising in electrospinning, Carbohydr. Polym., 2014, 105, 229–230 CrossRef CAS PubMed.
- S. S. Mali, P. S. Patil and C. K. Hong, Low-Cost Electrospun Highly Crystalline Kesterite Cu 2 ZnSnS 4 Nanofiber Counter Electrodes for Efficient Dye-Sensitized Solar Cells, ACS Appl. Mater. Interfaces, 2014, 6, 1688–1696 CrossRef CAS PubMed.
- S. Peng, P. Zhu, Y. Wu, S. G. Mhaisalkar and S. Ramakrishna, Electrospun conductive polyaniline–polylactic acid composite nanofibers as counter electrodes for rigid and flexible dye-sensitized solar cells, RSC Adv., 2012, 2, 652–657 RSC.
- M. Rameez, K. Saranya, A. Subramania, N. Sivasankar and S. Mallick, Bimetal (Ni–Co) nanoparticles-incorporated electrospun carbon nanofibers as an alternative counter electrode for dye-sensitized solar cells, Appl. Phys. A, 2016, 122, 71 CrossRef.
- K. Saranya, A. Subramania and N. Sivasankar, Influence of earth-abundant bimetallic (Fe–Ni) nanoparticle-embedded CNFs as a low-cost counter electrode material for dye-sensitized solar cells, RSC Adv., 2015, 5, 43611–43619 RSC.
- K. Saranya, A. Subramania, N. Sivasankar and S. Mallick, Electrospun TiC embedded CNFs as a low cost platinum-free counter electrode for dye-sensitized solar cell, Mater. Res. Bull., 2016, 75, 83–90 CrossRef CAS.
- A. Yousef, R. M. Brooks, M. H. El-Newehy, S. S. Al-Deyab and H. Y. Kim, Electrospun Co-TiC nanoparticles embedded on carbon nanofibers: Active and chemically stable counter electrode for methanol fuel cells and dye-sensitized solar cells, Int. J. Hydrogen Energy, 2017, 42, 10407–10415 CrossRef CAS.
- C. Zhang, L. Deng, P. Zhang, X. Ren, Y. Li and T. He, Electrospun NiCo2S4 with extraordinary electrocatalytic activity as counter electrodes for dye-sensitized solar cells, J. Solid State Electrochem., 2017, 21, 3579–3588 CrossRef CAS.
- P. Joshi, Z. Zhou, P. Poudel, A. Thapa, X. F. Wu and Q. Qiao, Nickel incorporated carbon nanotube/nanofiber composites as counter electrodes for dye-sensitized solar cells, Nanoscale, 2012, 4, 5659 RSC.
- E. M. Jin, J. Y. Park, X. G. Zhao, I. H. Lee, S. M. Jeong and H. B. Gu, Photovoltaic properties of TiO2–ZrO2 fiber composite electrodes for dye-sensitized solar cells, Mater. Lett., 2014, 126, 281–284 CrossRef CAS.
- M. Ryan, PGM Highlights: Progress in Ruthenium Complexes for Dye Sensitised Solar Cells, Platinum Met. Rev., 2009, 53, 216–218 CrossRef CAS.
- S. Dayan, N. Kayaci and N. Kalaycioğlu Özpozan, Improved performance with molecular design of Ruthenium(II) complexes bearing diamine-based bidentate ligands as a sensitizer for dye-sensitized solar cells (DSSC), J. Mol. Struct., 2020, 1209, 127920 CrossRef CAS.
- L. Liu, B. Li, J. Zhang, R. Qin, H. Zhao and X. Ren, Electrospinning preparation and characterization of a new kind of composite nanomaterials: One-dimensional composite nanofibers doped with TiO2 nanoparticles and Ru(II) complex, Mater. Res. Bull., 2009, 44, 2081–2086 CrossRef CAS.
- M. A. Bennett, T. N. Huang, T. W. Matheson, A. K. Smith, S. Ittel and W. Nickerson, (η6-Hexamethylbenzene)Ruthenium Complexes, Inorg. Synth., 1982, 21, 7424 CrossRef.
- J. Valladolid, C. Hortigüela, N. Busto, G. Espino, A. M. Rodríguez, J. M. Leal, F. A. Jalón, B. R. Manzano, A. Carbayo and B. García, Dalton Trans., 2014, 43, 2629–2645 RSC.
- N. Kaloyanov, R. Alexandrova, D. W. Wesselinova, H. Mayer-Figge, W. S. Sheldrick and G. D. Dimitrov, Self-assembly of novel molecular complexes of 1,10-phenanthroline and 5-amino-1,10-phenanthroline and evaluation of their in vitro antitumour activity, Eur. J. Med. Chem., 2011, 46, 1992–1996 CrossRef CAS PubMed.
- A. Ashikhmin, Z. Makhneva, M. Bolshakov and A. Moskalenko, Incorporation of spheroidene and spheroidenone into light-harvesting complexes from purple sulfur bacteria, J. Photochem. Photobiol., B, 2017, 170, 99–107 CrossRef CAS PubMed.
- S. A. Sadeek and S. M. A. El-Hamid, Preparation, characterization and cytotoxicity studies of some transition metal complexes with ofloxacin and 1,10-phenanthroline mixed ligand, J. Mol. Struct., 2016, 1122, 175–185 CrossRef CAS.
- B. Louis, C. Detoni, N. M. F. Carvalho, C. D. Duarte and O. A. C. Antunes, Cu(II) bipyridine and phenantroline complexes: Tailor-made catalysts for the selective oxidation of tetralin, Appl. Catal., A, 2009, 360, 218–225 CrossRef CAS.
- L. F. Tan, X. H. Liu, H. Chao and L. N. Ji, Synthesis, DNA-binding and photocleavage studies of ruthenium(II) complex with 2-(3′-phenoxyphenyl)imidazo[4,5-f][1,10]phenanthroline, J. Inorg. Biochem., 2007, 101, 56–63 CrossRef CAS PubMed.
- J. Z. Wua and L. Yuan, Synthesis and DNA interaction studies of a binuclear ruthenium(II) complex with 2,9-bis(2-imidazo[4,5- f ][1,10]phenanthroline)-1,10-phenanthroline as bridging and intercalating ligand, J. Inorg. Biochem., 2004, 98, 41–45 CrossRef PubMed.
- D. L. Pavia, G. M. Lampman, G. S. Kriz and J. A. Vyvyan, Introduction to Spectroscopy [Internet], Cengage Learning, 2008, Available from: https://books.google.com.mx/books?id=FkaNOdwk0FQC Search PubMed.
- T. Elzein, M. Nasser-Eddine, C. Delaite, S. Bistac and P. Dumas, FTIR study of polycaprolactone chain organization at interfaces, J. Colloid Interface Sci., 2004, 273, 381–387 CrossRef CAS PubMed.
- K. Ghosal, A. Manakhov, L. Zajíčková and S. Thomas, Structural and Surface Compatibility Study of Modified Electrospun Poly(ε-caprolactone) (PCL) Composites for Skin Tissue Engineering, AAPS PharmSciTech, 2017, 18, 72–81 CrossRef CAS PubMed.
- J. S. Jeon, D. H. Han and B. Y. Shin, Improvements in the Rheological Properties, Impact Strength, and the Biodegradability of PLA/PCL Blend Compatibilized by Electron-Beam Irradiation in the Presence of a Reactive Agent, Adv. Mater. Sci. Eng., 2018, 1–8 CrossRef.
- E. M. Abdelrazek, A. M. Hezma, A. El-khodary and A. M. Elzayat, Spectroscopic studies and thermal properties of PCL/PMMA biopolymer blend, Egypt. j. basic appl. sci., 2016, 3, 10–15 Search PubMed.
- M. J. Mochane, T. S. Motsoeneng, E. R. Sadiku, T. C. Mokhena and J. S. Sefadi, Morphology and Properties of Electrospun PCL and Its Composites for Medical Applications: A Mini Review, Appl. Sci., 2019, 9, 2205 CrossRef CAS.
- I. Y. Enis, J. Vojtech and T. G. Sadikoglu, Alternative solvent systems for polycaprolactone nanowebs via electrospinning, J. Ind. Text., 2017, 47, 57–70 CrossRef CAS.
- A. S. Álvarez-Suárez, S. G. Dastager, N. Bogdanchikova, D. Grande, A. Pestryakov and J. C. García-Ramos, et al., Electrospun Fibers and Sorbents as a Possible Basis for Effective Composite Wound Dressings, Micromachines, 2020, 11, 441 CrossRef PubMed.
- R. D. Velasco-Barraza, R. Vera-Graziano, E. A. López-Maldonado, M. T. Oropeza-Guzmán, S. G. Dastager and A. Álvarez-Andrade, et al., Study of nanofiber scaffolds of PAA, PAA/CS, and PAA/ALG for its potential use in biotechnological applications, Int. J. Polym. Mater. Polym. Biomater., 2018, 67, 800–887 CrossRef CAS.
- M. Fadaie, E. Mirzaei, B. Geramizadeh and Z. Asvar, Incorporation of nanofibrillated chitosan into electrospun PCL nanofibers makes scaffolds with enhanced mechanical and biological properties, Carbohydr. Polym., 2018, 199, 628–640 CrossRef CAS PubMed.
- G. Prado-Prone, P. Silva-Bermudez, A. Almaguer-Flores, J. A. García-Macedo, V. I. García and S. E. Rodil, et al., Enhanced antibacterial nanocomposite mats by coaxial electrospinning of polycaprolactone fibers loaded with Zn-based nanoparticles, Nanomed. Nanotechnol. Biol. Med., 2018, 14, 1695–1706 CrossRef CAS PubMed.
- A. Marrella, G. Tedeschi, P. Giannoni, A. Lagazzo, F. Sbrana and F. Barberis, et al., “Green-reduced” graphene oxide induces in vitro an enhanced biomimetic mineralization of polycaprolactone electrospun meshes, Mater. Sci. Eng. C, 2018, 93, 1044–1053 CrossRef CAS PubMed.
- X. Cai, S. Hou, H. Wu, Z. Lv, Y. Fu and D. Wang, et al., All-carbon electrode-based fiber-shaped dye-sensitized solar cells, Phys. Chem. Chem. Phys., 2012, 14, 125–130 RSC.
- M. Fathy, A. B. Kashyout, J. El Nady, S. Ebrahim and M. B. Soliman, Electrospun polymethylacrylate nanofibers membranes for quasi-solid-state dye sensitized solar cells, Alexandria Eng. J., 2016, 55, 1737–1743 CrossRef.
- I. Castilla-Cortázar, A. Vidaurre, B. Mari and A. J. Campillo-Fernández, Morphology, Crystallinity, and Molecular Weight of Poly(ε-caprolactone)/Graphene Oxide Hybrids, Polymers, 2019, 11, 1099 CrossRef PubMed.
- M. Abedalwafa, F. Wang, L. Wang and C. Li, Biodegradable poly-epsilon-caprolactone (PCL) for tissue engineering applications: A Review, Rev. Adv. Mater. Sci., 2012, 34, 123–140 Search PubMed.
- T. Patrício, A. Glória and P. Bártolo, Mechanical and Biological Behaviour of PCL and PCL/PLA Scaffolds for Tissue Engineering Applications, Chem. Eng. Trans., 2013, 32, 1645–1650 Search PubMed.
- J. Gong and K. Sumathy, A theoretical study on third generation photovoltaic technology: dye-sensitized Solar Cells, Renew. Energy Power Qual. J., 2012, 157–160 CrossRef.
- M. A. Sabino, Oxidation of polycaprolactone to induce compatibility with other degradable polyesters, Polym. Degrad. Stab., 2007, 92, 986–996 CrossRef CAS.
- E. R. Leone, L. S. Ferraraccio, G. Damonte, P. Lova, P. Bertoncello and O. Monticelli, On the development of electrochemical sensors coated with polycaprolactone, Electrochem. Commun., 2021, 129, 107089 CrossRef CAS.
- T. Cai, T. Li, B. Li, Y. Hu, X. Li, T. Lin, H. Hu, B. Luo, Y. Zhang, X. Zhu, Y. Cui, L. Zhao, W. Xing, Z. Yan and L. Wang, Reversible phosphorus-based five-electron transfer reaction for aluminium–phosphorus batteries, Energy Storage Mater., 2022, 53, 415–423 CrossRef.
- S. R. Raga and F. Fabregat-Santiago, Temperature effects in dye-sensitized solar cells, Phys. Chem. Chem. Phys., 2013, 15, 2328 RSC.
- C. P. Fonseca, F. C. Cavalcante Jr, F. A. Amaral, C. A. Z. Souza and S. Neves, Thermal and Conduction Properties of a PCL-biodegradable Gel Polymer Electrolyte with LiClO4, LiF3CSO3, and LiBFg Salts, Int. J. Electrochem. Sci., 2007, 2, 52–63 CrossRef CAS.
- M. Ravi, S. Song, K. Gu, J. Tang and Z. Zhang, Electrical properties of biodegradable poly(ε-caprolactone): lithium thiocyanate complexed polymer electrolyte films, Mater. Sci. Eng. B, 2015, 195, 74–83 CrossRef CAS.
Footnote |
| † Electronic supplementary information (ESI) available: Complete NMR and FT-IR spectra of complexes. See DOI: https://doi.org/10.1039/d3ra07283e |
| This journal is © The Royal Society of Chemistry 2023 |

