
 Open Access Article
 This Open Access Article is licensed under a Creative Commons Attribution-Non Commercial 3.0 Unported Licence
Combined experimental and simulation study on H2 storage in oxygen and nitrogen co-doped activated carbon derived from biomass waste: superior pore size and surface chemistry development†
Suphakorn Anuchitsakola,
Waralee Dilokekunakulb,
Numphueng Khongtorc,
Somboon Chaemchuen d and
Nikom Klomkliang*ae
d and
Nikom Klomkliang*ae
aSchool of Chemical Engineering, Suranaree University of Technology, Nakhon Ratchasima 30000, Thailand. E-mail: nikom.klo@sut.ac.th
bAachener Verfahrenstechnik – Chemical Process Engineering, RWTH Aachen University, Aachen 52074, Germany
cInstitute of Research and Development, Suranaree University of Technology, Nakhon Ratchasima 30000, Thailand
dState Key Laboratory of Advanced Technology for Materials Synthesis and Processing, Wuhan University of Technology, Wuhan 430070, China
eResearch Unit of Adsorption, Catalysis & Energy Storage, Suranaree University of Technology, Nakhon Ratchasima 30000, Thailand
First published on 11th December 2023
Abstract
In this study, heteroatom (O, N)-doped activated carbon (AC) is produced using urea and KOH activation from abundant and cost-effective biomass waste for H2 storage. The O and N co-doped AC exhibits the highest specific surface area and H2 storage capacity (2.62 wt%), increasing by 47% from unmodified AC at −196 °C and 1 bar. Surface modification helps develop superior pore sizes and volumes. However, the original AC is superior at lower pressures (<0.3 bar) because of its suitable pore width. This observation is then explained by molecular simulations. Optimal pore widths are 0.65 nm at <0.3 bar and 0.95–1.5 nm at pressures in moderate range (0.3–15 bar). Superior pore sizes are observed in the range of 0.8–1.3 nm at 1 bar, enhancing performance with co-doped AC to achieve uptake superior to that of other ACs described in the literature. However, above 15 bar, pore volume dominates capacity over pore width. Among the O and N groups, pyridinic-N oxide is the most substantial, playing a vital role at low and moderate pressures. These findings propose a strategy for superior H2 storage in porous carbons under various pressure conditions.
1. Introduction
Global energy demand is surging, with over 78% of the world population reliant on non-renewable fossil fuels according to data from 2023.1 However, their combustion emits greenhouse gases, contributing to climate change. To address this, innovative technologies for clean and renewable energy, including hydrogen storage, have emerged.2,3 Hydrogen is an eco-friendly fuel with a high energy content (142 MJ kg−1) which is about three fold higher energy per unit mass compared to gasoline,4 and water is its byproduct. Nevertheless, efficient transport and storage of hydrogen pose challenges. One promising approach is cryogenic storage in porous materials known for their rapid kinetics, excellent cyclability, and high adsorption capacity.5,6 Extensive research has focused on activated carbons (ACs),7–14 metal–organic frameworks,15–18 and zeolites19–21 as potential hydrogen storage materials. ACs, in particular, offer advantages such as large surface area, customizable porosity, thermal and chemical stability, affordability, and versatility in raw material sources.22–24 Modifying ACs with heteroatoms such as oxygen, sulfur, nitrogen, and phosphorus has shown promising results in enhancing surface and pore properties.25–27Numerous studies have investigated the influence of pore size on hydrogen adsorption.28–32 It has been noted that AC micropores ranging from 0.60 to 0.70 nm and 0.65 to 1.5 nm exhibited optimal hydrogen storage capabilities at −196 °C.33,34 The surface area played a crucial role in hydrogen adsorption, while the nitrogen or sulfur content in modified ACs did not significantly affect it.35,36 Adequate pore volume and a large surface area were essential for substantial hydrogen uptake and could compensate for the presence of larger pores (>1.0 nm).31,33 Furthermore, investigations into the surface chemistry of ACs revealed that a high proportion of carbon surface micropores and oxygen functional groups enhanced gravimetric hydrogen storage efficiency.37,38 In a recent study, ammonia treatment of a commercial AC improved hydrogen adsorption efficiency from 1.98 to 2.34 wt% at −196 °C and 0.93 bar.39 However, a separate study concluded that pore width had a more significant impact on hydrogen adsorption than surface chemistry.33 Additionally, certain synthesized ACs demonstrated hydrogen uptake equivalent to those with lower surface area and pore volume.39–41 These findings underline the need for a comprehensive understanding and further research in this field.
Due to the above reasons, it is challenging to investigate the individual characteristic properties of an adsorbent solely through experiments. Experimental observations are influenced by the interplay between various properties, making it challenging to control changes when synthesizing or modifying adsorbents to enhance specific properties. Experimental results indicate macroscopic behavior but cannot perfectly measure molecular-scale characteristics, mainly because of the combined effects of pore structure and surface functional group properties. To overcome these limitations, Grand Canonical Monte Carlo (GCMC) simulations have been employed. GCMC simulations offer macroscopic results that can be combined with experimental data, allowing for studying microscopic and molecular-scale phenomena. Using GCMC, it was reported that oxygen functional groups on graphene sheets significantly enhance hydrogen adsorption.42 An optimum pore diameter of 0.68 nm was identified for hydrogen volumetric capacity at 25 °C and 25 bar.43 Carbonaceous slit pore models were constructed with CO and COH groups grafted on surfaces in different pore sizes for H2 storage at −196 °C,42 in which the pore width was found to be the major factor for H2 storage, greater than the heteroatom grafted on the solid surface. A pore width range was varied roughly in 0.7–1.5 nm of H2 adsorption on a graphitic slit-pore at a range of −193 to 25 °C and pressure up to 200 bar,44 with a pore width of 1.5 nm yielding the highest adsorption capacity. GCMC approaches have been employed to synthesize pore topologies such as slit-shape, nanotubes, and torusene for hydrogen storage.43,45 Despite numerous experimental and simulated studies, the relationship between functional groups, pore width, and pore volume remains unclear across different pressure ranges. Additionally, understanding the molecular origin and heat contributions to overall hydrogen adsorption capacity in various carbonaceous materials is crucial. A comprehensive understanding of all aspects ranging from molecular origins to macroscopic behavior is essential for the sustainable large-scale application of hydrogen storage.
In this study, ACs were derived from jujube branches, an abundant and cost-effective agricultural waste found in Asian countries including Thailand. The synthesis of ACs involved physical heat treatment, KOH activation, and urea modification. These processes aimed to enhance nitrogen functional groups on the solid surface and improve the porous structure of the materials. The impact of activation temperature and duration and the characterization of physical and chemical properties were examined. Subsequently, the ACs were utilized for adsorbing hydrogen at the temperature range of −196 °C to 25 °C and pressure of up to 1 bar. Although pore width, volume, and surface chemistry have notable effects on adsorption, it is challenging to study them individually through experiments. To address this, a GCMC simulation was employed to systematically explore and gain insights into the molecular-level behavior of hydrogen adsorption.
2. Methods
2.1 Experimental
 | ||
| Fig. 1 Synthesis of the original and modified ACs. | ||
For the activation stage, the biochar from the first step (carbonization) was placed in a horizontal ceramic tube furnace. The environment within the furnace was altered from an inert nitrogen atmosphere to a reactive carbon dioxide atmosphere to activate the biochar. Carbon dioxide was selected for its high oxidative capacity, which can enhance the yield of the process by preventing complete combustion of the carbon material. The biochar was heated from room temperature at a controlled rate of 5 °C min−1 to the target temperatures of 800 °C or 900 °C and maintained at these temperatures for 1 hour. Following the completion of the heating cycle, the furnace was allowed to cool to room temperature under a nitrogen flow to preserve the activated carbon (AC) structure. The resulting AC was then collected and designated as ACx, where ‘x’ indicates the specific activation temperature utilized.
For pore and surface modification, a mixture of the biochar and urea (with a weight ratio of 1![[thin space (1/6-em)]](https://www.rsc.org/images/entities/char_2009.gif) :1) was then oxidized with air at a flow rate of 100 ml min−1 and heated at 350 °C with a heating rate of 5 °C min−1 for 1 h. This was done to impregnate nitrogen functional groups grafted on the solid surface. Then, KOH solution was added to the sample with a weight ratio of 1 g sample per 2 g KOH. Afterward, this mixture was combined at room temperature using a magnetic stirrer for 24 h and then dried overnight in an oven at 120 °C. After that, the mixed sample was placed in a horizontal ceramic tube furnace under carbon dioxide at a flow rate of 100 ml min−1, with a gradual increase in temperature from room temperature to the desired temperature range (800–900 °C) at a heating rate of 5 °C min−1, and then held for the desired time (1 to 2 h). The sample was washed with hot water until the pH of the filtrate was neutral, and then it was dried at 105 °C for 24 h. The O and N co-doped AC was designated as N-ACx-y, where x and y refer to activation temperature and time, respectively.
:1) was then oxidized with air at a flow rate of 100 ml min−1 and heated at 350 °C with a heating rate of 5 °C min−1 for 1 h. This was done to impregnate nitrogen functional groups grafted on the solid surface. Then, KOH solution was added to the sample with a weight ratio of 1 g sample per 2 g KOH. Afterward, this mixture was combined at room temperature using a magnetic stirrer for 24 h and then dried overnight in an oven at 120 °C. After that, the mixed sample was placed in a horizontal ceramic tube furnace under carbon dioxide at a flow rate of 100 ml min−1, with a gradual increase in temperature from room temperature to the desired temperature range (800–900 °C) at a heating rate of 5 °C min−1, and then held for the desired time (1 to 2 h). The sample was washed with hot water until the pH of the filtrate was neutral, and then it was dried at 105 °C for 24 h. The O and N co-doped AC was designated as N-ACx-y, where x and y refer to activation temperature and time, respectively.
The surface chemistry was analyzed using Fourier-transform infrared spectroscopy (FTIR, Tensor 27) in the wave range of 4000–400 cm−1 and X-ray photoelectron spectroscopy (XPS, Kratos Axis Ultra). In addition, the percentage of composition in the samples was characterized using the CHN elemental analyzer (LECO 628). Assuming that the amounts of other elements are negligible, the oxygen content is determined by the mass difference.
The isosteric heat of H2 adsorption was calculated from isotherms at different temperatures between −196 and 25 °C using the following Clausius–Clapeyron equation:
 | (1) |
2.2 GCMC simulation
The isotherm and heat obtained from experimental works always originate from molecular origin derived from characteristic properties of adsorbents which are complex and could not be investigated separately on H2 adsorption behavior. Therefore, to overcome these limitations, GCMC simulations have been employed. To ensure and gain the accuracy of physical behavior each factor with a simple model was tuned independently from each other. The GCMC approach was carried out to study the effect of pore width, pore volume, surface functional group type, and concentration systematically. GCMC simulation details can be found in ref. 46 and 47. Fig. 2 presents two solid surface models used to explore surface chemistry. The adsorbent was modeled as an atomistic and graphitic slit pore with four graphene layers on each side of the solid walls. The simulation box's dimensions in the x, y, and z directions were 5.904 nm, 4.260 nm, and Lz, respectively, where Lz is the physical pore width. The functional group was grafted at the edge of a graphene sheet placed with its plate parallel to solid walls. In model 1, functionalized graphene with co-doped oxygen and nitrogen consisted of carbonyl (CO), hydroxyl (COH), carboxyl (COOH), pyrrolic (N5), pyridinic-N oxide (Ox-N6), and quaternary-N (NQ) groups. For model 2, graphene was functionalized with three oxygen groups (CO, COH, and COOH). The six functional groups in the model were selected because they are typically found in high intensity in ACs. Molecular parameters, including Lennard-Jones (LJ) 12-6 sites and partial charges of functional groups are summarized in Table S1 (ESI),† which have been collected from the literature.48–51 | ||
| Fig. 2 (a) Side view (xz plane) of an atomistic solid model and (b) top view (xy plane) of the solid model representing functionalized graphene in different cases (O/N-doped AC and O-doped AC). | ||
The interaction between H2 molecules and the graphite basal plane was calculated using the LJ 12-6 potential equation. The molecular parameters for the carbon atom in a graphene layer are obtained from Steele;52 the intermolecular collision diameter (σ(s)i) is 0.34 nm and the depth of the potential well per Boltzmann constant (ε(s)i/kB) is 28 K. The distance between two graphene layers is 0.3354 nm.
To describe the interaction between hydrogen molecules, the LJ 12-6 potential and the coulombic electrostatic equation were used in the calculation. The force field of the H2 molecule was taken from the literature.53 H2 molecule was modeled as a single LJ 12-6 site at the center of the mass, with fixed charges at each H atom and center of mass along the H–H bond length of 0.0741 nm to mimic the quadrupole moment of H2. The molecular parameters are summarized in Table S1.†
The gravimetric H2 adsorption capacity (ρgra) was calculated as the adsorbed amount divided by the sum of the masses of all atoms in the solid model (ms):
| ρgra = 〈N〉/ms | (2) |
The total isosteric heat (qiso) is contributed from fluid–fluid (FF), fluid–functional group (FFn), and fluid–graphite basal plane (FGr) interactions together with kinetic energy (kBT) as shown in eqn (3):
| qiso = qFF + qFFn + qFGr + kBT | (3) |
The isosteric heat from eqn (3) can be calculated from the fluctuation theory using the following equation:54
 | (4) |
In this study, the alteration of density from the surface and the local density distribution of the center of each H2 site along the z-axis are calculated using eqn (5):
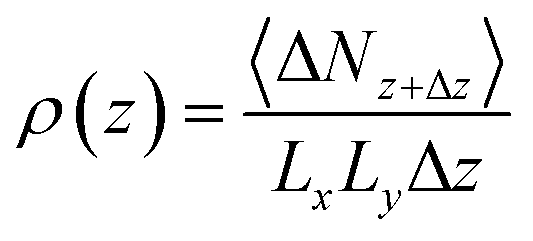 | (5) |
3. Results and discussion
3.1 Characterization
The N2 adsorption/desorption isotherms conducted at −196 °C for the synthesized samples exhibited type I behavior, as classified by the IUPAC classification (Fig. 3a). The significant rise in the isotherm at relatively low pressures (<0.1) indicates not only characteristic micropore filling but also monolayer adsorption occurring in all pore sizes, including mesopores.55,56 The N2 adsorbed amount in this pressure region was slightly higher for N-AC900 samples compared to AC900. The greater increase observed in N-AC900 samples can be attributed to the uptake of micropore filling and the monolayer on the mesopore surface, which is more abundant in N-AC900 samples. As shown in Fig. 3b, the ultra-micropore sizes (<0.7 nm) were slightly reduced, while the supermicropore sizes (0.7–2.0 nm) and mesopores were developed and increased significantly. SEM images of all samples are presented in Fig. 4: the two hour modification shows a particularly clean surface with minimal pore blockage compared to the other ACs. | ||
| Fig. 3 (a) N2 adsorption/desorption isotherms at −196 °C and (b) pore size distributions. | ||
 | ||
| Fig. 4 SEM images of AC samples: (a) N-AC900-2, (b) N-AC900-1, (c) N-AC800-1, (d) AC900, and (e) AC800. | ||
Table 1 presents the textural characteristics determined by N2 isotherms at −196 °C and the chemical characteristics obtained through elemental analysis for all ACs. The nitrogen content in the pristine ACs ranged 1.33–1.42% approximately by weight, depending on the precursor material. However, in modified ACs, the nitrogen groups were significantly enhanced, reaching 2.79–6.16% by weight. Additionally, the specific surface area and pore volume were developed and increased up to 1118 m2 g−1 and 0.577 cm3 g−1 respectively. Notably, the modified ACs retained oxygen content alongside the increased nitrogen content. The N/O ratio of the modified ACs increased approximately 2–5 times compared to the original ACs.
| ACs | SBET (m2 g−1) | Vt (cm3 g−1) | % components | H2 uptake (wt%) | Year/ref. | ||||
|---|---|---|---|---|---|---|---|---|---|
| C | H | N | O | −196 °C | 25 °C | ||||
| N-AC900-2 | 1118 | 0.577 | 83.30 | 0.02 | 2.79 | 13.88 | 2.62 | 0.09 | The present work |
| N-AC900-1 | 918 | 0.456 | 83.40 | 0.01 | 5.34 | 11.25 | 2.59 | 0.10 | |
| N-AC800-1 | 713 | 0.385 | 81.93 | 0.39 | 6.16 | 11.51 | 2.22 | 0.11 | |
| AC900 | 812 | 0.409 | 83.81 | 0.66 | 1.42 | 14.10 | 2.28 | 0.12 | |
| AC800 | 408 | 0.228 | 88.36 | 0.63 | 1.33 | 9.68 | 1.78 | 0.11 | |
| NAC-800-3-1 | 2477.3 | 1.93 | 90.63 | 0.40 | 2.082 | 6.89 | 2.29 | 2023 (ref. 11) | |
| LP_4 | 497.3 | 0.208 | 0.93 | 2023 (ref. 12) | |||||
| Commercial AC | 1678 | 0.73 | 90.8 | 0.6 | 8.6 | 1.98 | 2023 (ref. 39) | ||
| AC–He400–N500 | 1554 | 0.67 | 91.2 | 1.1 | 7.7 | 2.34 | |||
| NPC-1 | 2084.5 | 1.060 | 13.10 | 2.09 | 2021 (ref. 40) | ||||
| NPC-2 | 3037.8 | 1.810 | 8.5 | 2.49 | |||||
| NPC-3 | 3354.3 | 2.143 | 5.1 | 2.83 | |||||
| NPC-4 | 3369.6 | 2.049 | 4.09 | 2.86 | |||||
| AC500 | 809 | 0.34 | 1.45 | 2020 (ref. 13) | |||||
| AC600 | 1251 | 0.53 | 1.89 | ||||||
| NAC | 3263 | 1.75 | 1.64 | 2.91 | 2019 (ref. 61) | ||||
| NAC3 | 3485 | 1.67 | 2.20 | 3.1 | 2017 (ref. 62) | ||||
| PC-2-800 | 2919 | 1.425 | 0.98 | 2.71 | 2016 (ref. 63) | ||||
| OB-CO2 | 1185 | 0.52 | 90.2 | 0.48 | 0.48 | 6.25 | 1.69 | 2016 (ref. 64) | |
| AC3 | 687.3 | 0.3624 | 1.97 | 2016 (ref. 65) | |||||
| C2-1/4-700 | 2370 | 1.08 | 92.2 | 0.6 | 7.1 | 2.50 | 2011 (ref. 41) | ||
| C4-1/2-700 | 1283 | 0.68 | 85.8 | 1.7 | 11.9 | 2.30 | |||
| Carbon C | 1040 | 0.48 | 1.8 | 2004 (ref. 66) | |||||
| JM1 | 890 | 0.65 | 1.2 | ||||||
| Norit R0,8 | 1320 | 0.65 | 1.6 | ||||||
The incorporation of KOH with CO2 during the activation process is a strategic step intended to enhance the development of a micro–mesoporous structure within the activated carbon matrix. KOH and CO2 act as a chemical activator, facilitating the widening of existing pores and the creation of new ones through a series of complex reactions that include dehydrogenation, aromatization, and cross-linking of carbon atoms. During nitrogen doping, where a potential concern is the blockage of pores and reduction in surface area due to the incorporation of nitrogenous groups, the use of KOH and CO2 can be particularly beneficial. It not only compensates for any potential loss of porosity but may also facilitate the doping process by creating more active sites for the nitrogen groups to attach. Thus, it can be concluded that the urea modification and KOH activation led to improvements in the microporous and mesoporous properties and nitrogen content in the N-doped ACs, as indicated by the increased SBET and Vt with respect to the activation temperature and time.
To characterize the chemical properties of ACs, several measurements were used to support each other. Fig. 5 shows the FTIR results of ACs containing the functional groups. The bands at 3456, 2920, 1720, 1630, 1512, 1068, 879, and 472 cm−1 can be identified as N–H/O–H, C–H, C![[double bond, length as m-dash]](https://www.rsc.org/images/entities/char_e001.gif) O, CC, N–H, C–O, C–N, and C–C stretching respectively.57–60 Additionally, O and N co-doped ACs displayed significant peaks of N–H, C–O, and C–N stretching, demonstrating the efficiency of urea and KOH activation in enhancing the functional groups in AC.
O, CC, N–H, C–O, C–N, and C–C stretching respectively.57–60 Additionally, O and N co-doped ACs displayed significant peaks of N–H, C–O, and C–N stretching, demonstrating the efficiency of urea and KOH activation in enhancing the functional groups in AC.
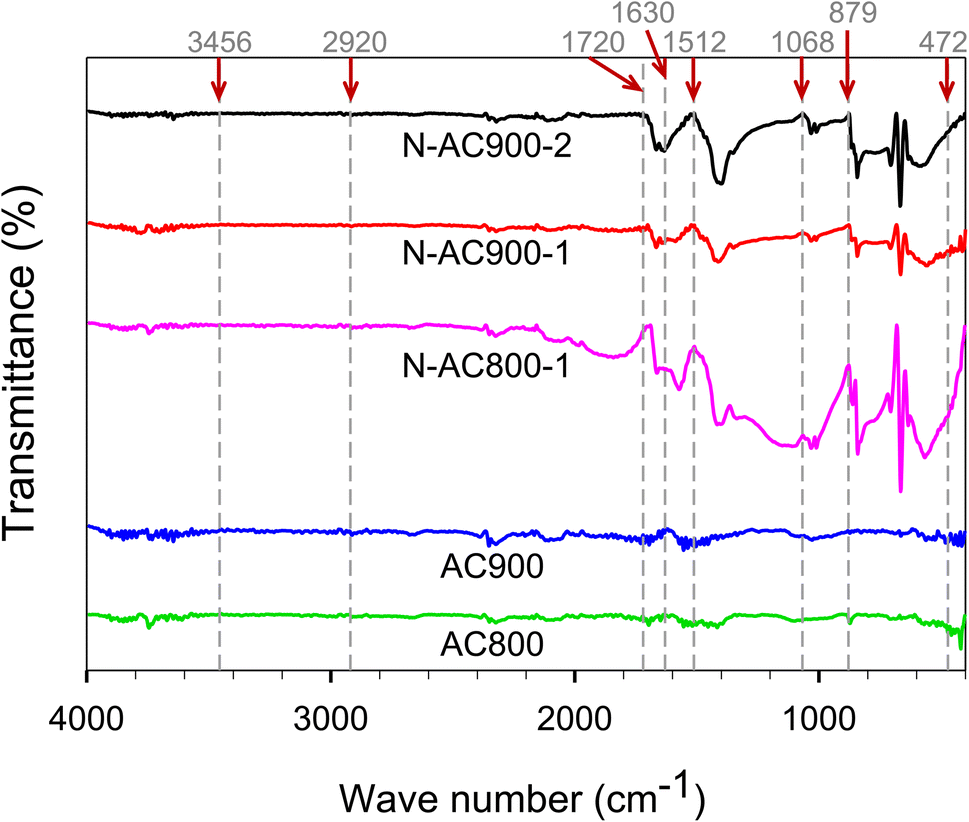 | ||
| Fig. 5 FTIR spectra of AC samples. | ||
Furthermore, the bonding configurations of N atoms were analyzed in detail through high-resolution N 1s XPS spectra (Fig. 6). The N 1s spectra were deconvolved and assigned to specific N-containing groups, namely pyridinic-N or N6 (398.1 eV), pyrrolic-N or N5 (400.5 eV), quaternary-N or NQ (401.3 eV), and N-oxides or Ox-N6 (402–404 eV). It is evident that while all the AC samples derived from jujube branches exhibit similar N-containing species because of the inherent nature of the precursor, the relative abundance of these species within the samples varies significantly with activation temperature and time. N5 emerges as the dominant species across all samples, followed by N6, NQ, and Ox-N6. To provide a clearer visual representation, the ratios of each functional group in each sample are presented in a bar chart (Fig. 7). Among these groups, NQ is the most stable, involving N atoms embedded in the graphene sheet with chemical bonds to the three neighboring carbon (C) atoms, which also makes it the most challenging group to form during synthesis, hence exhibiting the lowest content on the surface. N6 is the secondary group, while N5 and Ox-N6 are the tertiary groups. They are more likely to form at the edges or defects of the graphene sheet during surface modification. The presence of Ox-N6 was enhanced with a longer activation time or a higher temperature.
 | ||
| Fig. 6 XPS spectra of N 1s orbitals for all AC samples. (a) N-AC900-2, (b) N-AC900-1, (c) N-AC800-1, (d) AC900, and (e) AC800. | ||
 | ||
| Fig. 7 Comparison of nitrogen functional group species on AC samples obtained from XPS. | ||
3.2 H2 adsorption
To describe the isotherms, we divided the adsorption process into three regions based on the relative pressure (P/Po), as illustrated in the schematic diagram presented in Fig. 8.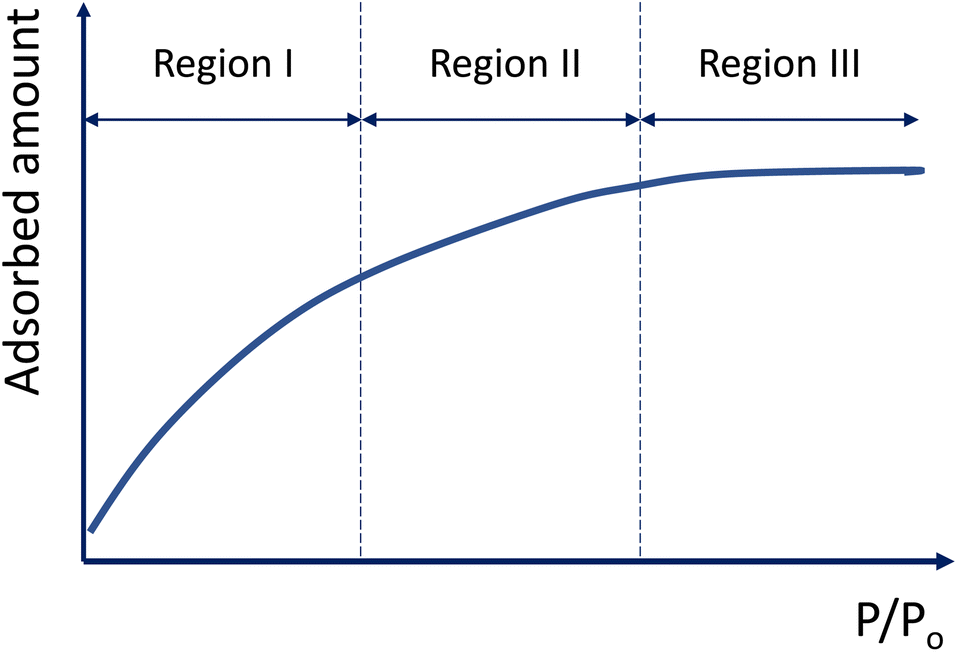 | ||
| Fig. 8 Adsorption process with increasing relative pressure. | ||
The H2 adsorption isotherms at −196 and 25 °C are presented in Fig. 9, while the corresponding H2 capacities at 1 bar are summarized in Table 1 and Fig. 10, allowing for comparison with values reported in the literature. The H2 capacity obtained in this study at −196 °C and 1 bar fell within the range of 1.78–2.62 wt%, which demonstrated promising potential as an alternative adsorbent. Interestingly, our modified ACs exhibited a specific surface area and pore volume approximately three times lower than other works; yet, their H2 capacities remained comparable. Furthermore, our modified ACs demonstrated higher H2 adsorption capacities compared to other ACs with similar surface areas or pore volumes. This can be attributed to the development of superior pore sizes in our modified ACs, which play a crucial role in achieving high capacity at this pressure range.
 | ||
| Fig. 9 H2 adsorption isotherms at (a) −196 and (b) 25 °C up to 1 bar, and (c) isosteric heat. | ||
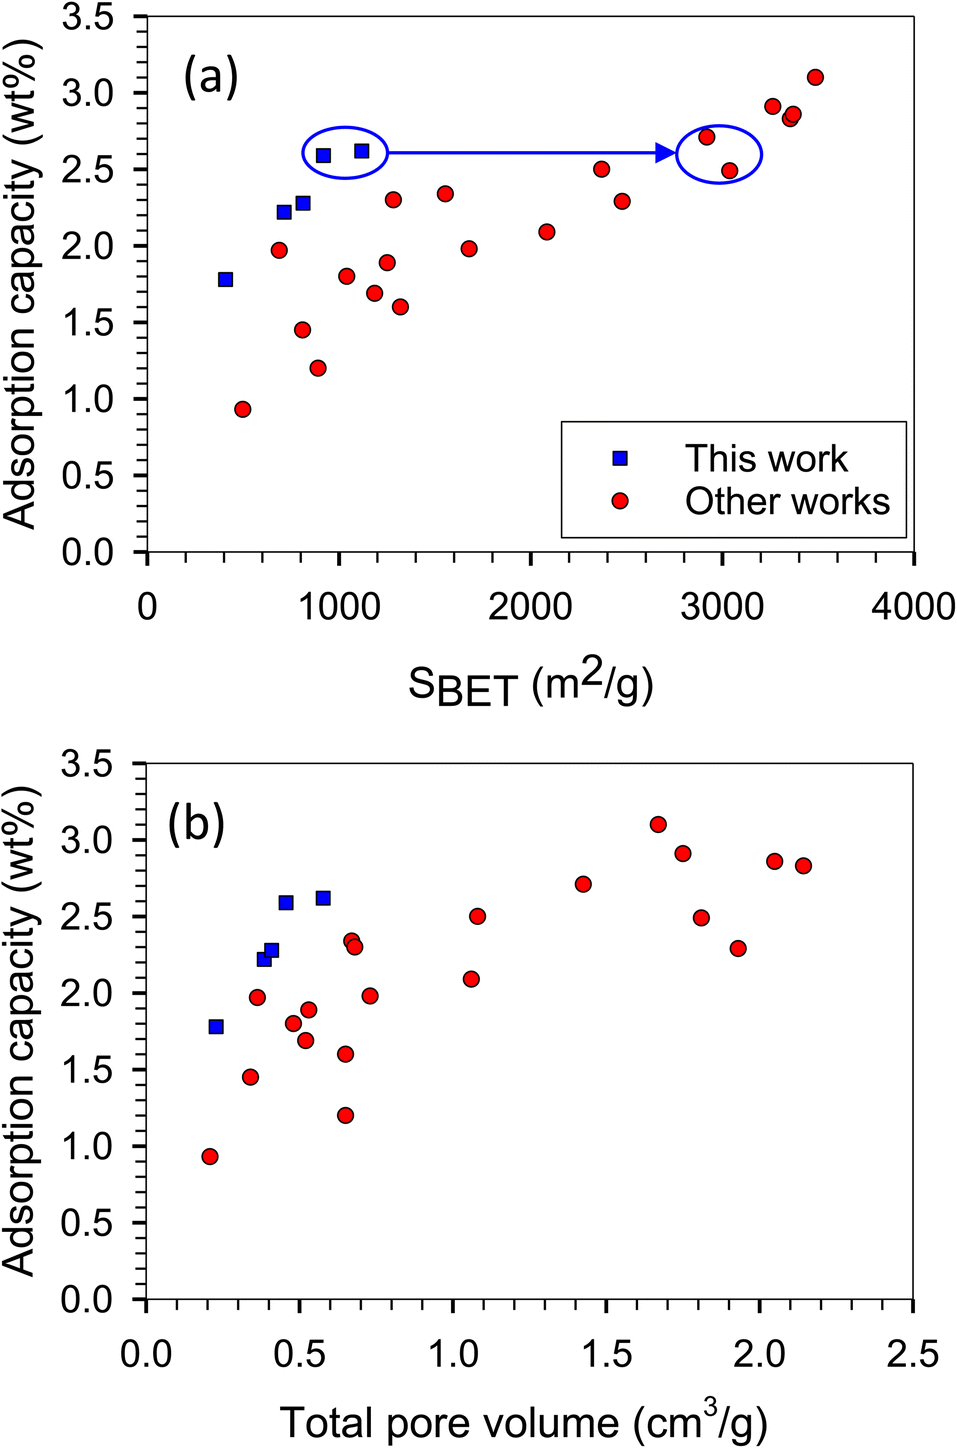 | ||
| Fig. 10 H2 adsorption capacity versus (a) specific surface area and (b) pore volume obtained with the present work and literature (other works) at −196 °C and 1 bar corresponding to Table 1. | ||
Analyzing the results at −196 °C depicted in Fig. 9a, it was observed that the gravimetric capacity of the original ACs (AC900) surpassed that of the modified ACs (N-AC900-2) at low pressures (<0.25 bar) during the adsorption process, specifically in region I. This happened despite AC900 having a lower pore volume and surface area. The reason behind this discrepancy lies in the strength of the strongest active site in AC900, which is stronger than that in the modified N-AC900-2. The dominant active site in AC900 is probably because of its pore size rather than its surface functional group. Notably, the main groups on the surface of AC900 are oxygen-containing, which are weaker compared to the abundant N groups found in N-AC900-2. The isosteric heat of AC900 correlates with the enhanced H2 capacity in this region.
Moving beyond the low loadings in region I, the modified ACs, particularly N-AC900-1 and N-AC900-2, exhibited enhanced H2 capacities compared to the other samples at higher pressures. In region II, the wider pore width played a key role in the gravimetric capacity. The adsorbed amount in N-AC900-2 surpassed that of AC900 because of the slightly greater development of superior pore sizes in N-AC900-2. This observation was a result of the interplay between pore size, pore volume, and surface chemistry, which can be further elucidated through a GCMC approach. It is important to note that none of the samples reached the adsorption capacity in region III, as the pressure was not sufficiently high to fully occupy the pores with adsorbate molecules.
Considering the interrelated loadings up to 0.12 wt% for isosteric heat calculations, which correspond to adsorption in region I at both temperatures (−196, 25 °C), the isosteric heat represented only adsorption in region I, as depicted in Fig. 9c. Notably, N-AC900-1 and N-AC900-2 exhibited an additional advantage in terms of the released heat of adsorption, as their released heats were relatively lower compared to the other samples. This can be attributed to their larger pore sizes compared to the original ACs. The higher heat observed in AC900 was a result of interactions between the adsorbate and solid walls, including the opposite wall within smaller pore sizes.
At a temperature of 25 °C, adsorption up to 1 bar still occurred within region I (Fig. 9b), because of the higher value of saturated pressure (Po) at elevated temperature. Consequently, the adsorbed amounts in each adsorbent followed the same order as in region I at −196 °C, with the capacity of the original ACs exceeding that of the modified ACs. From an application standpoint, an advantageous aspect is the ability to release H2 from the pores by increasing the temperature. Notably, the O and N co-doped ACs exhibited superior H2 storage capacities at −196 °C and, furthermore, facilitated a greater working capacity (useable capacity) of H2 from the pores at 25 °C and 1 bar, surpassing the performance of the original ACs.
Regarding surface modification, simultaneous enhancements in functional group content and pore size, including pore volume, were achieved. However, a comprehensive and systematic investigation of each property is necessary, which is challenging to conduct solely through experimental approaches. In order to provide further support and deepen the understanding of our experimental observations, it is essential to systematically explore the relationship between H2 adsorption capacity and key properties such as pore width, pore volume, and functional group type. This can be accomplished through the application of GCMC simulations. By employing such simulations, we can gain valuable insights into the underlying mechanisms governing H2 adsorption behavior in our modified ACs.
3.3 Effect of pore size, pore volume, and surface chemistry obtained with GCMC
Firstly, we validated our simulations obtained with our in-house-program code for H2 adsorption on graphite surface at −195.80 and −196.15 °C obtained from experimental data.67,68 The graphite surface was modeled as an atomistic model with four graphene layers, which are enough number to form as a graphite (Fig. 11). We found that the simulated results agreed very well with experimental data for all studied temperatures. Therefore, our program code merits to be used for other cases such as adsorption in graphitic pores.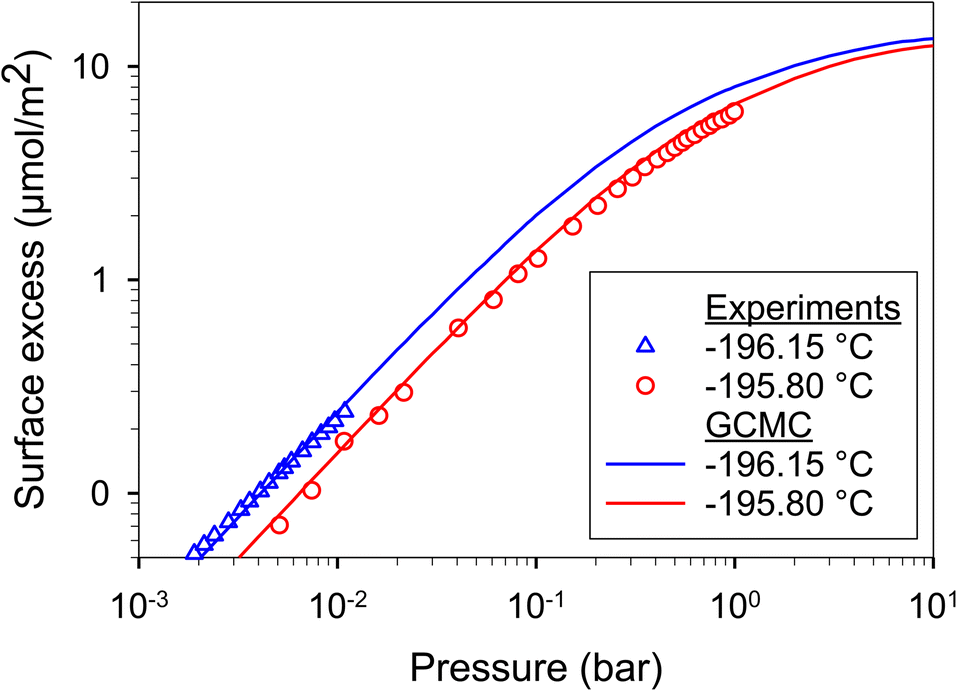 | ||
| Fig. 11 H2 adsorption on graphite surface at −196.15 and −195.80 °C obtained with GCMC (this work) and experimental data.67,68 | ||
In the case of adsorption in pores, the specific surface area of adsorbent models is constant while the pore volume increases with increasing pore width. The gravimetric capacity at various pressures and pore widths is presented in Fig. 12a and b. There were three features on the plot depending on pressure ranges at −196 °C (Fig. 12a). The first feature was at low pressures (<0.3 bar), where the optimum pore width was found at 0.65 nm, at which point the single monolayer was complete by adsorbate (see the local density distributions and snapshots in Fig. S1†). The second feature was found in the moderate pressure range (0.3–15 bar), where the highest capacity was found at pore widths of 0.95–1.5 nm depending on pressure. Therefore, for the first time, the optimum pore widths were plotted as a function of pressure as shown in Fig. 12c. The optimum pore width of 0.95 nm fitted a completely double monolayer, while the pore widths of 1.20–1.25 nm fitted a three-layer formation (Fig. S1†). Indeed, the superior pore sizes showed a range of 0.8–1.3 nm at a pressure of 1 bar (Fig. 12a). It should be noted that this pore-size range (0.8–1.3 nm) was enhanced in the modified ACs, especially N-AC900-1 and N-AC900-2, to achieve superior uptake at 1 bar. Noticeably, during these pressure ranges (low and moderate pressures), the larger pore volume did not give the greater H2 adsorption capacity. However, at higher pressures (>15 bar), the third feature indicated that pore volume plays a greater role in capacity rather than pore width. It should be noted in this case that the larger pore width had a higher gravimetric capacity than the smaller pore width because of the increased pore volume for enhanced packing.
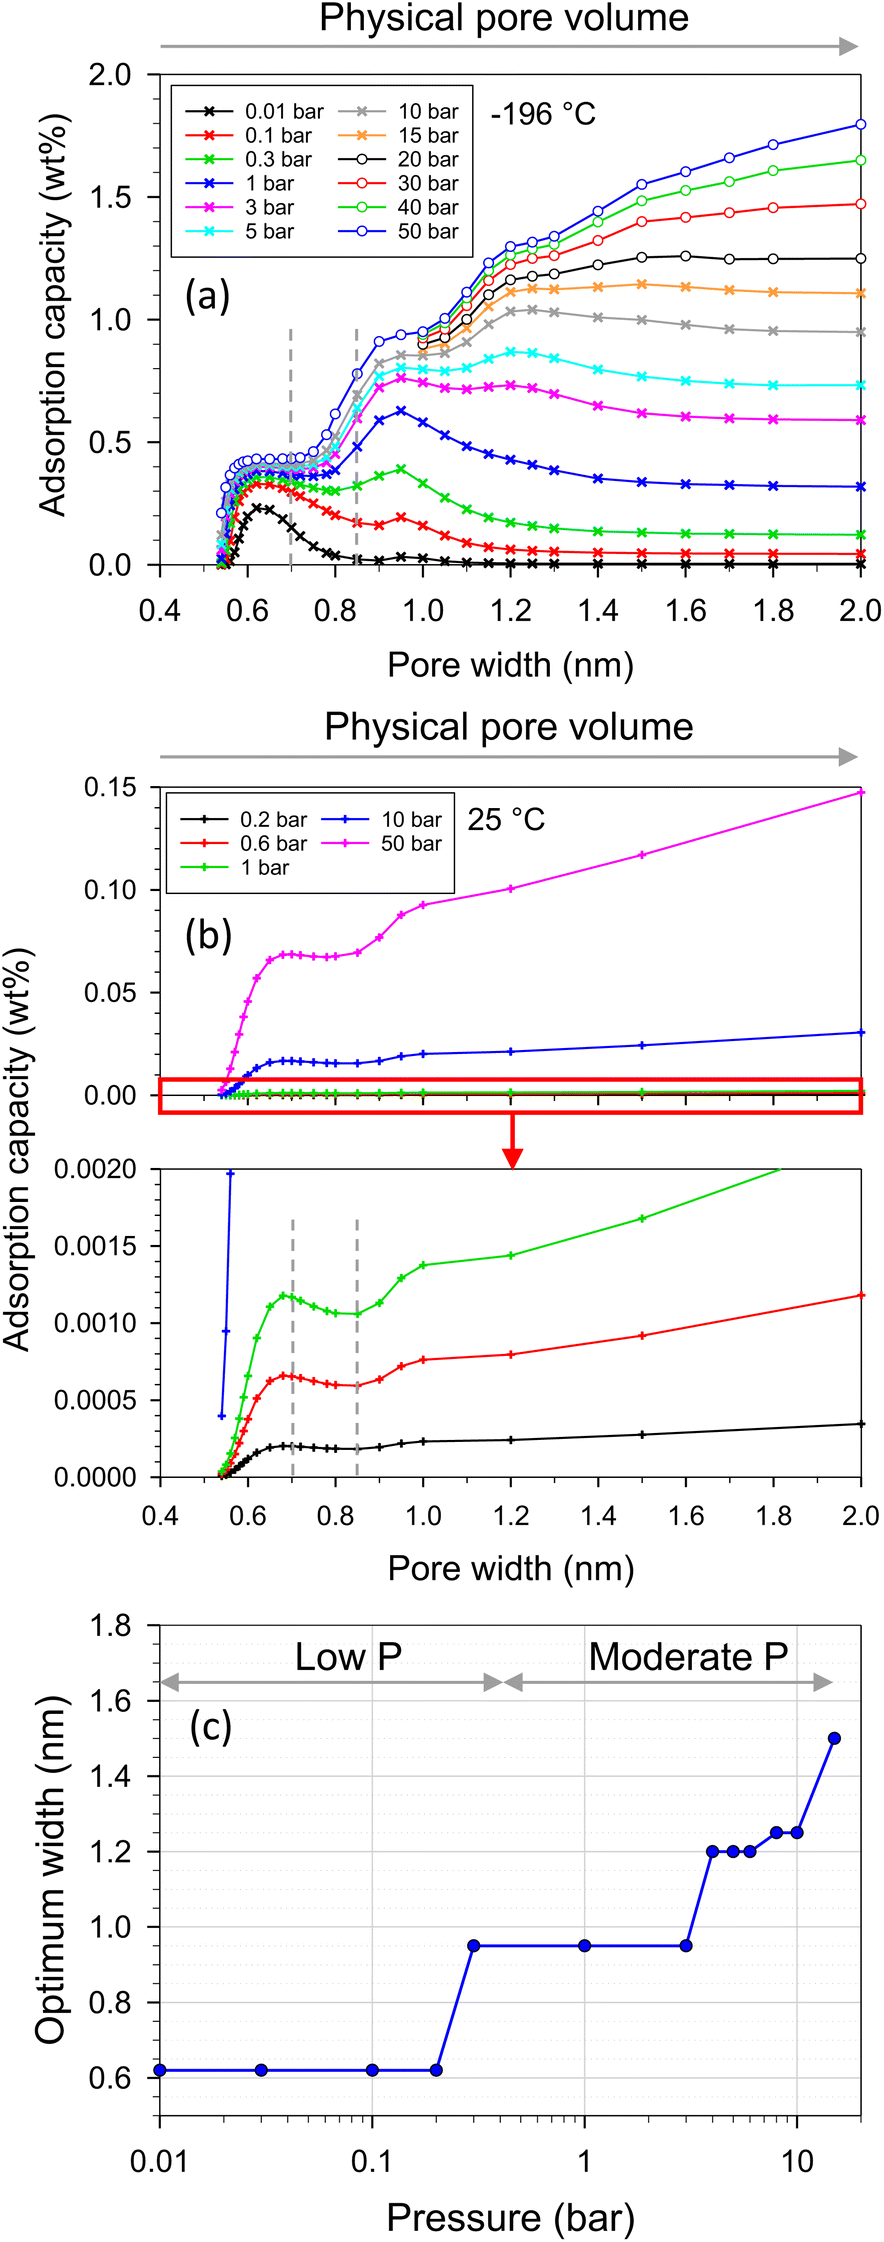 | ||
| Fig. 12 H2 adsorption capacity versus pore width and pore volume at (a) −196 and (b) 25 °C, (c) optimum width versus pressure at −196 °C obtained with GCMC. | ||
On the other hand, when temperature increased to 25 °C, the behavior on the plot (Fig. 12b) exhibited two features depending on the pore width ranges for all studied pressures (up to 50 bar): (i) during the pore width range up to 0.85 nm, the optimum width was found to be 0.68 nm, which was fit for a completely single monolayer. This optimum width was slightly larger than that of −196 °C because of the high energy of fluid motion at 25 °C. (ii) At a pore width larger than 0.85 nm, the H2 capacity increased with pore volume.
We put all the functional group types on the bottom wall to investigate the competition between each functional group type in the same pore. The adjacent groups were far enough from each other to be isolated, avoiding the dependent configuration between them. It should be noted that the adsorbate–adsorbent interaction directly influences the adsorbed amount in the pore. Adsorbate molecules began to adsorb at the strongest active site until it became saturated or completely covered by adsorbate molecules. The additional adsorbate molecules were then adsorbed on the less active site. The active sites could be either of optimum pore size or, having a surface functional group, or having a combination of these two properties. However, temperature is one of the main factors that plays an important role in adsorbed amount. The feature that was found between the original ACs versus the modified ACs in Fig. 9 could be described using the results plotted in Fig. 13. This resulted from the interplays between the characteristic properties of each adsorbent. For example, the pore size and pore volume of the modified N-AC900-2 (O/N doped) were greater than those of the original AC900 (O-doped). In Fig. 13, there were two solid models, including O-doped AC and O/N-doped AC. These two adsorbent models had different surface functional groups, pore sizes, and pore volumes. We modeled the O/N-doped AC with a larger pore width (0.85 nm) and larger pore volume to represent the modified ACs (e.g., N-AC900-2) compared to those values of the original ACs (e.g., AC900). The O-doped AC model representing AC900 had a smaller pore width (0.70 nm) and a smaller pore volume. Possibly, these pore widths were selected based on the pore size developed by the modification, as shown in Fig. 3b. The results showed that the H2 capacity at −196 °C obtained with O-doped AC was more concave and higher than that of O/N-doped AC at low pressures (region I). Because the pore size of the O-doped AC was dominated at low pressures rather than the pore size of the O/N-doped AC, the pore size of the O-doped AC was more effective and was stronger as an active site than its surface functional group, as confirmed by the heat contributions in Fig. 13. Similarly, during the adsorption at the pressure range, up to 1 bar was still the adsorption in region I at higher temperature of 25 °C, whereas the adsorption at −196 °C could proceed up to region II, where the H2 capacity in O/N-doped AC became higher than the O-doped AC. The O/N-doped AC with a pore width of 0.85 nm was superior and able to be accommodated with two-layer formation, whereas the smaller pore width of the O-doped AC could fit only a single monolayer, as shown by the local density distributions and snapshots in Fig. 14 and S2.† In region II, the isotherm at −196 °C of O-doped AC showed a plateau, indicating that the pore filling was almost complete. Therefore, our simulated results revealed the molecular origin of the macroscopic behavior, which is consistent with the observation in the experimental data (Fig. 9).
 | ||
| Fig. 13 Isotherms and isosteric heats of H2 adsorption in O/N-doped AC model (0.85 nm width) and O-doped AC model (0.70 nm width) at (a) −196 and (b) 25 °C obtained with GCMC. | ||
 | ||
| Fig. 14 Local density distributions in z-direction and snapshots of H2 adsorption in (a) O/N-doped AC model (0.85 nm width) and (b) O-doped AC model (0.70 nm width) at −196 °C. | ||
In addition, the heat contributions indicated particularly that Ox-N6 and COOH are about two times stronger than other groups. Among O groups, COOH has the strongest interaction with H2 because its number of sites is higher than that of other O groups. As a result, the potential can be classified in the order of Ox-N6 > COOH > N5 > COH > CO > NQ. To illustrate the effect of surface chemistry and to ignore the effect of pore width on the H2 adsorption capacity in different pressure ranges, the different functionalized surface models (O/N-doped versus O-doped) with the same pore width were simulated and compared as shown in Fig. S3.† The simulated results showed that the surface chemistry can control the H2 uptake only at low and moderate pressure ranges. Accordingly, H2 molecules were adsorbed in the functional groups at low pressures because of the strong FFn interactions until they become saturated by adsorbate molecules at a pressure of about 1.5 bar (these cases), where the FFn heat dramatically decreased to zero. When pressure was further increased, the adsorption behavior in these two solid models reached the same levels, followed by the same manner. However, according to the adsorbed amount changed with individual factors, pore size was the most factor while surface chemistry was the second factor during the effective pressures (up to 1.5 bar).
4. Conclusions
O and N co-doped AC were successfully synthesized by utilizing jujube branches, an agricultural waste, through a combination of heat and chemical treatments. In the synthesis process, urea was impregnated into the original AC as a nitrogen source, followed by activation using KOH heat treatment to transform it into an O and N co-doped AC. This modification not only enhanced the presence of N groups, but also resulted in the development and increase of superior pore sizes (0.8–1.3 nm), specific surface area, and pore volume. The modified AC, referred to as O and N co-doped AC, exhibited a remarkable enhancement in H2 adsorption capacity, reaching up to 2.62 wt% at −196 °C and 1 bar, surpassing the performance of several other ACs reported in the literature. In terms of application, the presence of superior pore sizes not only contributed to an increased H2 adsorption capacity, but also resulted in lower heat of adsorption, making it advantageous for cooling applications. Moreover, the modified O and N co-doped AC demonstrated a higher H2 storage capacity at −196 °C and a greater release of H2 from the pores at 25 °C and 1 bar compared to the original AC.To further investigate and support our experimental observations, we employed a GCMC approach. This allowed us to explore the influence of functional group type, pore width, and pore volume on the observed H2 adsorption behavior. Our GCMC simulations provided detailed insights into the heat contributions and molecular origin, thereby improving our understanding of the isotherms. At low pressures (<0.3 bar), an optimum pore width of 6.5 nm was identified, facilitating the completion of a single monolayer of adsorbate. In the moderate pressure range (0.3–15 bar), the highest capacity was observed at a pore width range of 0.95–1.5 nm depending on pressure. Notably, the modified AC with superior pore sizes in the range of 0.8–1.3 nm exhibited enhanced uptake at 1 bar. However, at higher pressures (>15 bar), the pore volume played a more significant role in determining the capacity rather than the pore width. Surface chemistry played a crucial role in H2 uptake at low and moderate pressures until saturation was reached by adsorbate molecules. The H2-functional group interaction followed the order of Ox-N6 > COOH > N5 > COH > CO > NQ within the same pore. Not only the superior pore sizes but also the Ox-N6 was likely enhanced on solid surface during the modification with temperature and time in our experimental works. Our simulated results demonstrated good agreement with experimental data and offered a potential strategy for enhancing pore size and surface chemistry to achieve superior H2 storage in porous carbons across a wide pressure range, including low, moderate, and high pressures.
Author contributions
Suphakorn Anuchitsakol: investigation, methodology, formal analysis, writing – original draft, visualization. Waralee Dilokekunakul: methodology, formal analysis, writing – original draft, visualization. Numphueng Khongtor: formal analysis, writing – review & editing, software, visualization. Somboon Chaemchuen: visualization, writing – review & editing. Nikom Klomkliang: investigation, methodology, formal analysis, resources, software, validation, writing – review & editing, supervision.Conflicts of interest
There are no conflicts to declare.Acknowledgements
This work was supported by Suranaree University of Technology (SUT) and by Thailand Science Research and Innovation (TSRI) (Full-time61/05/2565). The authors acknowledge National e-Science Infrastructure Consortium for providing computing resources that have contributed to the research results reported within this paper.References
- BP, bp Energy Outlook 2023 edition, https://www.bp.com/content/dam/bp/business-sites/en/global/corporate/pdfs/energy-economics/energy-outlook/bp-energy-outlook-2023.pdf, accessed Jun 20, 2023 Search PubMed.
- C. D. Thomas, A. Cameron, R. E. Green, M. Bakkenes, L. J. Beaumont, Y. C. Collingham, B. F. N. Erasmus, M. F. de Siqueira, A. Grainger, L. Hannah, L. Hughes, B. Huntley, A. S. van Jaarsveld, G. F. Midgley, L. Miles, M. A. Ortega-Huerta, A. Townsend Peterson, O. L. Phillips and S. E. Williams, Extinction risk from climate change, Nature, 2004, 427, 145–148 CrossRef CAS.
- G.-R. Walther, E. Post, P. Convey, A. Menzel, C. Parmesan, T. J. C. Beebee, J.-M. Fromentin, O. Hoegh-Guldberg and F. Bairlein, Ecological responses to recent climate change, Nature, 2002, 416, 389–395 CrossRef CAS PubMed.
- G. Nazir, A. Rehman, S. Hussain, S. Aftab, K. Heo, D. M. Ikram, D. S. Patil and M. A. Ud Din, Recent advances and reliable assessment of solid-state materials for hydrogen storage: a step forward toward a sustainable H2 economy, Adv. Sustainable Syst., 2022, 6, 2200276 CrossRef CAS.
- O. Czakkel, B. Nagy, G. Dobos, P. Fouquet, E. Bahn and K. László, Static and dynamic studies of hydrogen adsorption on nanoporous carbon gels, Int. J. Hydrogen Energy, 2019, 44, 18169–18178 CrossRef CAS.
- Y. Xia, Z. Yang and Y. Zhu, Porous carbon-based materials for hydrogen storage: advancement and challenges, J. Mater. Chem. A, 2013, 1, 9365–9381 RSC.
- Y.-J. Heo and S.-J. Park, Synthesis of activated carbon derived from rice husks for improving hydrogen storage capacity, J. Ind. Eng. Chem., 2015, 31, 330–334 CrossRef CAS.
- I. Wróbel-Iwaniec, N. Díez and G. Gryglewicz, Chitosan-based highly activated carbons for hydrogen storage, Int. J. Hydrogen Energy, 2015, 40, 5788–5796 CrossRef.
- T. Kopac, Y. Kırca and A. Toprak, Synthesis and characterization of KOH/boron modified activated carbons from coal and their hydrogen sorption characteristics, Int. J. Hydrogen Energy, 2017, 42, 23606–23616 CrossRef CAS.
- C.-C. Huang, H.-M. Chen and C.-H. Chen, Hydrogen adsorption on modified activated carbon, Int. J. Hydrogen Energy, 2010, 35, 2777–2780 CrossRef CAS.
- H. Zhang, Y. Zheng and Y. Cui, Melamine assisted preparation of nitrogen doped activated carbon from sustainable biomass for H2 and CO2 storage, Int. J. Hydrogen Energy, 2023, 48, 17914–17922 CrossRef CAS.
- E. De Rose, S. Bartucci, C. P. Bonaventura, G. Conte, R. G. Agostino and A. Policicchio, Effects of activation temperature and time on porosity features of activated carbons derived from lemon peel and preliminary hydrogen adsorption tests, Colloids Surf., A, 2023, 672, 131727 CrossRef CAS.
- A. Toprak, Production and characterization of microporous activated carbon from cherry laurel (Prunus laurocrasus L.) stone: application of H2 and CH4 adsorption, Biomass Convers. Biorefin., 2020, 10, 977–986 CrossRef CAS.
- G. Nazir, A. Rehman, S. Hussain, A. M. Afzal, G. Dastgeer, M. A. Rehman, Z. Akhter, T. I. Al-Muhimeed and A. A. AlObaid, Heteroatoms-doped hierarchical porous carbons: multifunctional materials for effective methylene blue removal and cryogenic hydrogen storage, Colloids Surf., A, 2021, 630, 127554 CrossRef CAS.
- H. W. Langmi, J. Ren, B. North, M. Mathe and D. Bessarabov, Hydrogen storage in metal-organic frameworks: a review, Electrochim. Acta, 2014, 128, 368–392 CrossRef CAS.
- N. M. Musyoka, J. Ren, H. W. Langmi, B. C. North, M. Mathe and D. Bessarabov, Synthesis of rGO/Zr-MOF composite for hydrogen storage application, J. Alloys Compd., 2017, 724, 450–455 CrossRef CAS.
- S.-Y. Lee and S.-J. Park, Effect of platinum doping of activated carbon on hydrogen storage behaviors of metal-organic frameworks-5, Int. J. Hydrogen Energy, 2011, 36, 8381–8387 CrossRef CAS.
- Z. W. Zhu and Q. R. Zheng, Investigation of cryo-adsorption hydrogen storage capacity of rapidly synthesized MOF-5 by mechanochemical method, Int. J. Hydrogen Energy, 2023, 48, 5166–5174 CrossRef CAS.
- K. S. Deeg, J. J. Gutiérrez-Sevillano, R. Bueno-Pérez, J. B. Parra, C. O. Ania, M. Doblaré and S. Calero, Insights on the molecular mechanisms of hydrogen adsorption in zeolites, J. Phys. Chem. C, 2013, 117, 14374–14380 CrossRef CAS.
- Z. Yang, Q. Jia, B. Chen, X. Gou, Y. Zhu and Y. Xia, Hydrogen adsorption properties of in situ synthesized Pt-decorated porous carbons templated from zeolite EMC-2, Int. J. Hydrogen Energy, 2020, 45, 25086–25095 CrossRef CAS.
- S. Kumar, R. Bera, N. Das and J. Koh, Chitosan-based zeolite-Y and ZSM-5 porous biocomposites for H2 and CO2 storage, Carbohydr. Polym., 2020, 232, 115808 CrossRef CAS PubMed.
- X. Wang, H. Cheng, G. Ye, J. Fan, F. Yao, Y. Wang, Y. Jiao, W. Zhu, H. Huang and D. Ye, Key factors and primary modification methods of activated carbon and their application in adsorption of carbon-based gases: a review, Chemosphere, 2022, 287, 131995 CrossRef CAS.
- M. Mohan, V. K. Sharma, E. A. Kumar and V. Gayathri, Hydrogen storage in carbon materials—a review, Energy Storage, 2019, 1, e35 CrossRef CAS.
- Y. Maneewong, S. Chaemchuen, F. Verpoort and N. Klomkliang, Paracetamol removal from water using N-doped activated carbon derived from coconut shell: kinetics, equilibrium, cost analysis, heat contributions, and molecular-level insight, Chem. Eng. Res. Des., 2022, 185, 163–175 CrossRef CAS.
- K. Mainali, S. H. Mood, M. R. Pelaez-Samaniego, V. Sierra-Jimenez and M. Garcia-Perez, Production and applications of N-doped carbons from bioresources: a review, Catal. Today, 2023, 423, 114248 CrossRef CAS.
- D. R. Lobato-Peralta, E. Duque-Brito, A. Ayala-Cortés, D. M. Arias, A. Longoria, A. K. Cuentas-Gallegos, P. J. Sebastian and P. U. Okoye, Advances in activated carbon modification, surface heteroatom configuration, reactor strategies, and regeneration methods for enhanced wastewater treatment, J. Environ. Chem. Eng., 2021, 9, 105626 CrossRef CAS.
- D. Saha and M. J. Kienbaum, Role of oxygen, nitrogen and sulfur functionalities on the surface of nanoporous carbons in CO2 adsorption: a critical review, Microporous Mesoporous Mater., 2019, 287, 29–55 CrossRef CAS.
- T. K. Das, S. Banerjee, P. Sharma, V. Sudarsan and P. U. Sastry, Nitrogen doped porous carbon derived from EDTA: effect of pores on hydrogen storage properties, Int. J. Hydrogen Energy, 2018, 43, 8385–8394 CrossRef CAS.
- J. Huang, Y. Liang, H. Dong, H. Hu, P. Yu, L. Peng, M. Zheng, Y. Xiao and Y. Liu, Revealing contribution of pore size to high hydrogen storage capacity, Int. J. Hydrogen Energy, 2018, 43, 18077–18082 CrossRef CAS.
- E. Masika and R. Mokaya, Hydrogen storage in high surface area carbons with identical surface areas but different pore sizes: direct demonstration of the effects of pore size, J. Phys. Chem. C, 2012, 116, 25734–25740 CrossRef CAS.
- M. Sevilla, R. Mokaya and A. B. Fuertes, Ultrahigh surface area polypyrrole-based carbons with superior performance for hydrogen storage, Energy Environ. Sci., 2011, 4, 2930–2936 RSC.
- A. Rehman, G. Nazir, K. Heo, S. Hussain, M. Ikram, Q. Mahmood, T. Alshahrani and H. S. M. Abd-Rabboh, Single step strategy to prepare highly microporous carbons derived from melamine and terephthalaldehyde for high-performance material-based hydrogen storage, J. Energy Storage, 2023, 66, 107468 CrossRef.
- Y. Gogotsi, C. Portet, S. Osswald, J. M. Simmons, T. Yildirim, G. Laudisio and J. E. Fischer, Importance of pore size in high-pressure hydrogen storage by porous carbons, Int. J. Hydrogen Energy, 2009, 34, 6314–6319 CrossRef CAS.
- C. Zhang, Z. Geng, M. Cai, J. Zhang, X. Liu, H. Xin and J. Ma, Microstructure regulation of super activated carbon from biomass source corncob with enhanced hydrogen uptake, Int. J. Hydrogen Energy, 2013, 38, 9243–9250 CrossRef CAS.
- W. Zhao, V. Fierro, N. Fernández-Huerta, M. T. Izquierdo and A. Celzard, Hydrogen uptake of high surface area-activated carbons doped with nitrogen, Int. J. Hydrogen Energy, 2013, 38, 10453–10460 CrossRef CAS.
- M. Sevilla, A. B. Fuertes and R. Mokaya, Preparation and hydrogen storage capacity of highly porous activated carbon materials derived from polythiophene, Int. J. Hydrogen Energy, 2011, 36, 15658–15663 CrossRef CAS.
- M. Sevilla, R. Foulston and R. Mokaya, Superactivated carbide-derived carbons with high hydrogen storage capacity, Energy Environ. Sci., 2010, 3, 223–227 RSC.
- L. S. Blankenship, N. Balahmar and R. Mokaya, Oxygen-rich microporous carbons with exceptional hydrogen storage capacity, Nat. Commun., 2017, 8, 1545 CrossRef.
- A. Morandé, P. Lillo, E. Blanco, C. Pazo, A. B. Dongil, X. Zarate, M. Saavedra-Torres, E. Schott, R. Canales, A. Videla and N. Escalona, Modification of a commercial activated carbon with nitrogen and boron: hydrogen storage application, J. Energy Storage, 2023, 64, 107193 CrossRef.
- R. Mishra, P. R. Prasad, P. Panda and S. Barman, Highly porous activated N-doped carbon as an ideal electrode material for capacitive energy storage and physisorption of H2, CO2, and CH4, Energy Fuels, 2021, 35, 14177–14187 CrossRef CAS.
- M. Sevilla, A. B. Fuertes and R. Mokaya, High density hydrogen storage in superactivated carbons from hydrothermally carbonized renewable organic materials, Energy Environ. Sci., 2011, 4, 1400–1410 RSC.
- A. Gotzias, E. Tylianakis, G. Froudakis and T. Steriotis, Theoretical study of hydrogen adsorption in oxygen functionalized carbon slit pores, Microporous Mesoporous Mater., 2012, 154, 38–44 CrossRef CAS.
- D. Caviedes and I. Cabria, Grand canonical Monte Carlo simulations of the hydrogen storage capacities of slit-shaped pores, nanotubes and torusenes, Int. J. Hydrogen Energy, 2022, 47, 11916–11928 CrossRef CAS.
- S. Karki and S. N. Chakraborty, A Monte Carlo simulation study of hydrogen adsorption in slit-shaped pores, Microporous Mesoporous Mater., 2021, 317, 110970 CrossRef CAS.
- S. Karki and S. N. Chakraborty, Hydrogen adsorption in nanotube and cylindrical pore: a grand canonical Monte Carlo simulation study, Int. J. Hydrogen Energy, 2023, 48, 2731–2741 CrossRef CAS.
- N. Klomkliang, N. Khongtor, P. Phadungbut, S. Chaemchuen and D. Nicholson, Atomic heat contributions for carbon dioxide adsorption in IRMOF-1, Ind. Eng. Chem. Res., 2021, 60, 12650–12662 CrossRef CAS.
- P. Teerachawanwong, W. Dilokekunakul, P. Phadungbut, N. Klomkliang, S. Supasitmongkol, S. Chaemchuen and F. Verpoort, Insights into the heat contributions and mechanism of CO2 adsorption on metal–organic framework MIL-100 (Cr, Fe): experiments and molecular simulations, Fuel, 2023, 331, 125863 CrossRef CAS.
- M. Jorge, C. Schumacher and N. A. Seaton, Simulation study of the effect of the chemical heterogeneity of activated carbon on water adsorption, Langmuir, 2002, 18, 9296–9306 CrossRef CAS.
- P. Psarras, J. He and J. Wilcox, Effect of water on the CO2 adsorption capacity of amine-functionalized carbon sorbents, Ind. Eng. Chem. Res., 2017, 56, 6317–6325 CrossRef CAS.
- C. M. Tenney and C. M. Lastoskie, Molecular simulation of carbon dioxide adsorption in chemically and structurally heterogeneous porous carbons, Environ. Prog., 2006, 25, 343–354 CrossRef CAS.
- K. P. Travis and K. E. Gubbins, Transport diffusion of oxygen−nitrogen mixtures in graphite pores: a nonequilibrium molecular dynamics (NEMD) study, Langmuir, 1999, 15, 6050–6059 CrossRef CAS.
- W. A. Steele, The physical interaction of gases with crystalline solids: I. Gas-solid energies and properties of isolated adsorbed atoms, Surf. Sci., 1973, 36, 317–352 CrossRef CAS.
- E. Pantatosaki and G. K. Papadopoulos, On the computation of long-range interactions in fluids under confinement: application to pore systems with various types of spatial periodicity, J. Chem. Phys., 2007, 127, 164723 CrossRef.
- D. Nicholson and N. G. Parsonage, Computer Simulation and the Statistical Mechanics of Adsorption, Academic Press, London, 1982 Search PubMed.
- N. Klomkliang, D. D. Do and D. Nicholson, Effects of temperature, pore dimensions and adsorbate on the transition from pore blocking to cavitation in an ink-bottle pore, Chem. Eng. J., 2014, 239, 274–283 CrossRef CAS.
- N. Klomkliang, D. D. Do and D. Nicholson, Hysteresis loop and scanning curves for argon adsorbed in mesopore arrays composed of two cavities and three necks, J. Phys. Chem. C, 2015, 119, 9355–9363 CrossRef CAS.
- M. Aho, P. Kortelainen, J. Rantanen and V. Linna, Pyrolysis of peat studied by thermogravimetry and Fourier transform infrared spectroscopy, J. Anal. Appl. Pyrolysis, 1989, 15, 297–306 CrossRef.
- J. Simitzis and J. Sfyrakis, Pyrolysis of lignin biomass—novolac resin for the production of polymeric carbon adsorbents, J. Anal. Appl. Pyrolysis, 1993, 26, 37–52 CrossRef CAS.
- Q. Li, J. Yang, D. Feng, Z. Wu, Q. Wu, S. S. Park, C.-S. Ha and D. Zhao, Facile synthesis of porous carbon nitride spheres with hierarchical three-dimensional mesostructures for CO2 capture, Nano Res., 2010, 3, 632–642 CrossRef CAS.
- D. Lin-Vien, N. B. Colthup, W. G. Fateley and J. G. Grasselli, The Handbook of Infrared and Raman Characteristic Frequencies of Organic Molecules, Elsevier Science, 1991 Search PubMed.
- W. Zhao, L. Luo, T. Chen, Z. Li, Z. Zhang, H. Wang, J. Rao, L. Feo and M. Fan, Synthesis and characterization of Pt-N-doped activated biocarbon composites for hydrogen storage, Composites, Part B, 2019, 161, 464–472 CrossRef CAS.
- Z. Weigang, Hydrothermal doping of nitrogen in bamboo-based super activated carbon for hydrogen storage, Bioresources, 2017, 12, 6237–6250 Search PubMed.
- Z. Wang, L. Sun, F. Xu, H. Zhou, X. Peng, D. Sun, J. Wang and Y. Du, Nitrogen-doped porous carbons with high performance for hydrogen storage, Int. J. Hydrogen Energy, 2016, 41, 8489–8497 CrossRef CAS.
- N. Bader and O. Abdelmottaleb, CO2 activation of olive bagasse for hydrogen storage, Environ. Prog. Sustainable Energy, 2017, 36, 315–324 CrossRef CAS.
- S. H. Md Arshad, N. Ngadi, A. A. Aziz, N. S. Amin, M. Jusoh and S. Wong, Preparation of activated carbon from empty fruit bunch for hydrogen storage, J. Energy Storage, 2016, 8, 257–261 CrossRef.
- N. T. Mandoki, J. Dentzer, T. Piquero, S. Saadallah, P. David and C. Vix-Guterl, Hydrogen storage in activated carbon materials: role of the nanoporous texture, Carbon, 2004, 42, 2744–2747 CrossRef.
- E. Ustinov, H. Tanaka and M. Miyahara, Low-temperature hydrogen-graphite system revisited: experimental study and Monte Carlo simulation, J. Chem. Phys., 2019, 151, 024704 CrossRef PubMed.
- Z. W. Zhu, Q. R. Zheng, Z. H. Wang, Z. Tang and W. Chen, Hydrogen adsorption on graphene sheets and nonporous graphitized thermal carbon black at low surface coverage, Int. J. Hydrogen Energy, 2017, 42, 18465–18472 CrossRef CAS.
Footnote |
| † Electronic supplementary information (ESI) available. See DOI: https://doi.org/10.1039/d3ra06720c |
| This journal is © The Royal Society of Chemistry 2023 |