 Open Access Article
Enhanced activity of Co–Mo–S catalysts towards hydrodesulfurization and hydrogen evolution reaction via NaBH4 assisted formation†
Huandi Houa,
Ting Wanga,
Baohuan Wangb,
Wenting Guob,
Xiang Miaob and
Xin Liang *b
*b
aSinopec Research Institute of Petroleum Processing Co., Ltd, China
bBeijing University of Chemical Technology, China. E-mail: liangxin@mail.buct.edu.cn
First published on 7th December 2023
Abstract
Co–Mo–S based catalysts have promising applications in both the hydrogen evolution reaction (HER) and hydrodesulfurization (HDS). Herein, Co–Mo–S catalyst and Co–Mo–S catalyst with and without NaBH4 modification have been successfully synthesized by a simple hydrothermal synthesis method. Co–Mo–S catalysts with NaBH4 modification show better catalytic activity towards both HDS and the HER. The phase purity, morphology, crystal structures and electron valence distribution of the catalysts with and without NaBH4 modification were studied by experimental characterizations and theoretical calculations. The catalysts without NaBH4 modification are mostly 2H-MoS2, while the catalysts without NaBH4 modification have 1T-MoS2, and 1T-MoS2 is exposed to more active sites, which will be conducive to the results of HDS performance of the catalyst. DFT calculations investigated the required activation energies of 1T-MoS2 and 2H-MoS2 for HDS and HER, respectively. The activation energy required for both HDS and H2 generation of 1T-MoS2 is significantly lower than that for the 2H-MoS2 structure.
1 Introduction
In the field of clean energy, hydrogen energy is known as one of the most important clean energies for the future.1 The hydrogen evolution reaction (HER) through acidic water splitting is a main part of modern clean energy technology.2–8 Meanwhile, increasingly severe environmental regulations of the oil purification in transport fuels worldwide have led to hydrodesulfurization (HDS) being an integral part in the petroleum refining industry.9,10 The Co–Mo–S catalyst is a widely industrialized HDS catalyst, while MoS2 and metal-doped MoS2 catalysts have potential as hydrogen evolution catalysts for their low-cost, near zero Gibbs free energy of hydrogen adsorption, and they are noncorrosive.11–18 Considering that HDS and HER involve hydrogenation and dehydrogenation processes, which are inverse reactions, the activity and correlation of Co–Mo–S based catalysts between these two reactions are worthy of in-depth investigation.19,20It has been found that the size, morphology and structure of MoS2 have a certain correlation with its catalytic activity.21,22 Studies have shown that the Co promotes MoS2 based catalysts which have high performance for HER, are also active for HDS.23 The incorporation of Co atoms take place at the edges and modifies the S–metal bond energy, leading to a reduction of the S coverage on the active metal sites that weakens the Hads binding energy.24 For HDS, the adsorption of thiophene on the newly formed Co–Mo–S edge increased with the addition of Co, and the energy barrier of the hydrogenation step decreased significantly, which significantly increased the hydrogenation capacity of Co–Mo–S catalyst.25 Modulating the structure of Co–Mo–S catalyst active sites, such as sulfur vacancies and Co coverage, is an effective way to regulate catalyst performance.26,27 Thus, regulating the active sites and carrying out theoretical research on the catalytic mechanisms of Co–Mo–S catalysts for HDS and HER reactions can help people gain a deeper understanding of the regulation and optimization mechanisms of catalysts, thereby developing superior catalysts with excellent performance.
NaBH4 modification can release hydrogen during the synthesis process of the catalyst, effectively regulate the sulfur vacancies and the valence state and active site structure of metal elements on the catalyst surface, thereby affecting the performance of the catalyst. NaBH4 modification might be a powerful way to enhance the performance of the catalysts.28 Therefore, systematic researches on the regulation mechanism of NaBH4 modification on Co–Mo–S catalysts over HDS and HER were carried out.
Herein, Co–Mo–S catalyst with and without NaBH4 modification were successfully synthesized through a simple hydrothermal synthesis method. The effect of NaBH4 modifications on the catalysts towards HDS and HER were carefully studied. Experimental evidence shows that NaBH4 modification is beneficial for generating more active species and achieving better catalytic activity. Theoretical calculations were conducted to investigate the HDS and HER reaction mechanisms on the Co–Mo–S catalyst. Catalysts with NaBH4 modifications has lower Gibbs free energy of hydrogen adsorption and C–S bond breaking energy.
2 Experimental section
2.1 Materials
Cobaltous nitrate hexahydrate (Co(NO3)2·6H2O), ammonium molybdate tetrahydrate ((NH4)6Mo7O24·4H2O), tetranap and thiocarbamide (CH4N2S)were purchased from Shanghai Macklin Biochemical Co.,Ltd. Sodium borohydride (NaBH4) and n-Heptane (C7H16) were purchased from Shanghai Aladdin Biochemical Technology Co., Ltd. Deionized water (H2O) was received from Beijing University of Chemical Technology. All chemical reagents were commercially available and used as received without further purification.2.2 Preparation of Co–Mo–S catalyst with and without NaBH4 modification
For the preparation of Co–Mo–S catalyst without NaBH4 modification, catalysts was synthesized using a simple hydrothermal synthesis method. 2.472 g ammonium molybdate tetrahydrate, 3 g thiocarbamide and 815 mg cobaltous nitrate hexahydrate were dissolved in 60 mL of deionized water to form a solution, then, the mixed solution was transferred to a 100 mL Teflon-lined static reactor. After stirred for 30 min at room temperature, it was heated to 200 °C and maintained for 8 h. After cooling to room temperature, the products were collected and washed by deionized water for several times. Finally, the products were dried at 80 °C overnight to obtain Co–Mo–S catalyst. The catalyst was named as Co–Mo–S.For the preparation of Co–Mo–S catalyst with NaBH4 modification, 10.6 mg sodium borohydride was added in the mixed solution of cobalt nitrate hexahydrate, ammonium molybdate tetrahydrate, and thiocarbamide. The mixture was stirred for another 10 minutes. Then, it was heated to 200 °C and maintained for 8 h. After cooling to room temperature, the products were collected and washed by deionized water for several times. Finally, the products were dried at 80 °C overnight to obtain Co–Mo–S catalyst with NaBH4 modification. The catalyst was named as Co–Mo–S (NaBH4).
2.3 Characterization
The X-ray diffraction (XRD) patterns using an X-ray diffractometer (D/max-2500/PC) with Cu Kα radiation (l ¼ 0.154 nm). The morphology and structure of the samples were observed by transmission electron microscopy (TEM, HT7700, Hitachi Limited). The high-resolution transmission electron microscope (HRTEM) and energy dispersive spectrometry (EDS) mapping were obtained by JEOL JEM-2010F having an accelerating voltage of 200 kV. X-ray photoelectron spectra (XPS) was acquired on a Themo Fisher ESCALAB 250Xi analyzer equipped with the excitation source of a monochromatic Al Kα. The Raman spectra were tested on the LabRAM HR Evolution with an Ar laser at a wavelength of 633 nm. The BET surface area was tested using the nitrogen gas adsorption–desorption method (ASAP 2020 HD88) at 77 K.2.4 Catalyst activity evaluation
HER performance was measured in a rotating disk electrode (Pine Research Instrumentation) by a CHI 760 E electrochemical workstation (CH Instruments, Inc., Shanghai, China) at a speed of 1600 rpm. 5 mg of as-prepared sample was dispersed in a mixed solution (1 mL of ethanol and 20 μL of Nafifion solution (5 wt%)). Then the ink was sonicated into homogeneous dispersion. Next 10 μL of catalyst ink was dropped onto the glassy carbon electrode (GCE, diameter: 8 mm). Saturated calomel electrode (SCE) and graphite rod were used as reference electrode and counter electrode respectively. The stable polarization curve was obtained after 40 cycles of scanning. The linear scanning voltammetry curve (LSV) was measured in 0.5 M H2SO4 solution by scanning rate of 5 mV s−1.For the evaluation of HDS reaction, a mixture of 250 mg g−1 thiophene and n-heptane was used as residue simulation oil. According to literature reports and previous studies, the performance of catalyst HDS is related to many factors. Such as: temperature, drug dosage, reaction time and so on. The effects of reaction time, reaction temperature and dosage of NaBH4 on the properties of thiophene HDS were investigated.
Catalytic activity was evaluated by thiophene conversion (amount of reacted thiophene):
 | (1) |
2.5 DFT calculations
In this research, a 4 × 4 molybdenum disulfide cycle model was established, and a 15 A vacuum layer was constructed in the Z-axis direction. The plane wave pseudo-method based on density functional theory is used to simulate the MoS2 periodic model with VASP calculation software. In the simulation, the generalized gradient approximation PBE functional is used as the exchange correlation energy. Within the MoS2 cell, all atoms except the edge atoms are fixed, while the edge atoms are set to complete relaxation. Taking 10−5 eV as the energy convergence accuracy of A single atom, and the upper limit of the interatomic interaction force is set to 0.02 eV A−1, the Monkhorst–Pack automatic generation method is set as the K-point sampling of Brillouin region integration, and performs electronic autonomous calculation on the K-point grid of 2 × 2 × 1. The plane wave truncation energy is set to 400 eV. The climbing image nudged elastic band method were employed to find the transition state. Then, Co atoms were used to replace 50% Mo atoms at the S-edge edge of MoS2 model, and the difference between HDS and HER of 1T and 2H crystal was calculated and compared.The adsorption energy (Eads) is defined as the difference between the total energy of the interacting (adsorbate + surface) system and that of the bare surface and isolated adsorbate in gas phase as shown in eqn (2). Energy barriers are calculated as the energy difference between the corresponding transition states and initial states.
| Eads = E(adsorbate/slab) − E(adsorbate) − E(slab) | (2) |
3 Results and discussion
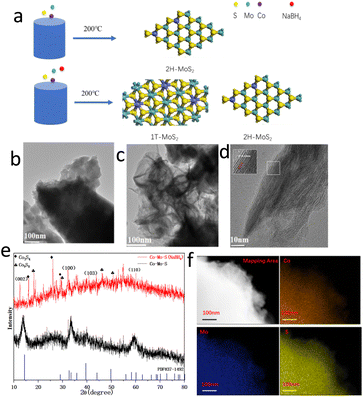
Fig. 1a illustrates the synthesis procedures of Co–Mo–S catalyst. Firstly, the cobaltous nitrate hexahydrate and ammonium molybdate tetrahydrate as metal sources. Thiocarbamide as S sources and deionized water as solvent, sodium borohydride as additives. Then, the Co–Mo–S catalyst nanosheet is formed with a hydrothermal reaction. The Mo/Co molar ratio was determined to 9.70![[thin space (1/6-em)]](https://www.rsc.org/images/entities/char_2009.gif) :
:![[thin space (1/6-em)]](https://www.rsc.org/images/entities/char_2009.gif) 1 and 9.67
1 and 9.67![[thin space (1/6-em)]](https://www.rsc.org/images/entities/char_2009.gif) :
:![[thin space (1/6-em)]](https://www.rsc.org/images/entities/char_2009.gif) 1 for Co–Mo–S (NaBH4) and Co–Mo–S catalysts by ICP-MS, respectively, which are close to the feed ratio. Fig. 1b and c show the transmission electron microscopy (TEM) images of Co–Mo–S and Co–Mo–S (NaBH4) catalysts. The Co–Mo–S catalyst was in the shape of nanosheets, while the Co–Mo–S (NaBH4) catalyst was in the shape of more irregular and thinner nanosheets. This may be because the addition of sodium borohydride is conducive to the formation of smaller nanosheets and the increase of the catalyst active sites. Co–Mo–S (NaBH4) and Co–Mo–S catalysts shows the BET specific surface areas of 8.668 and 1.214 m2 g−1, respectively (Fig. S1 and Table S1†), indicating that the NaBH4 modification method can effectively increase the specific surface area of the catalysts, thereby exposing more active sites. The high resolution TEM (HRTEM) image of Co–Mo–S (NaBH4) shows a lattice fringe spacing of 0.64 nm (Fig. 1d), which is slightly bigger than the lattice fringe spacing 0.62 nm of MoS2.29 X-ray diffraction (XRD) patterns in Fig. 1e show that XRD diffraction peak position of Co–Mo–S and Co–Mo–S (NaBH4) are mainly consistent with that of standard MoS2 (JCPDS 37-1492). The XRD test results showed that besides MoS2 phase, Co9S8 crystal phase was formed for Co–Mo–S (NaBH4). According to relevant literature reports,30 Co9S8 is conducive to hydrogenation reaction and will play a synergistic role with Co–Mo–S activity. Meanwhile, the energy dispersive spectrometry (EDS) elemental mapping images of Co–Mo–S (NaBH4) nanosheets show that Co, Mo and S elements are uniformly dispersed in the catalyst (Fig. 1f). In addition, the complementary distribution of Co, Mo and S elements in the same region also indirectly proves the existence of Co–Mo–S active phase.
1 for Co–Mo–S (NaBH4) and Co–Mo–S catalysts by ICP-MS, respectively, which are close to the feed ratio. Fig. 1b and c show the transmission electron microscopy (TEM) images of Co–Mo–S and Co–Mo–S (NaBH4) catalysts. The Co–Mo–S catalyst was in the shape of nanosheets, while the Co–Mo–S (NaBH4) catalyst was in the shape of more irregular and thinner nanosheets. This may be because the addition of sodium borohydride is conducive to the formation of smaller nanosheets and the increase of the catalyst active sites. Co–Mo–S (NaBH4) and Co–Mo–S catalysts shows the BET specific surface areas of 8.668 and 1.214 m2 g−1, respectively (Fig. S1 and Table S1†), indicating that the NaBH4 modification method can effectively increase the specific surface area of the catalysts, thereby exposing more active sites. The high resolution TEM (HRTEM) image of Co–Mo–S (NaBH4) shows a lattice fringe spacing of 0.64 nm (Fig. 1d), which is slightly bigger than the lattice fringe spacing 0.62 nm of MoS2.29 X-ray diffraction (XRD) patterns in Fig. 1e show that XRD diffraction peak position of Co–Mo–S and Co–Mo–S (NaBH4) are mainly consistent with that of standard MoS2 (JCPDS 37-1492). The XRD test results showed that besides MoS2 phase, Co9S8 crystal phase was formed for Co–Mo–S (NaBH4). According to relevant literature reports,30 Co9S8 is conducive to hydrogenation reaction and will play a synergistic role with Co–Mo–S activity. Meanwhile, the energy dispersive spectrometry (EDS) elemental mapping images of Co–Mo–S (NaBH4) nanosheets show that Co, Mo and S elements are uniformly dispersed in the catalyst (Fig. 1f). In addition, the complementary distribution of Co, Mo and S elements in the same region also indirectly proves the existence of Co–Mo–S active phase.
In order to further determine the composition and structure of the Co–Mo–S and Co–Mo–S (NaBH4) catalyst, X-ray photoelectron spectroscopy (XPS) characterization and analysis are performed. XPS full spectrum shows that the presence of Co, Mo and S elements in the catalyst (Fig. 2a). Fig. 2b shows that the high-resolution spectrum of Mo 3d orbital has four different orbital peaks. The characteristic peaks of 229.5 eV and 232.5 eV in the Mo 3d orbital spectrogram correspond to the peaks of Mo4+, and the characteristic peaks at 233 eV and 236 eV correspond to Mo6+. It can be clearly seen that the peak strength of Co–Mo–S (NaBH4) catalyst becomes stronger at 232.5 eV than Co–Mo–S catalyst, which indicates that NaBH4 modification is beneficial to the formation of Mo4+. Fig. 2c shows that the high-resolution spectrum of S 2p orbital has two different orbital peaks. It can be shown that the Mo element exists mainly in the form of MoS2. Fig. 2d is the high-resolution spectrum of Co 2p, the characteristic peak locations at 781 eV and 798 eV are attributed to Co 2p3/2 (Co2+) and Co 2p1/2 (Co2+), respectively. It can be seen that the peak intensity at Co 2p1/2 and Co 2p3/2 corresponding to Co2+ of the Co–Mo–S (NaBH4) catalyst becomes stronger. Table S2† shows that the relative mass ratio of CoMoS activity content before and after modification is 19% and 22%, respectively. The calculation method is shown in S3.†
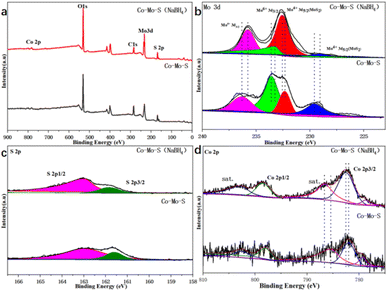 | ||
| Fig. 2 XPS spectrum of Co–Mo–S and Co–Mo–S (NaBH4) catalysts. (a) XPS full spectrum; (b) Mo 3d; (c) S 2p; (d) Co 2p. | ||
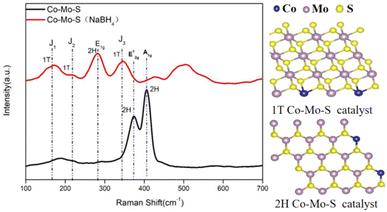
In order to further explore the structure of the catalyst before and after NaBH4 treatment, Raman characterization analysis of the catalyst was conducted. It is found that the main catalyst of cobalt molybdenum system synthesized by hydrothermal synthesis is 2H type MoS2. The peak at 375 cm−1 in the figure corresponds to the E12g vibration model of type 2H MoS2. The peak at 403 cm−1 corresponds to the A1g vibration model of 2H type MoS2, which proves the existence of 2H type MoS2 in Co–Mo–S catalyst. The peaks at 160 cm−1, 217 cm−1, 340 cm−1 correspond to 1T type MoS2, which indicates that Co–Mo–S (NaBH4) produces more 1T MoS2. According to the research results, 1T type MoS2 can expose more active sites than 2H type.31 The NaBH4 modification is favorable for generating more active 1T MoS2 (Fig. 3).
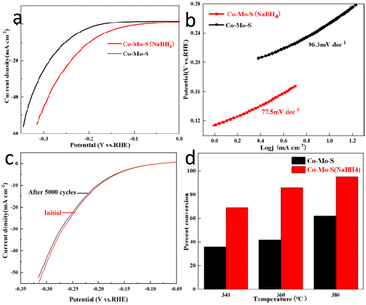
The HER performance of all catalysts is tested in a H2 saturated 0.5 M H2SO4 aqueous solution. Co–Mo–S and Co–Mo–S (NaBH4) nanosheet respectively were used as comparative samples. The linear sweep voltammetry (LSV) curve results show that Co–Mo–S (NaBH4) nanosheet exhibits the most excellent acidic HER activity compared to Co–Mo–S (Fig. 4a). Fig. 4b shows Tafel plots of acidic HER fo Co–Mo–S and Co–Mo–S (NaBH4). The Tafel slope of Co–Mo–S (NaBH4) nanosheet catalyst is 77.5 mV dec−1, which is signifificantly smaller than Co–Mo–S (96.3 mV dec−1). This indicates that the Co–Mo–S (NaBH4) nanosheet catalyst exhibits excellent reaction kinetics. In order to achieve a current density of 10 mA cm−2, the Co–Mo–S (NaBH4) nanosheet catalyst requires an overpotential of 200 mV, which is smaller than Co–Mo–S (256 mV) and most of the reported non-noble metal electrocatalysts. The double-layer capacitance of Co–Mo–S and Co–Mo–S (NaBH4) was measured to be 0.0012 mF cm−2 and 0.0052 mF cm−2, respectively (Fig. S2†). Fig. 4c shows that the overpotential of Co–Mo–S (NaBH4) catalyst only increases slightly after 5000 cycles, indicating the good stability of the catalysts for HER.
The conversion of thiophene was used as an evaluation index to evaluate the hydrodesulfurization (HDS) performance of the catalyst. Fig. 4d shows that the thiophene conversion over the Co–Mo–S (NaBH4) catalyst is higher than the conversion over Co–Mo–S catalysts at various temperatures, indicating the NaBH4 modification could effectively improve the HDS performance of Co–Mo–S catalysts. The results might be attributed to the facts that NaBH4 modification helps the generation of more 1T phase Co–Mo–S catalyst, and more active sites exposure. Fig. S3† shows the conversion of the catalyst to thiophene at different reaction time. The results showed that the catalyst maintained a high conversion rate to thiophene after 5 h reaction, indicating that the catalyst had excellent stability. TEM images (Fig. S4†) and XRD patterns (Fig. S5†) also revealed that the phase and morphology of catalysts have no significant change after HDS.
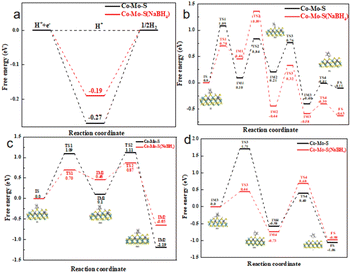
Density functional theory (DFT) calculations are used to further explore the different of Co–Mo–S (NaBH4) and Co–Mo–S on the HER and HDS performance. Fig. 5a shows the calculated energy diagram of adsorption of H* on different catalysts. In general, when the adsorption energy is too low, the adsorption of molecules is very difficult; When the adsorption energy is too high, desorption is very difficult. Therefore, the closer ΔG is to 0, the better the activity of HER. As can be seen from the figure, the ΔG of the 1T configuration is only −0.19 eV, which is closer to 0 than the ΔG of the 2H configuration (−0.27 eV). This suggests that HER is more likely to occur in the 1T configuration.32 This is consistent with the results of previous experiments.
The mechanism diagram of thiophene hydrodesulfurization reaction was listed in Fig. S6.† The calculated structures of the intermediates in the DDS pathway at the S edge are listed in Fig. S7,† the calculated potential energy diagram is shown in Fig. 5b. Firstly, thiophene IS adsorbed on the S vacancy (IS), and the adsorption energy of 1T configuration is −0.76 eV, while that of 2H configuration is −0.65 eV, indicating that thiophene molecules are more stable adsorbed on 1T configuration. Then the thiophene underwent the first hydrogenation reaction to produce 2-hydrothiophene (IM1). The DDS pathway is characterized by the C–S bond breaking reaction that occurs immediately upon the formation of 2-hydrothiophene, forming the CH2CHCHCHS (IM2) intermediate.33 Subsequently, CH2CHCHCHS was further hydrogenated to produce C4H5SH intermediate (IM3), while C–S bond was broken to produce butadiene, completing the DDS path. The results show that the reaction barrier of the rate-limiting step in the 2H configuration and the rate-limiting step in the 1T configuration are 1.09 eV and 0.76 eV respectively. We believe that thiophene is a favorable pathway for DDS reaction in the 1T configuration.34
The calculated structures of the intermediates in the HYD pathway at the S edge are listed in Fig. S8,† the calculated potential energy diagram is shown in Fig. 5c and d. The initial state of the reaction has the same reaction mechanism and energy barrier as the intermediate 2-hydrothiophene, but unlike the DDS path, 2-hydrothiophene will continue the hydrogenation step to produce 2,5-dihydrothiophene (IM2).35–37 Subsequently, the hydrogen atoms on the other pair of hydrogen atoms dissociate and adsorb on the original S atom to form the C4H6S (IM3) intermediate. Next, the 2,5-dihydrothiophene continues to hydrogenate new, while the C–S bond breaks to form the C4H7S intermediate (IM4). Finally, the C4H7S intermediate is further hydrogenated, C–S bond breaks to form 2-butene, and desorption from the catalyst completes the HYD process. By comparing the reaction energy barriers of the two different configurations, the reaction barrier of the rate-limiting step of the 2H configuration is 1.71 eV, and the reaction barrier of the rate-limiting step of the 1T configuration is 1.41 eV. We believe that thiophene is a favorable reaction path for HYD in the 1T configuration. This explains that the Co–Mo–S catalyst modified with sodium borohydride has better HDS performance, which is also consistent with the results of previous HDS experiments. The DOS and PDOS calculations of Co doping in the 1T-MoS2 configuration and the 2H-MoS2 configuration (Fig. S9†) show that Co doping 1T-MoS2 has the metal conductor property, and 2H-MoS2 still retains the semiconductor property. This also indicates that the 1T-configuration has excellent catalytic performance.
4 Conclusions
In a word, a facile NaBH4 modification approach was developed for the synthesis of Co–Mo–S catalysts with enhanced activity for both HER and HDS. The effect of NaBH4 modification was carefully investigated by both experiments and DFT calculations. The modified catalyst will produce more 1T-MoS2 configuration, expose more active sites, and it is also found that its specific surface area is increased. The results show that the activity of HER and HDS can be improved simultaneously by modifying the composition and morphology of the catalyst by NaBH4, which plays an important role in the research of high-performance HER and HDS catalysts.Author contributions
Conceptualization, Huandi Hou.; methodology, Ting Wang; investigation, Baohuan Wang; DFT calculation, Wenting Guo and Miao Xiang; supervision, Xin Liang.Conflicts of interest
There are no conflicts to declare.Acknowledgements
This work was supported by the China Petroleum & Chemical Corporation (S121049).Notes and references
- D. Liu, H. Ai, M. Chen, P. Zhou, B. Li, D. Liu, X. Du, K. Lo, K. Ng, S. Wang, S. Chen, G. Xing, J. Hu and H. Pan, Small, 2021, 17, 2007557 CrossRef CAS PubMed.
- Z. Chen, B. Xu, X. Yang, H. Zhang and C. Li, Int. J. Hydrogen Energy, 2019, 44, 5983 CrossRef CAS.
- L. Chen, Y. Li and X. Liang, Adv. Funct. Mater., 2021, 31, 2007344 CrossRef CAS.
- J. Wu, N. Han, S. Ning, T. Chen, C. Zhu, C. Pan, H. Wu, S. J. Pennycook and C. Guan, ACS Sustain. Chem. Eng., 2020, 8, 14825–14832 CrossRef CAS.
- L. Guo, X. Bai, H. Xue, J. Sun, T. Song, S. Zhang, L. Qin, K. Huang, F. He and Q. Wang, Chem. Commun., 2020, 56, 7702–7705 RSC.
- X. Wang, Y. Fei, W. Li, L. Yi, B. Feng, Y. Pan, W. Hu and C. M. Li, ACS Appl. Mater. Interfaces, 2020, 12, 16548–16556 CrossRef CAS PubMed.
- L. Chai, Z. Hu, X. Wang, Y. Xu, L. Zhang, T. T. Li, Y. Hu, J. Qian and S. Huang, Adv. Sci., 2020, 7, 1903195 CrossRef CAS PubMed.
- A. Han, X. Zhou, X. Wang, S. Liu, Q. Xiong, Q. Zhang, L. Gu, Z. Zhuang, W. Zhang, F. Li, D. Wang, L. Li and Y. Li, Nat. Commun., 2021, 12, 709 CrossRef CAS PubMed.
- P. Raybaud, J. Hafner, G. Kresse, S. Kasztelan and H. Toulhoat, J. Catal., 2000, 190, 128–143 CrossRef CAS.
- L. Zhang, X. Chen, Y. Chen, W. Li, K. Yang and C. Liang, Mol. Catal., 2022, 528, 112440 CrossRef CAS.
- G. Zhang, H. Liu, J. Qu and J. Li, Energy Environ. Sci., 2016, 9, 1190–1209 RSC.
- A. Q. Wang, K. Hu, Y. Liu, R. Li, C. Ye, Z. Yi and K. Yan, Int. J. Hydrogen Energy, 2019, 44, 6573–6581 CrossRef CAS.
- S. Chandrasekaran, T. Ma, Z. Hu, Q. Liu, C. Zhan, Y. Li, C. Bowen, H. Lu and Y. Liu, Appl. Catal., B, 2023, 338, 123007 CrossRef CAS.
- A. Shahroudi, M. Esfandiari and S. Habibzadeh, RSC Adv., 2022, 12, 29440–29468 RSC.
- S. Chandrasekaran, M. Khandelwal, F. Dayong, L. Sui, J. S. Chung, R. D. K. Misra, P. Yin, E. J. Kim, W. Kim, A. Vanchiappan, Y. Liu, S. H. Hur, H. Zhang and C. Bowen, Adv. Energy Mater., 2022, 12, 2200409 CrossRef CAS.
- S. Chandrasekaran, N. Li, Y. Zhuang, L. Sui, Z. Xiao, D. Fan, V. Aravindan, C. Bowen, H. Lu and Y. Liu, Chem. Eng. J., 2022, 431, 134073 CrossRef CAS.
- R. Ramachandran, T. Chen, P. Veerakumar, G. Anushya, S. Chen, R. Kannan, V. Mariyappan, S. Chitra, N. Ponmurugaraj and M. Boominathan, RSC Adv., 2022, 12, 28227–28244 RSC.
- H. L. Yan, X. Xiao, C. Y. Hu, X. H. Liu and Y. Song, Mol. Catal., 2023, 547, 113327 CrossRef CAS.
- A. Shimada, J. Jpn. Pet. Inst., 2016, 59, 46–58 CrossRef.
- M. Rana, S. Ghosh, T. Nshizirungu and J. Park, RSC Adv., 2023, 13, 30022–30039 RSC.
- Y. T. Luo, S. Q. Zhang, H. Y. Pan, S. J. Xiao, Z. L. Guo, L. Tang, U. Khan, B. F. Ding, M. Li, Z. Y. Cai, Y. Zhao, W. Lv, Q. L. Feng, X. L. Zou, J. H. Lin, H. M. Cheng and B. L. Liu, ACS Nano, 2020, 14, 767–776 CrossRef CAS PubMed.
- Y. Yin, J. Han, Y. Zhang, X. Zhang, P. Xu, Q. Yuan, L. Samad, X. Wang, Y. Wang, Z. Zhang, P. Zhang, X. Cao, B. Song and S. Jin, J. Am. Chem. Soc., 2016, 138, 7965–7972 CrossRef CAS PubMed.
- Y. Yu, G. Nam, Q. He, X. Wu, K. Zhang, Z. Yang, J. Chen, Q. Ma, M. Zhao, Z. Liu, F. Ran, X. Wang, H. Li, X. Huang, B. Li, Q. Xiong, Q. Zhang, Z. Liu, L. Gu, Y. Du, W. Huang and H. Zhang, Nat. Chem., 2018, 10, 638–643 CrossRef CAS PubMed.
- J. Zhang, X. Xu, L. Yang, D. Cheng and D. Cao, Small Methods, 2019, 3, 1900653 CrossRef CAS.
- P. G. Moses, B. Hinnemann, H. Topsoe and J. K. Norskov, J. Catal., 2007, 248, 188–203 CrossRef CAS.
- M. Saric, P. G. Moses and J. Rossmeisl, ChemCatChem, 2016, 8, 3334–3337 CrossRef CAS.
- J. Deng, H. Li, J. Xiao, Y. Tu, D. Deng, H. Yang, H. Tian, J. Li, P. Ren and X. Bao, Energy Environ. Sci., 2015, 8, 1594–1601 RSC.
- S. Liu, Q. Jin, Y. Xu, X. Fang, N. Liu, J. Zhang, X. Liang and B. Chen, Fuel, 2018, 232, 36–44 CrossRef CAS.
- M. Daage and R. R. Chianelli, J. Catal., 1994, 149, 414–427 CrossRef CAS.
- Y. Qi, Q. Xu, Y. Wang, B. Yan, Y. Ren and Z. Chen, ACS Nano, 2016, 10, 2903–2909 CrossRef CAS PubMed.
- M. A. Lukowski, A. S. Daniel, F. Meng, A. Forticaux, L. Li and S. Jin, J. Am. Chem. Soc., 2013, 135, 10274–10277 CrossRef CAS PubMed.
- J. Deng, P. J. Ren, D. H. Deng, L. Yu, F. Yang and X. H. Bao, Energy Environ. Sci., 2014, 7, 1919–1923 RSC.
- M. Saric, J. Rossmeisl and P. G. Moses, J. Catal., 2018, 358, 131–140 CrossRef CAS.
- M. Zheng, L. Zhao, L. Y. Cao, C. Y. Zhang, J. S. Gao and C. M. Xu, Mol. Catal., 2019, 467, 38–51 CrossRef CAS.
- C. Zhang, B. Liu, Y. Wang, L. Zhao, J. Zhang, Q. Zhong, J. Gao and C. Xu, RSC Adv., 2017, 7, 11862–11871 RSC.
- S. Rangarajan and M. Mavrikakis, ACS Catal., 2016, 6, 2904–2917 CrossRef CAS.
- E. Krebs, B. Silvi, A. Daudin and P. Raybaud, J. Catal., 2008, 260, 276–287 CrossRef CAS.
Footnote |
| † Electronic supplementary information (ESI) available: CV curve and double-layer capacitance test diagram, and BET results of the catalysts, calculated structures of the intermediates for DFT calculations. See DOI: https://doi.org/10.1039/d3ra06824b |
| This journal is © The Royal Society of Chemistry 2023 |

